Case Report

A Comprehensive Evaluation of Electricity Planning Models in Egypt: Optimization versus Agent-Based Approaches

by
Mostafa Shaaban
1,2,*,
Jürgen Scheffran
2,
Mohamed Salah Elsobki
3 and
Hossein Azadi
2
1
Research Group Land Use Decisions in the Spatial and System Context (DSC), Leibniz Centre for Agricultural Landscape Research, 15374 Müncheberg, Germany
2
Research Group Climate Change and Security (CLISEC), Institute of Geography, Center for Earth System Research and Sustainability (CEN), University of Hamburg, Grindelberg 5/7, 20144 Hamburg, Germany
3
Faculty of Engineering, Cairo University, Gamaet El Qahera Street, Giza 12613, Egypt
*
Author to whom correspondence should be addressed.
Sustainability 2022, 14(3), 1563; https://doi.org/10.3390/su14031563
Submission received: 3 December 2021 / Revised: 21 January 2022 / Accepted: 25 January 2022 / Published: 28 January 2022

Abstract

:
A rational assessment of electricity generation technologies constitutes a cornerstone to attain a sustainable and secure electricity plan. The Egyptian government is struggling with the accelerated growth of the national electricity demand through setting up and examining different future electricity scenarios and through the implementation of energy models to secure the provision of affordable and clean energy as part of the United Nations 2030 agenda of achieving the 17 sustainable development goals (SDGs). However, conventional techno-economic models still represent for many countries an attractive tool for energy planning. We investigate in this article the added values of applying a dynamic multi-criteria spatial-agent model that covers several sustainability dimensions versus an optimization techno-economic model for future energy planning in Egypt. Moreover, we report on the historical development of electricity supply since 2009 in Egypt. The study reveals predominant advantages of applying the agent-based modeling approach, which simulates the evolution of an energy transition landscape through the interactive and adaptive dynamic decision behavior of different societal groups (agents) in response to changes in the whole system. The study advocates the implementation of a dynamic agent-based bottom-up approach for the planning of a future sustainable electricity mix in Egypt.

1. Introduction

1.1. Sustainable Electricity Planning

Sustainable development was defined by the World Commission of Economy and Development in 1987 as development that can meet the needs of current generations without compromising the ability of future generations to meet their needs [1]. This necessitates a multi-dimensional analysis of our products and processes through considering the economic, environmental, and social dimensions of sustainability. “Leaving no one behind” is the motto of the UN 2030 agenda, while stimulating the member countries to adopt the 17 sustainable development goals (SDGs). A great worldwide concern towards sustainable development, as depicted by the Sustainable Energy for All (SE4A) initiative, the Millennium Development Goals, and the SDGs stated by the United Nations, motivates governments to change their policies and actions to facilitate the accessibility to modern, reliable, and affordable energy [1].
The electricity supply mix of a country needs to be periodically evaluated in a continuous attempt to find the most suitable solution to problems emerging in political, socio-economic, technical, and environmental crises. How to decide which power generation technologies should constitute this mix has become a major issue in many countries. The tradeoffs between different technologies stem from varying preferences of expected utilities that they would provide. Some actors show a high affinity towards conventional fossil fuels or nuclear-based energy sources, because they are supposed to be highly efficient and stable with no fluctuations. On the other hand, renewable energy is promoted for a wide variety of applications worldwide [2]. Renewable energy sources are expected to have comparatively lower environmental impacts and enhance the green economy of the country [3]. They are derived from freely available natural resources, the sun and wind, and exhibit a lower risk of damage as compared to fossil fuels or nuclear energy resources. At the same time, novel, energy-efficient technologies are more expensive when compared to conventional ones [4] in countries lacking the know-how to produce these technologies. Nevertheless, resource diversification, together with a transition to sustainable resources, would be a good solution to secure electricity supply. Further, internationally, renewable energy power plants have become competitive and cheaper than conventional ones [5]. However, how nations understand and interpret sustainability in their electricity planning remains ambiguous.
Electricity represents nowadays the most applied source of energy [6]. Coping with the fast pace of the digital era in the fourth industrial revolution (Industry 4.0) motivates many researchers to support plausible decisions for sustainable future electricity planning [7]. Moreover, the spread of artificial intelligence (AI) and real-time big data processing evoke the competition between power supply technologies, especially based on renewable energy resources, where high-precision weather prediction together with a smart grid can increase their reliability [8]. For these reasons, electricity modeling approaches have been continuously updated and developed to consider this digital development, allowing for a better decision today. This is obvious in coupling several modeling approaches with different methodologies [9] (e.g., AI, multi-criteria decision analysis (MCDA), role-play games [10]) and validating these models, improving their quality or developing consumer-based applications and platforms to promptly and efficiently update electricity consumption data [11].
Projections and studies of energy demand and supply using energy models [12,13,14,15] increasingly serve as a science-based database for societal debates among governments, energy production companies, trade associations, and non-governmental organizations. However, the dynamic interactions between different actor groups, with their accompanied consequences, are almost negligible in the implemented energy models. Therefore, energy planners should think of a new energy modeling paradigm that not only covers future electricity demands but also mitigates future conflicts.
In fact, developing countries face some challenges in their energy planning because of data unavailability, particularly renewable resources data, lack of tools, and shortage of expertise [16]. Therefore, extrapolating energy modeling techniques that have been applied to developed countries and to low-income countries may result in biased models and inadequate modeling of the energy systems of developing countries [17]. Thus, appropriate energy models that suit the conditions and capabilities of developing countries should be designed and calibrated.

1.2. Challenges of Electricity Supply in Egypt

During the period between 2010 and 2015, Egypt had experienced frequent electricity blackouts, reaching a peak in 2014. Several factors have contributed to these blackouts, including shortages of natural gas supply, increasing demand, and aging of infrastructure. According to the United States Energy Information Administration (US EIA), Egypt’s generating capacity was, in May 2015, slightly higher than the expected peak demand, leading to insufficient supply that could cover the demand in some areas. The electricity supply in Egypt until mid-2018 depended mainly on fossil fuels, constituting 92.8% of the whole supply [18]. This has increased Egyptian imports of fuel oil to cover the shortfall [19,20]. Furthermore, it has been estimated that the demand for electricity would reach 800 TWh/y by 2100, from about 190 TWh/y in 2017 [18,21,22]. Population growth rate and distribution also play an important role in energy consumption. It has been reported that Egypt is ranked as the most populous country in the Arab world and in North Africa but the third-most populous in Africa; Egypt’s Population reached over 101 million inhabitants in June 2019 [23]. However, poor distribution of population even worsens the situation and makes it difficult to suggest a decentralized electricity supply system where a high proportion of residents are situated in big cities such as Cairo and Alexandria, in addition to other major cities in the Nile Delta [23]. All of these previously mentioned challenges force energy planners to set up an energy plan at different temporal scales that could overcome these challenges and secure the supply of electricity for future generations.
This study aims to analyze the historical development of a mixed electricity supply in Egypt since 2009; further, it compares two different energy modeling tools implemented in separate studies. One is based on the optimization approach, whereas the other applies a dynamic agent-based model. We investigate both tools to figure out which approach would help to achieve a feasible sustainable future electricity supply in Egypt till 2035.
The article is organized as follows: Section 2 demonstrates the resource potential of different energy sources available in Egypt; Section 3 discusses the recent changes in Egyptian electricity policy; Section 4 shows an assessment of the historical development of the national plan; Section 5 reviews briefly different energy modeling approaches and gives a more detailed discussion on two applied energy modeling tools in Egypt; Section 6 compares electricity mix scenarios resulting from the two approaches at the years 2020 and 2035. Furthermore, it compares different features of both approaches. Section 7 gives a conclusion and future recommendations to policymakers in the energy sector.

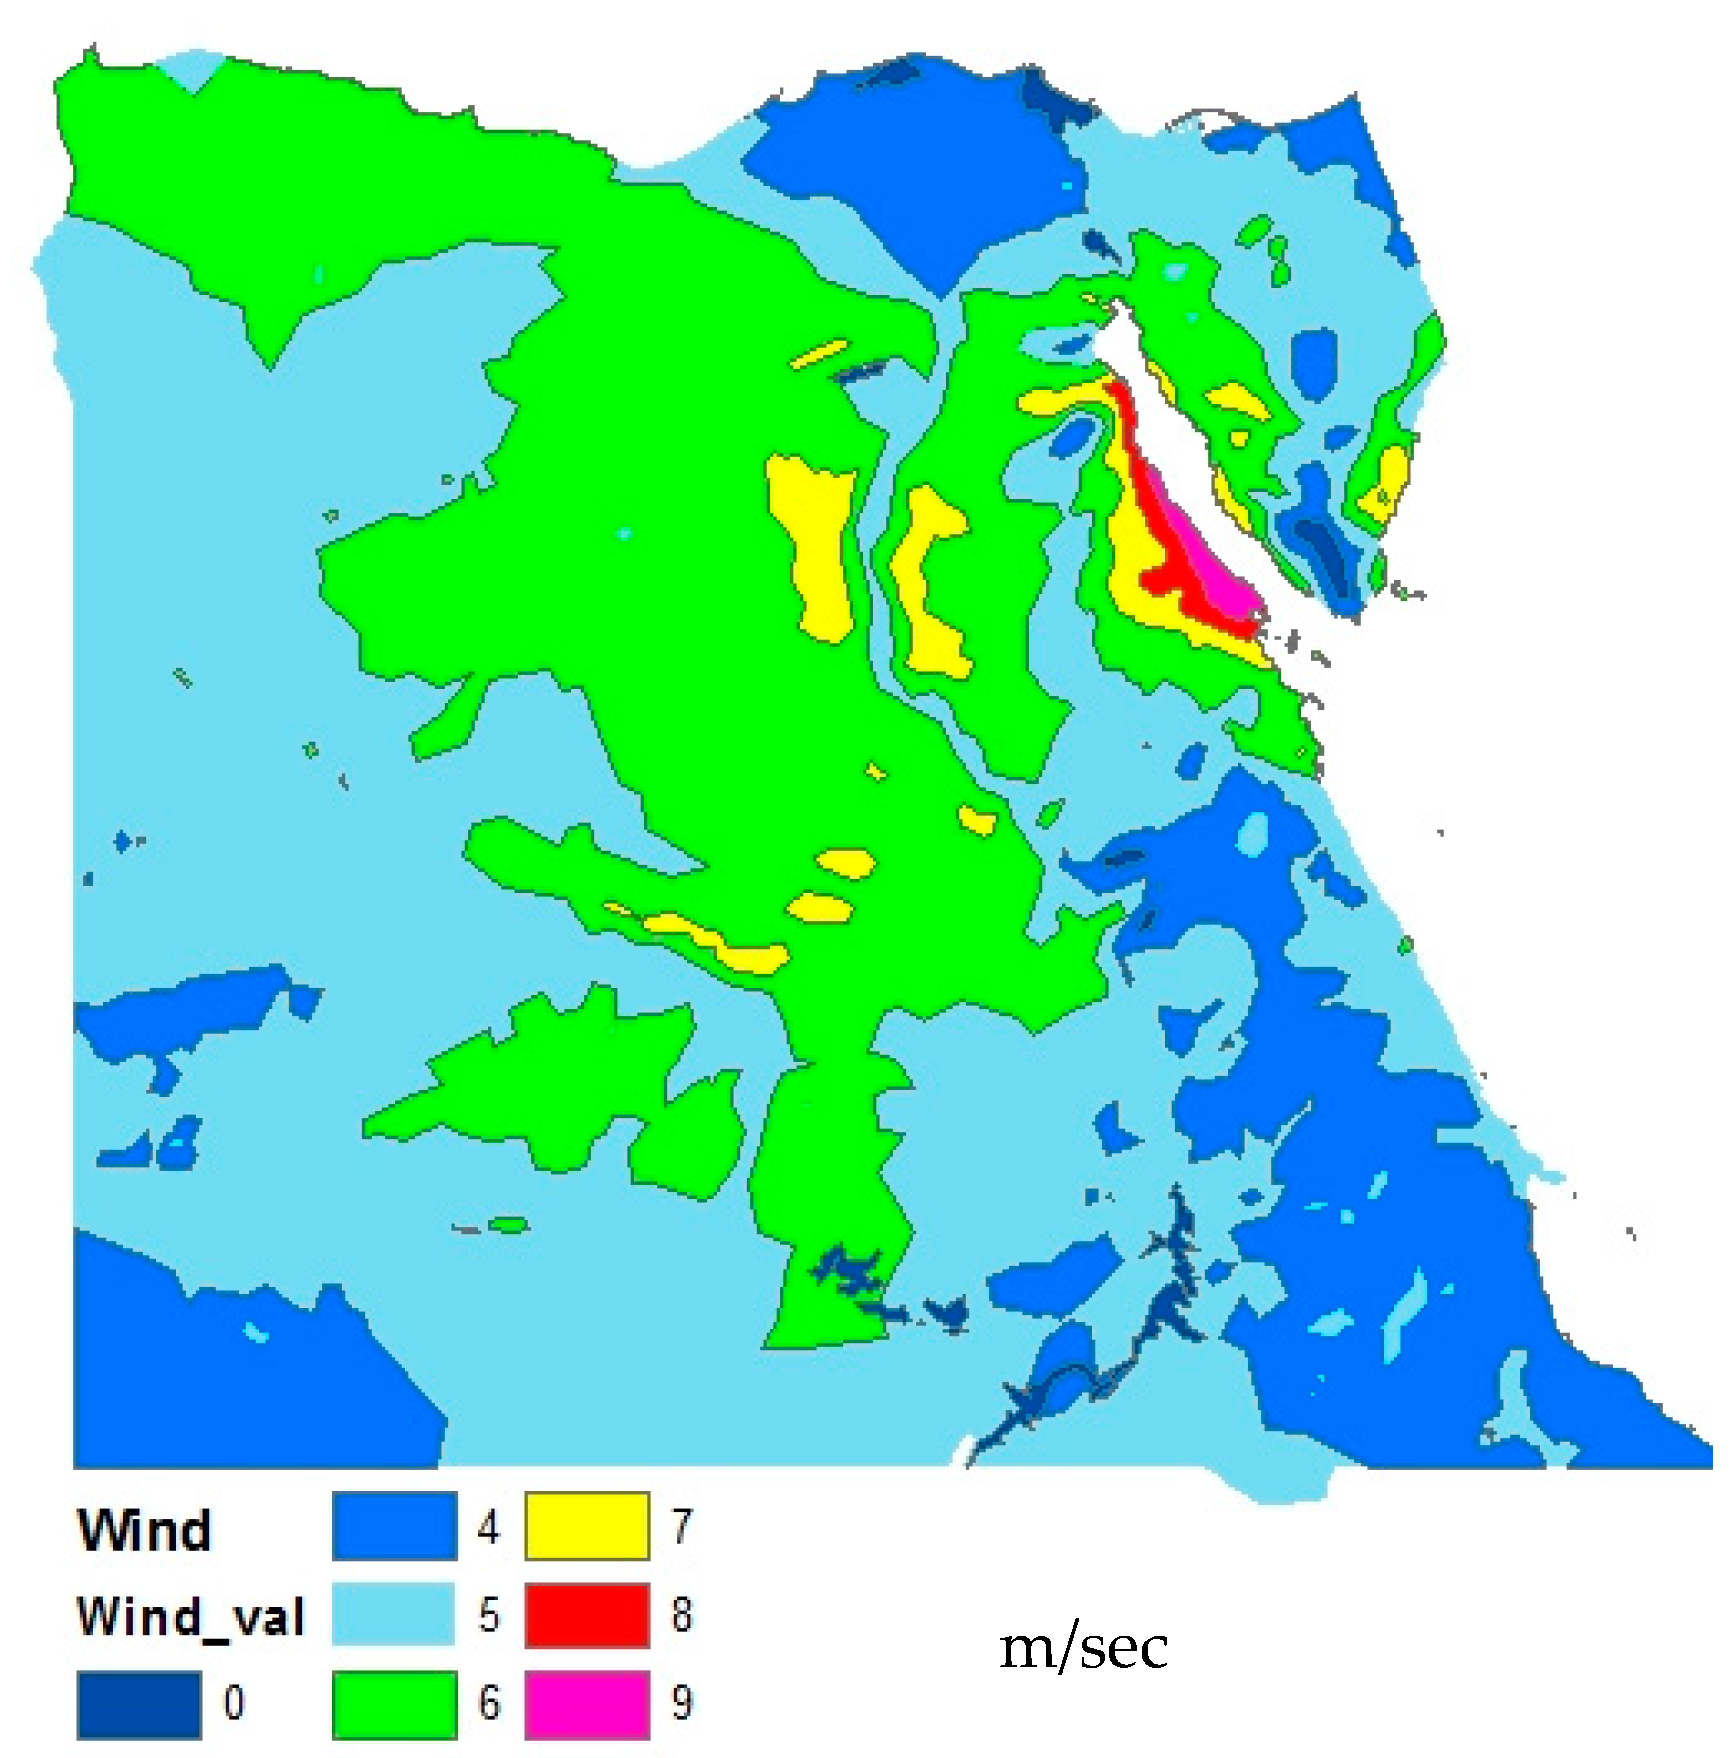
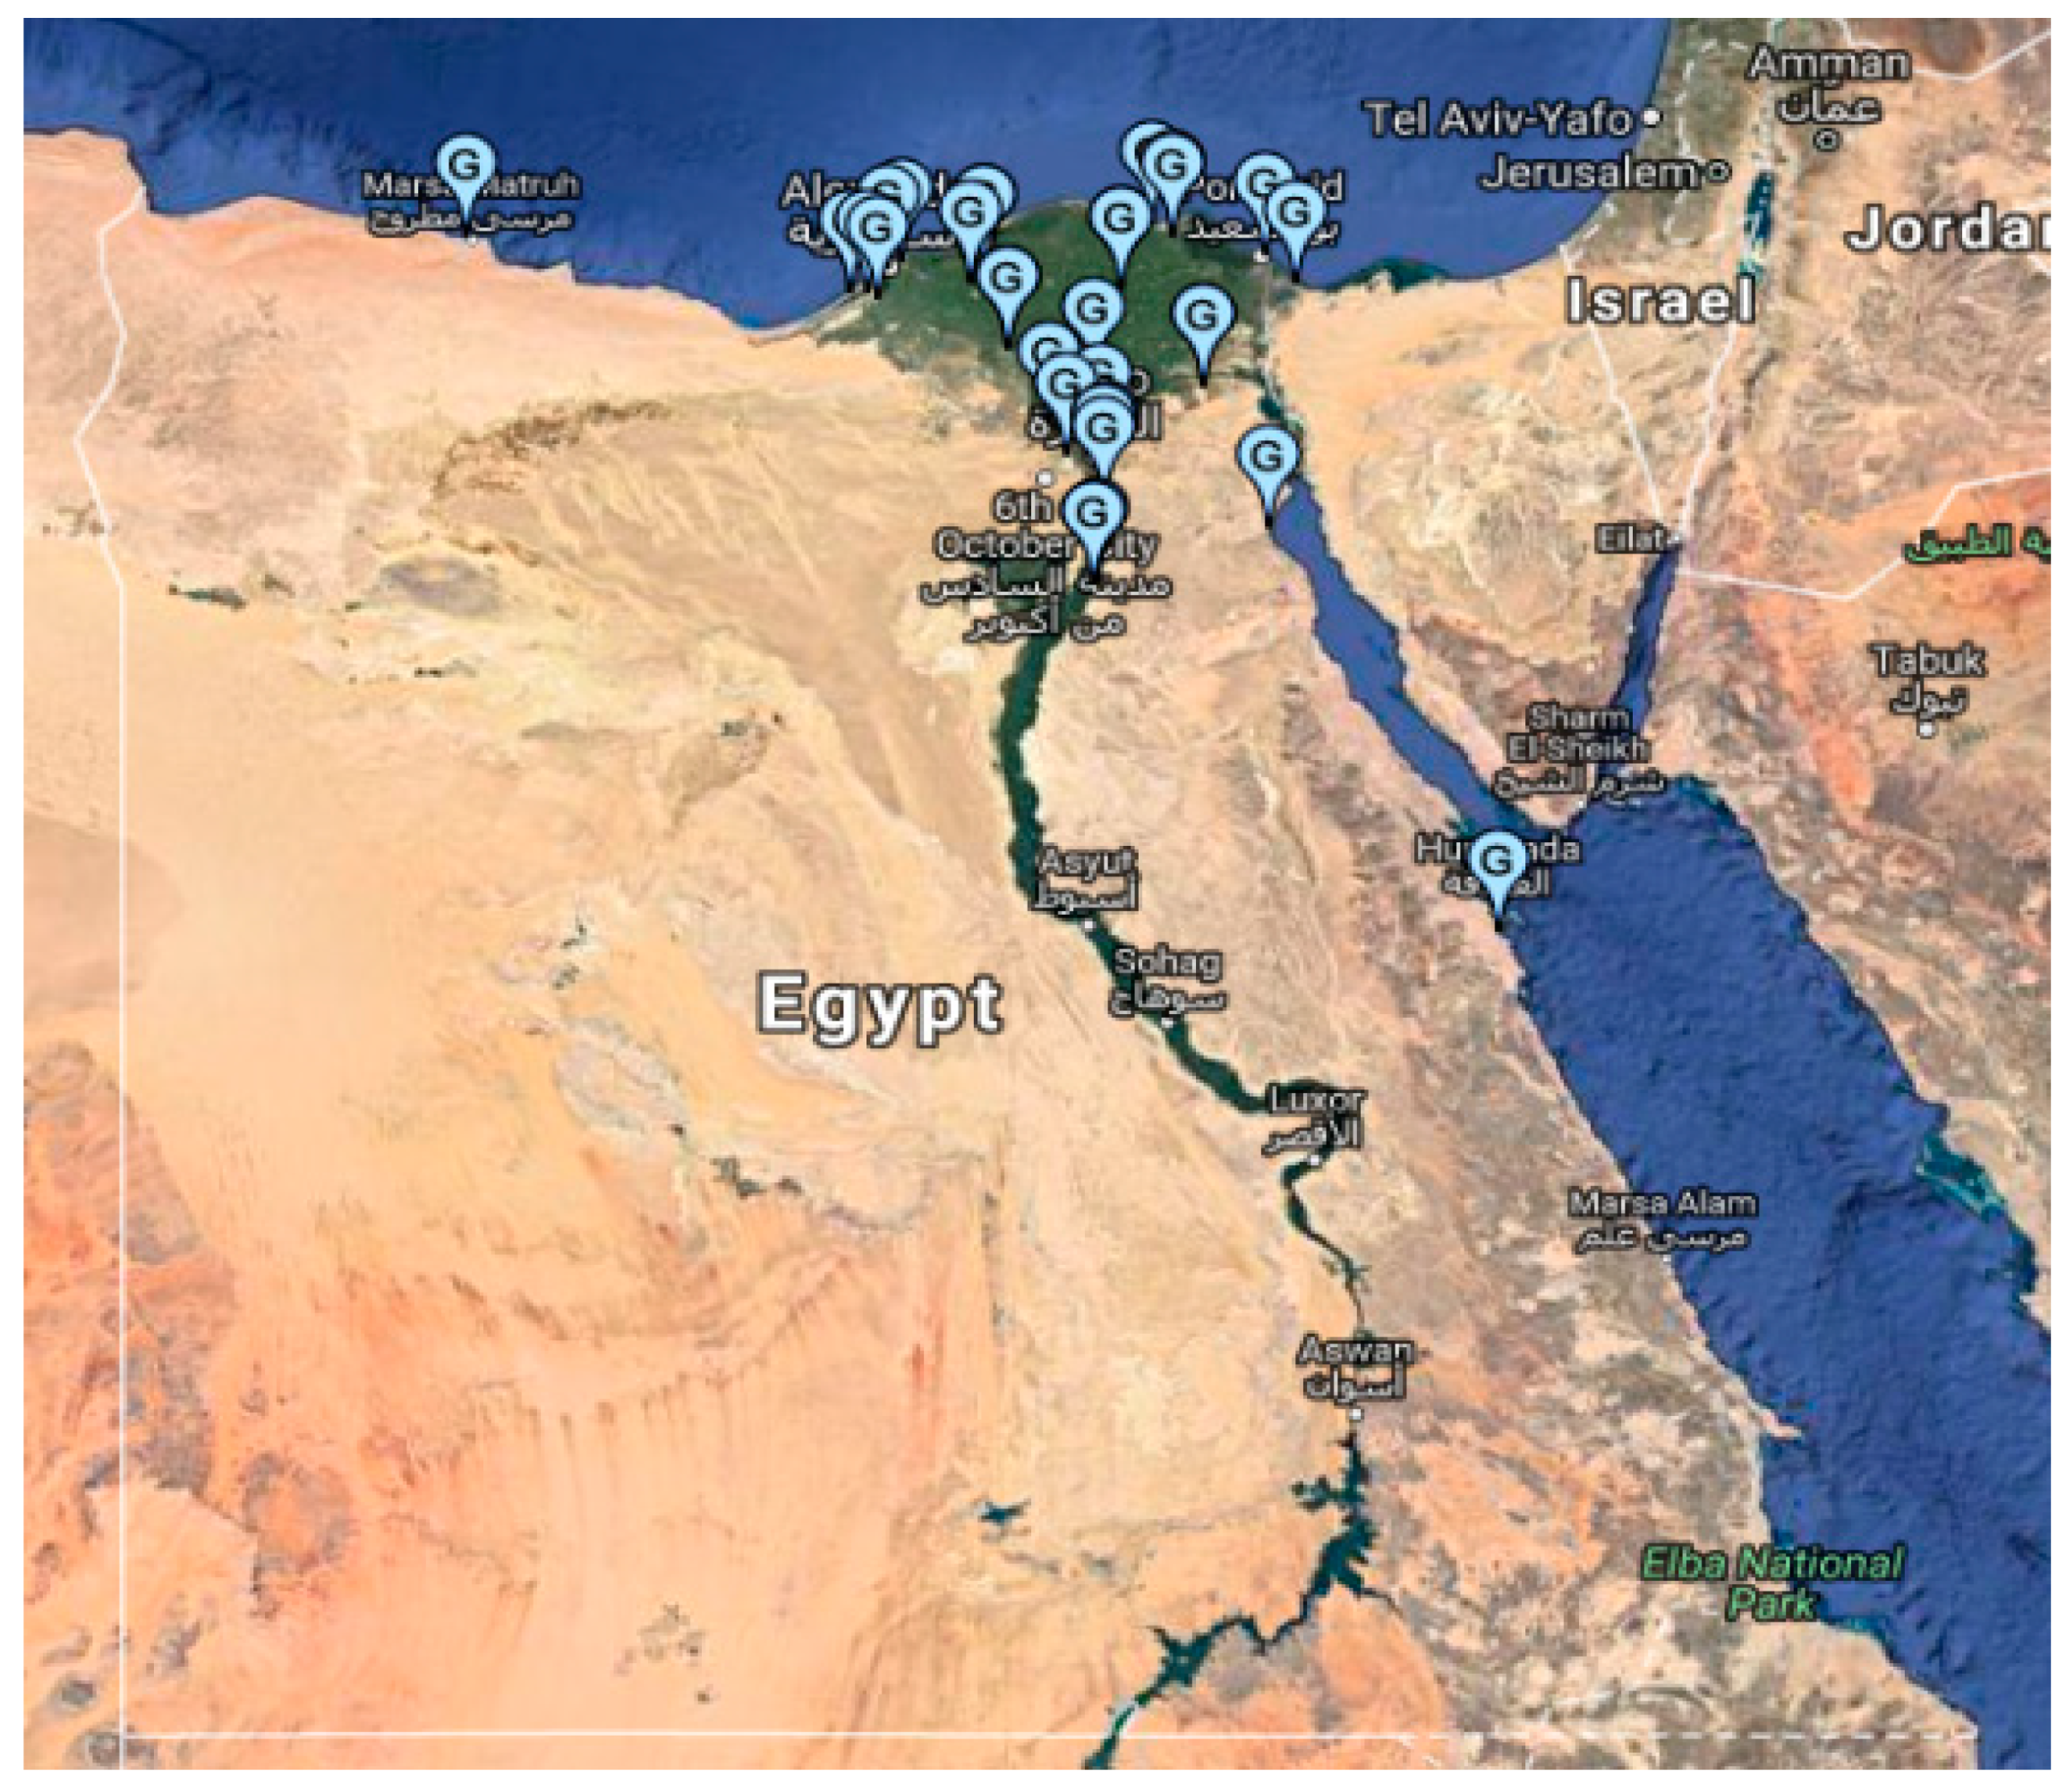
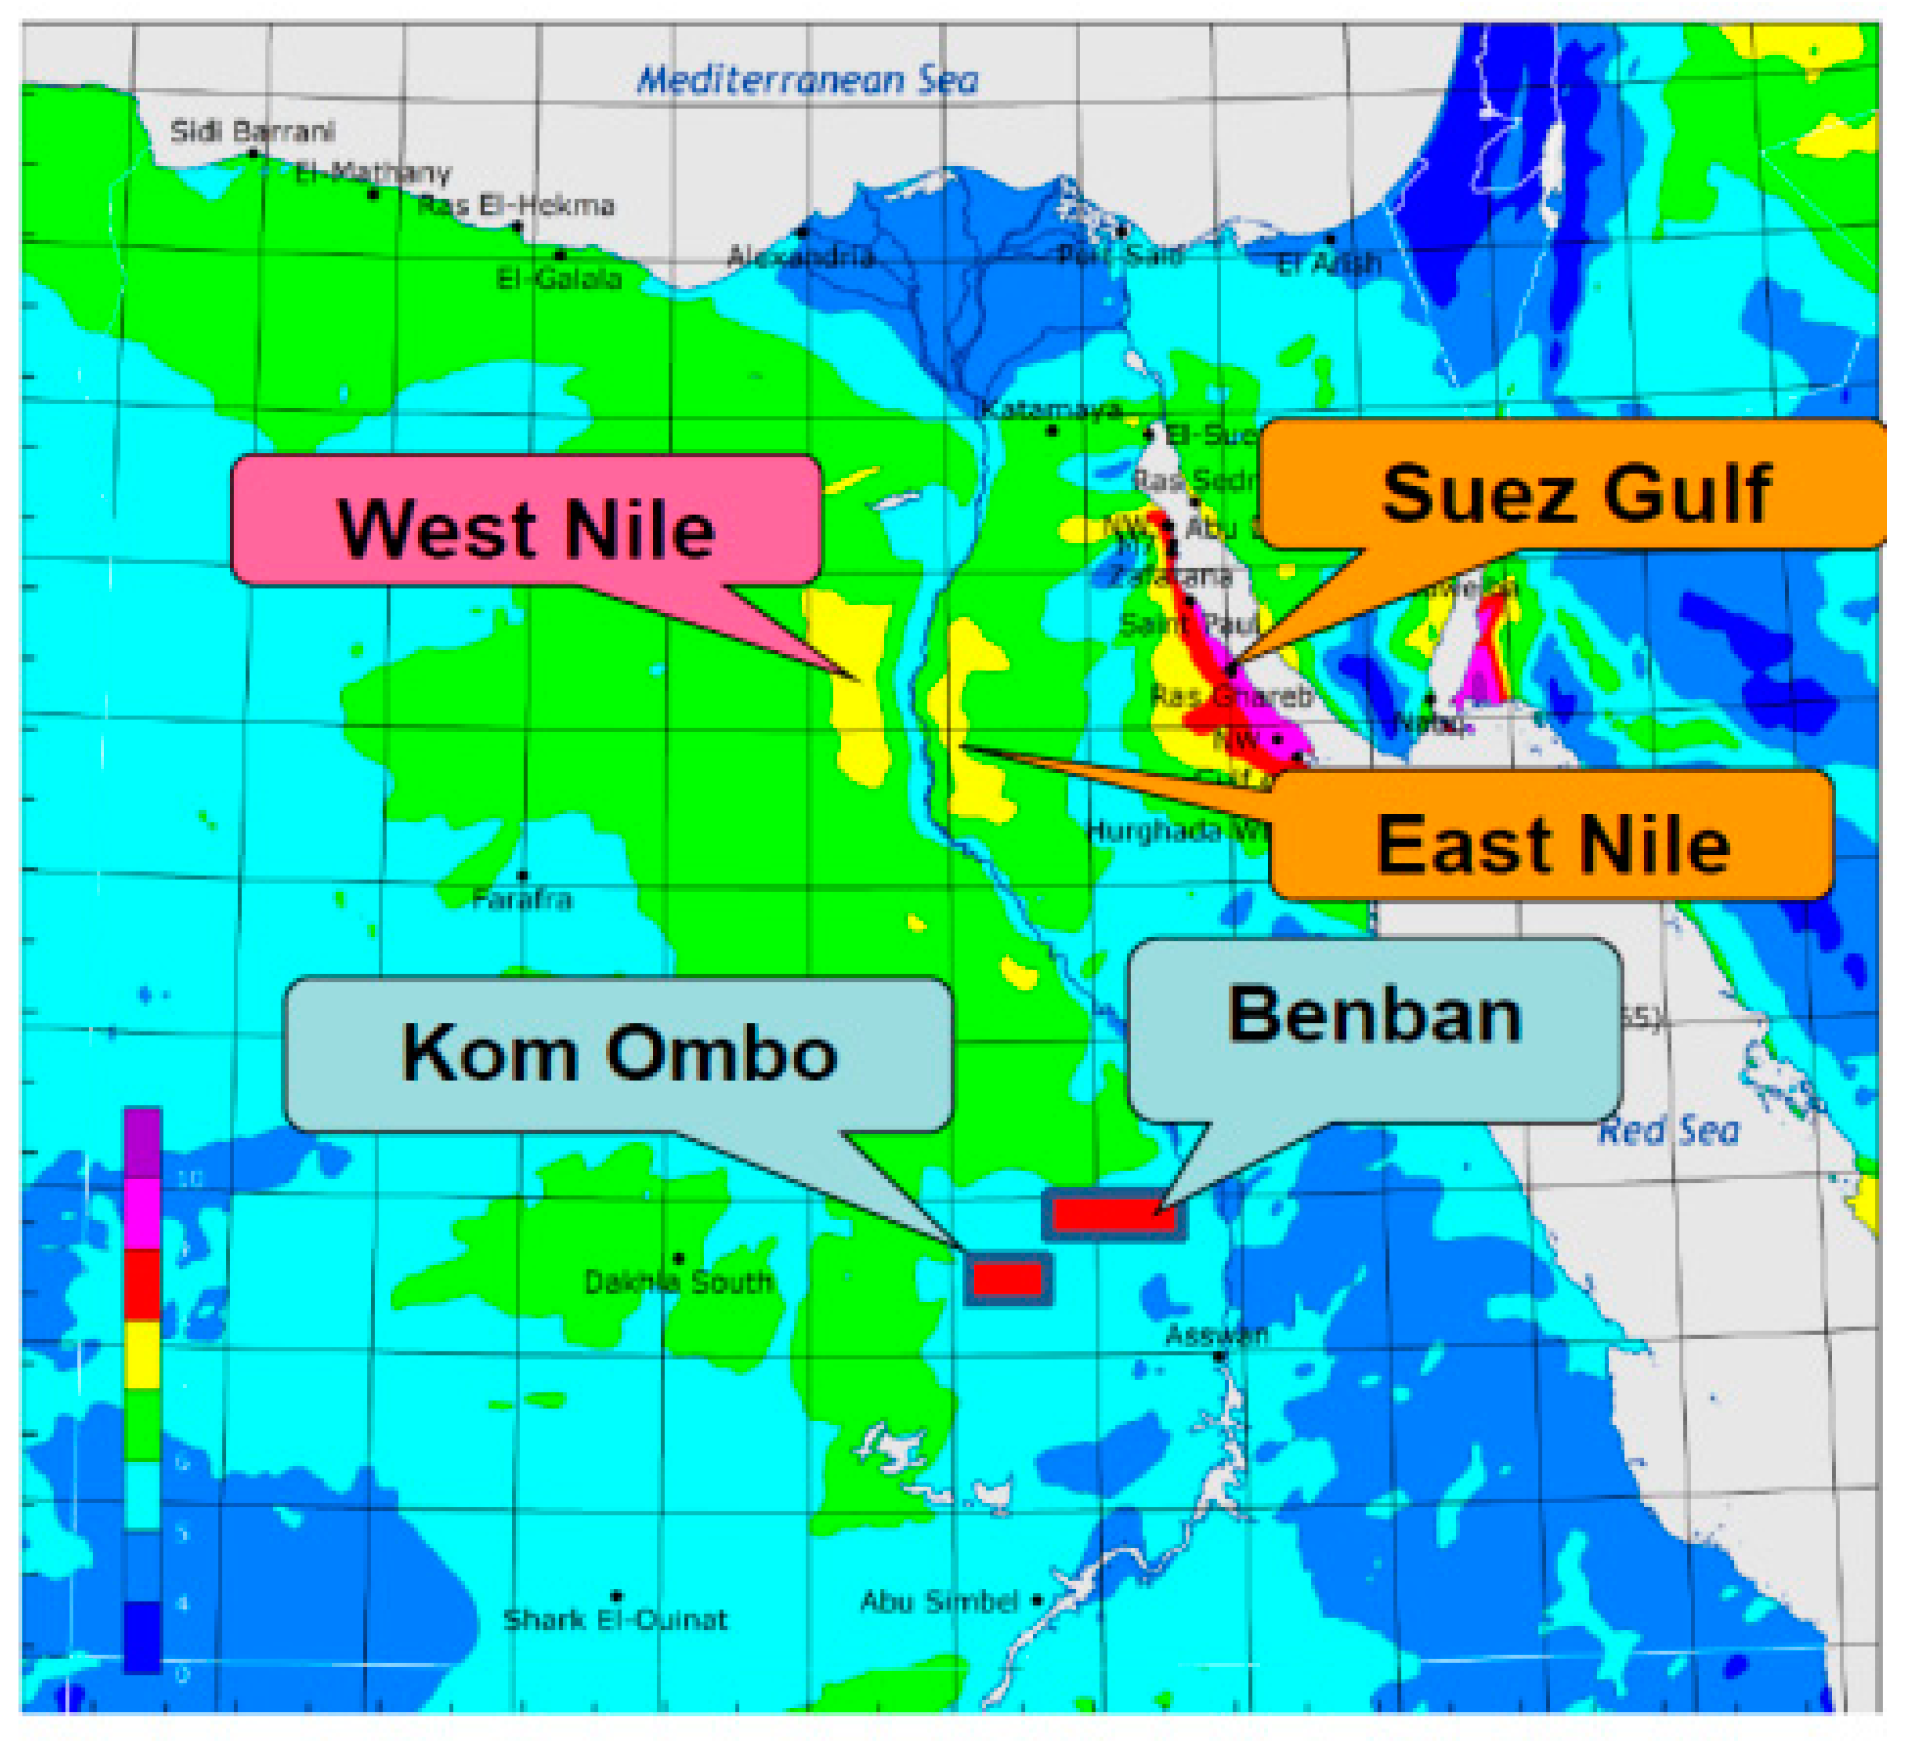
2. Resource Potential

Resource potential measures the theoretical potential annual amount of electricity that could be provided from an electric supply technology for a certain area, region, or country, taking into account the interruptions and the characteristics of the electrical systems [24,25]. The Middle East possesses a big share of reserves of both petroleum oil and natural gas worldwide, at a level of 64.5% [26] and 39.5% [27], respectively. The U.S. Energy Information Administration (EIA) has reported that Egypt has proven reserves of 3.5 billion barrels of oil, 65.2 trillion cubic feet of natural gas (NG) [28], and 18 million short tons of coal [29]. Figure 1 and Figure 2 show the spatial distribution of the installed natural gas power plants and pipeline network in Egypt. Egypt hosts only one coal mine, El Maghara mine, located in the Sinai Peninsula [30]. It contains a low-rank bituminous coal type. Nevertheless, South Africa represents one of the top ten net exporters of coal in the world [31] and has the shortest distance to Egypt as compared to other coal net exporter countries. Thus, South Africa could be a potential importer of coal for Egypt. Egyptian hydropower, represented by the Aswan High Dam and the Aswan Reservoir Dams across the Nile River, constitutes 5.1% of the electricity supply mix, with an installed capacity of 2832 MW. Still, some other potentials of hydropower are under investigation.
The New and Renewable Energy Agency in Egypt states that the location of Egypt is characterized by a significant solar and wind potential. The direct solar radiation ranges between 2000 and 3200 kWh/m2/year from north to south, as shown in Figure 3. The sun shines with an average of 10 h/day across the whole country. An integrated solar combined cycle power plant has been installed in Kuraymat with a total capacity of 140 MW and 20 MW solar share [34,35]. Egypt also shows a high potential for wind energy, where the average wind speed in the Suez Gulf, for instance, reaches 10.5 m/sec at 50 m height, in addition to other regions on the Nile banks in the Eastern and Western Deserts, as can be seen in Figure 4. Some of the currently installed wind power plants are allocated as follows: 545 MW in Zafarana, 580 MW in the Gulf of El Zayt, 250 MW in the Gulf of Suez, and 5 MW in Hurghada [36,37]. Said et al. (2013) have investigated the potential of biomass as a resource of renewable energy in Egypt [38]. The study reveals that a considerable amount of biomass with a total theoretical energy content of 416.9 PJ could be produced. Of this, 44.6% could be produced from the residue of some crops such as rice straw. Municipal solid wastes constitute 41.7%, whereas the rest of the potential bioenergy could be produced from animal and sewage wastes (13.7%).
Although they have not been exploited for any activities, six nuclear ores have been discovered in Egypt since 1996 [39] with a reserve capacity of uranium of 1900 tonnes of type [<USD 260/kgU] [40]. It has been found that 1 kg of uranium could generate 24 GWh [41]. The estimated resource potential of different electricity supply technologies in Egypt is presented in Table 1 based on calculations carried out in [42,43].
Figure 4. Wind atlas of Egypt (Adapted from [44]).
Sustainability 14 01563 g004

3. Amendments to the Electricity Policy

As an improvement step in the national economic development, the government has worked on a gradual withdrawal of subsidies in the energy sector as well as on the encouragement of private investment in the renewable energy sector. Among these amendments, two acts were issued by the parliament in 2014. One focuses on the enforcement of a gradual electricity subsidy withdrawal over the five-year plan (see Table 2), which has been recently prolonged till the end of the 2021–2022 fiscal year. The other act promotes renewable energy projects and encourages the private sector to invest in solar and wind energy projects, specifically through the introduction of the feed-in tariff financing scheme, with an average price of electricity of 10.5 centUSD/kWh and 14.34 centUSD/kWh from wind energy and photovoltaics (PV) at a capacity between 20 and 50 MW, respectively [20,45,46].
At the continental level, Egypt is intensifying its relationships with other African countries through its membership in the Eastern Africa Power Pool (EAPP) institution [47]. EAPP coordinates cross-border power trade and grid interconnection among nations of the Eastern Africa region. This enables the cooperative stabilization of electricity security and supports sustainable development in these nations.
Table 2. Price of electricity in Egyptian piasters/kWh throughout the period mid 2014–mid 2020 [20,48].
Consumption Segment (kWh/Month)Residential Sector (Egyptian Piasters/kWh)
Year
2014/152015/162016/172017/182018/192019/20
0–507.5910132230
51–10014.51719223040
101–200162026273650
201–350242935557082
351–6503439447590100
651–1000606871125135140
>1000747881135145145
Commercial (Egyptian Piasters/kWh)
0–100303234455565
101–25044505884100115
251–60059615896115140
601–1000788186135145155
>1000838686140150160

4. Assessment of National Planning for Electricity Targets

In order to meet the growing electricity demand in Egypt, the government plans, on a regular basis, how it could provide a supply that could cover the future demand as well as how to apply efficient consumption mechanisms. However, identifying the electricity supply mix represents the challenging cornerstone of planning, where the decision-maker employs a tradeoff between the pros and cons of different technologies. In this section, we analyze some of the previously planned targets and assess how far the country was able to achieve these targets.
According to the New and Renewable Energy Authority, a 425 MW wind farm was installed in Zafarana and another 5 MW wind farm off-grid in Hurghada by 2009 [49]. The project started in 2001 with only 5 MW on an experimental scale. Thereafter, 305 MW was added in several stages until 2007, reaching a large-scale, grid-connected wind farm. An additional 120 MW was under implementation in Zafarana and was planned to operate in 2010, reaching 545 MW. Several wind farm projects were under preparation: in the Gulf of El-Zayt: 420 MW, in the Gulf of Suez: 300 MW, west of the Nile: 200 MW, and 120 MW as a private investment. It was planned that by 2020 a total of 7200 MW of wind power would be installed in Egypt, which is far away from the currently installed wind power of 1375 MW [36].
Regarding the solar energy plan in 2009, there was an estimated installed capacity of 10 MW of off-grid photovoltaics (PV) for different purposes, such as lighting, telecommunication, and water pumping. The concentrated solar power (CSP) project in Kuraymat was under implementation with an overall capacity of 140 MW, of which 20 MW was the solar share, and it was expected to operate in 2010. Two CSP projects with a total capacity of 100 MW and four PV projects with a total capacity of 20 MW were under preparation in the same year for a five-year plan (2012–2017). The CSP projects were 70 MW in Kom Ombo and 30 MW in Marsa Alam in 2007. In 2009, the share of renewables was 11.2% hydro, with an installed capacity of 2800 MW, and 0.7% wind (i.e., 11.9% total renewable energy and the rest from fuel-fired power plants which are mainly fueled by natural gas) of the total electricity generation. The Supreme Energy Council in Egypt adopted a resolution on an ambitious plan aiming at increasing the contribution of renewable energy to reach 20% of total energy generated in 2020 (8% hydro and 12% wind) [50].
In 2010, the installed capacity of wind power increased to 490 MW [51], whereas in 2011, it increased again to 547 MW, with one year delay from what was planned [52]. Similarly, the Kuraymat CSP plant has been completed and started to operate one year later than planned. The solar thermal share is only 20 MW, generating 34 GWh/year [53] out of the 219 TWh/year of the whole plant. Thus, the installed solar and wind power in 2011 together were 567 MW, and the share of renewables was 9.9%. In 2012, an Egyptian Solar Plan of installing 3500 MW (2800 MW CSP + 700 MW PV) by 2027 has been agreed on. In 2013, private investors were invited to contribute to the installation of 10 × 20 MW PV units in Kom Ombo to start operation by 2017. In 2014, a 250 MW wind farm in the Gulf of Suez was prepared for implementation [20].
In 2015, there were major changes of the previously planned targets. The government realized that achieving the target of 20% renewables in 2020 seemed unrealistic; thus, the target has been postponed to 2022, of which 12% would be wind, 6% hydro, and 2% solar [35]. Moreover, the government had set a target of reducing energy use by 8.3%, installing 4–5 GW nuclear (6%), reaching 13.5 GW renewables (9%), and retaining oil and natural gas levels of production at 40% by the year 2022, but still 37% would need to be supplied from other resources [45]. It was planned to install a nuclear power plant about 40 years ago; however, the government canceled their plan after the Chernobyl nuclear accident took place in 1986. Recently, Egypt and Russia signed an agreement on constructing a 4800 MW nuclear power plant on the Mediterranean Sea coast in Matrouh city that would be completed by 2022 [19,54]. In 2016, the installed capacity of wind power was increased to 747 MW. Moreover, the government has allocated 4300 MW (2000 MW wind + 2300 MW solar) for the private sector in which they could invest through the feed-in tariff mechanism [55]. The planned allocated land use areas and capacity for solar and wind energy projects and their locations are shown in Table 3 and Figure 5, respectively.
In 2016, several plans for coal power plants were also introduced. Marubeni, a Japanese company, and ElSwedy, an Egyptian company, performed a feasibility study to build a 4000 MW coal power plant in West Matrouh [56]. The idea was supported by the intention declared by the Egyptian Ministry of Electricity to invest USD 4.5 billion in building the first coal power plant in Egypt, with a capacity of 2640 MW, in Ayoun Moussa in the Suez region [57]. Similarly, Orascom Construction, together with the United Arab Emirates International Petroleum Investment Company and China’s Dongfang Electric Corporation, set up a plan to study the construction of a 2–3 GW coal-fired power plant at Hamrawein Port on the Red Sea coast [58]. In 2017, the government planned to overcome the exceeding demands through applying a fast-track action plan giving less attention to renewables. The total installed capacity was increased by 5600 MW through the installation of three combined cycle (fossil fuel-based) power plants. Moreover, the government has stepped forth for the adoption of clean coal power technology, namely, 2 × 1320 MW in Oyoun Moussa, which is planned to operate by 2027, and 6600 MW in Hamrawein. The construction of a 2400 MW pumped-storage hydropower plant in Attaqa Mountain has been evaluated which was initiated in 2015 and would be due for completion in 2022 [18,37].
In 2018, four wind power plants, with a total installed capacity of 2610 MW, were planned to be installed and operational by the year 2023. In addition, 2000 MW capacity of wind energy projects was being progressed by Siemens. In 2019, the installed capacities of wind and PV increased to 1375 MW and 1597 MW, respectively. As can be observed from the previous information, the government set up a very optimistic national target for the adoption of renewable energy in the electricity supply mix which has never been attained, due to the complexity of the energy system that makes its planning difficult. This challenge has brought the necessity of applying a real-time dynamic model that involves all influencing factors on the electricity market in addition to different actors who are affected by the plan in order to realize a more realistic, adaptable, and resilient future energy mix. Table 4 summarizes the above-mentioned information regarding the progress of the allocated installed capacity of different technologies and the planned targets between 2009 and 2020.

5. Electricity Modeling Approaches

Energy models are basically classified according to their analytical approach into three types: top-down, bottom-up, and hybrid models. The top-down approach is based on macroeconomic modeling principles and techniques [61] and is intended to include important economic interactions of society. The bottom-up approach, often referred to as the engineering approach, is based on detailed technological parameters of the energy systems [61]. The two modeling approaches have been designed with different purposes and with a different theoretical background. Hybrid models represent a combination of both approaches to alleviate their drawbacks and to augment their advantages. Under each of these approaches, one or several methodologies could be employed which are based on certain mathematical approaches. According to their purposes, energy models are classified into investment decision support, operation decision support, scenario analysis, and power system analysis, or a combination of some of them [61].
The main objective of these models is to assist in projecting future energy demand and supply and to assess the impacts of different energy systems [62]. Top-down models are characterized by behavioral relations at an aggregated level, with parameters estimated based on historical relationships. The models used for energy economy modeling are based on different economic traditions and theories. In this section, we present the characteristics of the different underlying modeling methodologies of the three main approaches with examples, as shown in Table 5.

5.1. The Integrated MARKAL-EFOM System (TIMES)

The Integrated MARKAL-EFOM System (TIMES) model is an optimization approach that represents an integration of MARKAL and EFOM models. Optimization models aim to identify the optimal set of technologies and optimal investments that could supply the demand at minimized costs and under certain constraints. It depends mainly on a technical and economic assessment of the technologies with environmental constraints that are restricted to greenhouse gas (GHG) emissions. In contrast to agent-based modeling, the underlying assumption of optimization methodologies is that all actors behave optimally under given constraints. The MARKAL model has been developed by the International Energy Agency (IEA) through the Energy Technology System Analysis Program (ETSAP). It is based principally on a bottom-up dynamic modeling approach with simplified macroeconomic features that relate to the top-down approach. It has been used on a country level to analyze the demand and the supply of energy. The TIMES model was driven from the MARKAL family models and based on the same modeling approach. The development of the TIMES model was pursued through extending the MARKAL model with special features, such as climate equations, data decoupling, flexible time periods, etc. as well as with the integration with the EFOM model [62,63]. The TIMES model offers elegant solutions for in-depth national, multi-country, global energy, and environmental analyses. It can assist in the design of least-cost pathways for sustainable energy systems and is ideally suited for the preparation of low-emissions development strategies (LEDS) [65]. The TIMES model applies long-term scenarios [66] and combines the technical engineering and economic approaches together [67], showing a shortfall of considering the environmental and social aspects of energy technologies.
In 2014, the “technical assistance to support the reform of the energy sector” (TARES) study was pursued by the Egyptian Electric Utility and Consumer Protection Regulatory Agency (Egyptera) to investigate and explore different scenarios of future energy strategy across different sectors as well as the drivers forcing changes in the Egyptian energy system until the year 2035 using the TIMES energy model generator. Five top-down scenarios were adopted in their investigation, as shown in Table 6 [68]. The five scenarios are composed of one baseline scenario that is based on business as usual and four alternative scenarios. The alternative scenarios were ranked by a panel of experts through applying a multi-criteria decision analysis. The criteria upon which the alternative scenarios have been ranked include diversification of energy supply, total investment costs, energy efficiency, energy cost for the consumer, damage cost, reduction of the GHG emissions, and renewable energy systems introduction.

5.2. Energy Landscape Transition Analysis and Planning in Egypt (ELTAP-EGY)

“Energy landscape transition analysis and planning in Egypt” (ELTAP-EGY) represents an application of a bottom-up spatial dynamic evolutionary agent-based modeling (ABM) approach. ABM has the capability to depict individual entities in space, their adaptation, and interactions, which makes it well-known in social science. It has the advantage of modeling the heterogeneity of individuals and incorporating decision rules of agents explicitly. Furthermore, ABM can implement multiple scales of analysis, where it could show how the societal structure emerges from individual actions and their interactions [69,70]. Basically, ABM is made up of a set of agents, their relationships, decision rules, and a framework for simulating behaviors and interactions. Last but not least, ABM is the sole approach that starts and ends with the agent’s perspective [71], making it particularly suitable to apply agent choices and investments to energy pathways.
In the ELTAP-EGY model, the ABM simulates actors who change their priorities for action pathways in response to the change in marginal values of action pathways, which is a function of costs, value preferences [72], and environmental conditions that change in space and time (see Equation (1)). It has the advantages of simulating the interactions between different actors representing energy suppliers and demanding groups in addition to other actors who contribute to the decision-making processes in the energy sector. Each of these agents has different capitals, from which they invest some efforts to change the energy provision system (i.e., the energy mix) that would increase the expected utilities that they perceive. They behave differently, because they have different priorities of investments based on their preferences of values. The interaction between these actors could be simulated in a competitive or cooperative way in ELTAP.
The marginal value functions are based on a multi-criteria decision analysis (MCDA) model [43], preferences of stakeholders, and projected future electricity demand to compare different energy pathways used in electricity mix scenarios and sustainability of land use (see Equation (2)).
Δ p i q k Δ t = α i q   p i q k ( v i q k l p i q l v i q l )
where,
  • Δ p i q k Δ t is the change in action priority p of actor q for energy pathway k in spatial cell i for time period Δ t , which is one year in our case.
  • α i q is the adaptation rate of actor q in spatial cell i (in this model, we apply the same adaptation rate for all actors).
  • l p i q l v i q l is the sum of weighted marginal values (average), including all energy pathways l.
  • v i q k is the marginal value of energy pathway k for actor q in spatial cell i
v i q k = ( ( m = 1 o s m i k × h m ) i = 1 z ( m = 1 o s m i k × h m ) ) × ( j = 1 n a ( t ) k j × w j q ) k = 1 l [ ( ( m = 1 o s m i k × h m ) i = 1 z ( m = 1 o s m i k × h m ) ) × ( j = 1 n a ( t ) k j × w j q ) ]
where,
  • s m i k is the normalized value of spatial factor m influencing spatial cell i , which is for some factors specific to energy pathway k , as in the case of the resource potential.
  • h m is the weight of the spatial factor m , where o is the number of spatial factors.
  • a ( t ) k j is the normalized value of the assessment indicator j for energy pathway k , which is for some indicators a function of time.
  • w j q is the weight of the assessment indicator j of actor q .
ELTAP introduces a novel approach of integrating MCDA covering multiple dimensions of sustainable development with ABM to simulate the transition of the energy landscape and geographic information system (GIS) to incorporate spatial factors affecting the land use decision. By this combination, we integrate the temporal and spatial factors in addition to multiple assessment criteria and multiple agents in our investigation of the different electricity supply systems. Additionally, the model estimates the GHG emissions that would result from the simulation. More details about the ELTAP model can be found in [73,74]. Six scenarios have been proposed from ELTAP-EGY. Four scenarios consider only one dimension of sustainability (economic, technical, environmental, and social dimension) in the assessment of technologies, and one scenario represents equal preferences for all dimensions of sustainability. The sixth scenario, the game scenario, is based on empirical data collected through interviews with actors in the energy sector in Egypt, where it simulates a competitive interaction between the participating agents in the assessment of the technologies. In the game scenario, the agents aim to select the energy mix that would bring the maximum marginal value and adapt by changing the preferences of the assessment criteria to achieve this target. ELTAP-EGY has been developed as a prototype only for electricity supply planning and is to be further extended through increasing its resolution of assessment and including real-time updates and planning. The model is initiated with the electricity mix of 2015 for all scenarios.

6. Optimization versus Agent-Based Modeling

In this section, we analyze a comparison of the energy mix of the potential electricity supply technologies (see Figure 6, Figure 7, Figure 8, Figure 9 and Figure 10) between four scenarios that have been investigated in the TARES project developed through the TIMES model and six scenarios from the ELTAP-EGY model for the years 2020 and 2035. Scenario 1 in TARES study is not included, as there were no data available for it.
Although the TIMES model is a bottom-up modeling approach, the scenarios developed in the TARES project have been designed in a top-down macroeconomic fashion where the policy-makers pre-identified certain target objectives and policy rules that form the constraints of the model. On the contrary, the ELTAP model scenarios were designed based on changes in the indicators of assessment of technologies. Comparing electricity mixes from the designed scenarios in the two approaches with the current mix in 2019/2020, we found a large deviation ranging from −10 GW, in the technical scenario of the ELTAP model, to +30 GW in Scenario 3 of the TIMES model, as can be observed in Figure 8, whereas the minimal deviation can be found in the updated Scenario 4(b). Figure 6 compares the installed capacity percentages of each technology per scenario. All scenarios show more penetration of renewables as a replacement tool of fossil fuels; however, about 90% of the current electricity mix is supplied from natural gas (NG)- and oil-fired power plants. TIMES scenarios show a wide expansion of renewables, especially of wind power plants, which is not the case with ELTAP scenarios that show a major expansion of CSP plants. Scenario 3 estimates an installed capacity of more than 18.7 GW of wind in 2020, while the game scenario estimates 6.5 GW CSP to be installed in 2020. The ELTAP scenarios estimate a much lower expansion of fossil fuel-fired power plants, by about 20 GW as compared to the current mix. On the contrary, TIMES scenarios show a high interest to increase the installed capacity of NG- and oil-fired power plants by 8 GW as compared to the current mix. Nuclear and coal power plants are still under development and were not expected to be completed by 2020; thus, they could not be investigated realistically at this step. The evolution of scenarios of the ELTAP model does not show a big difference between them, since the five-year span starting from 2015 is not enough to depict large changes in the prioritization of investments. However, a large difference between scenarios can be observed in 2035.
Figure 9 and Figure 10 show the electricity mix of all scenarios of the two models in 2035. By analyzing each output of each scenario in 2035 obtained from the TIMES model and comparing it with the situation in 2019, we find that, in the BaU scenario, natural gas- and oil-fired power plants would progress very slowly, with limited expansion of about 4 GW, while coal and nuclear would reach very high shares of 34.4 GW and 4.8 GW, respectively. Hydropower in all scenarios of both approaches would remain unchanged, except for the updated scenario 4(b), where the new Attaqa project of 2400 MW has been considered. Wind power is targeted to reach 20.6 GW in all scenarios of the TIMES model, whereas it ranges from 5.8 GW in the technical scenario to 16 GW in the game scenario. The estimated installed capacity of CSP varies to a great extent among all scenarios. In the TIMES model, it ranges from 2.1 GW in the BaU scenario to 25.7 GW in Scenario 3, which also shows a highly optimistic prediction of the installed capacity of PV of 48 GW. However, these high installed capacities of renewables in Scenario 3 are to compensate the total absence of coal and nuclear, which have higher efficiency and availability. The updated scenario 4(b), which is currently the implemented plan, differs from the old one in partly replacing coal with further expansion of CSP and hydropower. However, it is still controversial whether the targets for renewables of the updated scenario 4(b) are feasible or not.
Based on the scenarios developed from the ELTAP model, we could deduce the impact of the decision behavior of actors on the evolution of the future electricity mix. This could be later adjusted under the different mix of assessment dimensions to achieve a feasible plan. From a technology perspective, NG- and oil-fired and nuclear power plants would be the most efficient, while, economically, coal and PV would be highly attractive. Wind power and CSP plants are the most socially acceptable technologies, in contrast to nuclear power plants as least socially acceptable. However, nuclear plants show environmental advantages by considering only GHG emissions and ignoring the radioactive emissions. CSP plants could be a potential future technology of choice in Egypt, being socially acceptable and environment-friendly; however, due to economic challenges, it might be less attractive. One major difference between the outputs of both models is the total installed capacity, which, in TIMES scenarios, almost doubles that of ELTAP scenarios. Moreover, in ELTAP scenarios, biomass plants have been considered in all scenarios which currently exist in the supply mix. Although it has considerable GHG emissions, biomass represents a CO2 sink that could be an interesting instrument to replace coal and reduce environmental risks.
In the game scenario, coal and nuclear plants are included basically at a low share as a diversification tool for energy security and technology transfer. The expansion of natural gas- and oil-fired power plants would continue to reach 33.5 GW. Wind power plants, CSP, and PV would be at a level of 16 GW, 24 GW, and 12 GW, respectively. Biomass would be included at a level of 2.7 GW. The output of the sustainable scenario is quite similar to that of the game scenario, which supports the game scenario as being more sustainable. However, the game scenario depends on the extent of contribution of actors in the decision-making process. Thus, the more actors that are involved, the more accurate the model would be.
Table 7 depicts the differences between main features of both approaches. We highly recommend that energy planners explore other modeling approaches that appreciate the societal participation at all levels in the decision-making process and to avoid the traditional focusing on the technical and economic aspects of alternatives. It is inconvenient to involve extensively technologies such as coal and nuclear, for instance, at a time when several countries have started decommissioning their plants due to complaints of their social and environmental hazards.

7. Conclusions

Although the Egyptian government strongly supports the contribution of renewable energies in the energy mix, their share in the mix is still low due to the vast expansion of other fossil fuels-based or nuclear power plants. Due to the high importance and complexity of the energy system, several modeling approaches based on different methodologies have been developed. The model developers try to tackle all elements and issues related to the planning of the future energy mix and demand prediction in order to attain a plausible decision-making that would assist the policy maker. However, these models are accompanied by some drawbacks which differ from one model to another, leading to the competitive variation among them. Although agent-based modeling can be used for optimization [77] by considering an optimizing decision rule for the interacting agents [72], there are still big differences between the two modeling approaches. Optimization models assume that actors behave optimally and are homogenous and that no interaction exists between them [78]. An optimization model is a kind of linear programming approach in which the modelers set up a single or multiple objectives and constraints to find out the best decision to be implemented to achieve this objective [79], whereas agent-based modeling is a simulation approach that forecasts system emergence under specific initial conditions [80]. It includes non-linear system dynamics and assumes actors as heterogeneous agents having different preferences, interacting with each other and adapting to changes in the system [80]. In this study, we briefly mentioned these different modeling approaches, then we emphasized two bottom-up approaches that were applied in energy planning in Egypt until the year 2035. The aim of this paper is not to criticize the optimizing TIMES model but rather to emphasize the additional advantages of the agent-based ELTAP model for energy modelers of future energy supply, where the former assumes an optimal behavior of the decision makers, while the latter includes an adaptive and interactive behavior of multiple agents. Furthermore, the ELTAP model shows superiority through its comprehensiveness, which would assist the dynamic decision-making process, including all involved stakeholders. Thus, it aims to achieve the sustainability, viability, and security of the energy supply through the societal participation in the decision-making process and would reduce the probability of incidence of conflicts among them. However, since ELTAP is a prototype model, it still needs to be further developed and extended to achieve more accurate results.

Author Contributions

Authors contributed to this article according to the following: conceptualization, M.S.; methodology, M.S. and J.S.; software, M.S.; investigation, M.S.; resources, M.S., M.S.E. and H.A.; data curation, M.S.; writing—original draft preparation, M.S.; writing—review and editing, J.S., H.A. and M.S.E.; supervision, J.S. and M.S.E.; project administration, J.S.; funding acquisition, J.S. All authors have read and agreed to the published version of the manuscript.

Funding

This research was funded in part by the German Science Foundation (DFG) through the Clusters of Excellence CliSAP (EXC 177) and CLICCS (EXC 2037), and the APC was funded by the first author.

Institutional Review Board Statement

Not applicable.

Informed Consent Statement

Not applicable.

Data Availability Statement

Not applicable.

Acknowledgments

The authors would like to thank all who gave assistance and advice during the writing and reviewing of this paper.

Conflicts of Interest

The authors declare no conflict of interest. The funders had no role in the design of the study; in the collection, analyses, or interpretation of data; in the writing of the manuscript, or in the decision to publish the results.

List of Abbreviations

ABMAgent-based modeling
ASTRAASsessment of TRAnsport strategies
BaUBusiness as usual
BUENASBottom-up energy analysis system
CGEComputable general equilibrium
CoMSES NetNetwork for Computational Modeling in the Social and Ecological Sciences
CREMPThe Combined Renewable Energy Masterplan
CSPConcentrated solar power
DNIDirect normal irradiance
EEHCEgyptian Electricity Holding Company
EGASThe Egyptian Natural Gas Holding Company
EgypteraThe Egyptian Electric Utility and Consumer Protection Regulatory Agency
ELTAPEnergy landscape transition analysis and planning
EMlab-GenerationEnergy Modeling Laboratory–Generation
ETMEUROfusion Times Model
ETSAPEnergy technology system analysis program
EUCADEuropean Unit Commitment and Dispatch
FitFeed-in tariff
GAMSGeneral algebraic modeling system
GCAMGlobal change assessment model
GEGenerated electricity
GEM-E3General Equilibrium Model for Economy-Energy-Environment
GENESYSGenetic Optimization of a European Energy Supply System
GEOGlobal energy observatory
GHGGreenhouse gas
GISGeographic information system
GTAPGlobal Trade Analysis Project
GWGigawatt
ICInstalled capacity
IEAInternational Energy Agency
iHOGAImproved hybrid optimization by genetic algorithms
IRENAInternational Renewable Energy Agency
KWhKilowatt-hour
LEAPLong-range energy alternatives planning
LEDSLow-emissions development strategies
MAEDModel for analysis of energy demand
MARKALMARKet ALlocation model
MCDAMulti-criteria decision analysis
MESSAGEModel for energy supply strategy alternatives and their general environmental impact
MUREMesures d’Utilisation Rationnelle de l’Energie
MWMegawatt
NGNatural gas
NREANew and Renewable Energy Authority
NRELNational Renewable Energy Laboratory
OECD/NEAThe Organization for Economic Co-operation and Development/The Nuclear Energy Agency
OPECThe Organization of the Petroleum Exporting Countries
OSeMOSYSThe Open-Source Energy Modeling System
PJPetajoules
POLESProspective outlook on long-term energy systems
PRIMESPrice-induced Market Equilibrium System
PVPhotovoltaic
PyPSAPython for Power System Analysis
RERenewable energy share
REEPSResidential End-Use Energy Planning System
ReMINDRegional Model of Investments and Development
SDGsSustainable development goals
SE4ASustainable energy for all
SNOWStatistics Norway’s World model
StELMODStochastic Electricity Market model
SWITCHSolar, Wind, Transmission, Conventional generation, and Hydroelectricity
TARESTechnical assistance to support the reform of the energy sector
TemoaTools for energy model optimization and analysis
TIMESThe Integrated MARKAL-Energy Flow Optimization Model (EFOM) System
TWh/yTerawatt-hour per year
US EIAUnited States Energy Information Administration
WEMWorld Energy Model

References

  1. United Nations United Nations Sustainable Development Agenda; United Nations: New York, NY, USA, 2016.
  2. De Melo, C.A.; Jannuzzi, G.d.M.; Bajay, S.V. Nonconventional Renewable Energy Governance in Brazil: Lessons to Learn from the German Experience. Renew. Sustain. Energy Rev. 2016, 61, 222–234. [Google Scholar] [CrossRef]
  3. Corrêa da Silva, R.; de Marchi Neto, I.; Silva Seifert, S. Electricity Supply Security and the Future Role of Renewable Energy Sources in Brazil. Renew. Sustain. Energy Rev. 2016, 59, 328–341. [Google Scholar] [CrossRef]
  4. Baležentis, T.; Streimikiene, D. Multi-Criteria Ranking of Energy Generation Scenarios with Monte Carlo Simulation. Appl. Energy 2017, 185, 862–871. [Google Scholar] [CrossRef]
  5. IRENA. Renewable Power Generation Costs in 2020; International Renewable Energy Agency: Abu Dhabi, United Arab Emirates, 2021; ISBN 978-92-9260-348-9. [Google Scholar]
  6. Norris, W.T. Electrical energy. In Information Sources in Energy Technology; Elsevier: Amsterdam, The Netherlands, 1988; pp. 134–149. ISBN 978-0-408-03050-2. [Google Scholar]
  7. Hübner, C. Sustainable Energy and Digitalization: Practices and Perspectives in Asia-Pacific; Konrad-Adenauer-Stiftung e.V.: Hong Kong, China, 2020. [Google Scholar]
  8. Ahmad, T.; Zhang, D.; Huang, C.; Zhang, H.; Dai, N.; Song, Y.; Chen, H. Artificial Intelligence in Sustainable Energy Industry: Status Quo, Challenges and Opportunities. J. Clean. Prod. 2021, 289, 125834. [Google Scholar] [CrossRef]
  9. Janssen, M.; Ostrom, E. Empirically Based, Agent-Based Models. Ecol. Soc. 2006, 11. [Google Scholar] [CrossRef] [Green Version]
  10. Mallampalli, V.R.; Mavrommati, G.; Thompson, J.; Duveneck, M.; Meyer, S.; Ligmann-Zielinska, A.; Druschke, C.G.; Hychka, K.; Kenney, M.A.; Kok, K.; et al. Methods for Translating Narrative Scenarios into Quantitative Assessments of Land Use Change. Environ. Model. Softw. 2016, 82, 7–20. [Google Scholar] [CrossRef] [Green Version]
  11. Morley, J.; Widdicks, K.; Hazas, M. Digitalisation, Energy and Data Demand: The Impact of Internet Traffic on Overall and Peak Electricity Consumption. Energy Res. Soc. Sci. 2018, 38, 128–137. [Google Scholar] [CrossRef]
  12. Bundesamt für Energie Die Energieperspektiven 2035—Band 1 Synthese; Swiss Federal Institute of Technology: Zurich, Switzerland, 2007.
  13. Kirchner, A.; Matthes, F. Endbericht Modell Deutschland. Klimaschutz bis 2050: Vom Ziel her Denken; WWF: Basel, Switzerland; Berlin, Germany, 2009. [Google Scholar]
  14. IEA. World Energy Model—Methodology and Assumptions; International Energy Agency: Paris, France, 2011. [Google Scholar]
  15. Prognos AG Das Energiewirtschaftliche Gesamtkonzept. Konsequenzen eines Beschleunigten Ausstiegs aus der Kernenergie in Deutschland; Wuppertal Institute: Berlin, Germany, 2011. [Google Scholar]
  16. Bazilian, M.; Nussbaumer, P.; Rogner, H.-H.; Brew-Hammond, A.; Foster, V.; Pachauri, S.; Williams, E.; Howells, M.; Niyongabo, P.; Musaba, L.; et al. Energy Access Scenarios to 2030 for the Power Sector in Sub-Saharan Africa. Util. Policy 2012, 20, 1–16. [Google Scholar] [CrossRef] [Green Version]
  17. Urban, F.; Benders, R.M.J.; Moll, H.C. Modelling Energy Systems for Developing Countries. Energy Policy 2007, 35, 3473–3482. [Google Scholar] [CrossRef]
  18. EEHC. Egyptian Electricity Holding Company Annual Report; Ministry of Electricity and Renewable Energy: Cairo, Egypt, 2017.
  19. US EIA Egypt Energy Analysis. Available online: https://www.eia.gov/beta/international/analysis.cfm?iso=EGY (accessed on 14 March 2016).
  20. EEHC. Egyptian Electricity Holding Company Annual Report; Ministry of Electricity and Renewable Energy: Cairo, Egypt, 2014.
  21. The World Bank Electric Power Consumption. Available online: http://data.worldbank.org/indicator/EG.USE.ELEC.KH.PC (accessed on 22 April 2016).
  22. Shaaban, M. The Roadmap to Energy Security in Egypt. Ph.D. Thesis, University of Hamburg, Hamburg, Germany, 2017. [Google Scholar]
  23. Worldometers Egypt Population. 2019. Available online: https://www.worldometers.info/world-population/egypt-population/ (accessed on 8 June 2019).
  24. Rovere, E.L.L.; Soares, J.B.; Oliveira, L.B.; Lauria, T. Sustainable Expansion of Electricity Sector: Sustainability Indicators as an Instrument to Support Decision Making. Renew. Sustain. Energy Rev. 2010, 14, 422–429. [Google Scholar] [CrossRef]
  25. Mainali, B.; Silveira, S. Using a Sustainability Index to Assess Energy Technologies for Rural Electrification. Renew. Sustain. Energy Rev. 2015, 41, 1351–1365. [Google Scholar] [CrossRef]
  26. OPEC OPEC: OPEC Share of World Crude Oil Reserves. Available online: https://www.opec.org/opec_web/en/data_graphs/330.htm (accessed on 18 July 2019).
  27. International Energy Statistics International Energy Statistics. Available online: https://www.eia.gov/international/overview/country/EGY (accessed on 18 July 2019).
  28. US EIA Egypt—International—Analysis—U.S. Energy Information Administration (EIA). Available online: https://www.eia.gov/beta/international/analysis.php?iso=EGY (accessed on 18 July 2019).
  29. US EIA International Energy Statistics: Data_Egypt_Coal. Available online: https://www.eia.gov/international/overview/country/EGY (accessed on 19 March 2017).
  30. Amer, H.A.; Shawky, S.; Hussein, M.I.; Abd El-Hady, M.L. Radiological Study of Exposure Levels in El Maghara Underground Coal Mine. J. Environ. Monit. 2002, 4, 583–587. [Google Scholar] [CrossRef] [PubMed]
  31. OECD/IEA. Key World Energy Statistics 2017; International Energy Agency: Paris, France, 2017. [Google Scholar]
  32. GEO Egypt Energy Map Data in GEO. Available online: http://globalenergyobservatory.org/constructNetworkIndex.php (accessed on 6 October 2016).
  33. Alami, R. Egypt’s Domestic Natural Gas Industry; Oxford Institute for Energy Studies: Oxford, UK, 2006; ISBN 978-1-901795-46-2. [Google Scholar]
  34. Khalil, A.K.; Mubarak, A.M.; Kaseb, S.A. Road Map for Renewable Energy Research and Development in Egypt. J. Adv. Res. 2010, 1, 29–38. [Google Scholar] [CrossRef] [Green Version]
  35. NREA. Annual Report; New and Renewable Energy Authority: Cairo, Egypt, 2015.
  36. NREA. Annual Report; New and Renewable Energy Authority: Cairo, Egypt, 2019.
  37. IRENA. Renewable Energy Outlook: Egypt; International Renewable Energy Agency: Abu Dhabi, United Arab Emirates, 2018; p. 120. [Google Scholar]
  38. Said, N.; El-Shatoury, S.A.; Díaz, L.F.; Zamorano, M. Quantitative Appraisal of Biomass Resources and Their Energy Potential in Egypt. Renew. Sustain. Energy Rev. 2013, 24, 84–91. [Google Scholar] [CrossRef]
  39. Abdul Razek, Y. Uranium Resources in Egypt; International Atomic Energy Agency: Vienna, Austria, 2009. [Google Scholar]
  40. OECD/NEA. Uranium 2016: Resources, Production and Demand; OECD Nuclear Energy Agency: Paris, France, 2016. [Google Scholar]
  41. European Nuclear Society Fuel Comparison. Available online: https://www.euronuclear.org/info/encyclopedia/f/fuelcomparison.htm (accessed on 19 March 2017).
  42. Trieb, F. MED-CSP: Concentrating Solar Power for the Mediterranean Region; German Aerospace Center (DLR): Stuttgart, Germany, 2005. [Google Scholar]
  43. Shaaban, M.; Scheffran, J.; Böhner, J.; Elsobki, M. Sustainability Assessment of Electricity Generation Technologies in Egypt Using Multi-Criteria Decision Analysis. Energies 2018, 11, 1117. [Google Scholar] [CrossRef] [Green Version]
  44. Gylling Mortensen, N.; New and Renewable Energy Authority; Egyptian Meteorological Authority; Forskningscenter Risø. Wind Atlas for Egypt: Measurements and Modelling 1991–2005; New and Renewable Energy Authority: Egyptian Meteorological Authority; Risø National Laboratory: Cairo, Egypt, 2006; ISBN 978-87-550-3493-8. [Google Scholar]
  45. El Sobki, M.S. Full Scale Program for Renewable Energy in Egypt; Egyptera: Cairo, Egypt, 2015.
  46. Egyptera. The Organizational Structure for Residential and Commercial Photovoltaic Systems. Available online: http://egyptera.org/ar/kwa3d%20tanzmia.aspx (accessed on 20 July 2019).
  47. EAPP. Eastern Africa Power Pool. Available online: https://eappool.org/ (accessed on 25 October 2021).
  48. Egyptera. Electricity Tariff and Prices. Available online: http://egyptera.org/ar/Tarrif6.aspx (accessed on 8 June 2019).
  49. NREA. Annual Report; New and Renewable Energy Authority: Cairo, Egypt, 2009. [Google Scholar]
  50. EEHC. Egyptian Electricity Holding Company Annual Report; Ministry of Electricity and Renewable Energy: Cairo, Egypt, 2009.
  51. EEHC. Egyptian Electricity Holding Company Annual Report; Ministry of Electricity and Renewable Energy: Cairo, Egypt, 2010.
  52. EEHC. Egyptian Electricity Holding Company Annual Report; Ministry of Electricity and Renewable Energy: Cairo, Egypt, 2011.
  53. NREL. ISCC Kuraymat | Concentrating Solar Power Projects. Available online: https://solarpaces.nrel.gov/iscc-kuraymat (accessed on 21 July 2019).
  54. Reuters. Egypt, Russia Sign Deal to Build a Nuclear Power Plant; Reuters: Cairo, Egypt, 2015. [Google Scholar]
  55. EEHC. Egyptian Electricity Holding Company Annual Report; Ministry of Electricity and Renewable Energy: Cairo, Egypt, 2016.
  56. Reuters. Japan’s Marubeni May Build Coal Power Plant in Egypt; Reuters: Cairo, Egypt, 2016. [Google Scholar]
  57. ESI-Africa Egypt. Ministry of Electricity Invests $4.5bn in Coal-Fired Power; ESI-Africa: Cairo, Egypt, 2016. [Google Scholar]
  58. SourceWatch Hamarawein Port Power Station. Available online: http://www.sourcewatch.org/index.php/Hamarawein_Port_power_station (accessed on 14 February 2017).
  59. EEHC. Egyptian Electricity Holding Company Annual Report; Ministry of Electricity and Renewable Energy: Cairo, Egypt, 2018.
  60. EEHC. Egyptian Electricity Holding Company Annual Report; Ministry of Electricity and Renewable Energy: Cairo, Egypt, 2019.
  61. Ringkjøb, H.-K.; Haugan, P.M.; Solbrekke, I.M. A Review of Modelling Tools for Energy and Electricity Systems with Large Shares of Variable Renewables. Renew. Sustain. Energy Rev. 2018, 96, 440–459. [Google Scholar] [CrossRef]
  62. Van Beeck, N. Classification of Energy Models; FEW: Tilburg, The Netherlands, 1999. [Google Scholar]
  63. Herbst, A.; Toro, F.A.; Reitze, F.; Jochem, E. Introduction to Energy Systems Modelling. Swiss J. Econ. Stat. 2012, 148, 111–135. [Google Scholar] [CrossRef] [Green Version]
  64. Jebaraj, S.; Iniyan, S. A Review of Energy Models. Renew. Sustain. Energy Rev. 2006, 10, 281–311. [Google Scholar] [CrossRef]
  65. IEA-ETSAP IEA-ETSAP | Times. Available online: https://iea-etsap.org/index.php/etsap-tools/model-generators/times (accessed on 3 November 2019).
  66. Loulou, R.; Goldstein, G.; Noble, K. Documentation for the MARKAL Family of Models; International Energy Agency Energy Technology Analysis Programme (IEA-ETSAP): Paris, France, 2004. [Google Scholar]
  67. Loulou, R.; Remne, U.; Kanudia, A.; Lehtila, A.; Goldstein, G. Documentation for the MARKAL Model-Part I; IEA-ETSAP: Paris, France, 2005. [Google Scholar]
  68. Egyptera. Integrated Sustainable Energy Strategy to 2035; Egyptera: Cairo, Egypt, 2015.
  69. Billari, F.C.; Fent, T.; Prskawetz, A.; Scheffran, J. (Eds.) Agent-Based Computational Modelling. Applications in Demography, Social, Economic and Environmental Sciences; Physica-Verlag HD: Berlin, Germany, 2006; ISBN 978-3-7908-1640-2. [Google Scholar]
  70. Gilbert, G.N. Agent-Based Models; Quantitative Applications in the Social Sciences; Sage Publications: Los Angeles, CA, USA, 2008; ISBN 978-1-4129-4964-4. [Google Scholar]
  71. Macal, C.; North, M. Introduction to Agent-Based Modeling and Simulation; Argonne National Laboratory: Chicago, IL, USA, 2006.
  72. BenDor, T.K.; Scheffran, J. Agent-Based Modeling of Environmental Conflict and Cooperation; Taylor & Francis: Boca Raton, FL, USA, 2018; ISBN 978-1-138-47603-5. [Google Scholar]
  73. Shaaban, M.; Scheffran, J.; Böhner, J.; Elsobki, M.S. Energy Landscape Transition Analysis and Planning in Egypt (ELTAP-Egy). 2018. Available online: https://doi.org/10.25937/zre0-r244 (accessed on 29 December 2018).
  74. Shaaban, M.; Scheffran, J.; Böhner, J.; Elsobki, M.S. A Dynamic Sustainability Analysis of Energy Landscapes in Egypt: A Spatial Agent-Based Model Combined with Multi-Criteria Decision Analysis. J. Artif. Soc. Soc. Simul. 2019, 22. [Google Scholar] [CrossRef]
  75. Egyptera. Energy Strategy in Egypt: TIMES-Egypt Updated Model Results; Egyptera: Cairo, Egypt, 2017.
  76. Loulou, R. Documentation for the TIMES Model—Part I; International Energy Agency Energy Technology Analysis Programme (IEA-ETSAP): Paris, France, 2016. [Google Scholar]
  77. Barbati, M.; Bruno, G.; Genovese, A. Applications of Agent-Based Models for Optimization Problems: A Literature Review. Expert Syst. Appl. 2012, 39, 6020–6028. [Google Scholar] [CrossRef]
  78. Tash, A.; Ahanchian, M.; Fahl, U. Improved Representation of Investment Decisions in the German Energy Supply Sector: An Optimization Approach Using the TIMES Model. Energy Strategy Rev. 2019, 26, 100421. [Google Scholar] [CrossRef]
  79. Lund, H.; Arler, F.; Østergaard, P.; Hvelplund, F.; Connolly, D.; Mathiesen, B.; Karnøe, P. Simulation versus Optimisation: Theoretical Positions in Energy System Modelling. Energies 2017, 10, 840. [Google Scholar] [CrossRef]
  80. Bonabeau, E. Agent-Based Modeling: Methods and Techniques for Simulating Human Systems. Proc. Natl. Acad. Sci. USA 2002, 99, 7280–7287. [Google Scholar] [CrossRef] [PubMed] [Green Version]
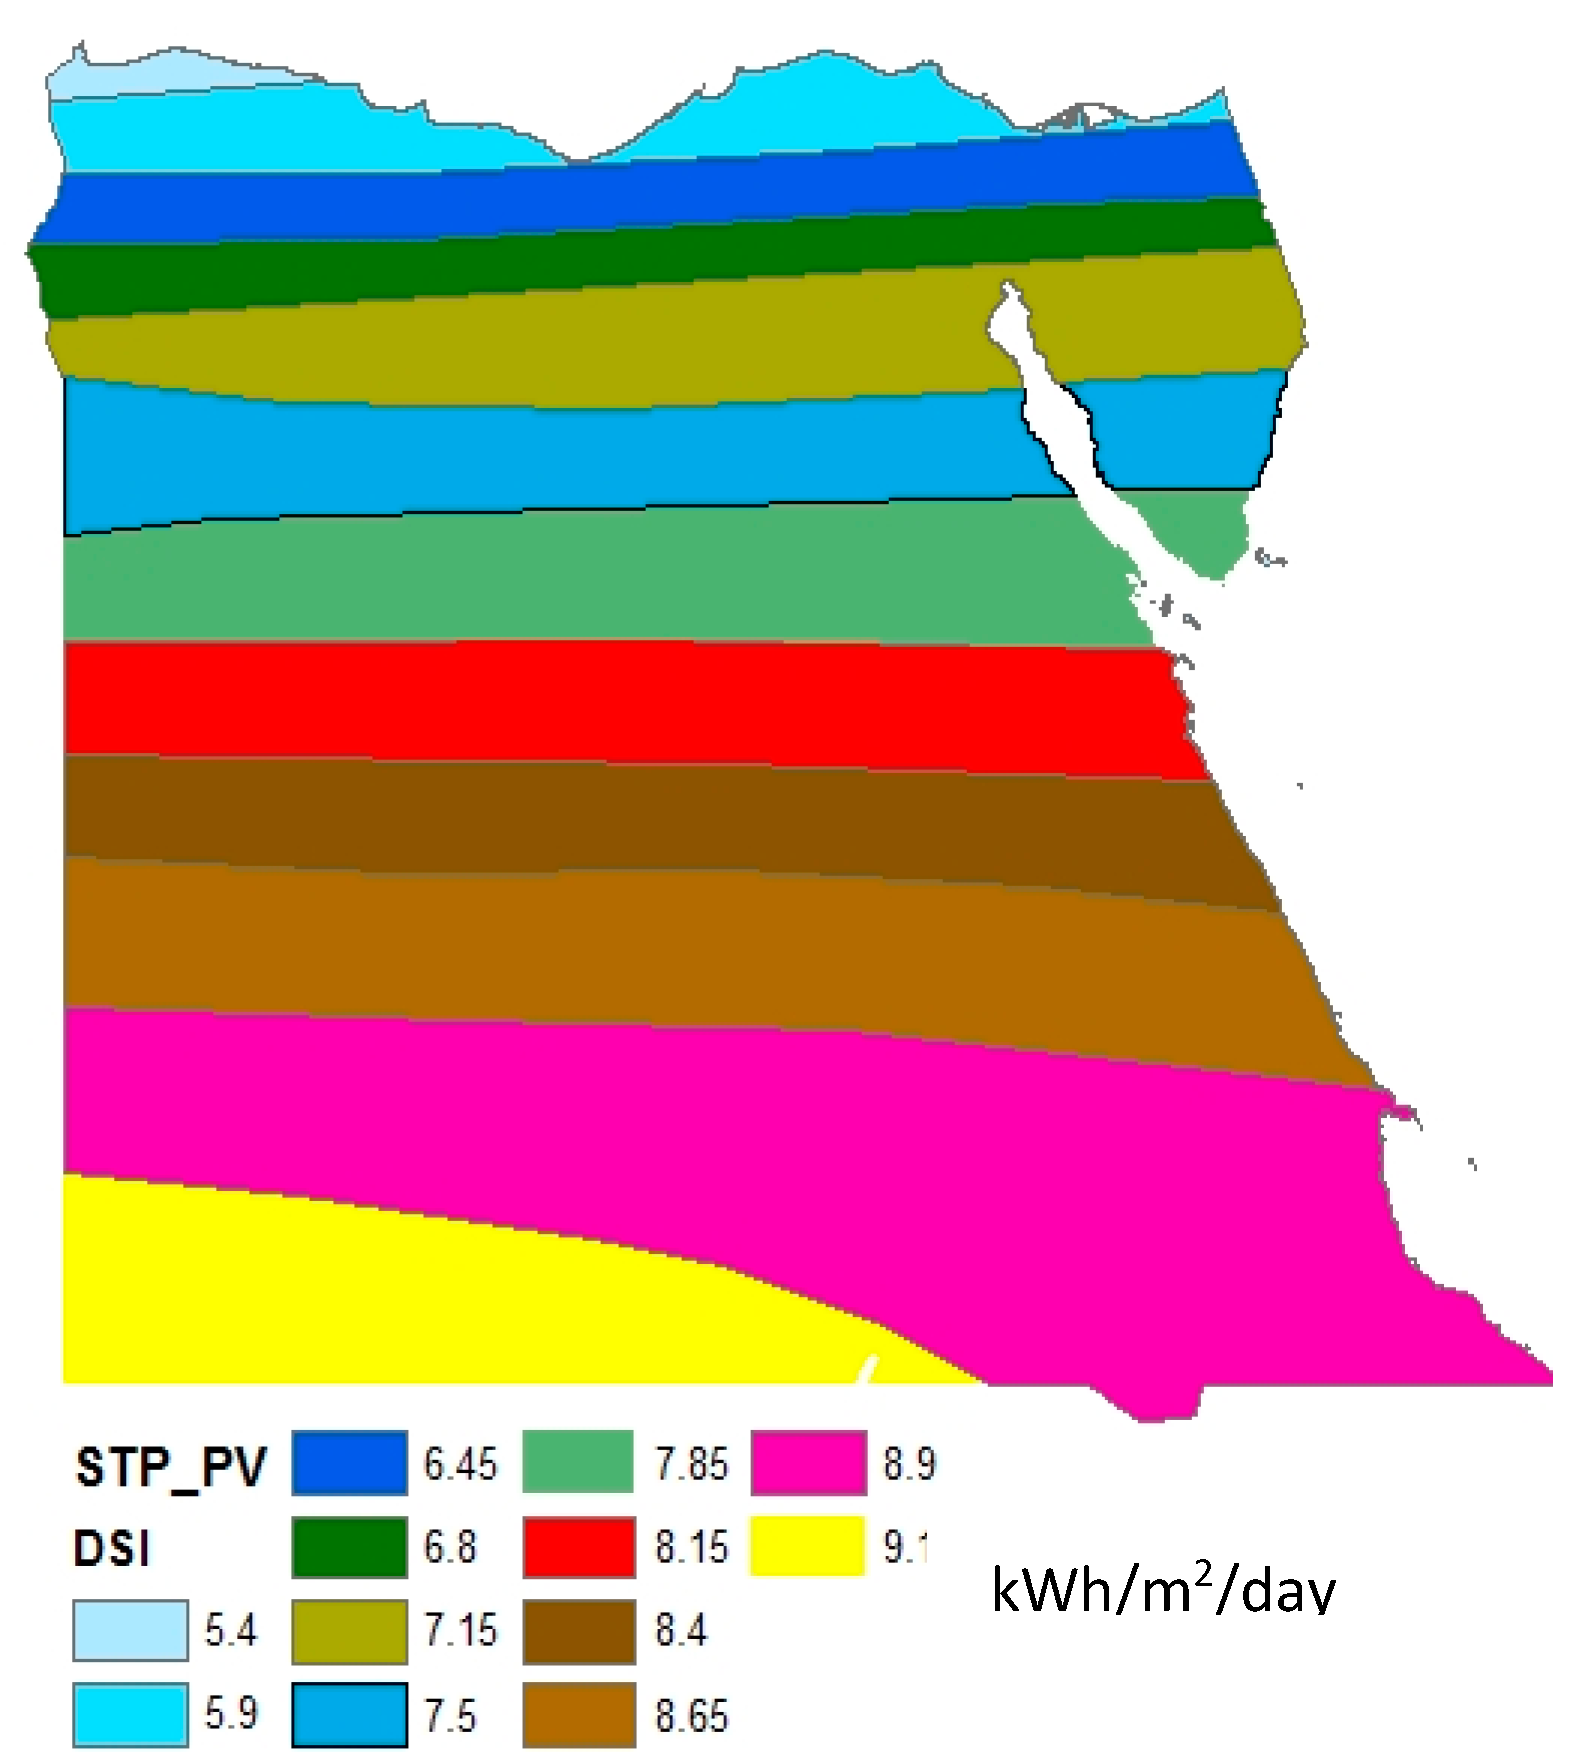
Figure 1. An overview of natural gas (NG) power plants locations in Egypt [32].
Sustainability 14 01563 g001
Figure 2. An overview of natural gas pipeline grid across Egypt [33].
Sustainability 14 01563 g002
Figure 3. Solar atlas of Egypt DNI (Adapted from [35]).
Sustainability 14 01563 g003
Figure 5. Planned sites for wind and solar projects in Egypt [45].
Sustainability 14 01563 g005
Figure 6. A comparison of the percentage of different technologies in the energy mix scenarios based on installed capacity for the year 2020 from both modeling approaches, TIMES (left) and ELTAP-EGY (right) (Source: based on data obtained from [68,73,75]).
Sustainability 14 01563 g006
Figure 7. A comparison of the installed capacity of different technologies in the energy mix scenarios for the year 2020 from both modeling approaches, TIMES (below) and ELTAP-EGY (above) (Source: based on data obtained from [68,73,75]).
Sustainability 14 01563 g007
Figure 8. A comparison of the deviations of installed capacity for different technologies in the energy mix scenarios from the current electricity mix for the year 2020 from both modeling approaches, TIMES (left) and ELTAP-EGY (right) (Source: based on data obtained from [68,73,75]).
Sustainability 14 01563 g008
Figure 9. A comparison of the percentage of different technologies in the energy mix scenarios based on installed capacity for the year 2035 from both modeling approaches, TIMES (left) and ELTAP-EGY (right) (Source: based on data obtained from [68,73,75]).
Sustainability 14 01563 g009
Figure 10. A comparison of the installed capacity of different technologies in the energy mix scenarios for the year 2035 from both modeling approaches, TIMES (below) and ELTAP-EGY (above) (Source: based on data obtained from [68,73,75]).
Sustainability 14 01563 g010
Table 1. Resource potential of electricity supply technologies in Egypt [42,43].
Resource PotentialCoal *NG *WindCSPPVBiomassNuclear *
TWh/y0.4190,588.24765073,6563615.3536.47
* Calculated for the period [2015–2100].
Table 3. Planned solar and wind projects in Egypt [45].
ZoneArea (km2)Capacity (MW)
Suez Gulf (wind)12203550
East NileWind8415800
Solar129034,900
West NileWind363625,350
Solar60617,400
Benban (solar)371800
Kom Ombo (solar)7260
Table 4. A summary of the timeline of installed capacity for different electricity supply technologies and the planned targets during the years 2009–2019 (“+” means to be added; years between brackets refer to the target year) [18,20,35,36,37,49,50,51,52,55,59,60].
Actual StatePlanned Targets
YearGE (TWh/y)IC (GW)RE % ***Hydro
(MW)
Wind
(MW)
PV
(MW)
CSP
(MW)
RE%HydroWindPVCSPCoalNuc-lear
200913121.311.9%2800
11.2%
430
0.7%
10 * -20%
(2020)
(+)32 MW
(2016)
8%
(2020)
7200 MW
12%
(2020)
20 MW (2017)20 MW
(2010)
120 MW
(2017)
--
201013922.710%2800
9.2%
490
0.8%
---------
201114723.59.9%2800
8.9%
547
1.01%
-20 **
34 GWh/y
-(+)32 MW
(2017)
-----
201215725.79.2%2800
8.2%
547
0.97%
-2020%
(2020)
6%
(2020)
12%
(2020)
2% solar
(2020)
--
700 MW
(2027)
2800 MW
(2027)
201416826.18.8%2800
8%
547
0.8%
-20--(+)250 MW----
201517535.28.7%2800
7.9%
547
0.8%
-2020%
(2022)
-1890 MW
(2019)
+970 MW
2580 MW
(2018)
(+)100 MW-5 GW
(2022)
201618638.98.4%2800
7.3%
747
1.1%
30 *20-(+)32 MW
(2017)
7200 MW
(2022)
(+)500 MW
(+)2000 MW (Fit)
(+)400 MW(+)100 MW--
(+)2300 MW (Fit)
2017189.5457.96%2800
6.8%
747
1.16%
30 *20- (+)2400 MW(+)1070 MW(+)400 MW(+)100 MW(+)2640 MW
(+)6600 MW
(2027)
2018196.855.27.73%2832
6.5%
967
1.2%
44.2 *
50
0.03%
20 -(+)2610 MW
(2023)
(+)2000 MW
(+)20 MW
(+)26 MW
2019199.858.4-28321127 14652042% (2035) (+)2650 MW(+)1196 MW(+)100 MW
2020197.459.5-2832138514912042% (2035) (+) 500 (2023)(+) 400 MW
* Not considered in the total electricity supply (decentralized off-grid). ** The whole capacity of the power plant is 140 MW, integrated solar combined cycle with a share of 20 MW solar. We consider here the solar share to be only 0.023 × 10⁻³%, which is negligible for inclusion in the whole renewables share. *** The RE % is based on installed capacity.
Table 5. Classification of existing energy models [61,62,63,64].
Modeling MethodologyCharacteristicsExamples
Top-Down Energy Models
Computable general
equilibrium (CGE)
It considers the whole economy and determines the equilibrium across all markets. It identifies important economic parameters endogenously.GEM-E3; GTAP; SNOW
System dynamicsIt explains the behavior of an interacting social system due to the assumed interdependencies, taking into consideration the dynamic changes over time of different components that represent the defined system. It is made up of flows, stocks, central components of the defined system, and feedback loops represented by non-linear differential equations.POLES; ASTRA
Bottom-Up Energy Models
Partial equilibriumIt emphasizes balancing the economy of only one market, which would be the energy or electricity market.MARKAL; ETM
SimulationIt allows testing of various topologies of systems and their impacts. Scenarios can be developed. REEPS; WEM; MURE
Game theory A type of simulation model focusing on the interaction of players in the energy market. Cournot; Bertrand; Supply Function Equilibria
Accounting framework simulationIt accounts for the physical and economic flows of the energy system, specifically the outcomes of the assumed development in a descriptive or prescriptive manner. It is commonly applied to project future energy demand and related emissions of final energy sectors.LEAP; BUENAS; MAED
Agent-basedA specific case of simulation model in which actors participating in the decision-making process are explicitly represented as agents having distinct behavior and objectives.EMlab-Generation; PowerACE; ELTAP
OptimizationThe aim of this model is to optimize a given quantity which is usually related to the system operation or investment or several aspects simultaneously.MARKAL; TIMES; MESSAGE
Linear programmingThis is an example approach of optimization methodology with an objective function to be maximized or minimized and subject to a set of constraints. Temoa; PyPSA: OSeMOSYS
Mixed integer linear
programming
This is another optimization approach which forces certain variables to be integral.SWITCH; StELMOD
Mixed integer
quadratically
constrained programming
An optimization approach in which both the objective functions and the constraints are quadratic. EUCAD
Covariance matrix adaptation evolution strategyThe optimal solution can be approximated.GENESYS
Heuristic
optimization
They do not necessarily find the optimum solution.GENESYS; iHOGA
Hybrid Energy Models
Non-linear programmingAn optimization approach with non-linear characteristics of the objective functions.ReMIND
Mixed integer
programming
See aboveBALMOREL
Partial equilibriumSee abovePOLES; PRIMES; GCAM
SimulationSee aboveWEM
Table 6. Comparison of five scenarios of the TIMES model for the future energy mix in Egypt [68].
ScenariosOil and NGCoalNuclearRenewables *Subsidies
Baseline scenario: Business as usual (BaU)Employ the most likely forecast for indigenous productionInstalled after 2020Apply the current national program for nuclear energyAdd not more than 1 GW of PV, 1 GW of wind, and 400 MW of CSP per yearKept constant until 2035,
reduced by 50% until 2020, and removed by 2025
Scenarios 1: Different renewable development
policy
Same as BaUAvailableAvailableThree sub-scenarios:Same as BaU (b)
20% Target ScenarioDelayed Reference Scenario of the Combined Renewable Energy Masterplan (CREMP)Minimum Fuel Scenario of the CREMP
Scenario 2: Delayed development and high-energy-efficiency policySame as Scenarios 1Same as Scenarios 1Delayed by five yearsThree measures:The same as Scenarios 1
Same as Scenario 1 (b)Introduction of higher rates of energy efficiencyDeployment of policy measures to promote more efficient equipment and behavioral changes
Scenario 3: High renewables policyNot specifiedNot includedNot includedHigh penetration policyNot specified
Scenario 4: Least cost policyAll resources compete based on their relative cost. Available(a) free to compete
(b) enforcing two operating units in 2025, the third in 2026, and the fourth in 2027.
-
Set as an upper bound of Scenario 1 (c);
-
High-energy-efficiency measures are available.
Eliminated by 2020
* The grey-shaded cells belong to the renewables column; the bold style of the first column identifies the name of the scenarios in which each technology in the other five columns is planned. The bold style in the fifth column is a subheading.
Table 7. Comparing the two modeling approaches [73,76].
CriteriaTIMES-EGELTAP-EGY
PurposeThe model is used for the exploration of possible energy futures based on contrasted scenarios in Egypt.The model simulates spatial behavioral adaptation of actors’ priorities of investments in future electricity technologies. These priorities are then allocated to the predicted electricity demand.
Modeling
methodologies
-
Linear programming
-
Optimization
-
Partial equilibrium
-
Multi-criteria decision analysis (MCDA)
-
Agent-based modeling (ABM)
-
Geographic information system (GIS) visualization
-
Game theory
-
Simulation
Availability for use20082018
Accessibility to
the model
The source code for model generator is available free of charge upon providing a signed copy of the ETSAP Letter of Agreement to the ETSAP Operating Agent.Free to download from the website of CoMSES Net (Network for Computational
Modeling in the Social and Ecological Sciences)
Computer
programming language
GAMSNetlogo 5.3.1
Temporal scale2010–20352015–2100
Temporal resolution5 years1 year
Stakeholder
involvement
They identified different future scenarios to be considered as constraints for the model.They took part in identifying their preferences of the criteria that were utilized for the assessment of the technologies which reflect their decision behaviors in selecting a future technology.
The social acceptance of the technologies has been considered through citizens’ participation in a survey.
Technology assessment parametersOnly technical and economicIt involves multiple sustainability dimensions (i.e., technical, economic, environmental, and social).
Spatial allocation of technologiesNot consideredThe model ranks spatial units within the case study for the installation of a specific technology.
Case studiesMulti-regionalThe model has been applied only to Egypt and its spatial units.
Demand predictionEmbedded in the modelCalculated separately
ScopeCovers all energy sectorsAddresses only the electricity sector
Scope of technologiesBiomass is not included.
Combustion-type power plants have been specified for oil and natural gas (i.e., steam turbine, combined cycle, gas turbine, combined heat and power).
Biomass is included.
Natural gas- and oil-fired plants have been considered without specifying turbine type.
Behavior of actorsAssumed to be optimalActors have an adaptive, unique behavior.
Difficulty of data collection and availabilityLow, since it focuses on technical and economic inputs that are mostly availableHigh, since it involves the social and environmental dimensions as well as the preferences of different stakeholders
Complexity of the model and execution timeLow to mediumMedium to high
Exploitation of
the results
Already in use by the governmentFor research purposes only
Publisher’s Note: MDPI stays neutral with regard to jurisdictional claims in published maps and institutional affiliations.

