Article

Particulate Matter (PM2.5 and PM10) Concentration of Subway Transfer Stations in Beijing, China

1
Mechanical Engineering College, Tianjin University of Commerce, Tianjin 300134, China
2
Research Centre for Fluids and Thermal Engineering, University of Nottingham Ningbo China, Ningbo 315100, China
3
Department of Mechanical Engineering, Faculty of Engineering, Universiti Malaya, Kuala Lumpur 50603, Malaysia
4
Beijing Key Laboratory of Green Built Environment and Energy Efficient Technology, Beijing University of Technology, Beijing 100124, China
5
Key Laboratory for Comprehensive Energy Saving of Cold Regions Architecture of Ministry of Education, Jilin Jianzhu University, Changchun 131118, China
*
Authors to whom correspondence should be addressed.
Sustainability 2022, 14(3), 1552; https://doi.org/10.3390/su14031552
Submission received: 14 December 2021 / Revised: 17 January 2022 / Accepted: 25 January 2022 / Published: 28 January 2022
(This article belongs to the Special Issue Green Energy and Sustainable Development)

Abstract

:
Although much research is being conducted on the characteristics of PM2.5 and PM10 at subway stations, there is no research focusing on a complex subway transfer station. In this paper, the characteristics of PM2.5 and PM10 at transfer stations are studied. For comparison, monitoring is performed under different outside conditions at four different transfer stations in the non-peak period during March 2018. The concentrations of PM2.5 and PM10 on the platform in the transfer stations is approximately 10 μg/m3 lower than in the non-transfer station, when outside PM2.5 is lower than 150 μg/m3. However, the ratio of PM2.5 to PM10 at the transfer stations (lowest: 78.1%) is higher than at the non-transfer station (lowest: 61.2%), indicating that the PM10 content differs from the non-transfer station. In a transfer station with the same depth, the PM concentration is the same or similar. In addition, the concentration of PM2.5 at subway stations has a strong correlation with the outside environment (R2 = 0.897), which indicates that an outside condition is important for the subway environment.

1. Introduction

1.1. Background

During China’s recent major urbanization, increased traffic created significant problems in large-and medium-sized cities. One issue is that commuting by subway greatly affects personal exposure to inhalable particulate matter. The particulate matter PM2.5 and PM10 can remain trapped in the human trachea and bronchi and can be swallowed or discharged from the respiratory system by coughing (Figure 1). However, the fine particulate matter PM2.5 can easily enter the alveolar of the lungs and move directly into the blood [1]. Many epidemiological studies conducted in recent decades have shown that there is a positive correlation between particulate matter concentration and morbidity from diseases of the respiratory system, heart and lungs, especially for more vulnerable populations such as children and the elderly [2,3].
People are spending more and more time in the subway in the modern world [4]. For example, Koreans are reported to spend approximately 1.73 h a day in the subway [5]. Several researchers have found that high concentrations of PM2.5 and PM10 in long-term exposure in the subway will seriously harm human health [6,7]. A few results have shown that the danger of PM2.5 in the subway is up to ten times higher than at ground level [2,8]. Consequently, there is a strong need and demand to study the characteristics of PM2.5 and PM10 at subway stations.

1.2. Recent Developments

Researchers have concentrated on over 10 countries with large cities with a large number of passengers who take the subway every day. These cities include Montreal [9], New York [10], Los Angeles [11], Puna [12], Mexico City [13,14,15], Stockholm [16], Helsinki [2], London [17], Birmingham [18], Paris [19,20], Barcelona [21], Milan [22], Istanbul [23], Tehran [24], Seoul [25,26], Shanghai [27,28], Beijing [29,30], Guangzhou [31], Xi’an [32], Suzhou [33], Tianjin [34] and Taipei [35]. Pun et al. [36] reported that mortality would increase by 1.5% when the average concentration of PM2.5 increased by 10 μg/m3. Several researchers have reported that the concentration of particles in the subway was much higher than the outside environment and that they were more toxic to genes, which could cause more serious public health problems [37]. Lepeule et al. [38] measured particle concentrations in six different cities over eight years in eastern America. They then analyzed the correlation between mortality and particle size and found that the correlation between mortality and PM2.5 was strong. There are now many studies that have measured particles in public transportation, including subways and buses [2,6,10,29,30]. However, many studies in the past have measured particles only for a short time, which has led to incomprehensive conclusions [28,29,30,31,32,33,34,35,36,37]. For example, they assumed that outside conditions, construction, subway station depth and environmental control systems affected the concentration but did not obtain data to support their assumption.
On the other hand, there are several studies that focus on the distribution and control of PM at subway stations in China. China is now building thousands of kilometers of subway systems in large- and medium-sized cities [39]. The increase in subway transportation has created a significant need to investigate air quality problems in local subway stations. The Chinese indoor air quality standard sets 75 μg/m3 for the PM2.5 concentration limit in a building but the subway station is excluded because there are not enough data and relevant analyses on PM.
In addition, most existing studies have focused on non-transfer stations. Compared with non-transfer stations, although the number of transfer stations is much smaller, the flow of passengers is much higher and the structure is very complex. It cannot be concluded whether the concentration characteristics in transfer stations are the same as in non-transfer stations. Therefore, it is necessary and meaningful to study the characteristics of PM2.5 and PM10 at transfer stations. To better understand transfer stations, common types of transfer stations are introduced.

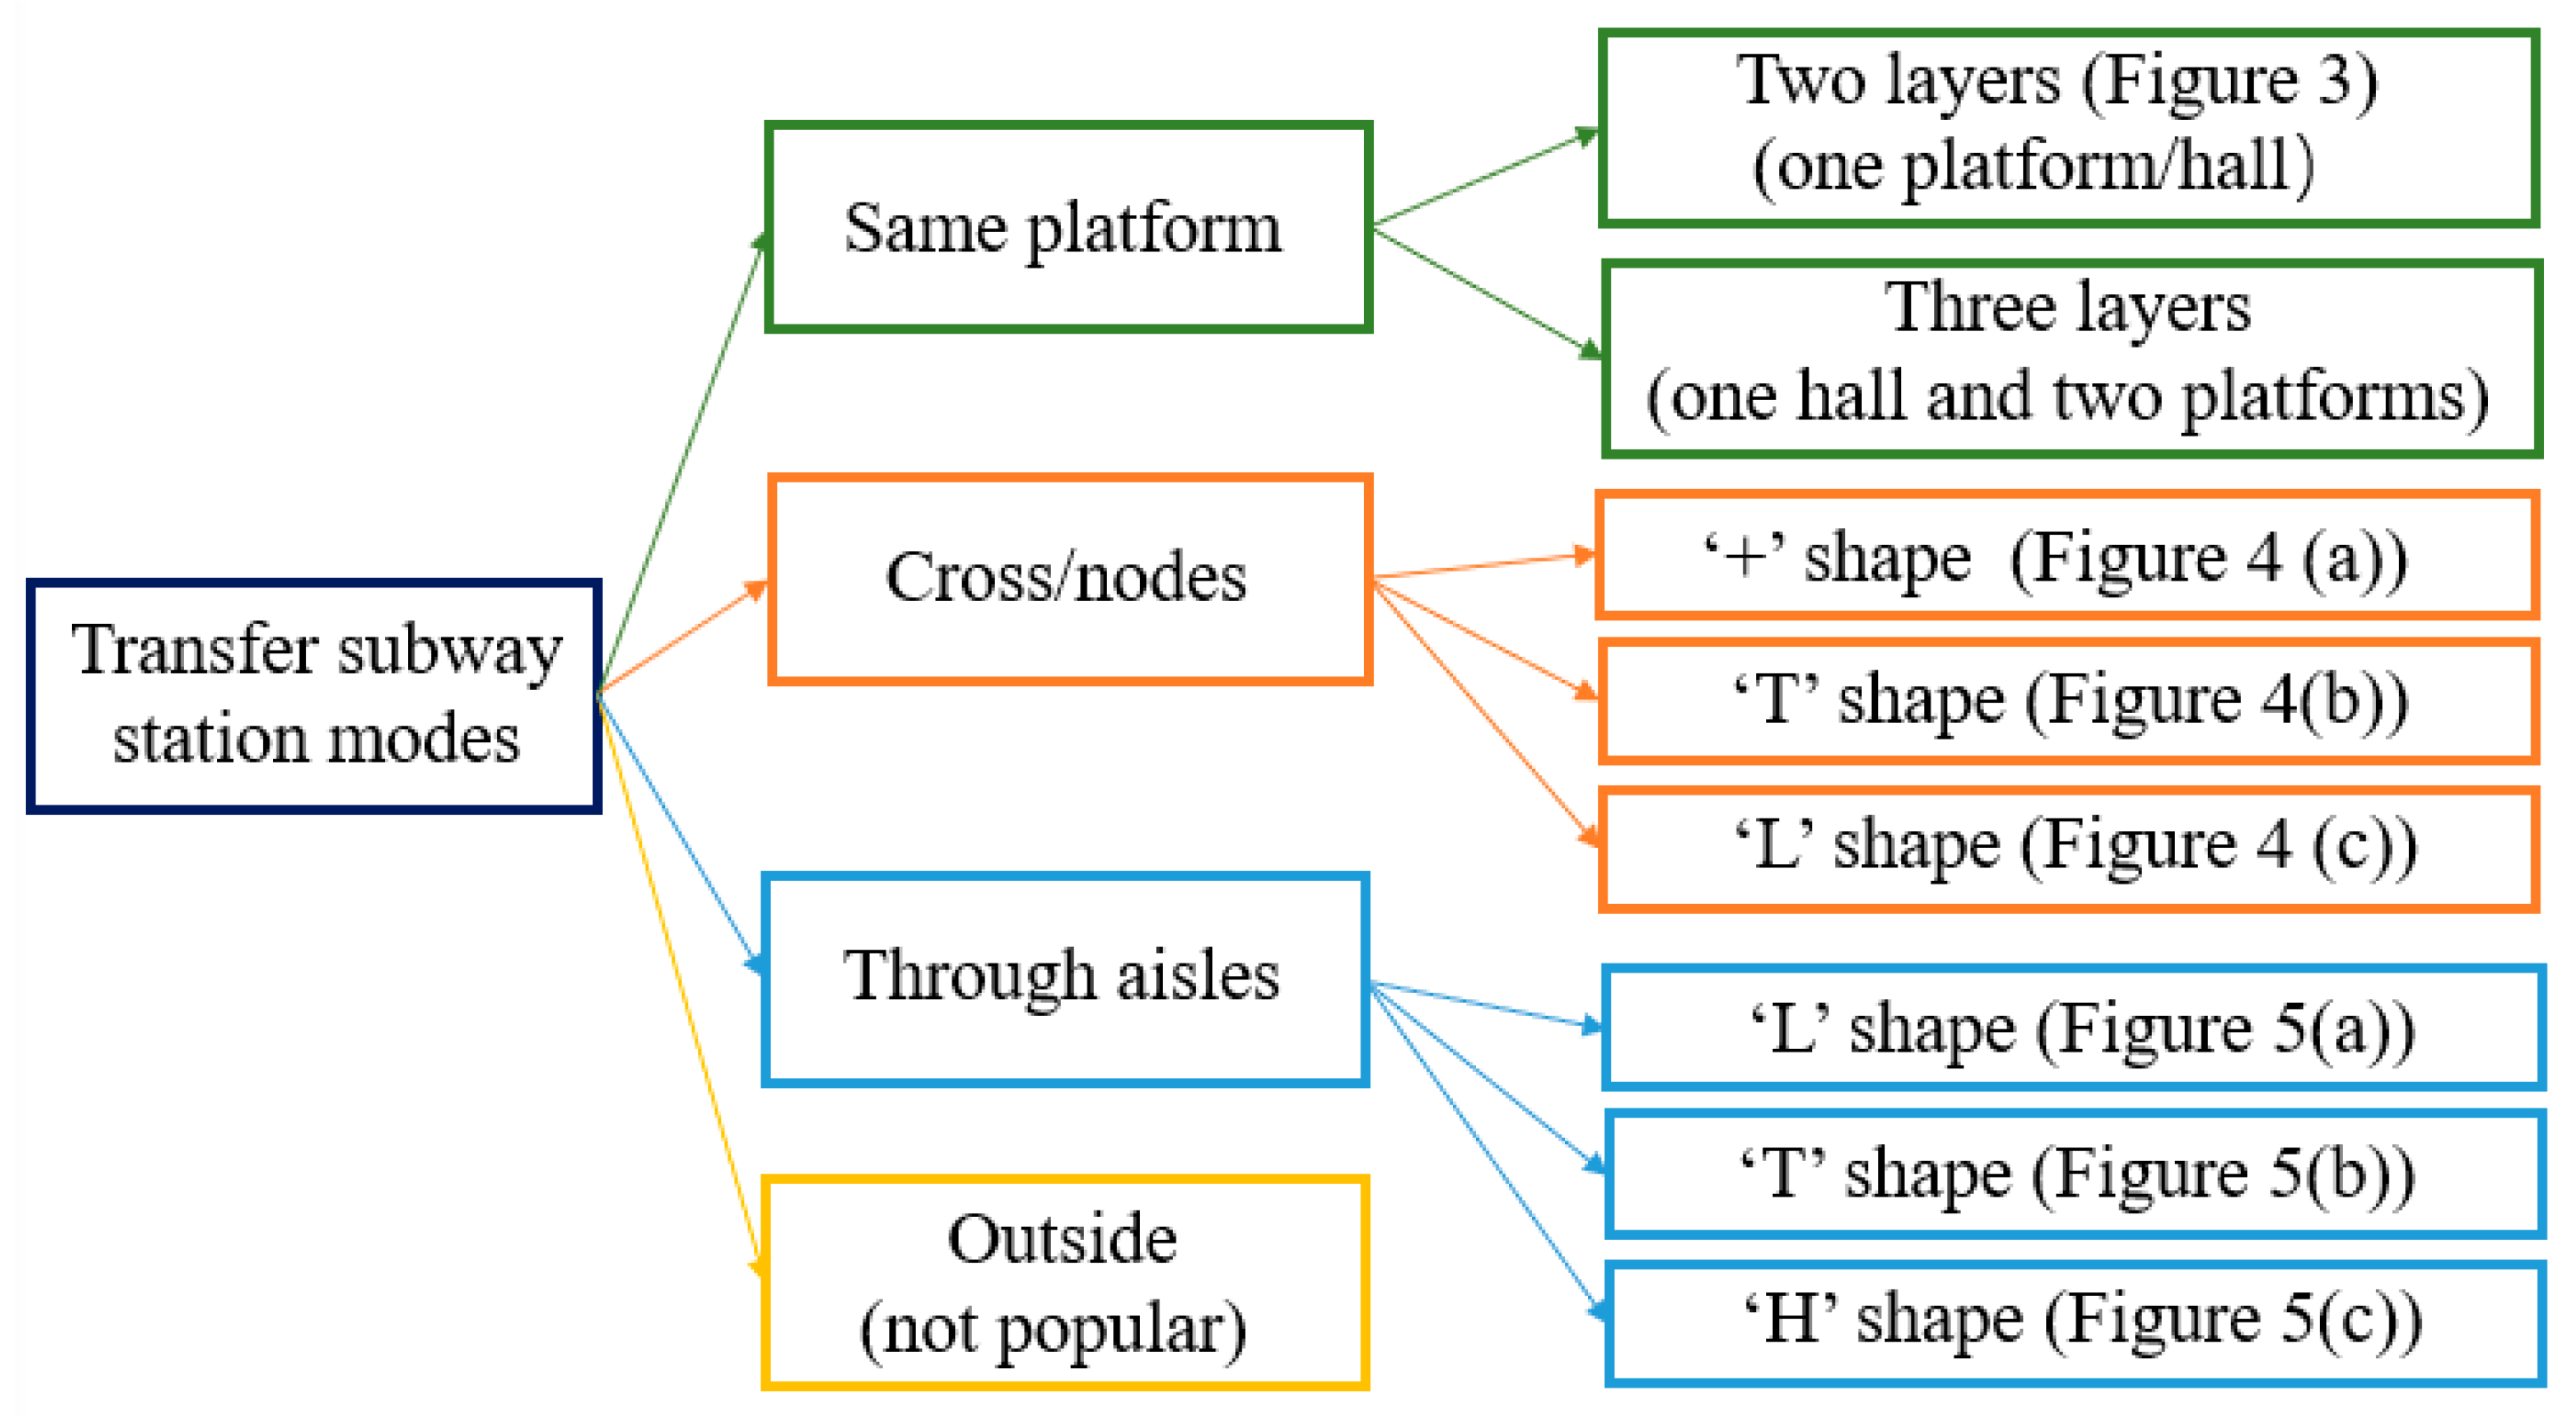
1.3. Types of Transfer Stations

Typical modes of subway transfer stations include four types (single platform, cross transfer, transfer through aisles and external transfer) (Figure 2). In Figure 2, the labelled numbers of Figure 3, Figure 4 and Figure 5 represent the example that these different types can refer to. The flow of passengers at a subway transfer station is usually higher than at a non-transfer station. For safety reasons and time savings, most transfers are underground and passengers do not have to re-swipe.
Transfer through one platform is mainly used for two parallel lines and the platform should be in the island mode (Figure 3).
The second mode is cross transfer or node transfer. Based on the node type, it can be divided into different shapes. Common shapes include ‘×/+’, ‘L’ and ‘T’, which are shown in Figure 4. The biggest difference between the shapes of the types shown in Figure 3 and Figure 4 is the environmental control system in the subway. For subway transfer stations with the same platform, the environmental control system of most stations should take into account the impact of different lines on the platform except for a few stations with different hall layers. However, although the two transfer subway stations connected via cross/node types have links in the same hall, the environmental control system on the platform is completely independent and they do not affect each other.
The third mode is the transfer through aisle. In this mode, the stations on the two lines are connected through an aisle. This mode is easy to build but it is inconvenient for passengers because they need to walk further. According to the shape of the aisle, this mode can be divided into ‘L’, ‘T’ and ‘H’ shapes (Figure 5).

1.4. Research Gap and Main Aims

We know that transfer stations are more complex; however, almost all research is conducted on non-transfer subway stations. As passenger traffic increases, transfer stations are playing an increasingly important role. As the construction has a significant impact on the characteristics of PM2.5 and PM10 [6,18], their characteristics at transfer stations should be different compared with non-transfer subway stations but this is still not clear. Owing to difficulties in performing measurements such as limited measurement periods and equipment that cannot operate automatically, the existing studies were conducted only for a short time (e.g., a few days or a few weeks) and several studies even measured particles at only one location in the subway station.
In this paper, we mainly aim to fill the above-mentioned research gap by investigating the characteristics of PM2.5 and PM10 at transfer stations. The measurement was performed for two hours during one month with many facilities. The characteristics of PM2.5 and PM10 concentrations on the transfer stations are presented and the differences between transfer stations and non-transfer stations are obtained [32].

2. Materials and Methods

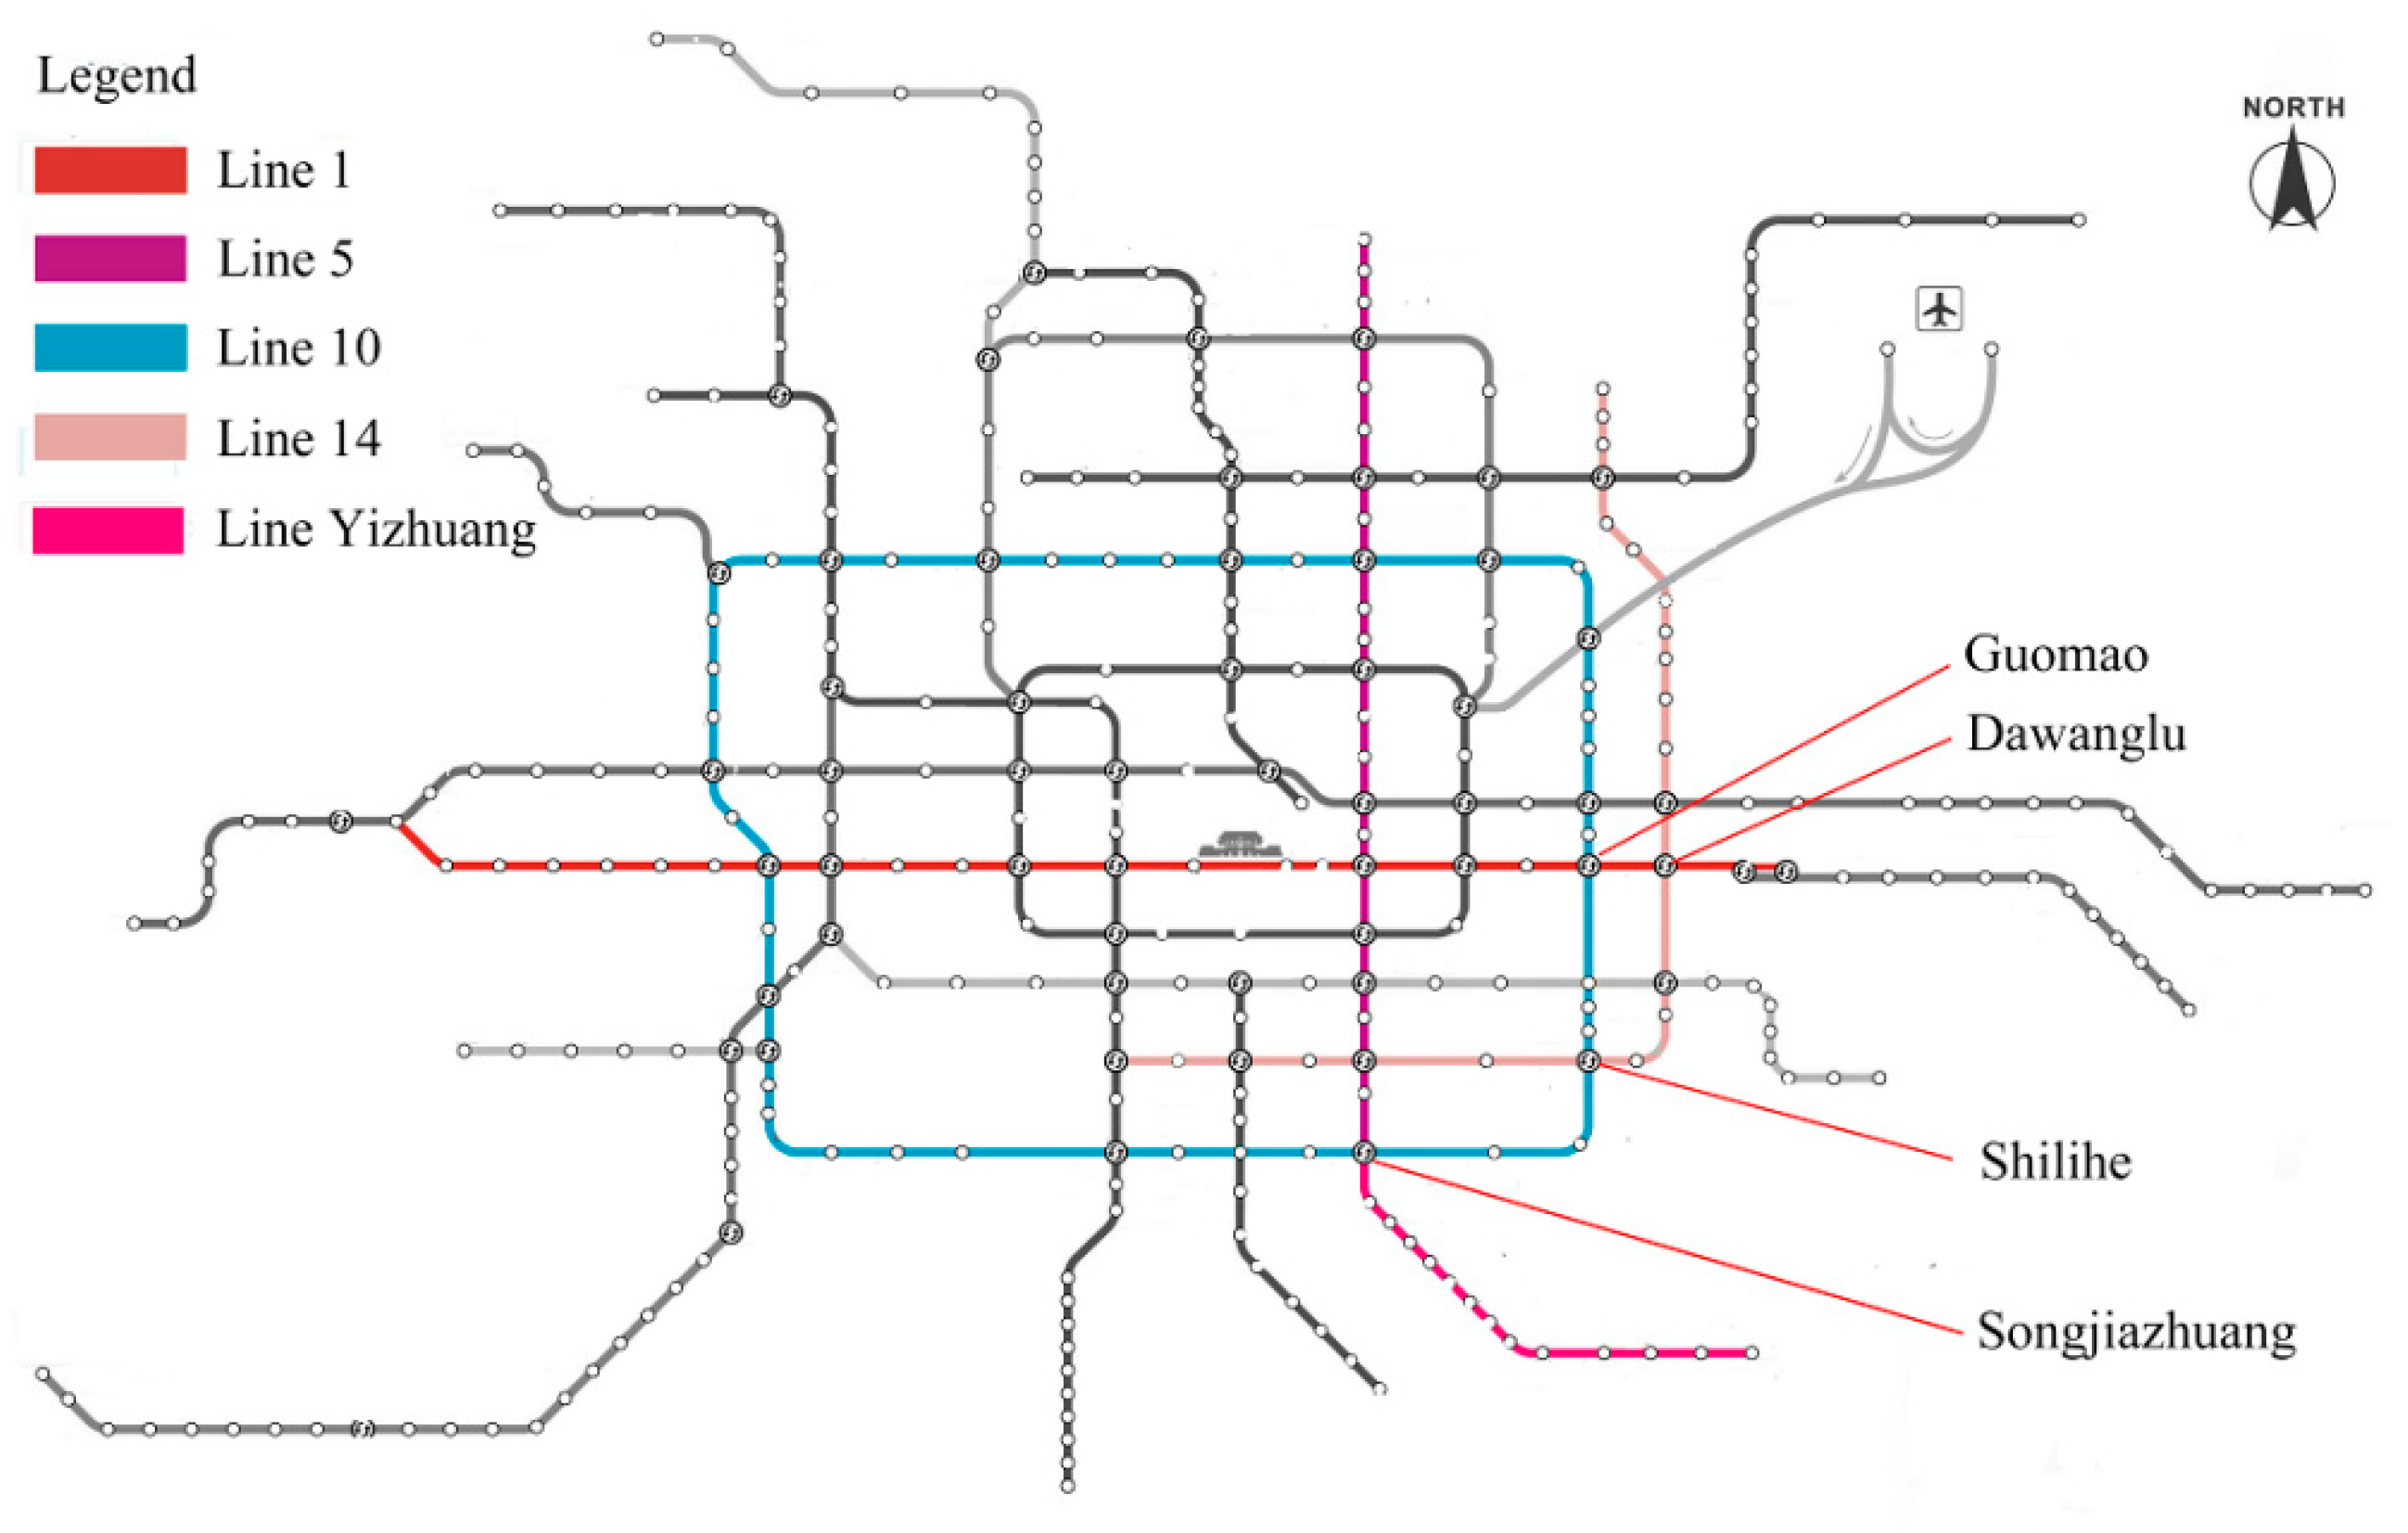
2.1. Monitored Stations

In this paper, transfer through aisle stations Guomao (GM), Shilihe (SLH) and Dawanglu (DWL) and transfer on the same platform with Songjiazhuang (SJZ) station were selected as the monitoring stations (Figure 6). The GM station is the intersection of Line 1 (opened in 1999) and Line 10 (opened in 2008). DWL is a cross station of Lines 1 and 14 (opened in 2015). Both shapes of the transfer aisle are ‘L’ (Figure 5a). SLH is a cross station between Lines 10 and 14 and the shape of the transfer aisle is ‘H’ (Figure 5c). All platforms are islands. SJZ station is the node of Lines 5 and 10 as well as the Yizhuang Line. The platform on Line 5 is a side mode and the Yizhuang Line is vertically connected to Line 5 on the south side (Figure 3). Line 10 is parallel to Line 5, which is located north of Line 5.

2.2. Measurement Equipment and Parameters

A portable Dusttrak II aerosol monitor (Model 8532, TSI, USA) as shown in Figure 7 was used to monitor the PM10 and PM2.5 concentrations, temperature and humidity. Such equipment includes data logging and a light-scattering laser photometer for real-time aerosol mass readings. The data logging interval was set to 1 min. The testing equipment was calibrated before the measurement.
For comparison, the measurements between the inside of the transfer station and the outside were simultaneous. The problem was that it was difficult to conduct measurements for a long time, especially during peak time, due to safety and management because measurements are prohibited during peak hours. Another difficulty was that we needed to measure the data in different locations at the same time, which required a lot of people and equipment. The above-mentioned transfer stations were monitored in the non-peak period (13:00 to 15:00 h) in March 2018.

2.3. Data Analysis Methods

The values of PM2.5 and PM10 concentrations were the average values of all the monitored sites. Based on Chinese standards [39], a total of six levels of air pollution was used based on the average value of the PM10 concentration in 24 h. The first level was excellent with a PM10 concentration range of 0–50 μg/m3. The second level was 50–100 μg/m3 and light pollution (100–150 μg/m3) was ranked as level 3. Moderate pollution and heavy pollution were 150–200 μg/m3 and 200–300 μg/m3, respectively. Situations above 300 μg/m3 represented serious pollution that belonged to level 6. To compare the internal subway pollution with the external atmospheric environment, we selected data that were under different levels of pollution. For a further analysis, the Statistical Package for Social Sciences (SPSS) was used to analyze the monitored data. A general linear model (GLM) was used to examine the effect of the outside environment on the subway.

3. Results and Discussion

3.1. Outside Environment

The measurement campaign was conducted in March 2018. The outside conditions are shown in Table 1. According to the standard [39], the days from 8–11 and 14 March as well as from 23–26 March were excellent days (pollution level 1) whereas 13 and 20 March were good days (pollution level 2). From 5–7 and 12 March as well as from 17–19 March had light pollution whereas 2, 15, 16, 21 and 22 March had moderate pollution. Days with heavy pollution and serious pollution included 1, 3 and 4 March. The temperatures ranged from 13.2 °C to 26 °C and the outdoor humidity varied from 5% to 39%. The variations in temperature and humidity were not as large as the PM2.5 pollution.

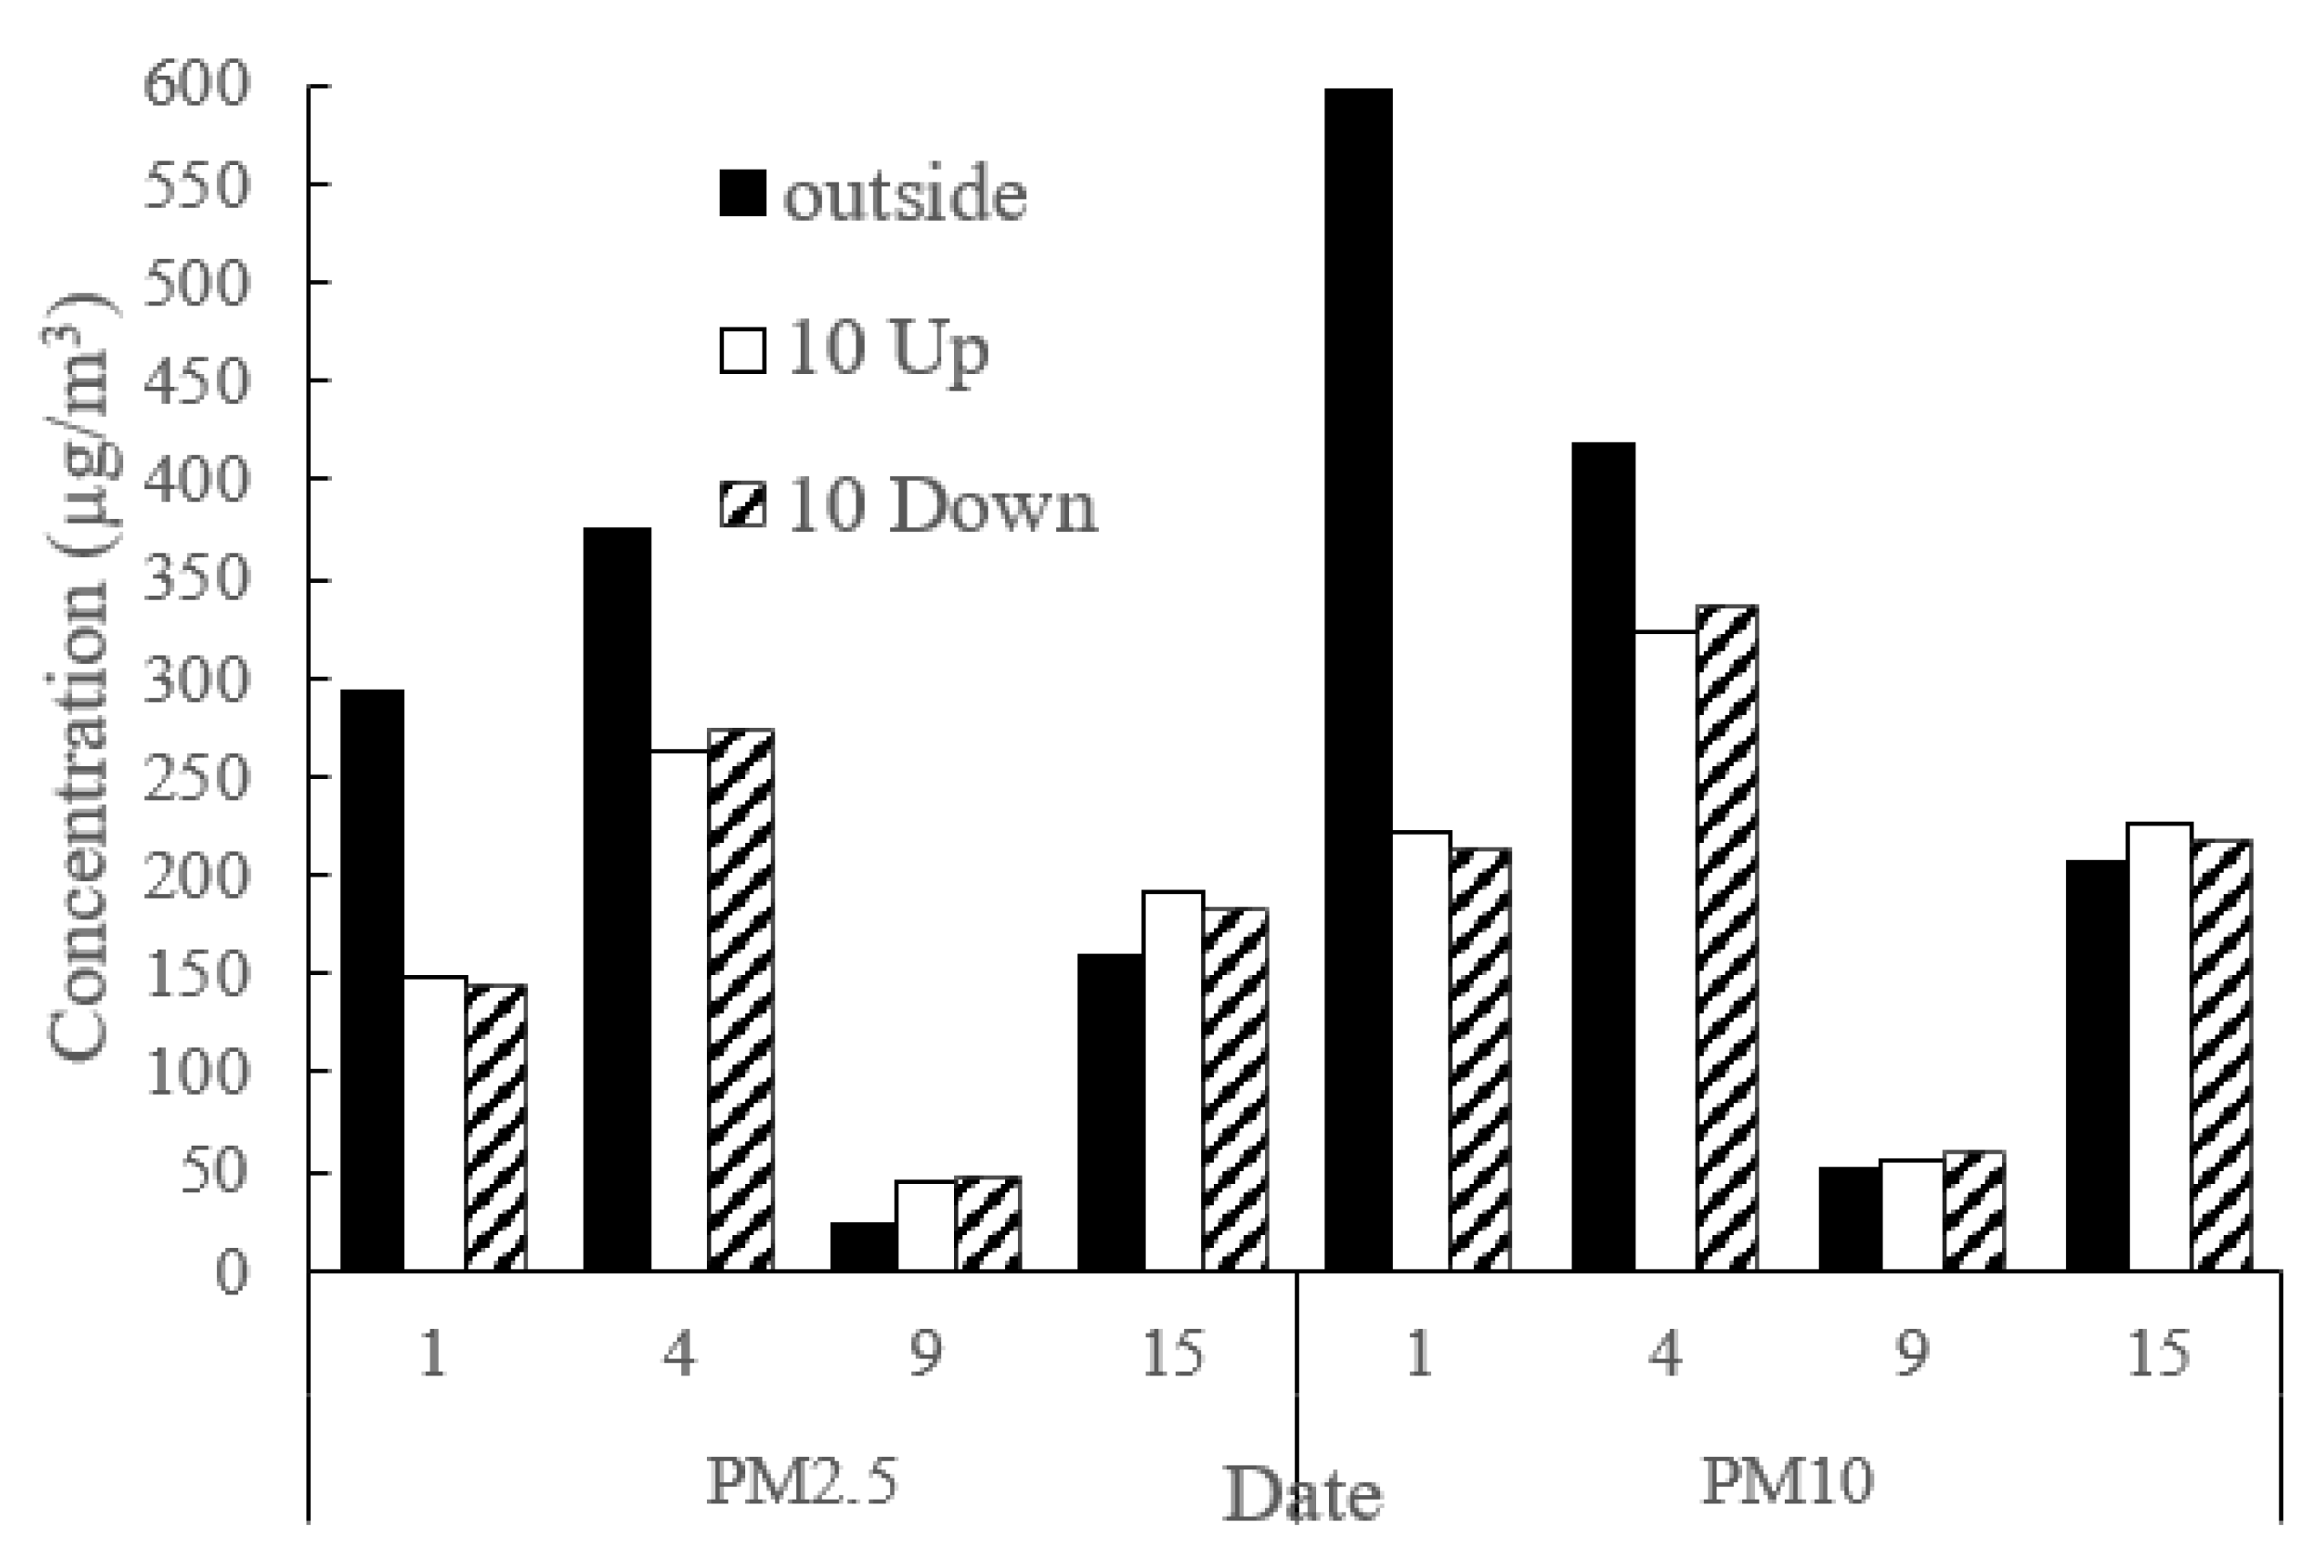
3.2. Transfer Station through Aisle

The results of the PM2.5 and PM10 concentration on the transfer station through aisle (GM, DWL and SLH) were presented and analyzed. The monitoring lasted for six days and the outside condition was good or excellent. The monitoring points were located on the platform in the aisle between the transfer station of two lines and on the carriage of three lines (Lines 1, 10 and 14). The results were the average of the values obtained at different monitoring points and their variance during the non-peak monitoring period.
The results are shown in Figure 8 and Figure 9. It was obvious that the pollution was more severe in the subway than outside when the outside condition was good (PM10 less than 100 μg/m3). There were several common characteristics of the particle concentration. First, the concentration of PM in the aisle was between the two transfer platforms regardless of the outside conditions. As the aisle was completely isolated from the outside, the environment in the aisle was under the combined influence of the transfer station on two lines. Second, the concentration at the transfer stations changed according to the outside conditions. The lowest daily PM2.5 concentration of 14 µg/m3 was registered on the GM (10) platform when the outside condition was very clean. On the contrary, the highest concentration of PM2.5 (204 µg/m3) was registered on the DWL (1) station during 22 March.
Along with the change of outside conditions, the pollution in the aisles had the same trend of change; i.e., when the outside concentration of PM2.5 decreased, the concentration in the aisles also decreased. For the aisles, when the outside environment was good or with a light pollution level, the aisle on line 14–1 had the highest concentrations of PM2.5 and PM10 whereas the aisle on line 1–10 had the lowest concentration. When the outside condition was excellent, the aisle 1–10 had the highest value among the three transfer stations whereas the aisle on line 10–14 had the lowest. Most concentrations of PM2.5 and PM10 in the aisles were higher than outside when the outside environment was lightly polluted. The variation in the ‘H’-shaped aisle (10–14) was less than approximately 15 μg/m3 relative to the ‘L’-shaped aisle (14–1 and 1–10). This may have been caused by the length of the aisle because the aisle at 14–1 and 1–10 was twice as long or more than the line at 10–14.
Figure 9 shows that the changes in particle concentrations on all platforms of transfer stations were in line with the outside conditions, which were the same as in the aisles. The difference was obvious on the platforms of one transfer stations and the difference was greater than on the platforms of different transfer stations. As factors such as passenger flow, outside conditions and environmental control systems were the same or similar, the above results may have been caused by the differences in construction between the different lines. Comparing the concentrations of PM2.5 and PM10 in different outside conditions, the highest pollution was registered on the platforms on Line 1 and the lowest on Line 10. From the aspect of the transfer station on Line 1, the pollution at DWL was higher than GM. On Line 14, the concentration at DWL was higher than SLH whereas on Line 10, SHL had a higher concentration than GM. For all platforms, the average concentration values at DWL (1) were the highest (177 µg/m3 on 21 March) whereas GM had the lowest value (14 µg/m3 on 24 March).

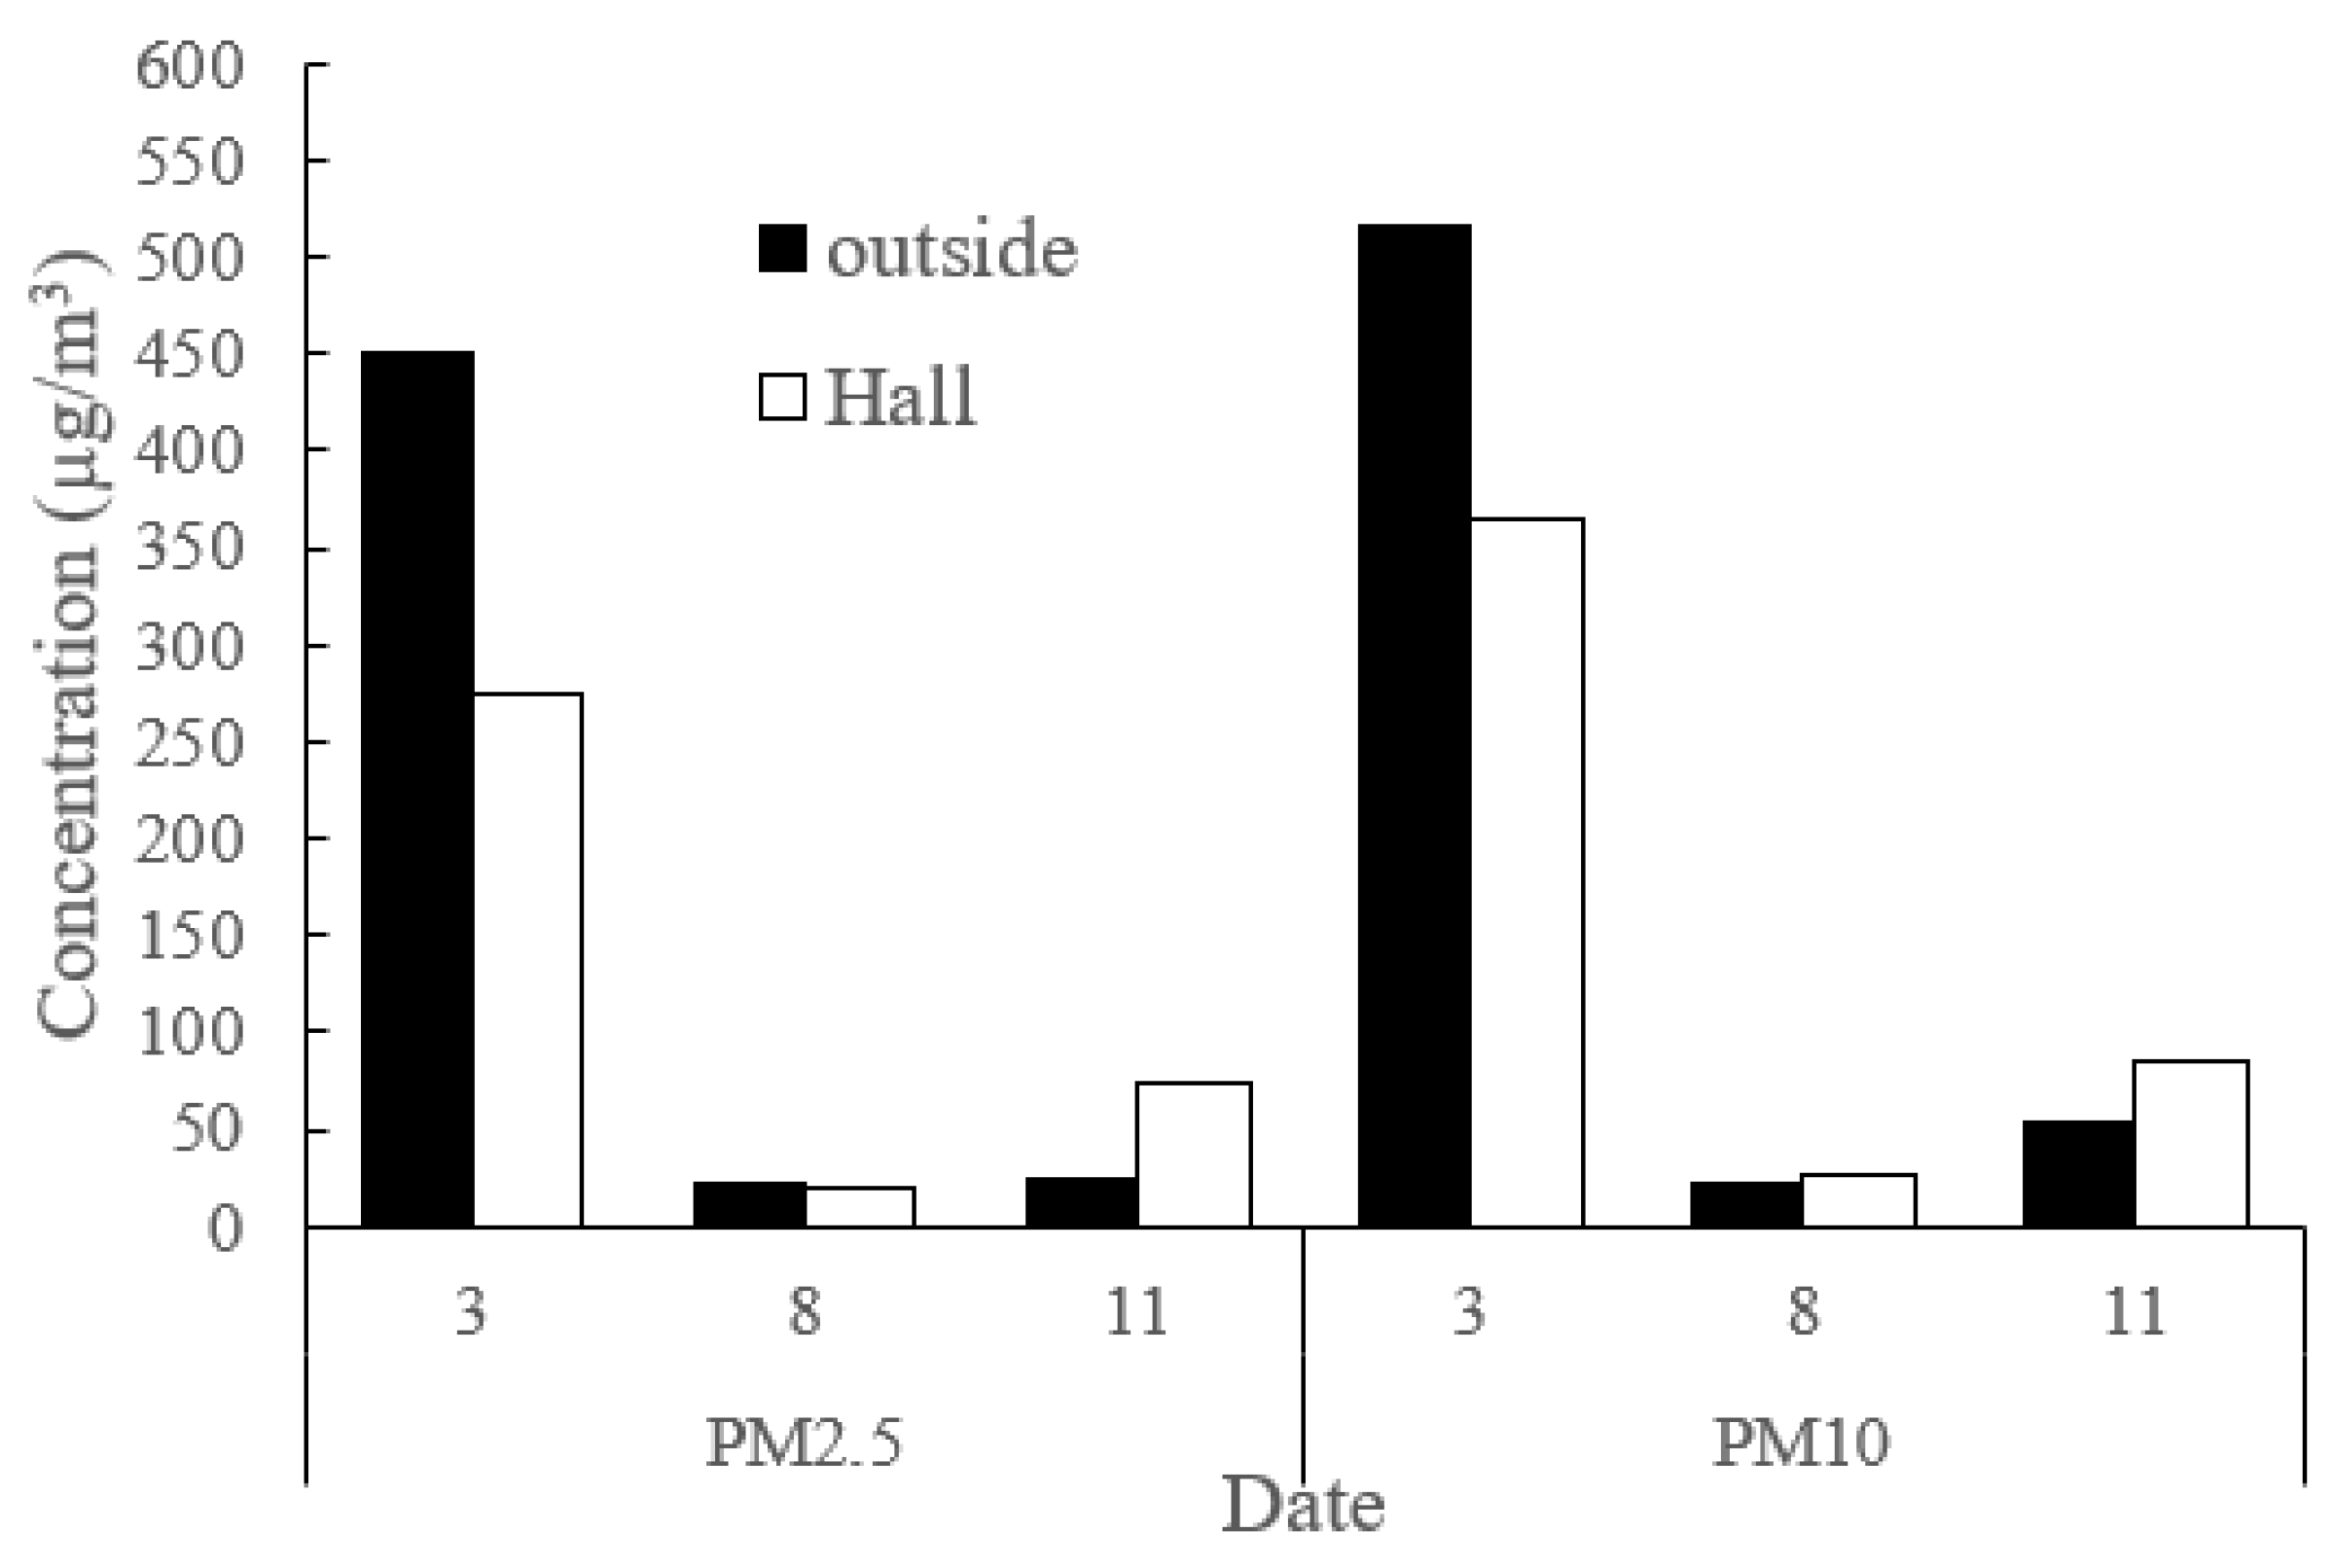
3.3. Transfer Station on One Platform: SJZ Station

The monitoring locations included three platforms and one joint hall on Lines 5, 10 and YZ. Although there were six directions for the platforms, each line had two directions. Line 10 was a ring with directions up and down. Both Line 5 and Y had a final and a starting direction. The depth of all platforms was the same at the SJZ transfer station. To make the results clearer, the platforms on one line were compared and are shown in Figure 10, Figure 11, Figure 12 and Figure 13. All y-axes (Figure 10, Figure 11 and Figure 12) were the same. There was no obvious difference between Lines 5 and 10, which indicated that for a transfer station with the same platform depth, the concentrations of PM2.5 and PM10 on the different lines were the same or similar. This could be considered to be one station in future research.
It was obvious that the concentrations of both PM2.5 and PM10 on the platforms with different directions on Line 10 were similar (Figure 10). When the outside pollution was under 200 μg/m3, the concentrations of PM2.5 and PM10 on the platforms with different directions on Line 10 were higher than outside whereas when the outside pollution was over 200 μg/m3, the concentrations of PM2.5 and PM10 on the platform were lower than outside. For Line 5 (Figure 11), the outside concentration was under 100 μg/m3 and the concentrations of PM2.5 and PM10 were higher on the starting platform than on the final platform. This could have been caused by the structure because the platform on Line Y and Line 5 (starting direction) was directly connected. The concentration on the starting platform of Line 5 was higher than on Line Y (Figure 12) as the opening time of Line 5 was earlier than Line Y. For the SJZ hall (Figure 13), the concentration was lower than outside when heavy pollution was registered outside. When the outside condition was good, the concentration in the hall was a little higher than outside.

3.4. Ratio of PM2.5 to PM10

The ratio of PM2.5 to PM10 at different monitoring locations was calculated and analyzed (Table 2). The locations generally included two types of transfer stations. One type was transfer station through aisles. The locations for this type of transfer station contained an aisle and the platforms were at different lines. The ratio of PM2.5 to PM10 illustrated the composition of PM2.5/PM10; the higher the ratio, the more harmful it is to health because the harmfulness of PM2.5 is higher than PM10.
The ratio of PM2.5 to PM10 at the transfer stations was generally higher than outside (77.65%). The ratios on all the aisles were similar, approximately 83%. The PM2.5/PM10 ratio was highest for Line 10 (85.59% and 84.70% at GM and SLH stations, respectively) followed by Line 1 (84.23% and 84.43%, respectively). The ratio was the lowest for Line 14 (82.18% and 80.83% at DWL and SLH, respectively). The PM2.5/PM10 ratio at the aisle was similar to the transfer station platform. This result suggested that air control should focus on the inlets/outlets of the aisle. For the SJZ transfer station, the ratio of PM2.5 to PM10 was similar on different platforms and the hall (approximately 78%) except for Line Y where the ratio was 85.13%.

3.5. Correlations between the Subway and Outside

The correlation between PM2.5 at the subway transfer stations and the outside was calculated (Table 3). The results were the average values of the aisle (14-1) and the SJZ platforms. The results were significant (p-value < 0.05) for the different locations, which indicated that the correlation was strong. The outdoor environment had a dominant influence on the PM concentration on the subway platform and the aisle of transfer stations (R2 = 0.897). Combined with a general linear analysis, the linear regression equations for the correlations between the indoor locations and the external subway stations were Y = 1.075X − 47.195 for the aisle, Y = 1.408X − 156.485 for the platform and Y = 1.611X − 45.693 for the transfer station hall.

4. Discussion

This study found that the particulate concentrations at transfer stations were different from those of non-transfer stations. The concentration at transfer stations was generally higher than at non-transfer stations. In addition, the PM2.5/PM10 ratio at the transfer stations was also higher than at the non-transfer stations.

4.1. Comparison of the PM Concentrations at Transfer and Non-Transfer Stations

Compared with a non-transfer station [30] platform pollution at transfer stations was lighter than at non-transfer stations, especially for PM10 (Table 4). When the outside pollution was under 20 µg/m3, the concentrations of PM2.5 and PM10 on the non-transfer station platform was 66 µg/m3 and 140 µg/m3, respectively. The highest values of PM2.5 and PM10 for the transfer stations were 64 µg/m3 and 108 µg/m3, respectively. When the outside PM2.5 was 100–150 µg/m3, the concentrations of PM2.5 and PM10 on the non-transfer station platform were 174 µg/m3 and 198 µg/m3, respectively. The highest values of PM2.5 and PM10 for the transfer stations were 154 µg/m3 and 178 µg/m3, respectively. This could be caused by differences in the structure between transfer and non-transfer stations as the inlets/outlets of the transfer stations were larger. The ventilation capacity was higher than in the non-transfer stations to meet the needs of a higher passenger flow. As a result, particulate pollution was smaller at the transfer station than at the non-transfer station. The results at SJZ also supported the conclusion that compared with the non-transfer station [30] pollution on the platform of the transfer stations was smaller than on the non-transfer stations, especially for PM10. When the outside pollution was 200–300 µg/m3, the PM2.5 and PM10 concentrations on the platform of the non-transfer stations were 158–200 µg/m3 and 168–300 µg/m3, respectively, and the values for the SJZ platform were less 150 µg/m3 and 210 µg/m3, respectively.
Compared with another study [29], the results were the same. When the outside conditions were the same, the concentrations of PM2.5 and PM10 were lower in the transfer station than those in the non-transfer stations.

4.2. Comparison of the PM2.5/PM10 Ratio between Transfer and Non-Transfer Stations

The ratio of PM2.5 to PM10 at transfer stations was higher than that of non-transfer stations. At the non-transfer stations [30], the ratio on the platform was 68.6%; it was 79.6% outside and 61.2% in the hall. As passenger flow was much higher at the transfer stations, the risk of exposure was much higher at these stations, which requires further studies.

4.3. Correlation between Subway Stations and the Outdoor Environment

Compared with the non-transfer stations in Beijing [30] the correlation between the subway and the outside was the same; i.e., PM10 and PM2.5 were significantly correlated at both transfer stations and non-transfer stations (Table 5). However, the values of the coefficient (R2) at the transfer stations were higher than at the non-transfer stations. The R2 was 0.897 for the non-transfer station platforms whereas for the transfer station platforms, the R2 was 0.907. Compared with the non-transfer stations, the correlation with the outside environment was higher for the transfer stations. This was caused by the structure of the stations because the area of the transfer stations was much larger with more inlets and the flow of passengers was more intensive than in the non-transfer stations. Furthermore, the exchange of air between the outside and the platform was more violent at the transfer stations compared with the non-transfer stations. For future air quality research, more attention should be paid to the outside of the transfer stations than to the non-transfer stations.

5. Limitations and Future Work

As the measurement was very difficult to perform due to the safety of the people, the comfort of the passengers and the requirements of the subway company, the collected data were not large and the number of stations was also limited. For future research, long-term measurements on a higher number of different stations should be performed. For example, peak hour measurements could be conducted and transfer station through nodes could be studied and compared. However, the existing data are statistically significant and show the characteristics of PM2.5 and PM10 concentrations at transfer stations. In this paper, the values of PM2.5 and PM10 were analyzed and a comparison with the non-transfer stations was performed. The method in this paper could be co-opted and the results could be a reference for future, more comprehensive measurement studies.

6. Conclusions

In this paper, the characteristics of PM2.5 and PM10 at transfer stations were studied. The transfer stations that were monitored included two modes. The first was the transfer of passengers through the aisle and the second used one common platform and hall for different lines. The former stations were GM, DWL and SLH, three transfer stations, and the latter was SJZ station. For comparison, the monitoring was conducted under different outside conditions. The monitoring locations included the transfer station platform, the transfer aisles and the hall. In addition to the PM concentration results, the ratio of PM2.5 to PM10 at different locations and correlations with the outside were also analyzed. The main results were as follows:
  • The concentration of PM in the aisle was between two platforms at transfer stations. In the transfer station with the same depth of platforms, the concentrations of PM2.5 and PM10 on different lines were the same or similar. The concentrations of PM2.5 and PM10 on the platform in transfer stations were approximately 10 μg/m3 lower than in the non-transfer station when the outside PM2.5 was lower than 150 μg/m3.
  • The ratio of PM2.5 to PM10 at the transfer stations (80% on the platform and 78.1% in the hall) was higher than at the non-transfer stations (68.6% on the platform and 61.2% in the hall), which revealed that the PM10 concentrations differed between the transfer and non-transfer stations.
  • The concentration of PM2.5 at the subway stations had a strong correlation with the outside conditions at the transfer stations (R2 = 0.897), which corresponded with the results for the non-transfer stations. This proved that regardless of the type of subway station, the outside conditions were among the most important factors for the subway environment.
For further studies, it is necessary to measure PM pollution during the peak period and throughout the year in order to reveal the pollution conditions at transfer stations.

Author Contributions

Conceptualization: X.W., L.X. and S.P.; methodology: X.W.; validation: F.P. and L.C.; formal analysis: X.W.; investigation: X.W.; writing—original draft preparation: X.W.; writing—review and editing: F.P., L.C. and W.T.C.; visualization: Z.W.; supervision: L.X. and S.P.; project administration: L.X. and S.P.; funding acquisition: X.W. and S.P. All authors have read and agreed to the published version of the manuscript.

Funding

The authors are grateful for the financial support of the Key Laboratory for Comprehensive Energy Saving of Cold Regions Architecture of the Ministry of Education. This work was supported by the National Natural Science Foundation of China (Grant Number: 51578011), the Ningbo Innovation Team Project (2017C510001) and the international cooperation project of Hebei Province (18394317D).

Institutional Review Board Statement

Not applicable.

Informed Consent Statement

Not applicable.

Data Availability Statement

Not applicable.

Conflicts of Interest

The authors declare no conflict of interest.

References

  1. Araji, M.T.; Ray, S.D.; Leung, L. Pilot-study on airborne PM2.5, filtration with particle accelerated collision technology in office environments. Sustain. Cities Soc. 2017, 28, 101–107. [Google Scholar] [CrossRef]
  2. Aarnio, P.; Yli-Tuomi, T.; Kousa, A.; Mäkelä, T.; Hirsikko, A.; Hämeri, K.; Räisänen, M.; Hillamo, R.; Koskentalo, T.; Jantunen, M. The concentrations and composition of and exposure to fine particles (PM2.5) in the Helsinki subway system. Atmos. Environ. 2005, 39, 5059–5066. [Google Scholar] [CrossRef]
  3. Lee, S.; Liu, H.; Kim, M.; Kim, J.T.; Yoo, C. Online monitoring and interpretation of periodic diurnal and seasonal variations of indoor air pollutants in a subway station using parallel factor analysis (PARAFAC). Energy Build. 2014, 68, 87–98. [Google Scholar] [CrossRef]
  4. Qiao, T.; Xiu, G.; Zheng, Y.; Yang, J.; Wang, L.; Yang, J.; Huang, Z. Preliminary investigation of PM1, PM2.5, PM10 and its metal elemental composition in tunnels at a subway station in Shanghai, China. Transp. Res. Part D 2015, 41, 136–146. [Google Scholar] [CrossRef]
  5. Kim, J.B.; Kim, S.; Lee, G.J.; Bae, G.N.; Cho, Y.; Park, D.; Lee, D.H.; Kwon, S.B. Status of PM in Seoul metropolitan subway cabins and effectiveness of subway cabin air purifier (SCAP). Clean Technol. Environ. Policy 2014, 16, 1193–1200. [Google Scholar] [CrossRef]
  6. Cheng, Y.H.; Liu, Z.S.; Yan, J.W. Comparisons of PM10, PM2.5, Particle Number, and CO2 Levels inside Metro Trains Traveling in Underground Tunnels and on Elevated Tracks. Aerosol Air Qual. Res. 2012, 12, 879–891. [Google Scholar] [CrossRef] [Green Version]
  7. Janssen, N.; Hurk, N.V.D.; Hoek, G.; Van Der Zee, S.; Zuurbier, M.; Cassee, F. Exposure to PM2.5, Black Carbon and Ultrafine Particles in above-and Underground Public Transport. In Proceedings of the 2013 Conference Environment and Health Bridging South, North, East and West, Basel, Switzerland, 19–23 August 2013; Volume 8, pp. 19–23. [Google Scholar]
  8. Karlsson, H.L.; Ljungman, A.G.; Lindbom, J.; Möller, L. Comparison of genotoxic and inflammatory effects of particles generated by wood combustion, a road simulator and collected from street and subway. Toxicol. Lett. 2006, 165, 203–211. [Google Scholar] [CrossRef]
  9. Boudia, N.; Halley, R.; Kennedy, G.; Lambert, J.; Gareau, L.; Zayed, J. Manganese concentrations in the air of the Montreal (Canada) subway in relation to surface automobile traffic density. Sci. Total Environ. 2006, 366, 143–147. [Google Scholar] [CrossRef]
  10. Vilcassim, M.R.; Thurston, G.D.; Peltier, R.E.; Gordon, T. Black Carbon and Particulate Matter (PM2.5) Concentrations in New York City’s Subway Stations. Environ. Sci. Technol. 2015, 48, 14738–14745. [Google Scholar] [CrossRef] [Green Version]
  11. Kam, W.; Ning, Z.; Shafer, M.M.; Schauer, J.J.; Sioutas, C. Chemical Characterization and Redox Potential of Coarse and Fine Particulate Matter (PM) in Underground and Ground-Level Rail Systems of the Los Angeles Metro. Environ. Sci. Technol. 2011, 45, 6769–6776. [Google Scholar] [CrossRef]
  12. Delbari, A.S.; Hadavifar, M.; Haghparast, H. Concentration and characterization of airborne particles in two subway systems of Islamic Republic of Iran and India. J. Air Pollut. Health 2016, 1, 61–68. [Google Scholar]
  13. Hernandez-Castillo, C.R.; Galvez, V.; Morgado-Valle, C.; Fernandez-Ruiz, J. Whole-brain connectivity analysis and classification of spinocerebellar ataxia type 7 by functional MRI. Cerebellum Ataxias 2014, 1, 2. [Google Scholar] [CrossRef] [Green Version]
  14. Gómez-Perales, J.; Colvile, R.; Nieuwenhuijsen, M.; Fernández-Bremauntz, A.; Gutiérrez-Avedoy, V.; Páramo-Figueroa, V.; Blanco-Jiménez, S.; Bueno-López, E.; Mandujano, F.; Bernabé-Cabanillas, R.; et al. Commuters’ exposure to PM2.5, CO, and benzene in public transport in the metropolitan area of Mexico City. Atmos. Environ. 2004, 38, 1219–1229. [Google Scholar] [CrossRef]
  15. Mugica-Alvarez, V.; Figueroa-Lara, J.D.J.; Romo, M.A.R.; Sepúlveda-Sánchez, J.; López-Moreno, T. Concentrations and properties of airborne particles in the Mexico City subway system. Atmos. Environ. 2012, 49, 284–293. [Google Scholar] [CrossRef]
  16. Midander, K.; Elihn, K.; Wallén, A.; Belova, L.; Karlsson, A.-K.B.; Wallinder, I.O. Characterisation of nano- and micron-sized airborne and collected subway particles, a multi-analytical approach. Sci. Total Environ. 2012, 427, 390–400. [Google Scholar] [CrossRef]
  17. Adams, H.; Nieuwenhuijsen, M.; Colvile, R. Determinants of fine particle (PM2.5) personal exposure levels in transport microenvironments, London, UK. Atmos. Environ. 2001, 35, 4557–4566. [Google Scholar] [CrossRef]
  18. Harrison, R.M.; Deacon, A.R.; Jones, M.R.; Appleby, R.S. Sources and processes affecting concentration of PM2.5 and PM10 particulate matter in Birmingham (UK). Atmos. Environ. 1997, 31, 4103–4411. [Google Scholar] [CrossRef]
  19. Bachoual, R.; Boczkowski, J.; Goven, D.; Amara, N.; Tabet, L.; On, D.; Leçon-Malas, V.; Aubier, M.; Lanone, S. Biological effects of particles from the Paris subway system. Chem. Res. Toxicol. 2007, 20, 1426–1433. [Google Scholar] [CrossRef] [PubMed]
  20. Tokarek, S.; Bernis, A. An exemple of particle concentration reduction in parisian subway stations by electrostatic precipitation. Environ. Technol. 2006, 27, 1279–1287. [Google Scholar] [CrossRef]
  21. Moreno, T.; Perez, N.; Reche, C.; Martins, V.; de Miguel, E.; Capdevila, M.; Centelles, S.; Minguillón, M.C.; Amato, F.; Alastuey, A.; et al. Subway platform air quality: Assessing the influences of tunnel ventilation, train piston effect and station design. Sci. Total Environ. 2014, 92, 461–468. [Google Scholar] [CrossRef]
  22. Colombi, C.; Angius, S.; Gianelle, V.; Lazzarini, M. Particulate matter concentrations, physical characteristics and elemental composition in the Milan underground transport system. Atmos. Environ. 2013, 70, 166–178. [Google Scholar] [CrossRef]
  23. Şahin, Ü.A.; Onat, B.; Stakeeva, B.; Ceran, T.; Karim, P. PM10 concentrations and the size distribution of Cu and Fe-containing particles in Istanbul’s subway system. Transp. Res. Part D Transp. Environ. 2012, 17, 48–53. [Google Scholar] [CrossRef]
  24. Kamani, H.; Hoseini, M.; Seyedsalehi, M.; Mahdavi, Y.; Jaafari, J.; Safari, G.H. Concentration and characterization of airborne particles in Tehran’s subway system. Environ. Sci. Pollut. Res. 2014, 21, 7319–7328. [Google Scholar] [CrossRef]
  25. Kim, K.Y.; Kim, Y.S.; Roh, Y.M.; Lee, C.M.; Kim, C.N. Spatial distribution of particulate matter (PM10 and PM2.5) in Seoul Metropolitan Subway stations. J. Hazard. Mater. 2008, 154, 440–443. [Google Scholar] [CrossRef] [PubMed]
  26. Son, J.-Y.; Lee, J.-T.; Kim, K.-H.; Jung, K.; Bell, M.L. Characterization of fine particulate matter and associations between particulate chemical constituents and mortality in Seoul, Korea. Environ. Health Perspect. 2012, 120, 872–878. [Google Scholar] [CrossRef] [PubMed] [Green Version]
  27. Guo, L.; Hu, Y.; Hu, Q.; Lin, J.; Li, C.; Chen, J.; Li, L.; Fu, H. Characteristics and chemical compositions of particulate matter collected at the selected metro stations of Shanghai, China. Sci. Total Environ. 2014, 496, 443–452. [Google Scholar] [CrossRef]
  28. Ma, H.; Shen, H.; Liang, Z.; Zhang, L.; Xia, C. Passengers’ Exposure to PM2.5, PM10, and CO2 in Typical Underground Subway Platforms in Shanghai. In Proceedings of the 8th International Symposium on Heating, Ventilation and Air Conditioning; Springer: Berlin/Heidelberg, Germany, 2014; Volume 261, pp. 237–245. [Google Scholar]
  29. He, S.; Jin, L.; Le, T.; Zhang, C.; Liu, X.; Ming, X. Commuter health risk and the protective effect of three typical metro environmental control systems in Beijing, China. Transp. Res. Part D 2018, 62, 633–645. [Google Scholar] [CrossRef]
  30. Pan, S.; Du, S.; Wang, X.; Zhang, X.; Xia, L.; Liu, J.; Pei, F.; Wei, Y. Analysis and interpretation of the particulate matter (PM2.5 and PM10) concentrations at the subway stations in Beijing, China. Sustain. Cities Soc. 2019, 45, 366–377. [Google Scholar] [CrossRef]
  31. Chan, L.; Lau, W.; Zou, S.; Cao, Z.; Lai, S. Exposure level of carbon monoxide and respirable suspended particulate in public transportation modes while commuting in urban, area of Guangzhou, China. Atmos. Environ. 2002, 36, 5831–5840. [Google Scholar] [CrossRef]
  32. Gao, M.; Cao, J.; Seto, E. A distributed network of low-cost continuous reading sensors to measure spatiotemporal variations of PM2.5 in Xi’an, China. Environ. Pollut. 2015, 199, 56–65. [Google Scholar] [CrossRef] [Green Version]
  33. Cao, S.J.; Kong, X.R.; Li, L.; Zhang, W.; Ye, Z.P.; Deng, Y. An investigation of the PM2.5 and NO2 concentrations and their human health impacts in the metro subway system of Suzhou, China. Environ. Sci. Process. Impacts 2017, 19, 666–675. [Google Scholar] [CrossRef] [PubMed]
  34. Wang, B.-Q.; Liu, J.-F.; Ren, Z.-H.; Chen, R.-H. Concentrations, properties, and health risk of PM2.5 in the Tianjin City subway system. Environ. Sci. Pollut. Res. 2016, 23, 22647–22657. [Google Scholar] [CrossRef] [PubMed]
  35. Kam, W.; Cheung, K.; Daher, N.; Sioutas, C. Particulate matter (PM) concentrations in underground and ground-level rail systems of the Los Angeles Metro. Atmos. Environ. 2011, 45, 1506–1516. [Google Scholar] [CrossRef]
  36. Yang, L.; Zhang, Y.; Xia, J. Case study of train-induced airflow inside underground subway stations with simplified field test methods. Sustain. Cities Soc. 2018, 37, 275–287. [Google Scholar] [CrossRef]
  37. Pun, V.C.; Kazemiparkouhi, F.; Manjourides, J.; Suh, H.H. Long-Term PM2.5 Exposure and Respiratory, Cancer, and Cardiovascular Mortality in Older US Adults. Am. J. Epidemiol. 2017, 186, 961–969. [Google Scholar] [CrossRef]
  38. Lepeule, J.; Laden, F.; Dockery, D.; Schwartz, J. Chronic Exposure to Fine Particles and Mortality: An Extended Follow-up of the Harvard Six Cities Study from 1974 to 2009. Environ. Health Perspect. 2012, 120, 965–970. [Google Scholar] [CrossRef]
  39. GB3095-2012; Environmental Air Quality Standard. The Ministry of Ecology and Environment, formerly the Ministry of Environmental Protection: Beijing, China, 2012.
Figure 1. Schematic process of particles entering the body [1].
Sustainability 14 01552 g001
Figure 2. Common modes for subway transfer stations.
Sustainability 14 01552 g002
Figure 3. Example of a transfer station on the same platform: Songjiazhuang station in Beijing.
Sustainability 14 01552 g003
Figure 4. Examples of node transfer stations in Beijing: (a) ‘×/+’, Haidianhuangzhuang station; (b) ‘T’, Beitucheng station; (c) ‘L’, Yonghegong station.
Sustainability 14 01552 g004
Figure 5. Examples of through aisle transfer stations in Beijing: (a) ‘L’, Guomao station; (b) ‘T’, Fuxingmen station; (c) ‘H’, Shilihe station.
Sustainability 14 01552 g005
Figure 6. Monitoring stations in Beijing.
Sustainability 14 01552 g006
Figure 7. The TSI 8532 monitoring equipment.
Sustainability 14 01552 g007
Figure 8. Measurement results at aisles. The numbers in brackets are Line numbers.
Sustainability 14 01552 g008
Figure 9. Measurement results at platforms.
Sustainability 14 01552 g009
Figure 10. Measurement results on platforms at Line 10 (SJZ).
Sustainability 14 01552 g010
Figure 11. Measurement results on platforms at Line 5 (SJZ).
Sustainability 14 01552 g011
Figure 12. Measurement results on platforms at Line Y (SJZ).
Sustainability 14 01552 g012
Figure 13. Measurement results in the hall (SJZ).
Sustainability 14 01552 g013
Table 1. Outside conditions during monitoring in Beijing in March 2018.
Date
(March 2018)
PM2.5 (µg/m3)PM10 (µg/m3)Temp (°C)Humidity (%)Pollution Level
12935971718serious
220023623.511.5moderate
34515172125.5serious
43744171628serious
5591061727light
653981626light
752941532light
8212113.239excellent
92452179excellent
1089215excellent
1125542210excellent
126213622.515light
13506623.817.4good
143439219excellent
151602062119moderate
161031652122moderate
17541152025light
18751302220light
19831502220light
2071882321good
211551782617moderate
221011152526moderate
2378269excellent
2456239excellent
2516182510excellent
269102515excellent
Table 2. Ratio of PM2.5 to PM10 at different locations (%): (a) outside and aisles; (b) platforms at transfer stations through the aisle; (c) SJZ stations.
Outside and Aisles
LocationOutsideAisle 14–1Aisle 1–10Aisle 10–14
PM2.5/PM1077.6583.383.3483.32
Platforms At Transfer Stations Through Aisle
PlatformDWL 14DWL 1GM 1GM 10SLH 10SLH 14
PM2.5/PM1082.1884.2384.4385.5984.7080.38
SJZ Stations
SJZ10 Up10 Down5 Start5 FinalYHall
PM2.5/PM1078.7678.5676.2879.7185.1378.10
Table 3. Correlation between subway and outside environment.
Correlation EquationRR SquareAdjusted R SquareSig.
AisleY = 1.075X − 47.1950.9850.9700.9630.000
HallY = 1.611X − 45.6930.9840.9680.9600.000
PlatformY = 1.408X − 156.4850.9850.9700.9540.015
Table 4. Comparison of PM concentrations at transfer and non-transfer stations (µg/m3).
Transfer StationsNon-Transfer Stations [30]Non-Transfer Stations [29]
PM2.5Outside≤25/100–150/200–300
PM2.5 (highest)Platform64/154/15066/174/200139/183/--
PM10 (highest)Platform108/178/210140/198/300176/198/--
Table 5. Comparison of the PM2.5/10 ratio and the R2 between transfer and non-transfer stations.
Transfer StationsNon-Transfer Stations [30]
Ratio (PM2.5/PM10)Outside77.65%79.6%
Platform76.28%68.6%
Hall78.1%61.2%
R2 (subway and outside)Platform0.9700.907
Hall0.9680.884
Publisher’s Note: MDPI stays neutral with regard to jurisdictional claims in published maps and institutional affiliations.

