Article

Investigation and Optimization of the Performance of Energy Systems in the Textile Industry by Using CHP Systems

by
Tatiana Victorovna Morozova
1,
Reza Alayi
2,*,
John William Grimaldo Guerrero
3,
Mohsen Sharifpur
4,5,* and
Yaser Ebazadeh
6
1
Department of Accounting and Taxation, Plekhanov Russian University of Economics, 117997 Moscow, Russia
2
Department of Mechanics, Germi Branch, Islamic Azad University, Germi 5651763764, Iran
3
Departamento de Energía, Universidad de la Costa, Barranquilla 115012060, Colombia
4
Department of Mechanical and Aeronautical Engineering, University of Pretoria, Pretoria 0002, South Africa
5
Department of Medical Research, China Medical University Hospital, China Medical University, Taichung 404, Taiwan
6
Department of Computer Engineering, Germi Branch, Islamic Azad University, Germi 5651763764, Iran
*
Authors to whom correspondence should be addressed.
Sustainability 2022, 14(3), 1551; https://doi.org/10.3390/su14031551
Submission received: 7 January 2022 / Revised: 15 January 2022 / Accepted: 26 January 2022 / Published: 28 January 2022

Abstract

:
With the general progression of small communities toward greater industrialization, energy consumption in this sector has increased. The continued growth of energy consumption seen in Iran, along with the low efficiency of production, transmission, and the distribution of energy, has led to the projection of an unfavorable future for this sector. The purpose of this study is to reduce fuel consumption and increase system efficiency by considering the optimal position of the turbine. In this regard, turbine modeling has been performed by considering different positioning scenarios. Afterward, the result from applying each scenario was compared with another scenario in terms of the parameters of electrical energy production, gas consumption, the final energy produced by the system, and the ratio of energy produced to overall gas consumption. After comparing different scenarios, considering all 4 parameters, Scenario 7 was selected as the most suitable positioning for gas turbine placement. Scenario 7 showed the highest gas consumption; of course, high power generation is the most desirable, the most reliable and, ultimately, the most profitable outcome of energy production. According to our results, the amount of electrical energy produced in the selected scenario is 4,991,160.3 kWh; the gas consumption in this case is 0.22972 kg/s.

1. Introduction

Given the importance of energy-saving issues and the high share of energy consumption in the industrial sector, the use of effective methods will have significant effects on progress and development around the world. Combined heat and power (CHP), as an efficient way to reduce energy consumption, is currently on the agenda of many developed countries and a significant share of electricity and heat production in these countries is provided by this method [1,2]. In our country, Iran, various factors such as a lack of sufficient information and the low prices of various energy carriers have led to a lack of development of these solutions and the wastage of large amounts of energy in various consumer sectors, including that of industry [2,3].
The limitation and pollution problems associated with fossil fuel resources necessitate the need to optimize energy consumption since doing so will bring significant advantages, such as energy management, reducing costs, reducing investment, and improving the environment [4,5].
The potential for savings in the industrial sector, based on energy consumption statistics in the world and in Iran in particular, is optimistically 38% and, conservatively, 24%. However, the savings potential is estimated to be between 10% and 15% relative to national standard values, and 15% to 25% relative to global standard values. To save energy consumption, understanding energy-intensive industries and increasing the efficiency of energy-consuming equipment is one of the first necessary measures [6,7]. Given that industry accounts for a relatively high share of total global energy consumption, energy consumption optimization and using CHP systems are of particular importance [8,9].
Due to the amount of energy wasted in different industries, the application of CHP in the textile industry can be considered to be one of the requirements for reducing energy consumption, fuel usage, and costs [10,11]. The importance of cogeneration stems from financial issues and energy savings. Any unit that consumes electrical power and needs thermal energy is a candidate for cogeneration [12,13]. CHP systems represent a combined cycle in which a fuel generator typically generates electricity and the exhaust heat is used to produce steam or heat in heat recovery boilers or to run a chiller compressor [4,5]. In this type of system, at first, the initial energy required to move the electrical generator is provided by fuel, and then the output heat from the generator is used to provide the energy needed for the heat exchangers [12]. However, there is another type of cycle in which heat is generated first and electricity, second [13,14].
More than 8% of the world’s electricity generation capacity depends on cogeneration. This method is known as combined heat and power (CHP). The world’s cogeneration plants generate a total of about 325,000 MW of electricity in installed facilities [15,16]. The combination of heat and electricity recovers heat energy lost during power generation, unlike conventional systems where heat is simply transferred to the environment. Energy is wasted and more fuel must be used to generate the same amount of heat for industries or buildings [16,17]. Another form of CHP generation captures energy used in industrial processes and recovers it into electricity and thermal energy [18,19]. Coal-fired power plants convert an average of 33% of their fuel into energy services [20,21]. The most efficient power plants that are supplied by natural gas have an efficiency of 30–45%. In contrast, CHP systems have an efficiency rating of 50–90%, and, due to the proximity of the generator and the consumer, have fewer losses in the process of transmission and distribution of electricity and heat [22,23]. Using a combination of heat and electricity is more efficient than producing separate electricity and heat [24]. In addition to large-scale applications, CHP can be used to supply electricity and heat to residential and commercial complexes and buildings [25,26].
Because a large amount of energy is wasted during transmission, CHP power plants must be located near the target market for efficient energy consumption [27,28]. Such an ideal location is one near consumers who need power and heat for more than 5000 h throughout the year. Industrial power plants offer an ideal location for these facilities, as they already require a constant source of electricity and heat, and this minimizes CHP changes [29,30]. This method of simultaneous production is very economical in cold regions such as Finland or densely populated areas [31,32]. More research is needed into this relationship because the number of scientific studies is too low. In the introductory sections, more general information on the importance of research should also be provided in order to emphasize the state of the art. Some of the past work can be seen in Table 1.
In the textile industry, energy is used in various ways at all stages of production. This is one of the processing industries in which steam is used in all its various stages, especially in the areas of dyeing, printing, and finishing (wet process). In this research, the goal is to establish the optimal location of the turbine by considering various economic and energy factors. In this regard, the effect of different turbine locations on fuel consumption and system efficiency has been evaluated.

2. Materials and Method

2.1. System Modeling for the Studied Industrial Unit

The proposed system uses a gas turbine to function. The gas turbine consists of an axial flow compressor, an annular combustor, and an axial flow turbo-expander. In the proposed system, dry air first enters the compressor via an inlet. After being compressed in the compressor, the air flows to the combustion chamber. The gas turbine uses natural gas of a specific composition as fuel. After the combustion of natural gas with the dry air, due to the calorific value of the combustion reaction, a great deal of heat is formed in the combustion chamber, which increases the kinetic energy of the flue gases. The flue gas flows into the turbo-expander space at very high heat, causing the turbine blades to move. With the activation of the turbo-expander, the kinetic energy in the flue gases has been converted into mechanical energy (torque). The gas turbine will have two outputs; one is the production of mechanical energy (torque) and the other is the emission of flue gases from its exhaust. By connecting a power generator to axis 1 of a gas turbine, the resulting mechanical energy is used to generate electricity. The mechanical energy generated can also be used to circulate a compressor in order to compress a gaseous substance or to move a pump, to increase the pressure of a liquid.
Although most of the kinetic energy in the flue gases is converted to mechanical energy by the turbo-expander, it still holds a great deal of heat. If this heat is not recovered from the flue gas outlet of the gas turbine, all the energy in it is merely discharged into the atmosphere, and, in addition to wasting large amounts of energy, this will also lead to numerous environmental problems. To prevent this, the heat in the flue gases of the gas turbine is converted into hot water or steam, using heat recovery boilers or heat exchangers that can be used for cooling and heating purposes. If it is not possible to recover the heat contained in the flue gases, a boiler that uses natural gas separately as fuel should be used to generate hot water and steam. Figure 1 shows an overview of the composition of the proposed system.
In this study, different scenarios for using flue gas from a gas turbine are defined. Scenarios have also been defined that assume it is not possible to employ flue gas to use boilers next to a gas turbine.

2.2. Gas Turbine Modeling

Each gas turbine is based on the Brighton cycle but operates with different variables. The number of stages or its arrangement can change, but it is always the case that the stages of increasing pressure, combustion (increasing heat), and finally, the spread of fluid (hot and condensed exhaust) in succession and in the same way to all turbines generates power. This set may seem a bit complicated at first, but by describing the relevant cases, all its behaviors will be determined.

2.2.1. Turbo-Expander Modeling

Figure 2 shows how energy flows in and out of a turbo-expander:

2.2.2. Ideal Turbine Work

The high-temperature flue gases leaving the combustor enter the turbine, causing the turbine blades to move, which in turn generates work via the torque generated. It is assumed that the expansion of compressed and hot gases in the turbine occurs adiabatically. From the ideal enthalpy difference of the mass flow of the flue gas at the inlet and outlet of the turbine, the amount of ideal work can be calculated using the following formula [38]:
W T = T . i n h T . i n h T . o u t

2.2.3. Temperature and Enthalpy of Turbine Output in Ideal Conditions

The turbine is assumed to operate in adiabatic conditions; the outlet temperature of the turbine under ideal conditions (TT.out) depends on the values of the inlet air temperature (TT.in) and the specific heat ratio (k). Therefore, the outlet temperature of the turbine in ideal conditions can be calculated from the following formula:
T T . o u t = T T . i n / r P k 1 / k
where TT.in is the inlet temperature entering the turbine in ideal conditions and is obtained according to the value of hT.in. By obtaining the ideal temperature value of the turbine outlet, the ideal enthalpy value of the turbine outlet can be calculated using Equation (2).

2.2.4. Temperature and Enthalpy of Turbine Output in Real Conditions

In real conditions, due to factors such as friction, the amount of work produced by the turbine is less than the ideal state. According to the definition of the isentropic efficiency of a turbine (h′T), the enthalpy value of the turbine output can be calculated in real conditions; then, the actual output temperature of the turbine can be calculated using the following formula [38]:
h T . o u t = h T . i n η T h T . i n h T . o u t

2.2.5. The Actual Work of the Turbine

The amount of work that a gas turbine produces can be calculated according to the actual amounts of energy flow in and out of it. By calculating the actual enthalpy value of the turbine output, the amount of work generated in the turbine in the real state can be calculated using Equation (4) [38]:
W T = T . i n h T . i n h T . o u t

2.3. Compressor Modeling

In the Brighton cycle, one of the basic processes is to increase the operating fluid pressure by the compressor. In other words, since the fluid passing through the turbine will expand, the required pressure ratio, which is usually the work of the compressor, needs to be provided. The flow of air energy is shown in Figure 3:

2.3.1. Compressor Consumption in Ideal Conditions

The compressor will need to use mechanical energy (work) to compress the air; this is supplied by the shaft connected to the turbo-expander. Compressor efficiency is very effective in the overall performance of the gas turbine because 55 to 61% of the turbine production capacity is consumed by the compressor. The compressor’s performance calculation, according to the amount of air that it compresses, is obtained by the enthalpy difference of the mass flow of air in the inlet and discharge sections [10]:
W C = a i r h C . o u t h C . i n
where hC.in is the enthalpy of the air entering the compressor, hC.out is the enthalpy of the air coming out of the compressor in the all-state state, and ṁair is the mass flow of the air entering the compressor.

2.3.2. Temperature and Enthalpy of the Air Entering the Compressor

Gas turbines are machines that draw air in directly from the environment. Therefore, any action that changes the incoming air conditions will change the performance of the turbine. One of those factors is the temperature of the air entering the compressor. The air entering the compressor has initial energy (enthalpy) according to its temperature. According to the enthalpy definition, the following general formula is offered:
h = C P T
From the general enthalpy formula, the enthalpy value of the air entering the compressor can also be calculated using the following formula [10]:
h C . i n = C P . a i r T C . i n
CP.air is the specific heat capacity of the air and TC.in is the temperature of the air entering the compressor. Since the compressor is a turbomachine, its performance can be considered as adiabatic. The ideal model of compressor operation is the isentropic mode.

2.3.3. Temperature and Enthalpy of the Compressor’s Output

When the air is compressed by the compressor, in addition to increasing the pressure, we also see an increase in air temperature. In other words, an increase in pressure is equal to an increase in temperature. As the air temperature increases, its enthalpy will also increase. Considering the adiabatic nature of the air compression process, the enthalpy of the exhaust air from the compressor is also calculated using the following formula [10]:
h C . o u t = h C . i n r P k 1 / k
where rP is the compressor density ratio and k is the specific heat ratio. It should be noted that the enthalpy obtained is in ideal conditions. The following formula can be used to calculate the actual enthalpy of the compressor outlet air by establishing the compressor efficiency:
h C . o u t = h C . o u t h C . i n η C + h C . i n
The enthalpy of the air entering the compressor (hC.in) is ideally equal to that in reality (hC.in). The above variable η C is the compressor efficiency. By obtaining the real enthalpy value of the air leaving the compressor and by using Equation (9) and the amount of specific heat capacity of the air, the temperature of the air leaving the compressor can also be calculated.

2.3.4. Compressor Work in Real Mode

By obtaining the actual amount of enthalpy of the air coming out of the compressor, the amount of compressor work in real conditions can also be obtained.
W C = a i r h C . o u t h C . i n

2.4. Combustor Modeling

Thermal Balance in the Combustion Chamber

To calculate the amount of energy produced by combustion (output enthalpy) in the combustor, the energy balance in the chamber must be used. Assuming that the combustor is adiabatic and that its efficiency is 100%, the energy balance for this part of the gas turbine will be as follows. Figure 4 shows the energy balance of the combustion chamber.
In this case, the flow of energy entering the chamber is equal to the flow of energy leaving it [4]:
T . i n h T . i n = a i r h C . o u t + NG . LHV
The amount of enthalpy output from the combustor or input enthalpy to the turbo-expander can be calculated using the following formula [4]:
h T . i n = ( a i r h C . o u t + NG . LHV / T . i n
In this formula, ṁT.in and hT.in are the mass flow and enthalpy of the flue gas at the turbine inlet, respectively, which are equal to the mass flow and the outlet temperature of the combustion chamber. NG and LHV represent the mass flow rate of natural gas entering the chamber and its low heating value, respectively. By placing the actual amount of enthalpy output from the compressor into this formula, the enthalpy at the turbine inlet (hT.in) can be obtained. By placing the ideal enthalpy value of the compressor output in the formula, the ideal value can be established at the turbine inlet.

2.5. Energy Efficiency (EE)

The amount of energy taken from the fuel consumed varies in each scenario. For boilers, efficiency is defined separately; in cooling units, instead of efficiency, the concept of a performance coefficient is used. Therefore, the total efficiency of the system can be considered equal to the productive use of fuel consumed in the gas turbine. Using the following formula, energy efficiency in each scenario can be achieved:
EE = W n e t + Q g LHV . NG

2.6. Used Energy, Utility and Utility Fuel Ratio

The defined scenarios use a certain amount of natural gas as fuel consumption; in each scenario, a certain amount of intermediate energy and final energy is produced by consuming fuel. By comparing energy efficiency in the defined scenarios, it is not possible to fully examine the performance of energy production in the system. Therefore, to be able to compare the energies produced in each scenario with other scenarios in the field of energy production and to determine the efficiency of fuel consumption in them, the parameters of used energy, utility, and utility fuel ratio are defined, each of which examines fuel efficiency from various aspects.

2.7. Used Energy (UE)

The fuel used in each scenario is employed to generate mechanical energy and produce steam, both of which use a kind of intermediate energy stage to produce the final energy needed by the consumer. To better understand the energies produced in each scenario, a parameter called “energy used” can be defined, which is equal to the sum of the energies used from the fuel consumed in each scenario. The energies used by the system are calculated using Equation (14):
UE = W n e t + Q g

2.8. Utility

Intermediate energies change in a way that can be used in general applications. In this section, the final converted energy required to fulfill the consumers’ needs (work, heating, and cooling) is determined for each scenario, which is different from the UE. This parameter is defined as utility, which determines the amount used in the final operation of the system.
Utility = W n e t + Q C o o l i n g + Q H e a t i n g

2.9. Utility Fuel Ratio (UFR)

The ratio of fuel utility can be defined to better compare the performance of the various scenarios. The utility fuel ratio refers to energy in nature and indicates how much utility energy is produced per kilogram of fuel. The utility fuel ratio can be calculated by dividing the utility value by the amount of fuel consumed in each scenario:
UFR = Utility / NG

2.10. CO2 Utility Ratio (CUR)

Along with the consumption of natural gas in each scenario, in addition to energy production, carbon dioxide (CO2) is also produced. With the same fuel consumption being set in some scenarios, the amount of this pollutant is also the same. Therefore, it is not possible to compare the amount of pollution and determine which scenario in energy production is the cleanest system of choice. This is also understandable when analyzing other cogeneration systems. To better compare the scenarios regarding the production of pollution against the production of useful energy consumption, a parameter called CUR is defined; this shows how much CO2 is released in the production of each kilojoule of utility. CUR can be calculated from the following formula:
CUR = CO 2 / Utility

2.11. Gas Price Utility Fuel Ratio (GPUFR)

Comparing the economic efficiency of fuel consumption is not possible just by considering the amount of fuel consumed in each scenario. In scenarios where natural gas is used only in microturbines, a different amount of utility has been produced. In this way, the GPUFR parameter can be defined, indicating the cost paid to produce each kilojoule of usable energy for utility. GPUFR can be calculated using the following formula:
GPUFR = GP / UFR
In the above formula, GP (IRR/Kg) is the cost of natural gas used in the system, which has been calculated according to the tariffs for the commercial and industrial consumption of natural gas in Iran.

2.12. Desired Scenarios

In Scenario 1, the turbine is located in the fuel supply path of the oil boiler. First, in order to estimate the amount of energy required and the amount of electricity generated by the turbine intended for the oil boiler, the modeling of the scenario has been based on the arrangement in Figure 5.
In Scenario 2, the turbine is located in the fuel supply path of steam boiler 1, as shown in Figure 6. In this scenario, as in the previous scenario, first, the amount of energy required by the steam boiler is established, then we will check the amount of electricity produced.
In Scenario 3, a turbine is considered to be connected to steam boiler 2, as shown in Figure 7, so that we will be able to estimate the energy required by the boiler. Afterward, we will examine the amount of electricity generated.
In Scenario 4, the turbine is located in the path of two oil and steam boilers, as seen in Figure 8. In this scenario, the output energy of the turbine will include a large amount of fuel and the arrangement seems optimal compared to previous scenarios.
Scenario 5 is the same as Scenario 4, except that the turbine is located in the path of an oil boiler and steam boiler 2, as shown in Figure 9. After supplying the required energy to the boilers, we will then check the amount of electricity produced.
In Scenario 6, as shown in Figure 10, the turbine is located in the path of steam boilers 1 and 2 to generate electricity, and after generating electricity, it will provide the amount of energy required by these boilers.
In Scenario 7, as can be seen in Figure 11, the turbine is located in the path of steam boilers 1, 2, and 3 to generate electricity; after generating electricity, it will provide the amount of energy required by these boilers.

2.13. Specifications of the System under Study

The specifications of the equipment used in this research, along with the number of input parameters, can be found in Table 2, Table 3, Table 4 and Table 5.

3. Results

3.1. Gas Turbine Analysis

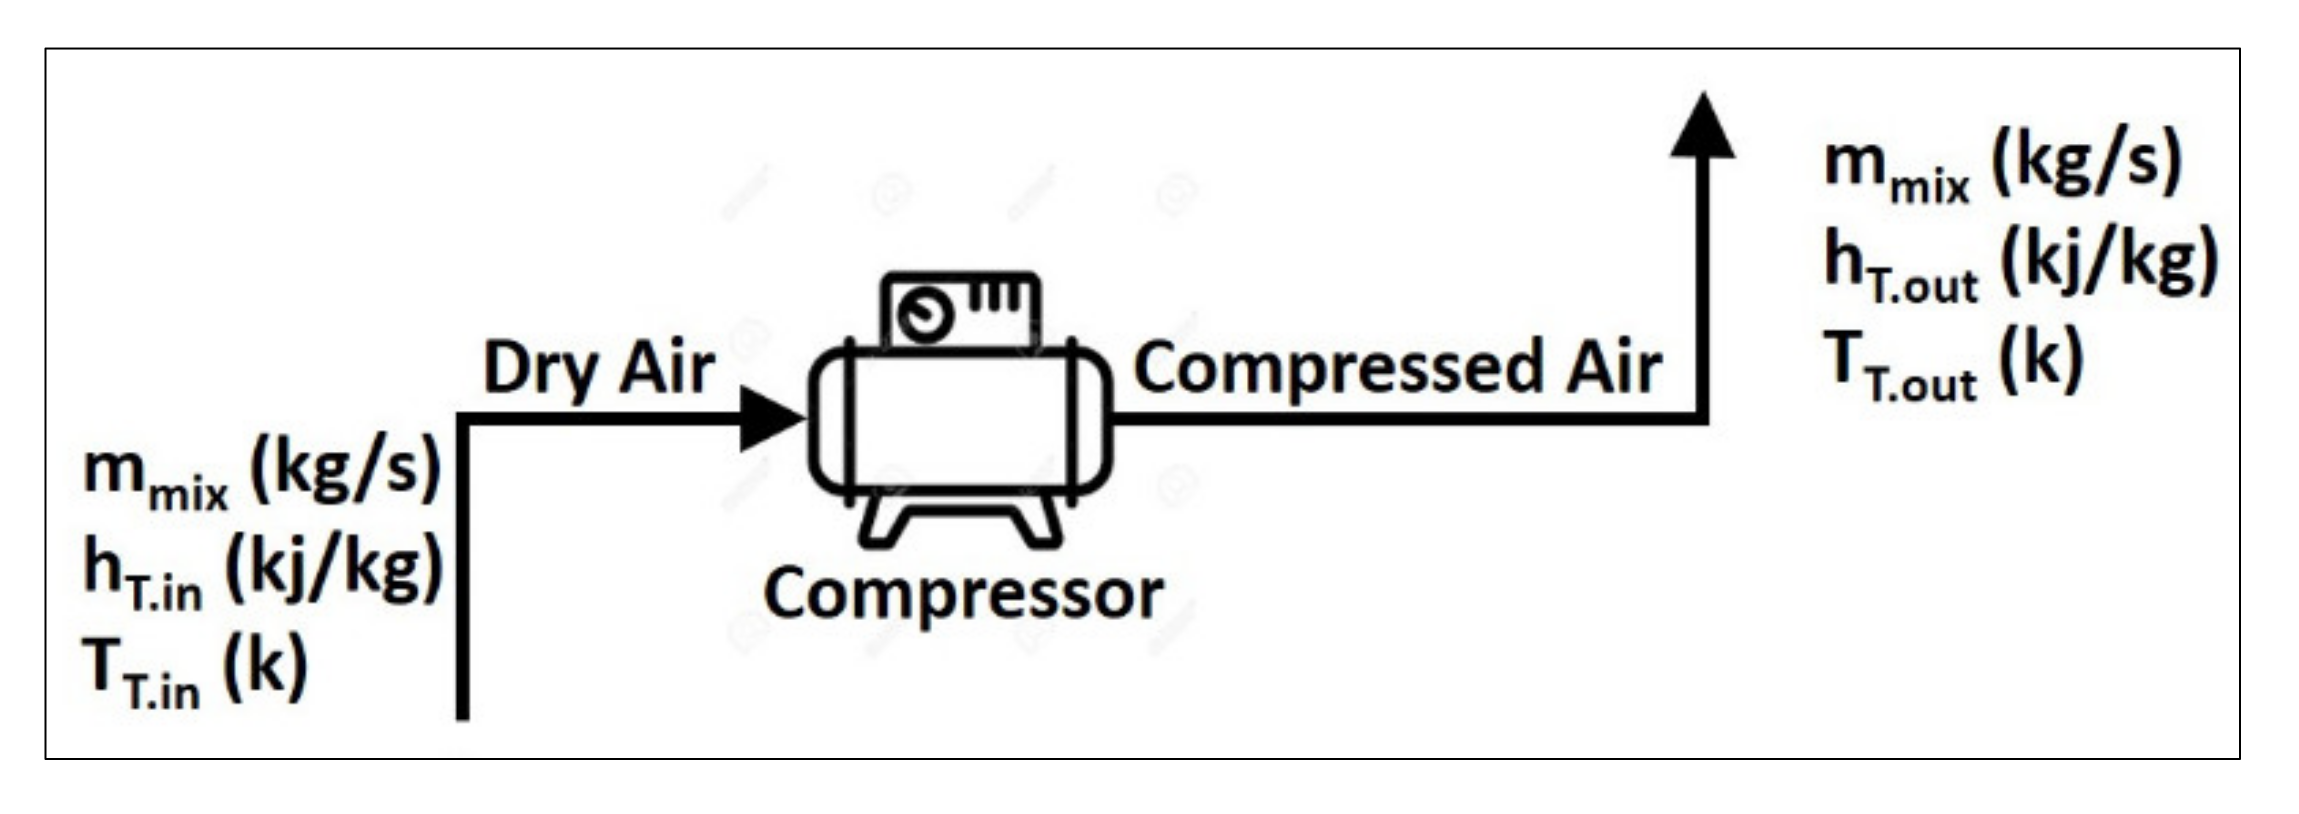
Table 4 shows the air specifications at the inlet to the compressor. By establishing the specific heat ratio of the air and the compressor density ratio, the ideal enthalpy of the compressor output can be calculated. The pressure ratio used in turbines that use an axial flow compressor is between 5 to 1 and 15 to 1, and an optimal pressure ratio is 11 to 1.
Regarding the actual enthalpy of compressor output (hC.OUT), the isentropic efficiency of the compressor is 85%, with which value the temperature of the exhaust gas from the compressor is calculated. The following table shows the air specifications at the compressor outlet.
The airflow to the compressor can be determined by the fuel consumption in the combustion chamber. Table 6 shows the analysis of natural gas entering the combustion chamber.
Using the information in 
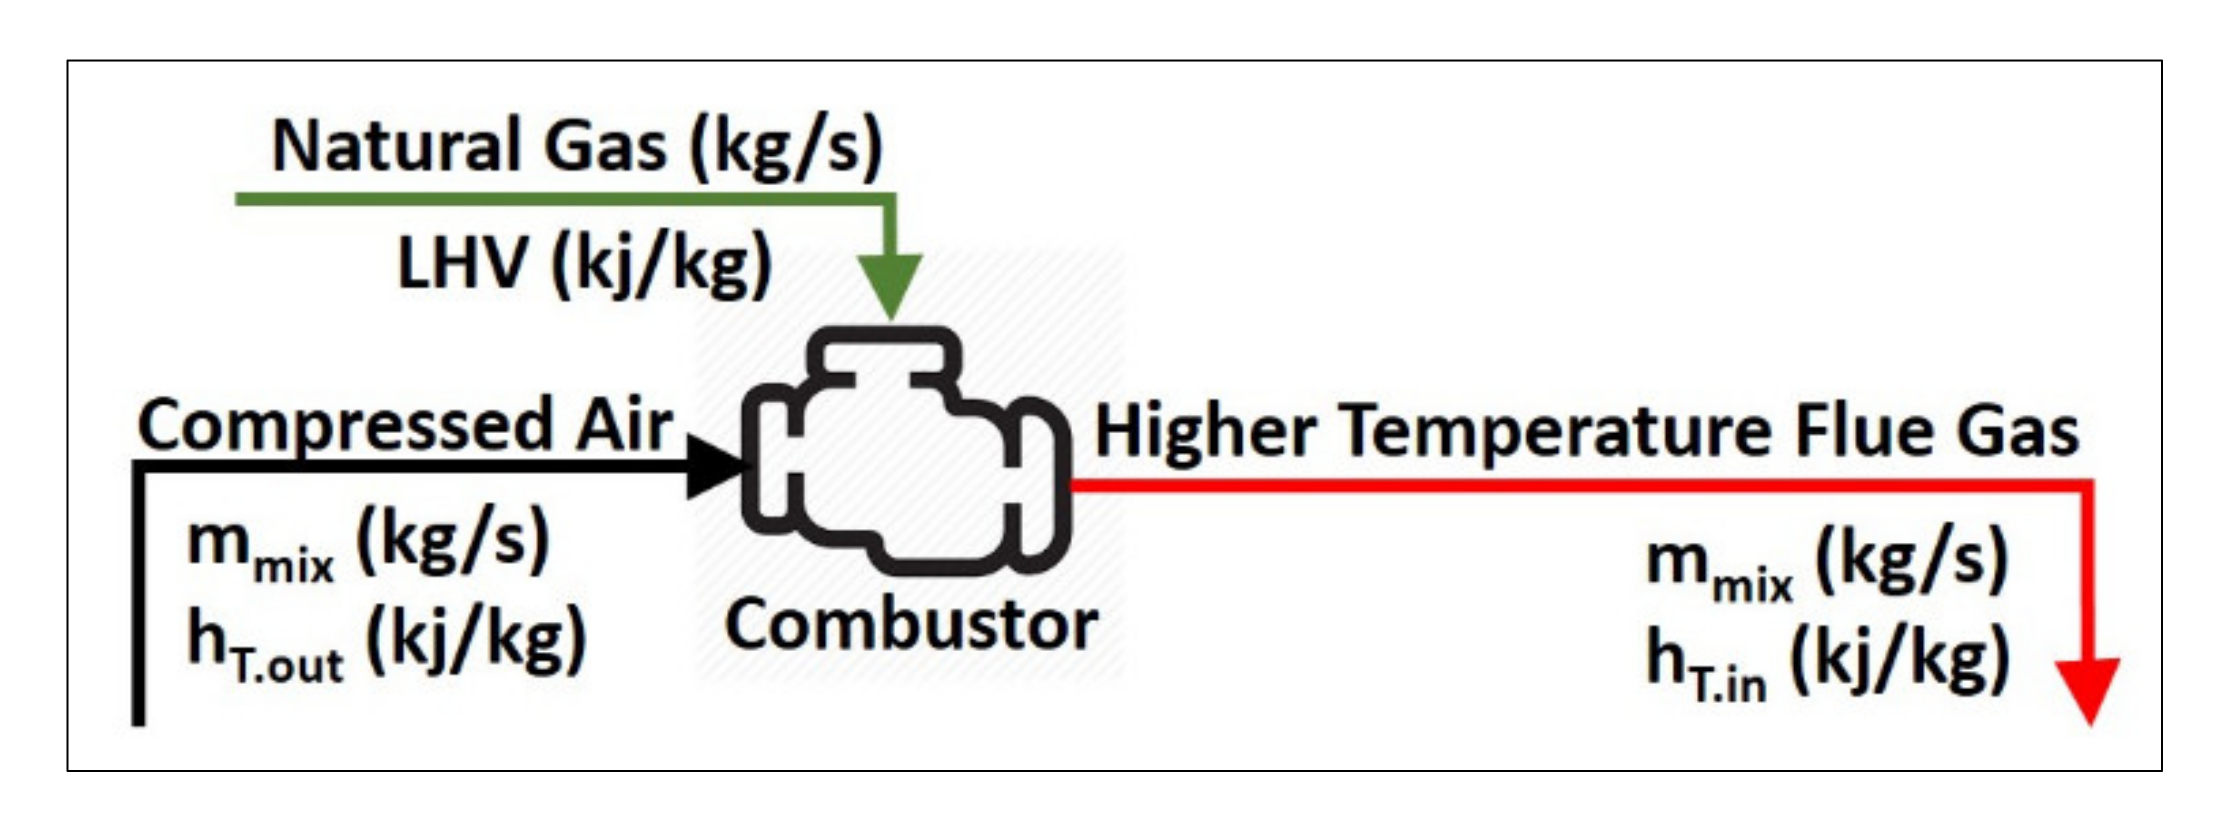
Table 7, the molecular weight of natural gas is 19.1 (kg/kmol). In this study, the amount of natural gas required to generate electricity is 0.01885 (kg/s). According to the natural gas flow, the airflow required to complete the combustion process can be obtained from stoichiometric relations, which will be equal to 0.3131 (kg/s). Thus, so far, the flue gas flow from the combustor is equal to the sum of the required airflow rates of combustion and natural gas flow. After combustion, the flue gas contains only N2, O2, and CO2, the production values of which are given in Table 7 for each of the natural gas constituents.
From Table 8, we can see that the specific heat capacity of the flue gas 
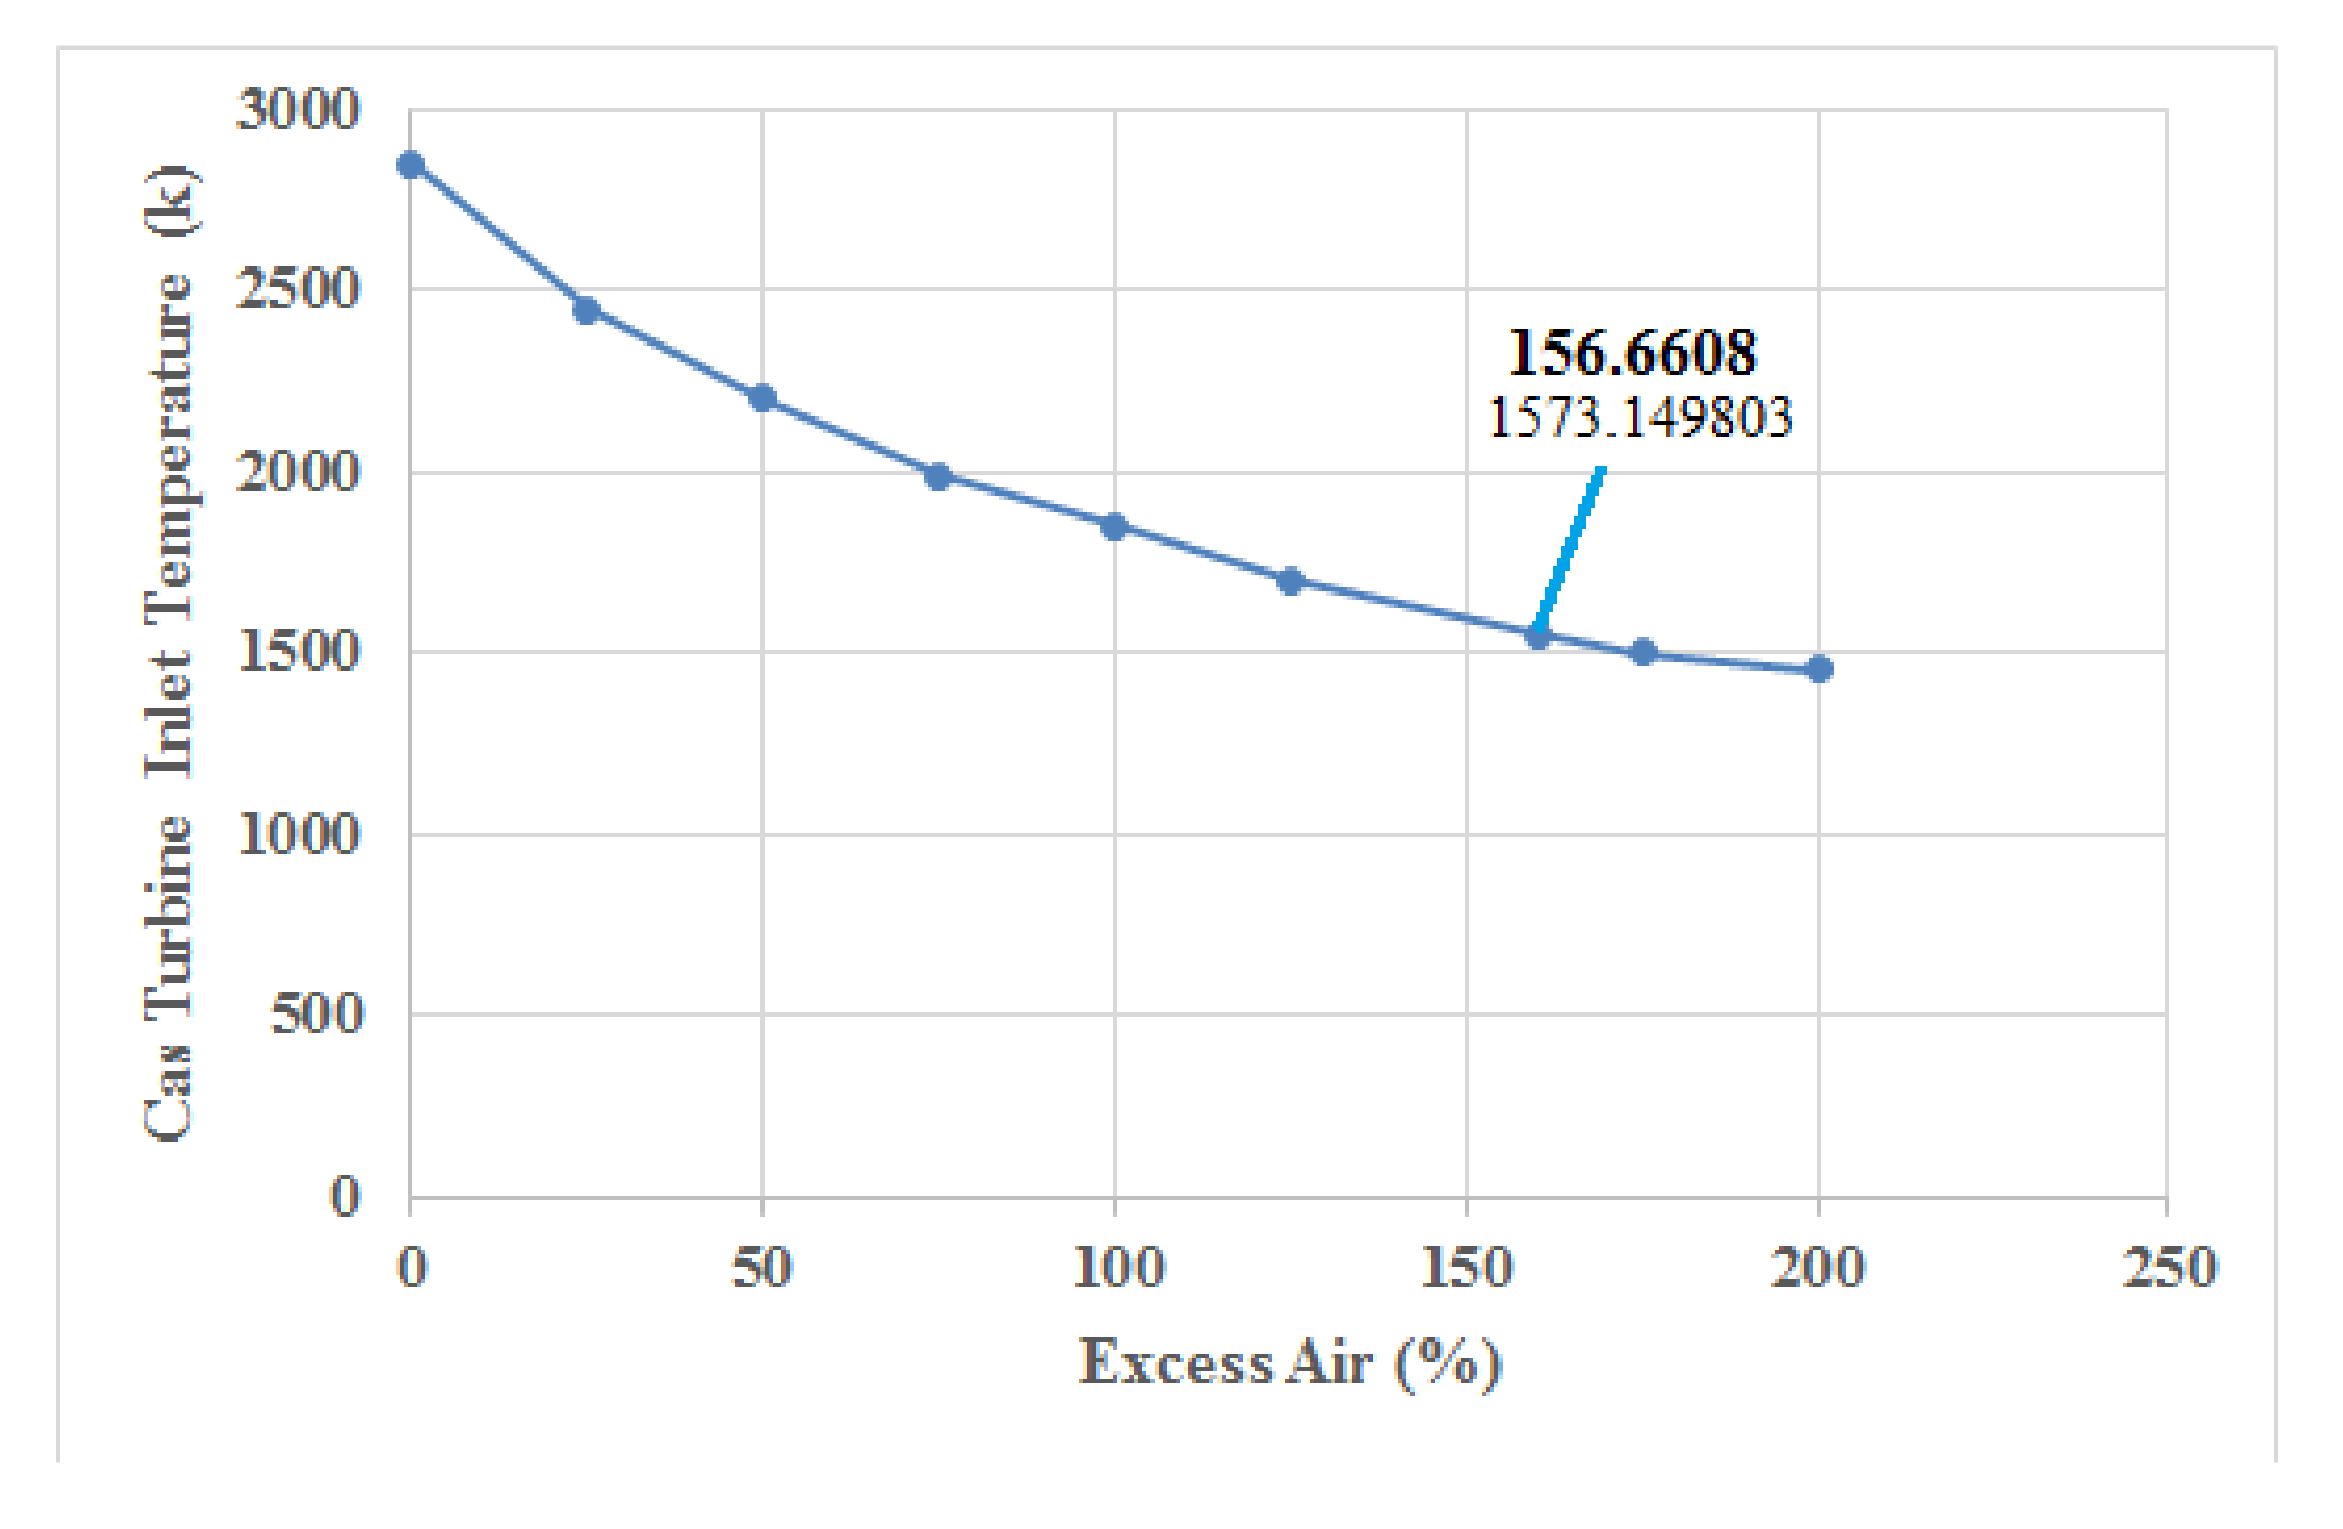
CP.mix is equal to 1.17 kJ/kg·k. Therefore, the inlet temperature to the turbine will ideally be 2835.34 Kelvin, which is a very large amount, because if gas enters the turbine at such a temperature, due to high operating stress, the turbine components will deform or creep. Considering that in real conditions, the optimal temperature for air entering the turbine is equal to 1623/15 Kelvin, for the ideal state, this value is assumed to be 1573/14 because the actual temperature is higher than the ideal temperature. To reduce the inlet temperature to the turbine, excess air must enter the compressor and then enter the combustion chamber.
By trying out scenarios and dealing with errors several times, the exact amount of excess air entering the compressor can be established to find the optimal inlet temperature for the turbine. It should be noted that the gas turbine is modeled in Excel and calculations are performed accordingly. Figure 12 shows the temperature changes of the flue gas of the turbine inlet in relation to the changes of the excess air entering the compressor.
By changing the amount of air entering the combustion chamber, in addition to the outlet temperature, the flue gas composition also changes, and, by changing that, CP.mix also changes. Figure 13 shows the changes in CP.mix relative to the excess air changes.
Finally, with the entry of 156.6618% of excess air into the gas turbine, the inlet temperature to the turbine section is optimized and the flue gas analysis will be as shown in Table 9.
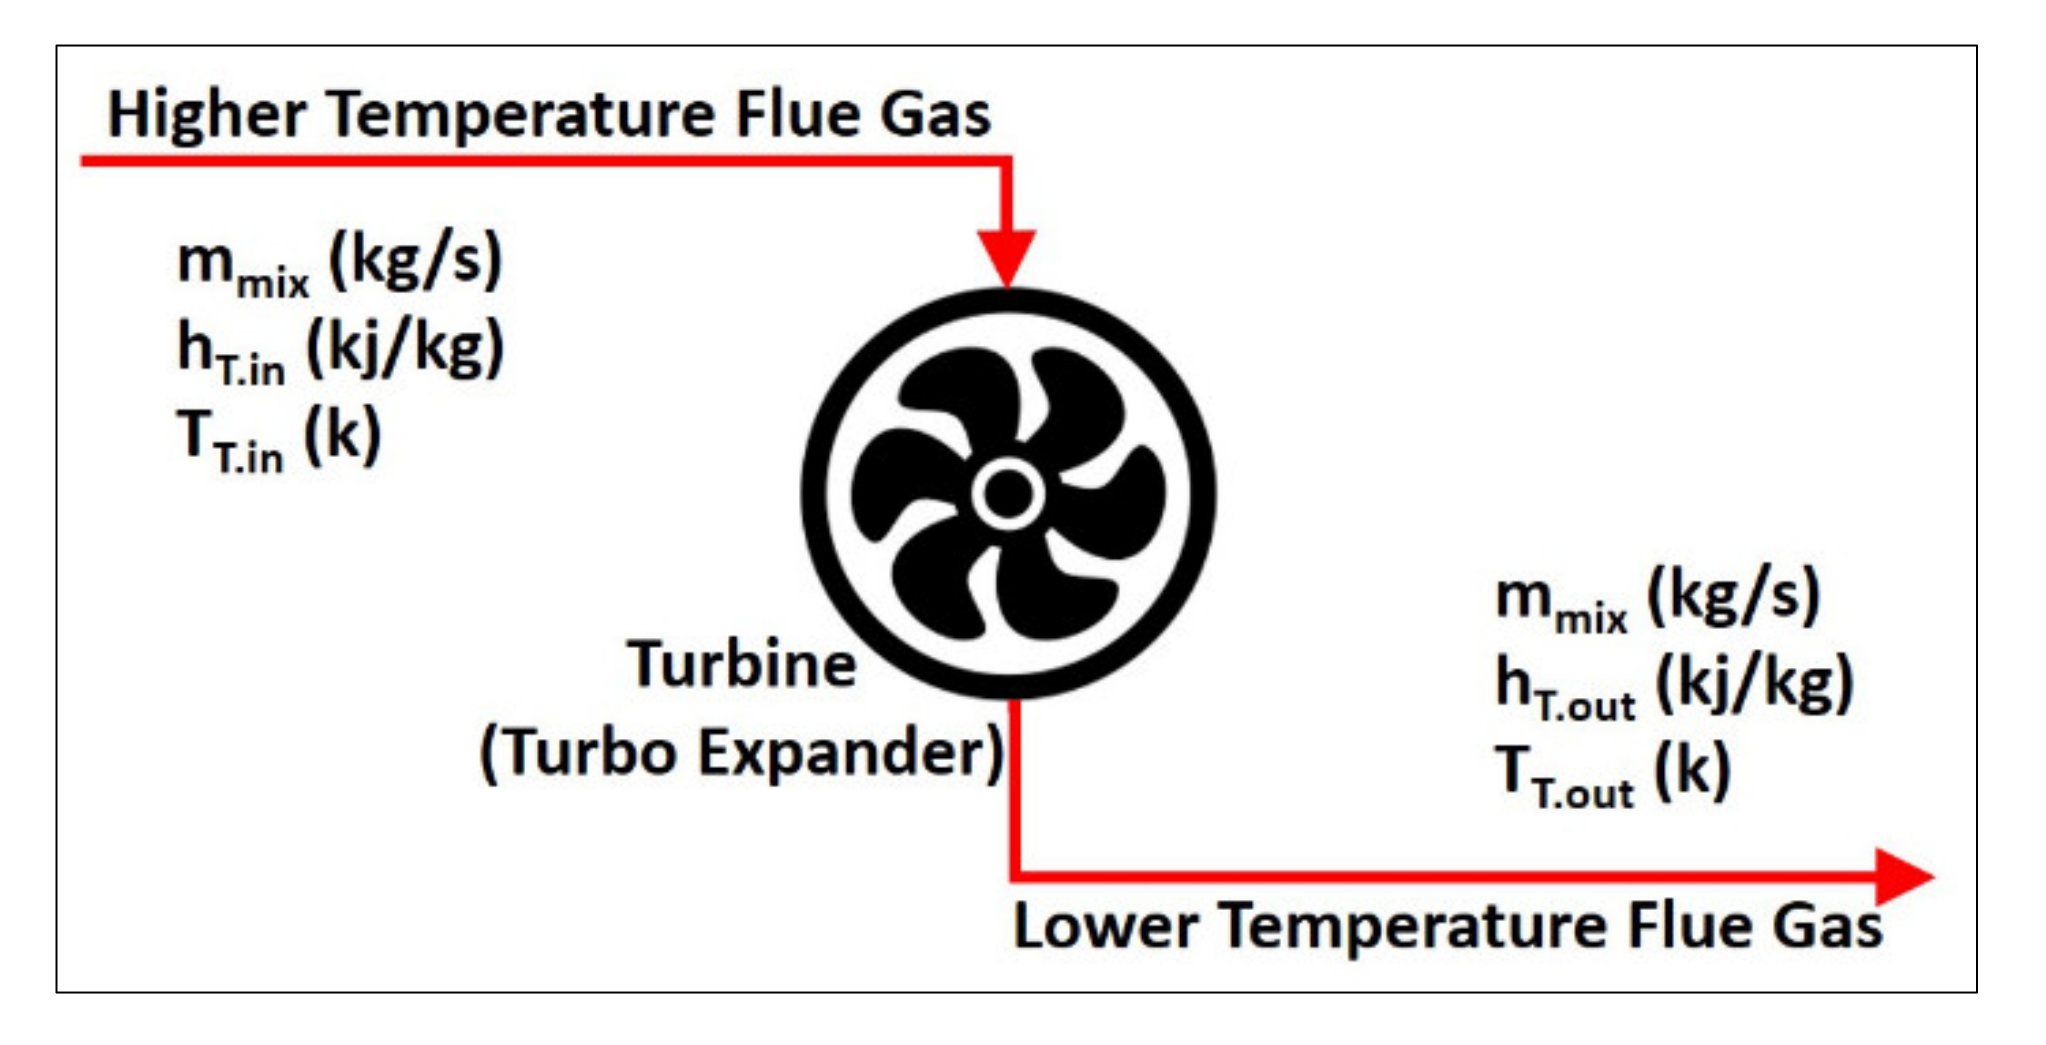
The temperature of the flue gas entering the turbine is equal to 1621/165 Kelvin; this does not pose a problem for the turbine because, in fact, the maximum allowable temperature is 1623.15 Kelvin. After the flue gas enters the turbine and the turbine blades are moved, its temperature at the turbine outlet decreases. The performance of the gas turbine per fuel unit consumed is given in Table 10.
According to data on the fuel used in gas turbines, its performance in pollution and fuel costs is as follows (Table 11).
According to the modeling, three types of converters have been designed to produce the amount of heat required by the industrial unit. The specifications of the converters are as follows (Table 12, Table 13 and Table 14).

3.2. Scenario Analysis

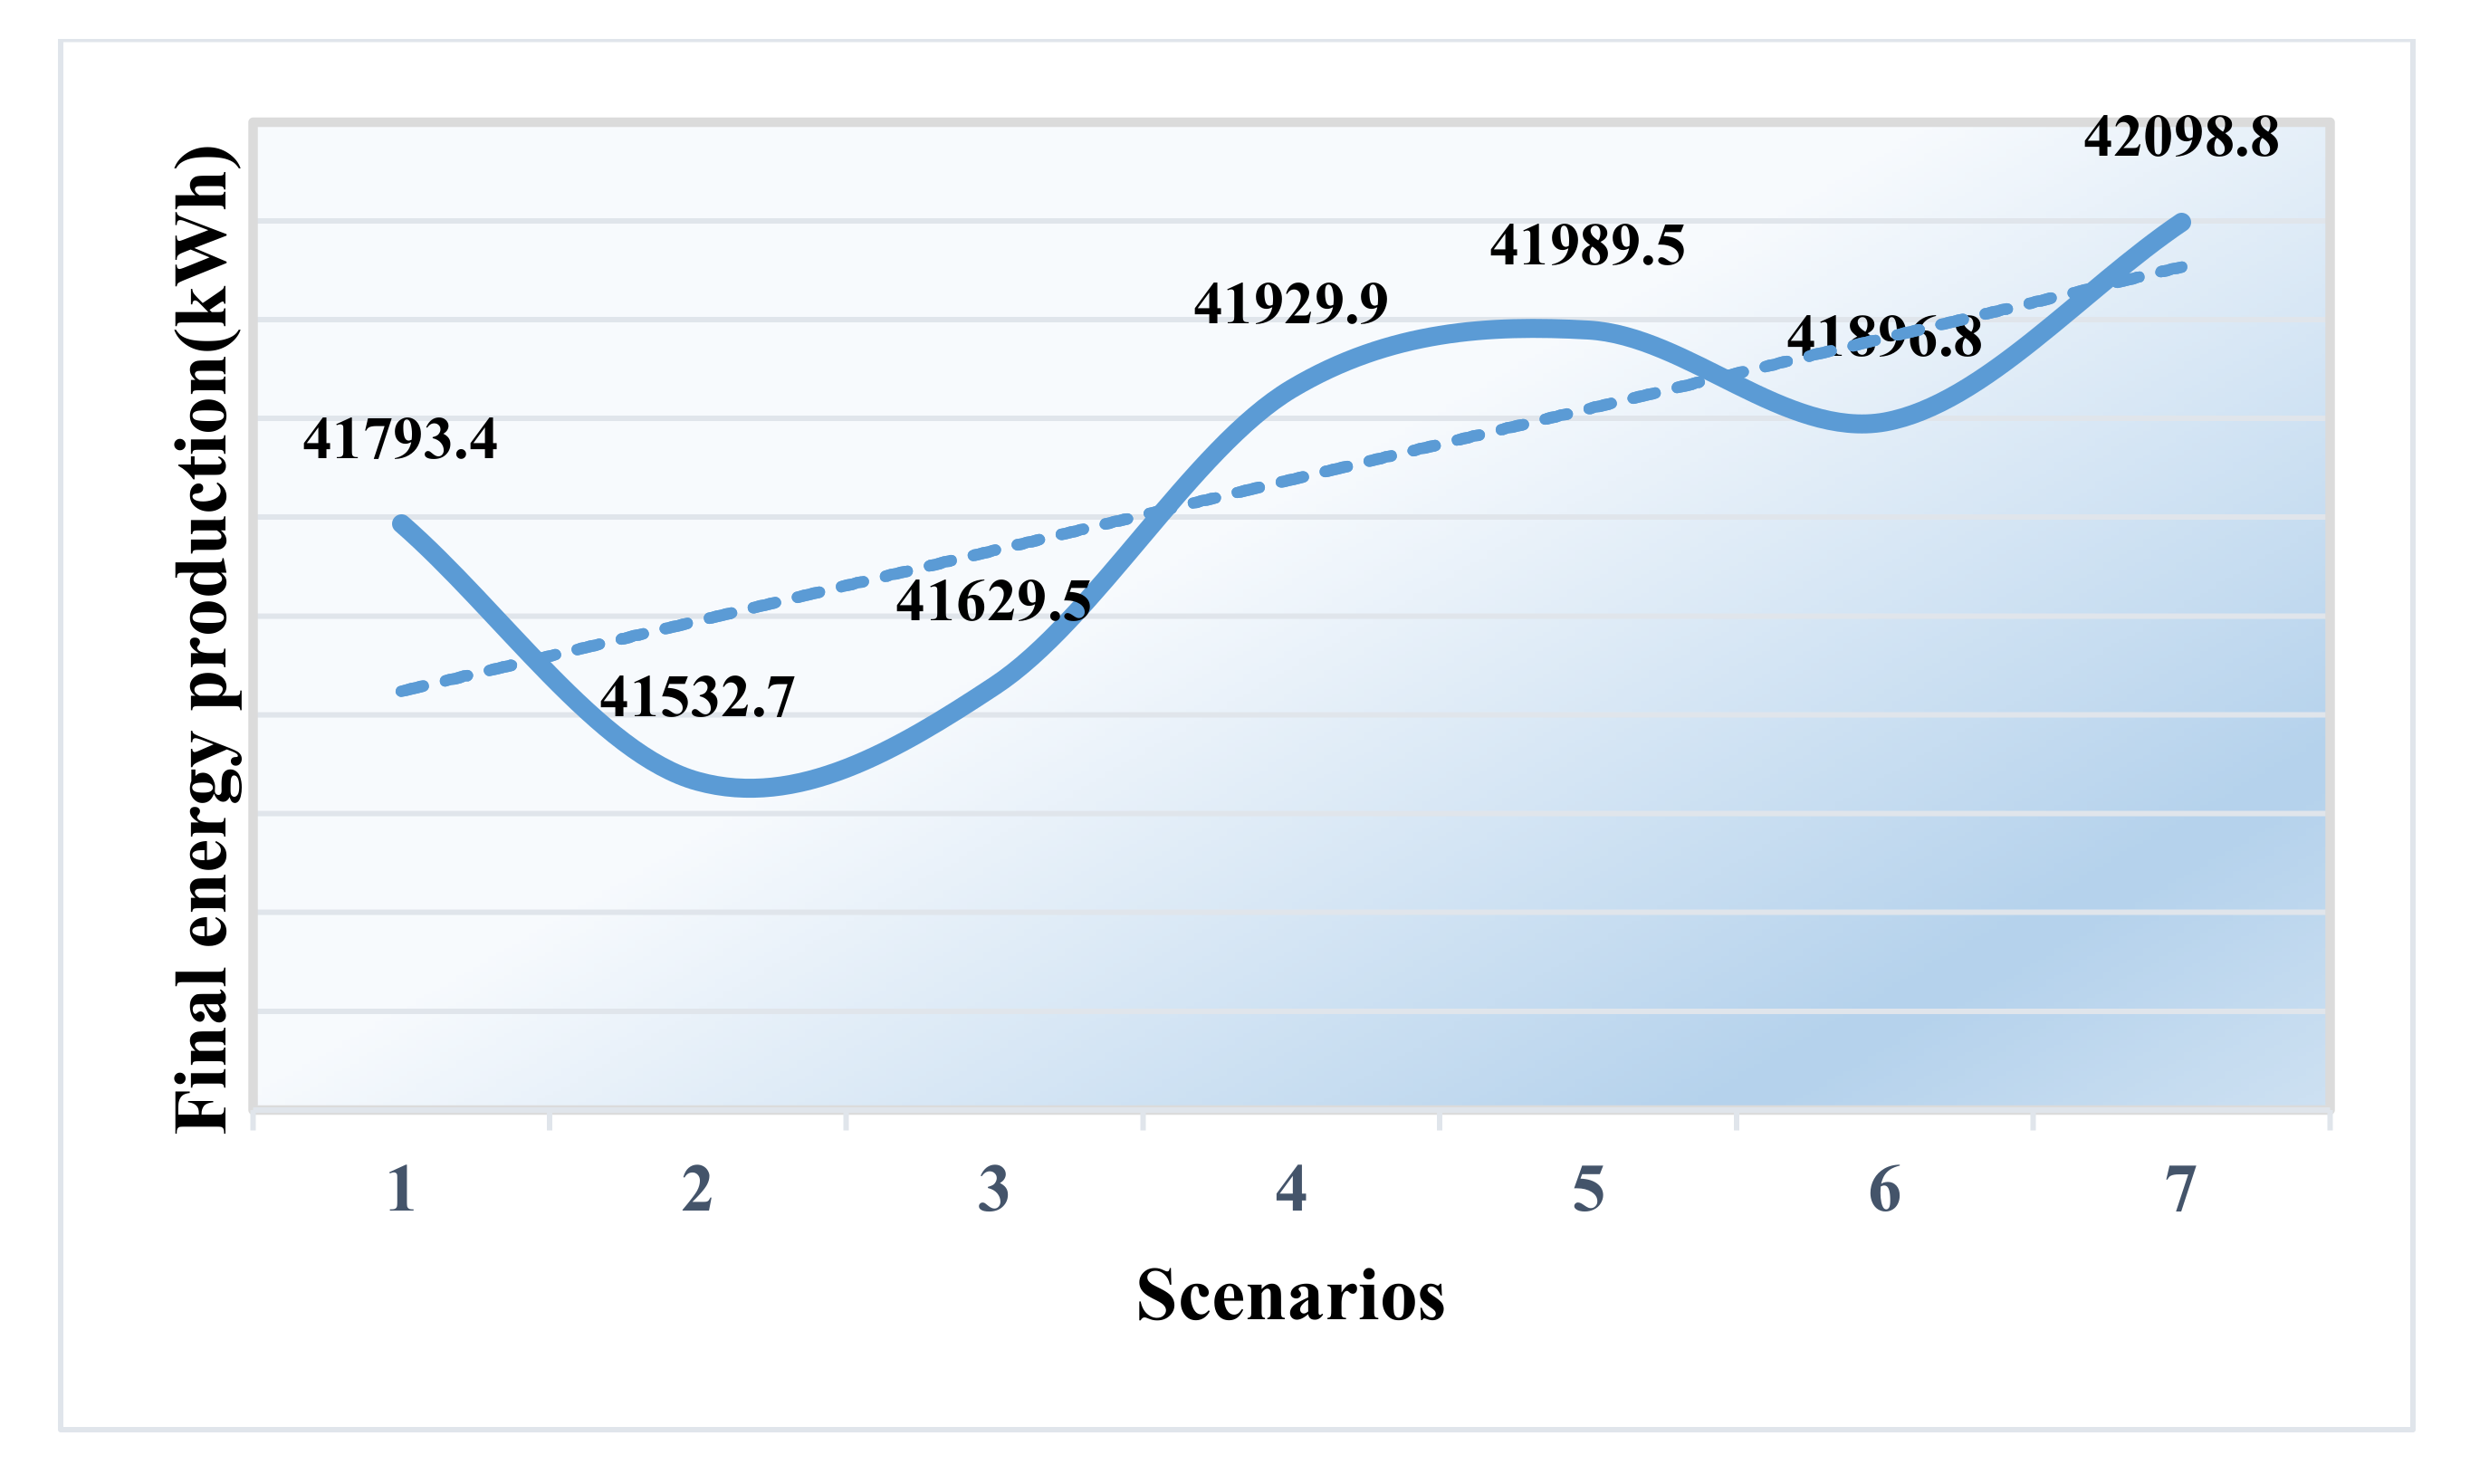
After the previous steps, we will reach the stages of energy supply assessment and review the amount of electricity generated by each of the defined scenarios, and in Table 15, the results obtained from the comparisons can be seen.
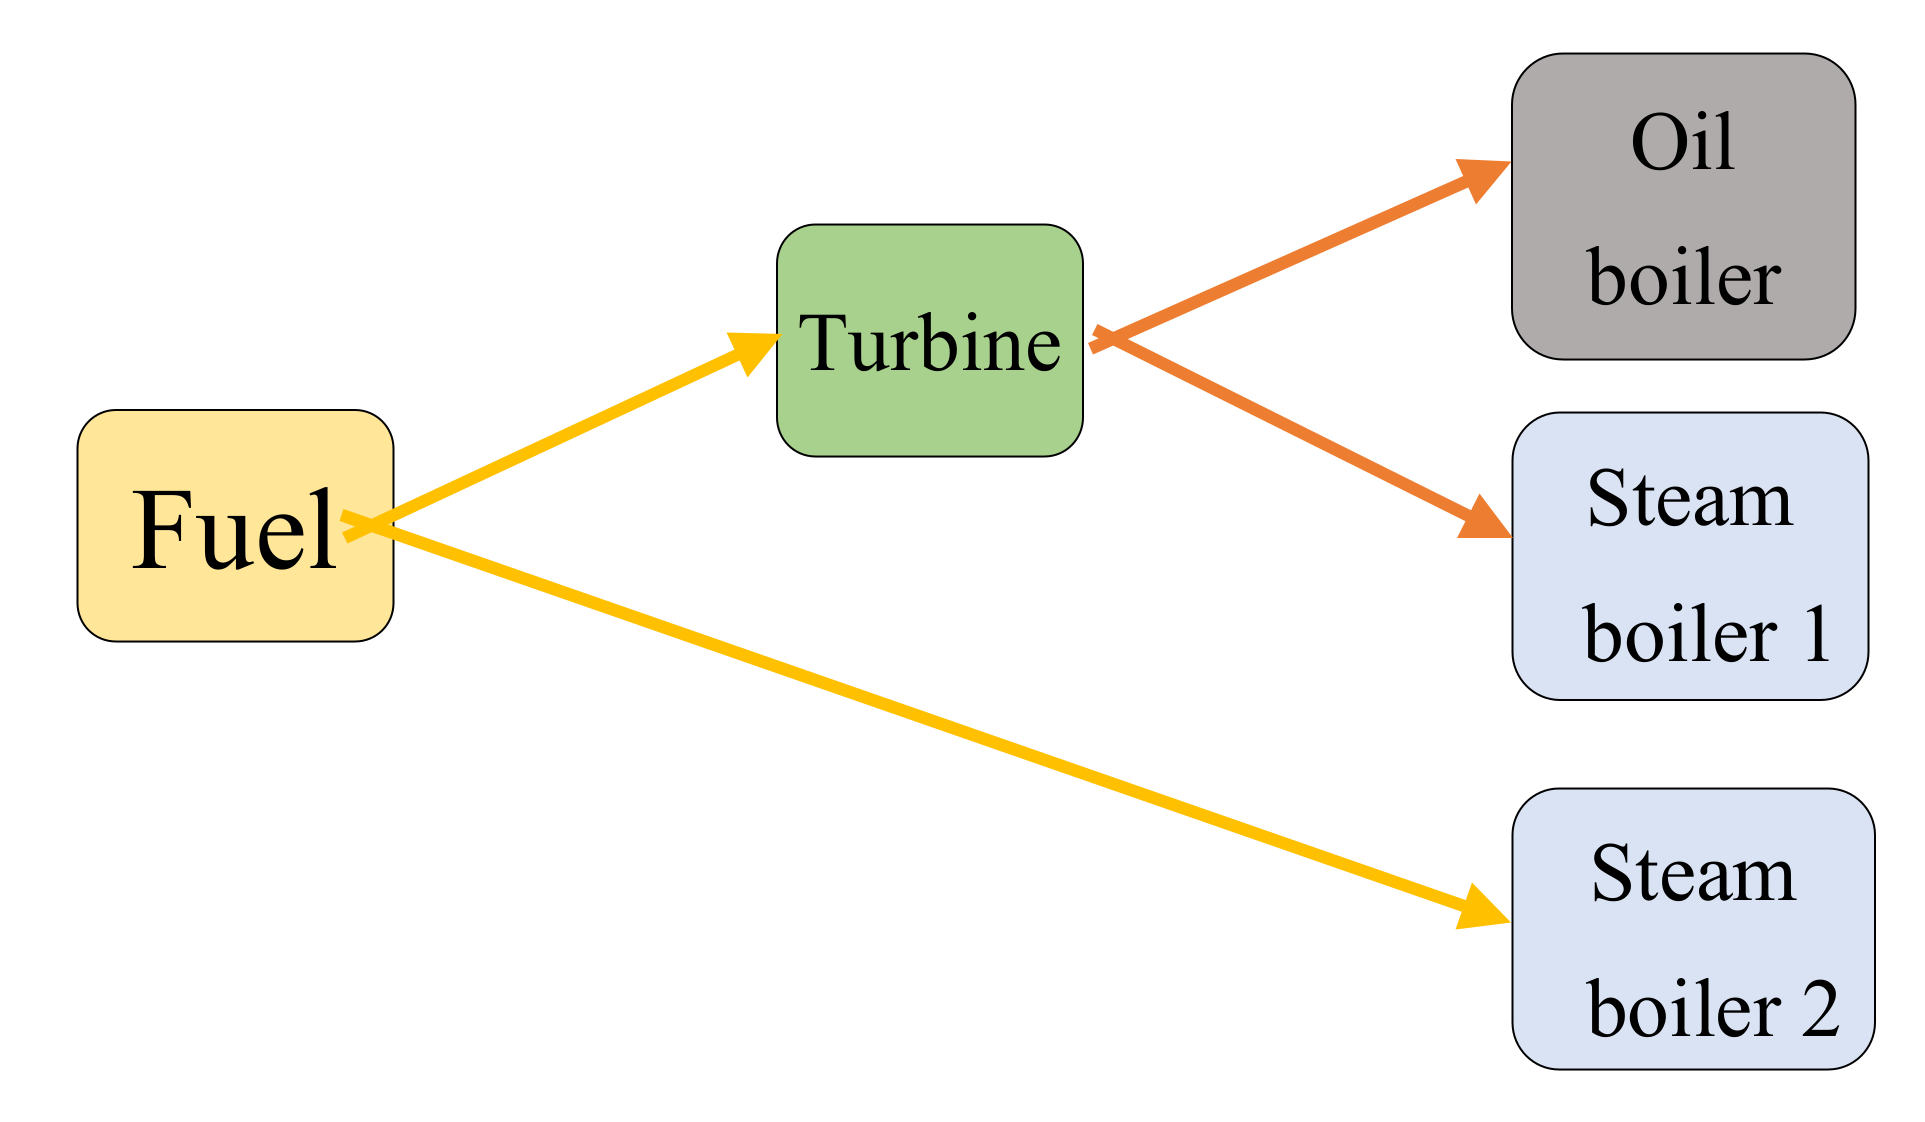
Scenario 1: In Scenario 1, natural gas consumption is equal to 0.18594 kg per second. Considering the amount of heat required for the oil boiler, the amount of electricity generated from the turbine in this scenario is equal to 361,195.3 kWh and the final energy produced is 7771.08 kg/s. The scale value of the scenario, which is the ratio of final energy to fuel consumption, will be 41,793.4 kJ/kg. Given the amount of electricity generated and energy supplied, this scenario seems to support a small percentage of the project’s expectations.
Scenario 2: In Scenario 2, natural gas consumption is equal to 0.159672 kg/s. According to the previous scenario, due to the reduction of the heat demand of steam boiler 1 compared to the oil boiler that was supplied in Scenario 1, fuel consumption, as well as electricity generation, has also decreased. Due to the supply of heat required for steam boiler 1, the amount of electricity generated from the turbine in this scenario is equal to 139,280.4 kWh and the final energy produced is 6631.62 kg/s. Finally, the scale of the value of the scenario will be equal to 41,532.7 kJ/kg, which is less than the previous scenario; therefore, the value of fuel produced will be less than Scenario 1, according to the amount of electricity production and energy supply. This scenario also seems to support a small percentage of the project’s expectations.
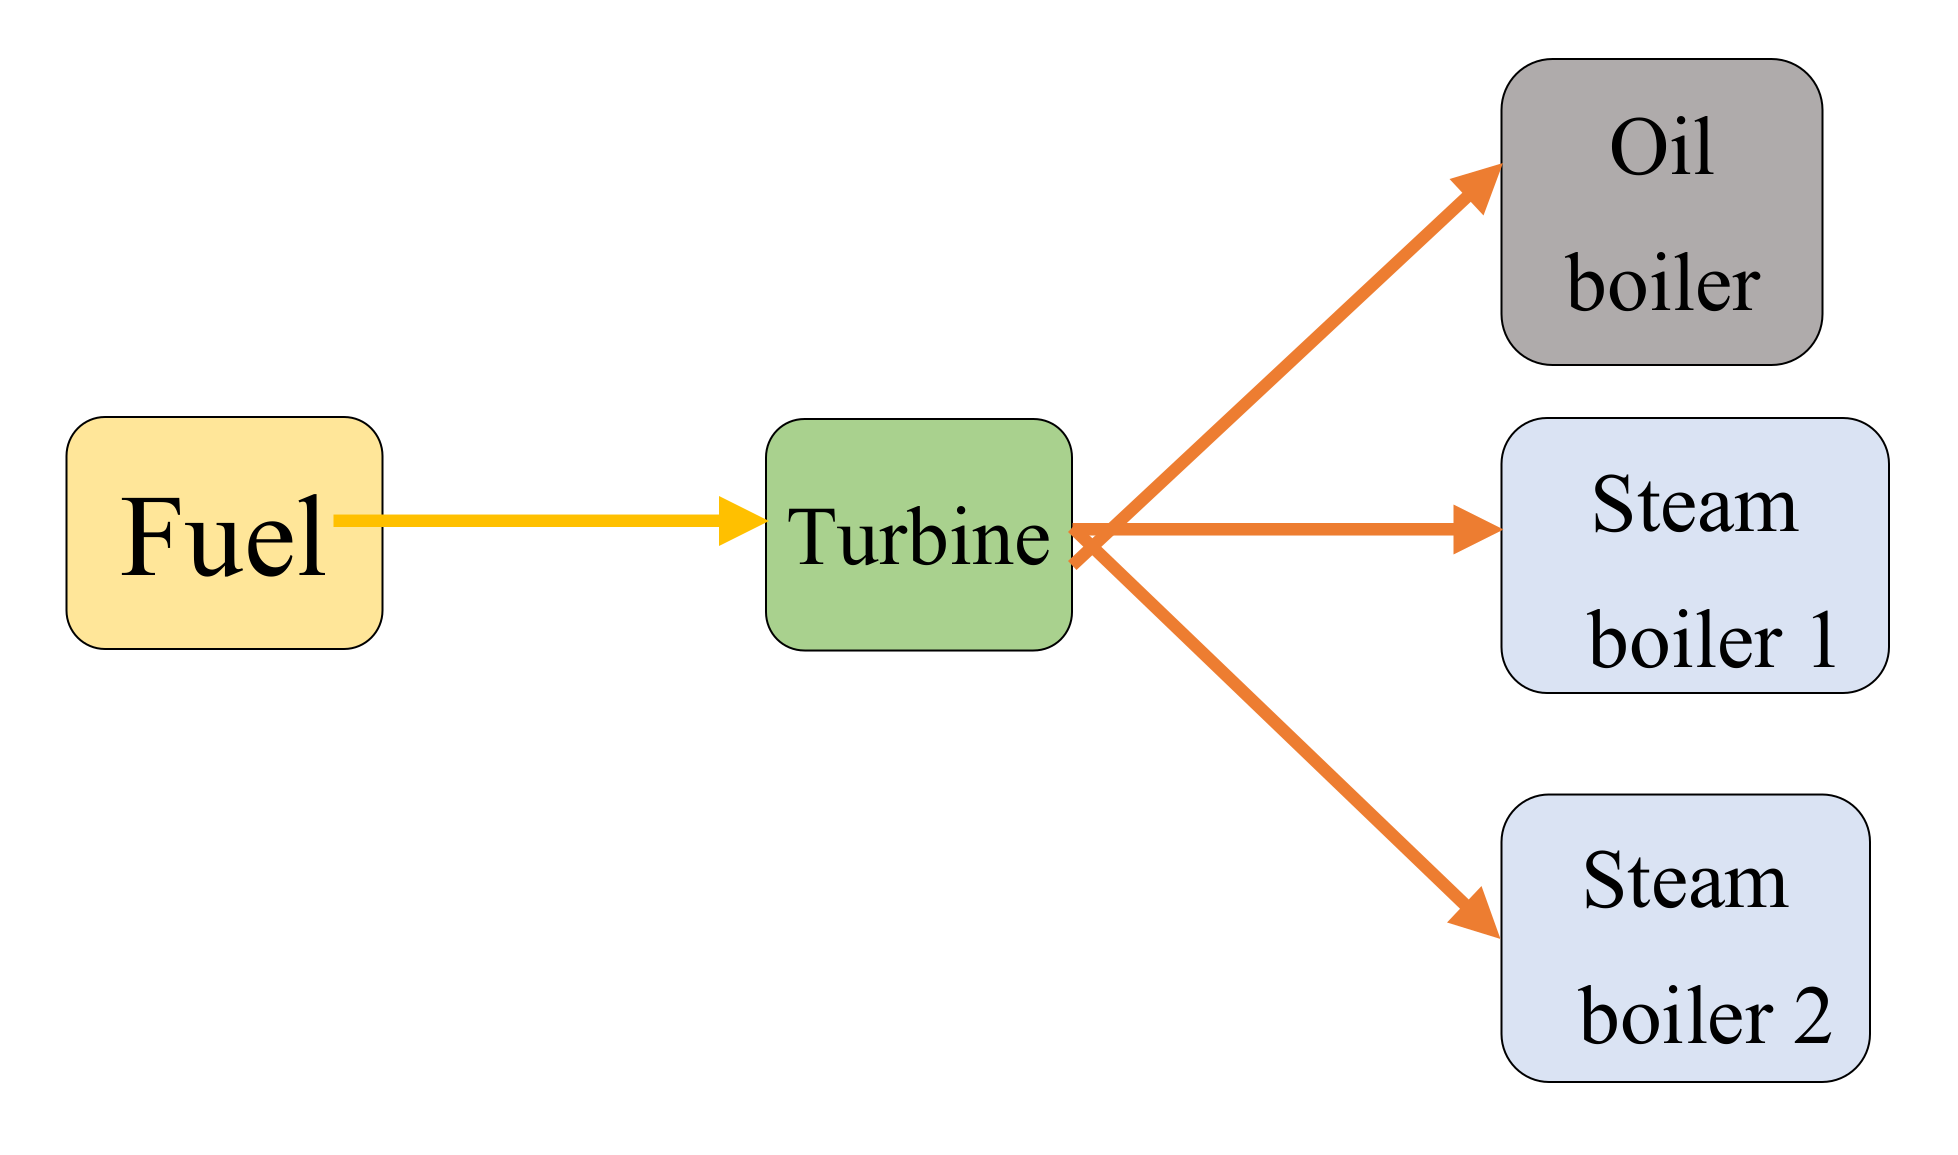
Scenario 3: In Scenario 3, natural gas consumption is equal to 0.168428 kg/s, which has increased compared to the previous scenario and has decreased compared to scenario 1, due to the reduced heat demand of steam boiler 2 compared to the oil boiler, which in Scenario 1 provides heat. The amount of fuel consumption, as well as the amount of electricity production, has also decreased. Due to the supply of heat required for steam boiler 2, the amount of electricity generated by the turbine in this scenario is equal to 28,542,121 kWh and the final energy produced is 7011.52 kg/s. Finally, the scale of the value of the scenario will be equal to 41,629.5 kJ/kg, which is higher than the previous scenario; as a result, the value of fuel produced will be less than Scenario 1. Given the amount of electricity generated and energy supplied, this scenario also seems to support a small percentage of the project’s expectations.
Scenario 4: In Scenario 4, natural gas consumption is equal to 0.203452 kg/s. As in the previous scenarios, in this scenario of two oil and steam boilers, with one heated simultaneously, the amount of fuel consumption and also the amount of production are increased. The electricity needed has also increased. Due to the required supply of heat, the amount of electricity generated from the turbine in this scenario is equal to 7,683,518 kWh, and the final energy produced is 8530.72 kg/s. Finally, the value scale of the scenario will be equal to 42,929.9 kJ/kg, which is more than in the previous scenarios; however, considering the amount of electricity generated and the energy supplied, it seems that this scenario will not be economical in terms of investment costs.
Scenario 5: In Scenario 5, natural gas consumption is equal to 0.212208 kg per second. As in the previous scenarios, in this scenario, two oil and steam boilers are supplied with heat simultaneously. The amount of fuel consumption and also the amount of production have increased. Electricity has also increased. In terms of the supply of required heat, the amount of electricity generated from the turbine in this scenario is equal to 1,561,292,222 kWh and the final energy produced is 8910.56 kg/s. Finally, the scale of the value of the scenario will be equal to 49.54 kJ/kg, which is more than the previous scenarios; however, considering the amount of electricity generated and energy supplied, it seems that this scenario will not be economical in terms of investment costs.
Scenario 6: In Scenario 6, natural gas consumption is equal to 0.194696 kg/s. In this scenario, two steam boilers are heated simultaneously. Fuel consumption, as well as electricity generation, has increased. Due to the supply of the required heat, the amount of electricity generated from the turbine in this scenario is equal to 54.1922222 kWh and the final energy produced is 8150.91 kg/s. Finally, the scale value of the scenario will be equal to 481,896.8 kJ/kg, which is less than the previous two scenarios; considering the amount of electricity generated and energy supplied, it seems that this scenario will not be economical in terms of investment costs.
Scenario 7: This scenario is the most complete scenario, with the highest gas consumption but high electricity generation, as well as more reliability; this is ultimately the most profitable scenario. In this model, the required amount of heat can be provided for the three boilers and a significant amount of electricity can be sold to the network or factories of an industrial town; after a sufficient time has passed, this scenario will see a return on the investment costs. Figure 14, Figure 15, Figure 16 and Figure 17 show a comparison between different scenarios

4. Conclusions

For many years, developed industrialized countries have availed themselves of numerous natural and industrial facilities for energy production, in addition to trying to develop renewable energy resources (sun, wind, waves, etc.), They have placed the proper use of energy at the top of their sustainable development goals. By setting these goals and by setting guidelines and, in some cases, restrictive rules and regulations, they encourage, guide, and even direct industry owners, craftsmen, managers of organizations to prevent the further wasting of energy. In recent years, in our own country, the Iran Fuel Conservation Company has put in place various instructions to raise awareness in different sectors of industry about the issue of energy consumption optimization. The textile industry is one of the oldest industries in our country and considering that the textile industry accounts for a relatively high share of the total energy consumption of the industrial sector; therefore, optimizing energy consumption in this industry is of particular importance.
With regard to the obtained results, it is clear that most of the electricity generation achieved is from Scenario 7, in which the turbine is located between the inlet fuel point and the boilers, and the turbine is used for preheating the boiler inlet. In this study, the amount of gas consumed is the same in all scenarios. According to the results, the amount of electrical energy produced in the selected scenario is 4,991,160.3 kWh, the gas consumption for this scenario is 0.22972 kg/s.
Many works could constructively flesh out the work begun in this present study. The following possibilities can be considered in future works:
  • Exergo-economic analysis may be performed.
  • Exergy and environmental analysis may be conducted.
  • Multi-objective optimization of the studied system could be achieved with intelligent algorithms.
  • Pinch analysis could be utilized to identify points of thermal waste.

Author Contributions

Conceptualization, R.A. and M.S.; methodology, T.V.M. and R.A.; software, J.W.G.G. and M.S and R.A.; validation, R.A. and Y.E.; formal analysis, R.A. and M.S.; investigation, R.A. and Y.E.; writing—original draft preparation, R.A and M.S and T.V.M.; writing—review and editing, R.A.; All authors have read and agreed to the published version of the manuscript.

Funding

This research received no external funding.

Institutional Review Board Statement

Not applicable.

Informed Consent Statement

Not applicable.

Data Availability Statement

All necessary data are provided in the manuscript.

Conflicts of Interest

There is no conflict of interest.

Nomenclature

CHPCombined heat and power
EEEnergy efficiency
UEUsed energy
UFRUtility fuel ratio
CURCO2 utility ratio
GPUFRGas price utility fuel ratio
TT.outThe outlet temperature of the turbine under ideal conditions
TT.inThe values of the inlet air temperature
kThe specific heat ratio
h/TThe isentropic efficiency of the turbine
hC.inThe enthalpy of the air entering the compressor
hT.inThe enthalpy at the turbine inlet
GPThe cost of natural gas used in the system
airThe mass flow of the air entering the compressor
ρ(NG)Fuel density (Kg/m3)
GPConsumption fuel price (IRR/m3)
LHVCalorific value of fuel consumed (Kj/Kg)
NG(b.T)Total amount of natural gas consumed (kg/s)
EC(P)Total unit power consumption (kWh)
T1.wInlet water temperature to the boiler (K)
T2.wBoiler outlet steam temperature (K)
Cp.wSpecific heat capacity of water (Kj/(Kg·K))
m(b1)Production steam output in Boiler 1 (Kg/s)
ɳbBoiler efficiency
Q(b1)Heat required to produce steam (Kj/s)
NG(b1)Natural gas required to produce the required heat (Kg/s)

References

  1. Chu, X.; Yang, D.; Li, J. Sustainability assessment of combined cooling, heating, and power systems under carbon emission regulations. Sustainability 2019, 11, 5917. [Google Scholar] [CrossRef] [Green Version]
  2. Alayi, R.; Kasaeian, A.; Atabi, F. Thermal analysis of parabolic trough concentration pho-tovoltaic/thermal system for using in buildings. Environ. Prog. Sustain. Energy 2019, 38, 13220. [Google Scholar] [CrossRef]
  3. Ghorbani, B. Development of an Integrated Structure for the Tri-Generation of Power, Liquid Carbon Dioxide, and Medium Pressure Steam Using a Molten Carbonate Fuel Cell, a Dual Pressure Linde-Hampson Liquefaction Plant, and a Heat Recovery Steam Generator. Sustainability 2021, 13, 8347. [Google Scholar] [CrossRef]
  4. Argyrou, M.C.; Christodoulides, P.; Kalogirou, S.A. Energy storage for electricity generation and related processes: Technologies appraisal and grid scale applications. Renew. Sustain. Energy Rev. 2018, 94, 804–821. [Google Scholar] [CrossRef]
  5. Mirzaei, M.; Ahmadi, M.H.; Mobin, M.; Nazari, M.A.; Alayi, R. Energy, exergy and eco-nomics analysis of an ORC working with several fluids and utilizes smelting furnace gases as heat source. Therm. Sci. Eng. Prog. 2018, 5, 230–237. [Google Scholar] [CrossRef]
  6. Zhao, Y.; Liu, G.; Li, L.; Yang, Q.; Tang, B.; Liu, Y. Expansion devices for organic Rankine cycle (ORC) using in low temperature heat recovery: A review. Energy Convers. Manag. 2019, 199, 111944. [Google Scholar] [CrossRef]
  7. Chen, L.; Wang, Y.; Xie, M.; Ye, K.; Mohtaram, S. Energy and exergy analysis of two modified adiabatic compressed air energy storage (A-CAES) system for cogeneration of power and cooling on the base of volatile fluid. J. Energy Storage 2021, 42, 103009. [Google Scholar] [CrossRef]
  8. Li, B.; Wang, S.S. Thermo-economic analysis and optimization of a novel carbon dioxide based combined cooling and power system. Energy Convers. Manag. 2019, 199, 112048. [Google Scholar] [CrossRef]
  9. Yuan, J.; Wu, C.; Xu, X.; Liu, C. Multi-mode analysis and comparison of four different carbon dioxide-based combined cooling and power cycles for the distributed energy system. Energy Convers. Manag. 2021, 244, 114476. [Google Scholar] [CrossRef]
  10. Alayi, R.; Mohkam, M.; Seyednouri, S.R.; Ahmadi, M.H.; Sharifpur, M. Energy/economic analysis and optimization of on-grid photovoltaic system using CPSO algorithm. Sustainability 2021, 13, 12420. [Google Scholar] [CrossRef]
  11. Anvari, S.; Desideri, U.; Taghavifar, H. Design of a combined power, heating and cooling system at sized and undersized configurations for a reference building: Technoeconomic and topological considerations in Iran and Italy. Appl. Energy 2020, 258, 114105. [Google Scholar] [CrossRef]
  12. Adebayo, T.S.; Rjoub, H. A new perspective into the impact of renewable and nonrenewable energy consumption on environmental degradation in Argentina: A time–frequency analysis. Environ. Sci. Pollut. Res. 2021, 1–17. [Google Scholar] [CrossRef] [PubMed]
  13. Wang, Z.; Zhang, C.; Li, H.; Zhao, Y. A multi agent-based optimal control method for combined cooling and power systems with thermal energy storage. In Building Simulation; Tsinghua University Press: Beijing, China, 2021; Volume 14, pp. 1709–1723. [Google Scholar]
  14. Mughal, N.; Arif, A.; Jain, V.; Chupradit, S.; Shabbir, M.S.; Ramos-Meza, C.S.; Zhanbayev, R. The role of technological innovation in environmental pollution, energy consumption and sustainable economic growth: Evidence from South Asian economies. Energy Strategy Rev. 2022, 39, 100745. [Google Scholar] [CrossRef]
  15. Chong, C.T.; Van Fan, Y.; Lee, C.T.; Klemeš, J.J. Post COVID-19 ENERGY sustainability and carbon emissions neutrality. Energy 2021, 241, 122801. [Google Scholar] [CrossRef]
  16. Hoang, A.T. Waste heat recovery from diesel engines based on Organic Rankine Cycle. Appl. Energy 2018, 231, 138–166. [Google Scholar] [CrossRef]
  17. Adebayo, T.S.; Rjoub, H. Assessment of the role of trade and renewable energy consumption on consumption-based carbon emissions: Evidence from the MINT economies. Environ. Sci. Pollut. Res. 2021, 28, 58271–58283. [Google Scholar] [CrossRef]
  18. Krishna, K.S.; Kumar, K.S. A review on hybrid renewable energy systems. Renew. Sustain. Energy Rev. 2015, 52, 907–916. [Google Scholar] [CrossRef]
  19. Onar, O.C.; Khaligh, A. Chapter 2—Energy Sources. In Alternative Energy in Power Electronics; Rashid, M.H., Ed.; Butterworth-Heinemann: Boston, MA, USA, 2015; pp. 81–154. [Google Scholar]
  20. Adebayo, T.S.; Rjoub, H.; Akinsola, G.D.; Oladipupo, S.D. The asymmetric effects of renewable energy consumption and trade openness on carbon emissions in Sweden: New evidence from quantile-on-quantile regression approach. Environ. Sci. Pollut. Res. 2021, 29, 1875–1886. [Google Scholar] [CrossRef]
  21. Lu, H.; Huang, K.; Azimi, M.; Guo, L. Blockchain technology in the oil and gas industry: A review of applications, opportunities, challenges, and risks. IEEE Access 2019, 7, 41426–41444. [Google Scholar] [CrossRef]
  22. Fuel Shares of Total Primary Energy Supply. Available online: https://www.iea.org/publications/freepublications/publication/key-world-energy-statistics-2014.html (accessed on 20 September 2014).
  23. Odugbesan, J.A.; Rjoub, H. Relationship among economic growth, energy consumption, CO2 emission, and urbanization: Evidence from MINT countries. Sage Open 2020, 10, 2158244020914648. [Google Scholar] [CrossRef] [Green Version]
  24. Alayi, R.; Kumar, R.; Seydnouri, S.R.; Ahmadi, M.H.; Issakhov, A. Energy, environment and economic analyses of a parabolic trough concentrating photovoltaic/thermal system. Int. J. Low-Carbon Technol. 2021, 16, 570–576. [Google Scholar] [CrossRef]
  25. Wang, J.; Han, Z.; Guan, Z. Hybrid solar-assisted combined cooling, heating, and power systems: A review. Renew. Sustain. Energy Rev. 2020, 133, 110256. [Google Scholar] [CrossRef]
  26. Mokhatab, S.; Poe, W.A.; Mak, J.Y. Chapter 1—Natural Gas Fundamentals. In Handbook of Natural Gas Transmission and Processing, 3rd ed.; Gulf Professional Publishing: Boston, MA, USA, 2015; pp. 1–36. [Google Scholar]
  27. Alayi, R.; Ahmadi, M.H.; Visei, A.R.; Sharma, S.; Najafi, A. Technical and environmental analysis of photovoltaic and solar water heater cogeneration system: A case study of Saveh City. Int. J. Low-Carbon Technol. 2021, 16, 447–453. [Google Scholar] [CrossRef]
  28. Global Temperature. Available online: http://data.giss.nasa.gov/gistemp/graphs_v3/ (accessed on 7 April 2021).
  29. Han, Z.; Guo, S. Investigation of operation strategy of combined cooling, heating and power (CCHP) system based on advanced adiabatic compressed air energy storage. Energy 2018, 160, 290–308. [Google Scholar] [CrossRef]
  30. Farahbakhsh, M.T.; Chahartaghi, M. Performance analysis and economic assessment of a combined cooling heating and power (CCHP) system in wastewater treatment plants (WWTPs). Energy Convers. Manag. 2020, 224, 113351. [Google Scholar] [CrossRef]
  31. Cogeneration. Available online: https://en.wikipedia.org/wiki/Cogeneration (accessed on 19 December 2021).
  32. Mollenhauer, E.; Christidis, A.; Tsatsaronis, G. Increasing the flexibility of combined heat and power plants with heat pumps and thermal energy storage. J. Energy Resour. Technol. 2018, 140, 020907. [Google Scholar] [CrossRef]
  33. Nouri, M.; Namar, M.M.; Jahanian, O. Analysis of a developed Brayton cycled CHP system using ORC and CAES based on first and second law of thermodynamics. J. Therm. Anal. Calorim. 2019, 135, 1743–1752. [Google Scholar] [CrossRef]
  34. Fotouhi, R.; Movludiazar, A.; Khayyati, M.S.; Pourgholi, M. Optimization of an Industrial Township Costs from an Industrial Service Company View (Case Study: A Distributed Gas-Fired CHP). In Proceedings of the 7th Iran Wind Energy Conference (IWEC2021), Shahrood, Iran, 17–18 May 2021; pp. 1–5. [Google Scholar]
  35. Branchini, L.; Bignozzi, M.C.; Ferrari, B.; Mazzanti, B.; Ottaviano, S.; Salvio, M.; Toro, C.; Martini, F.; Canetti, A. Cogeneration Supporting the Energy Transition in the Italian Ceramic Tile Industry. Sustainability 2021, 13, 4006. [Google Scholar] [CrossRef]
  36. Gambini, M.; Vellini, M.; Stilo, T.; Manno, M.; Bellocchi, S. High-Efficiency cogeneration systems: The case of the paper Industry in Italy. Energies 2019, 12, 335. [Google Scholar] [CrossRef] [Green Version]
  37. Morato, M.M.; da Costa Mendes, P.R.; Cani, A.A.; Normey-Rico, J.E.; Bordons, C. Future hybrid local energy generation paradigm for the brazilian sugarcane industry scenario. Int. J. Electr. Power Energy Syst. 2018, 101, 139–150. [Google Scholar] [CrossRef]
  38. Alshammari, F.; Karvountzis-Kontakiotis, A.; Pesyridis, A.; Alatawi, I. Design and study of back-swept high pressure ratio radial turbo-expander in automotive organic Rankine cycles. Appl. Therm. Eng. 2020, 164, 114549. [Google Scholar] [CrossRef]
Figure 1. The proposed combined heat and power (CHP) system.
Sustainability 14 01551 g001
Figure 2. Energy flowing in and out of a turbo-expander [38].
Sustainability 14 01551 g002
Figure 3. Flow and energy flow in the compressor [10].
Sustainability 14 01551 g003
Figure 4. Energy balance in the combustion chamber [4].
Sustainability 14 01551 g004
Figure 5. Scenario 1: Using a turbine to generate electricity and use its recycled heat in an oil boiler.
Sustainability 14 01551 g005
Figure 6. Scenario 2: Using a turbine to generate electricity and then reusing its recycled heat in steam boiler 1.
Sustainability 14 01551 g006
Figure 7. Scenario 3: Using a turbine to generate electricity, then its recycled heat in steam boiler 2.
Sustainability 14 01551 g007
Figure 8. Scenario 4: Using a turbine to generate electricity and use its recycled heat in an oil boiler and steam boiler 1.
Sustainability 14 01551 g008
Figure 9. Scenario 5: Using a turbine to generate electricity and use its recycled heat in an oil boiler and steam boiler 2.
Sustainability 14 01551 g009
Figure 10. Scenario 6: Using a turbine to generate electricity and use its recycled heat in steam boilers.
Sustainability 14 01551 g010
Figure 11. Scenario 7: Using a turbine to generate electricity and use its recycled heat in oil and steam boilers.
Sustainability 14 01551 g011
Figure 12. The temperature changes of the flue gas at the turbine inlet.
Sustainability 14 01551 g012
Figure 13. Changes in CP.mix relative to the excess air changes.
Sustainability 14 01551 g013
Figure 14. The amount of gas consumed in the scenarios.
Sustainability 14 01551 g014
Figure 15. The amount of electricity generated by the scenarios.
Sustainability 14 01551 g015
Figure 16. The final energy output produced by the system.
Sustainability 14 01551 g016
Figure 17. The ratio of the final energy produced by the system to the consumed gas.
Sustainability 14 01551 g017
Table 1. Past research related to the present study.
ObjectiveMethod Location Reference
Electric load supply at peak loadfirst and second law of thermodynamicsIran [33]
New software provided in Matlabnew advanced teaching-learning-based optimization algorithm (ATLBO)Iran[34]
Maximizing the generation of electricityCeramic tile efficiency managementItaly[35]
Gas turbines as the most appropriate technology for paper industry processesPaper industryItaly[36]
Satisfying microgrid operationEconomic feasibility of the sugarcane industry, through a cost analysisBrazil[37]
Table 2. Specifications of unit fuel consumption (natural gas).
Fuel density (Kg/m3)0.6607ρ(NG)
Consumption fuel price (IRR/m3)1150GP
Calorific value of fuel consumed (Kj/Kg)48,594LHV
Total amount of natural gas consumed (kg/s)0.142165NG(b.T)
Total unit power consumption (kWh)240,000EC(P)
Table 3. Boiler specifications.
Boiler No. 3Boiler No. 2Boiler No. 1Parameter
473.15318.15318.15T1.w
523.15443.15443.15T2.w
2.14.18134.1813Cp.w
30.213.152.016m(b1)
0.850.850.85ɳb
3172.051646.3871053.688Q(b1)
0.0767960.0398590.02551NG(b1)
Table 4. Air specifications at the compressor input.
PC.in (atm)TC.in (k)CP (kj/kg·k)hC.in (kj/kg)K = CP/CV
1298.151.004299.34261.41
Table 5. Air specifications at the compressor output.
PC.outTC.out (k)C.out (kj/kg)hC.out (kj/kg)
11651.806654.413601.152
Table 6. Flue gas analysis.
CO2 ProducedN2 ProducedH2O ProducedO2 RequiredComponent
-0.14--N2
----CO2
84.7636.94169.4169.4CH4
19.94131.229.9134.89C2H6
10.8668.0514.4818.1C3H8
1.448.791.82.34i-C4H10
2.615.883.254.22n-C4H10
0.42.410.480.64i-C5H12
0.352.10.420.56n-C5H12
120.7865.51219.74230.15Total
Table 7. The analysis of natural gas entering the combustion chamber.
LHV (kj/kg)Molecular WeightMole PercentageComponent
48,594280.14N2
460.41CO2
16.0484.7CH4
30.079.97C2H6
44.093.62C3H8
58.120.36i-C4H10
58.120.65n-C4H10
72.150.08i-C5H12
72.150.07n-C5H12
100Total
Table 8. Material and energy balance.
CPi (Kj/Kg·k)Mole Percentage (%)Component
1.04272N2
0.84210CO2
1.87218H2O
0.922-O2
Table 9. Analysis of the excess inlet air.
Mole Percentage (%)Component
76.01N2
4.13CO2
7.52H2O
12.34O2
Table 10. Gas turbine energy production performance.
NG (kg/s)Went (kW)UE (kW)Utility (kW)EE (%)UFR (kW)
0.018848311.683311.683311.6833416536.66
Table 11. Gas turbine pollution.
CO2 (g/s)GP (IRR/S)CUR (g/kj)GPUFR (IRR/kj)
54.4707215.566090.1747630.049942
Table 12. Specifications of heat exchanger No. 1.
1053.688Q(b1)Heat required to produce 16,000 of steam (lb/h)
949.942T(1.FG)Inlet flue gas temperature to converter (K)
408.15T(2.FG)outlet flue gas temperature of the converter (K)
1.081343Cp(FG)Specific heat capacity of flue gas (Kj/(Kg·K))
1.798522m(FG.1)Mass flow of flue gas required for heat supply in the production of 16,000 pounds of steam (Kg/s)
Table 13. Specifications of heat exchanger No. 2.
1646.385Q(b2)Heat required to produce 25,000 of steam (lb/h)
949.942T(1.FG)Inlet flue gas temperature to converter (K)
408.15T(2.FG)Outlet flue gas temperature of the converter (K)
1.081343Cp(FG)Specific heat capacity of flue gas (Kj/(Kg·K))
2.81019m(FG.1)Mass flow of flue gas required for heat supply in the production of 25,000 pounds of steam (Kg/s)
Table 14. Specifications of heat exchanger No. 3.
3172.05Q(b3)Heat required to raise the temperature of oil by 125 (m3/h)
949.942T(1.FG)Inlet flue gas temperature to converter (K)
408.15T(2.FG)Outlet flue gas temperature of the converter (K)
1.081343Cp(FG)Specific heat capacity of flue gas (Kj/(Kg·K))
5.414319m(FG.1)Mass flow of flue gas required to increase the temperature of cubic meters of oil by 125 (Kg/s)
Table 15. Comparison of scenarios.
Scenarios1234567
Total amount of natural gas consumed (kg/s)0.185940.1596720.1684280.2034520.2122080.1946960.22972
Total amount of electricity generated by unit (Kwh)361,195.3139,280.4285,421.1768,351.81,561,292.7541,922.74,991,160.3
Final energy produced in the system (Kg/s)7771.086631.627011.598530.728910.568150.919670.97
Ratio of final energy to fuel consumption (Kj/Kg)41,793.441,532.741,629.541,929.941,989.541,896.842,098.8
Publisher’s Note: MDPI stays neutral with regard to jurisdictional claims in published maps and institutional affiliations.

