Article

A Multimodal Transport Model to Evaluate Transport Policies in the North of France

1
Lille Economie et Management, UMR 9221, Département Economie Gestion, Université du Littoral Côte d’Opale, 59140 Dunkerque, France
2
Territoires, Ville, Environnement et Socialété, ULR 4477, Département Economie Gestion, Université du Littoral Côte d’Opale, 59140 Dunkerque, France
3
Center for Operations Research and Econometrics, Louvain School of Management, UCLouvain, 1348 Louvain-La-Neuve, Belgium
*
Author to whom correspondence should be addressed.
Sustainability 2022, 14(3), 1535; https://doi.org/10.3390/su14031535
Submission received: 3 December 2021 / Revised: 17 January 2022 / Accepted: 19 January 2022 / Published: 28 January 2022
(This article belongs to the Special Issue Sustainable Transport Planning under Conditions of Uncertainty)

Abstract

:
We developed a passenger transport model for the North of France and used it to discuss the impacts of some policies focusing on the limitations of polluting gas emissions and congestion. The model is calibrated for the North of France and includes both urban and intercity trips. Four transport modes are considered: walking, biking, public transport and private cars. To some extent, the combination of these modes is possible. The model is calibrated to match mode shares and the dynamic of congestion along a full day. The simulations are conducted within the MATSim framework. We evaluate the impacts, on traffic flows and polluting gas emissions, of two pricing reforms: free public transport and road pricing in city center of Lille (the main metropolitan area in the study region). Free public transport yields a significant modal shift towards public transport, resulting in a reduction in the usage of private cars. The road pricing scheme we have considered results in similar impacts but with limited magnitude. Overall, a significant reduction in congestion and emissions of pollutant gases can be obtained by applying convenient pricing reforms. Since we use an agent-based model, we are able to identify the specific location of the main impacts on the network.

1. Introduction

Urban and regional transport systems are important topics in public policies. Reducing the levels of congestion and polluting gas emissions is the main objective underlying most reforms debated in recent years. The pandemic situation made these goals more urgent and widely shared, particularly those related to sustainable transport [1].
Policy analysis can be addressed through several perspectives. The usage of transport simulation tools has grown during the last decade, since they became more stable and accessible. Available datasets on travel patterns transport networks, such as OpenStreetMap, played an important role to facilitate the construction of realistic case studies. Moreover, more efficient algorithms are being used on faster computers, and large scale simulations can now be conducted at reasonable costs.
The several steps underlying the development of transport models can be found in [2]. While difficulties related to the availability of the data no longer represent a main obstacle, the workflow in the modeling approach remains rather complex, particularly when dynamic traffic equilibrium is considered [3]. The calibration stage requires an iterative adjustment of the model parameters and remains a time-consuming step. Other technical difficulties are related to the management and organization of large datasets and the analysis of complex simulations outputs. These difficulties may partly explain why the number of cities and regions where an agent-based transport model has been set up remains limited, despite the relevance of these tools.
Agents’ travel behavior is strongly related to their locations and their activities. A comprehensive transport model should, to some extent, take into account the nature of these activities, their duration and how they are chained during a typical day [4]. The MATSim framework used in our model is an activity-based transport simulator where each agent’s utility is derived from the duration of the daily activities and users travel times to connect these activities [5].
The objective of this research is to develop a transport simulation model and use it to identify transport policies that can reduce the levels of congestion and emissions of pollutant gases. The model covers a large area and includes urban and intercity trips. To conduct a large-scale simulation, some specific details in the network are not considered. For example, we do not make explicit distinction between standard and turbo roundabouts as in [6]. The model is based on survey data of individual daily trips. We focus on two policies that are largely debated by local authorities. Free public transport is gaining popularity in several European countries, including France. Dunkerque, a city in the study region of our model, is the largest city in France that has already implemented free public transport. Local authorities in Lille have for some time considered road pricing to alleviate congestion and have implemented free public transport for youths (below 18 years) in 1 January 2022. Our objective here is to evaluate the impacts of similar scenarios on the level of congestion and on the emissions of pollutant gas emissions.
We report the main steps involved in the construction of a multimodal transport model for the North of France. We keep the process as transparent as possible and adopt a modular approach allowing us to add new components progressively to the model. We hope that this methodology facilitates the deployment of transport simulation models for other regions and cities. Most data we have used are publicly available (accessible in the following address: http://murdasp.univ-littoral.fr (accessed on 3 December 2021)). This is the case for the road network and the income distribution of the population. The road network was manually complemented by the regional rail network, and data for public transport services GTFS files were used (only some agglomerations in the study region do not provide yet GTFS files for their public transport services. The model will be updated when new data are made available).
For instance, four transport modes are taken into account: walking, biking, private cars and public transport (buses, regional trains, tramway and the metro). As we observe in the Conclusion section, the model can be extended in several directions, and other modes similar to car sharing and autonomous vehicles can be included without major difficulties. Multimodal trips are possible as users can combine two or more modes for a single trip.
This model is one of the first transport simulations in France to be conducted at the regional scale. Earlier applications remain limited to the Paris and Lyon regions [7,8,9,10]. The study region covers the north of France with a population of four million inhabitants distributed over 1546 administrative jurisdictions. As we report in Section 2, intercity trips are quite frequent and rush-hour congestion is severe in major motorways, especially in the neighbourhood of the main agglomerations.
The paper is organized as follows. Section 2 provides a description of the data we have used to construct transport demand, the existing infrastructure and public transport services. The calibration of the model is discussed in Section 3. In Section 4, we focus on some transport policies. We provide conclusions in Section 5.

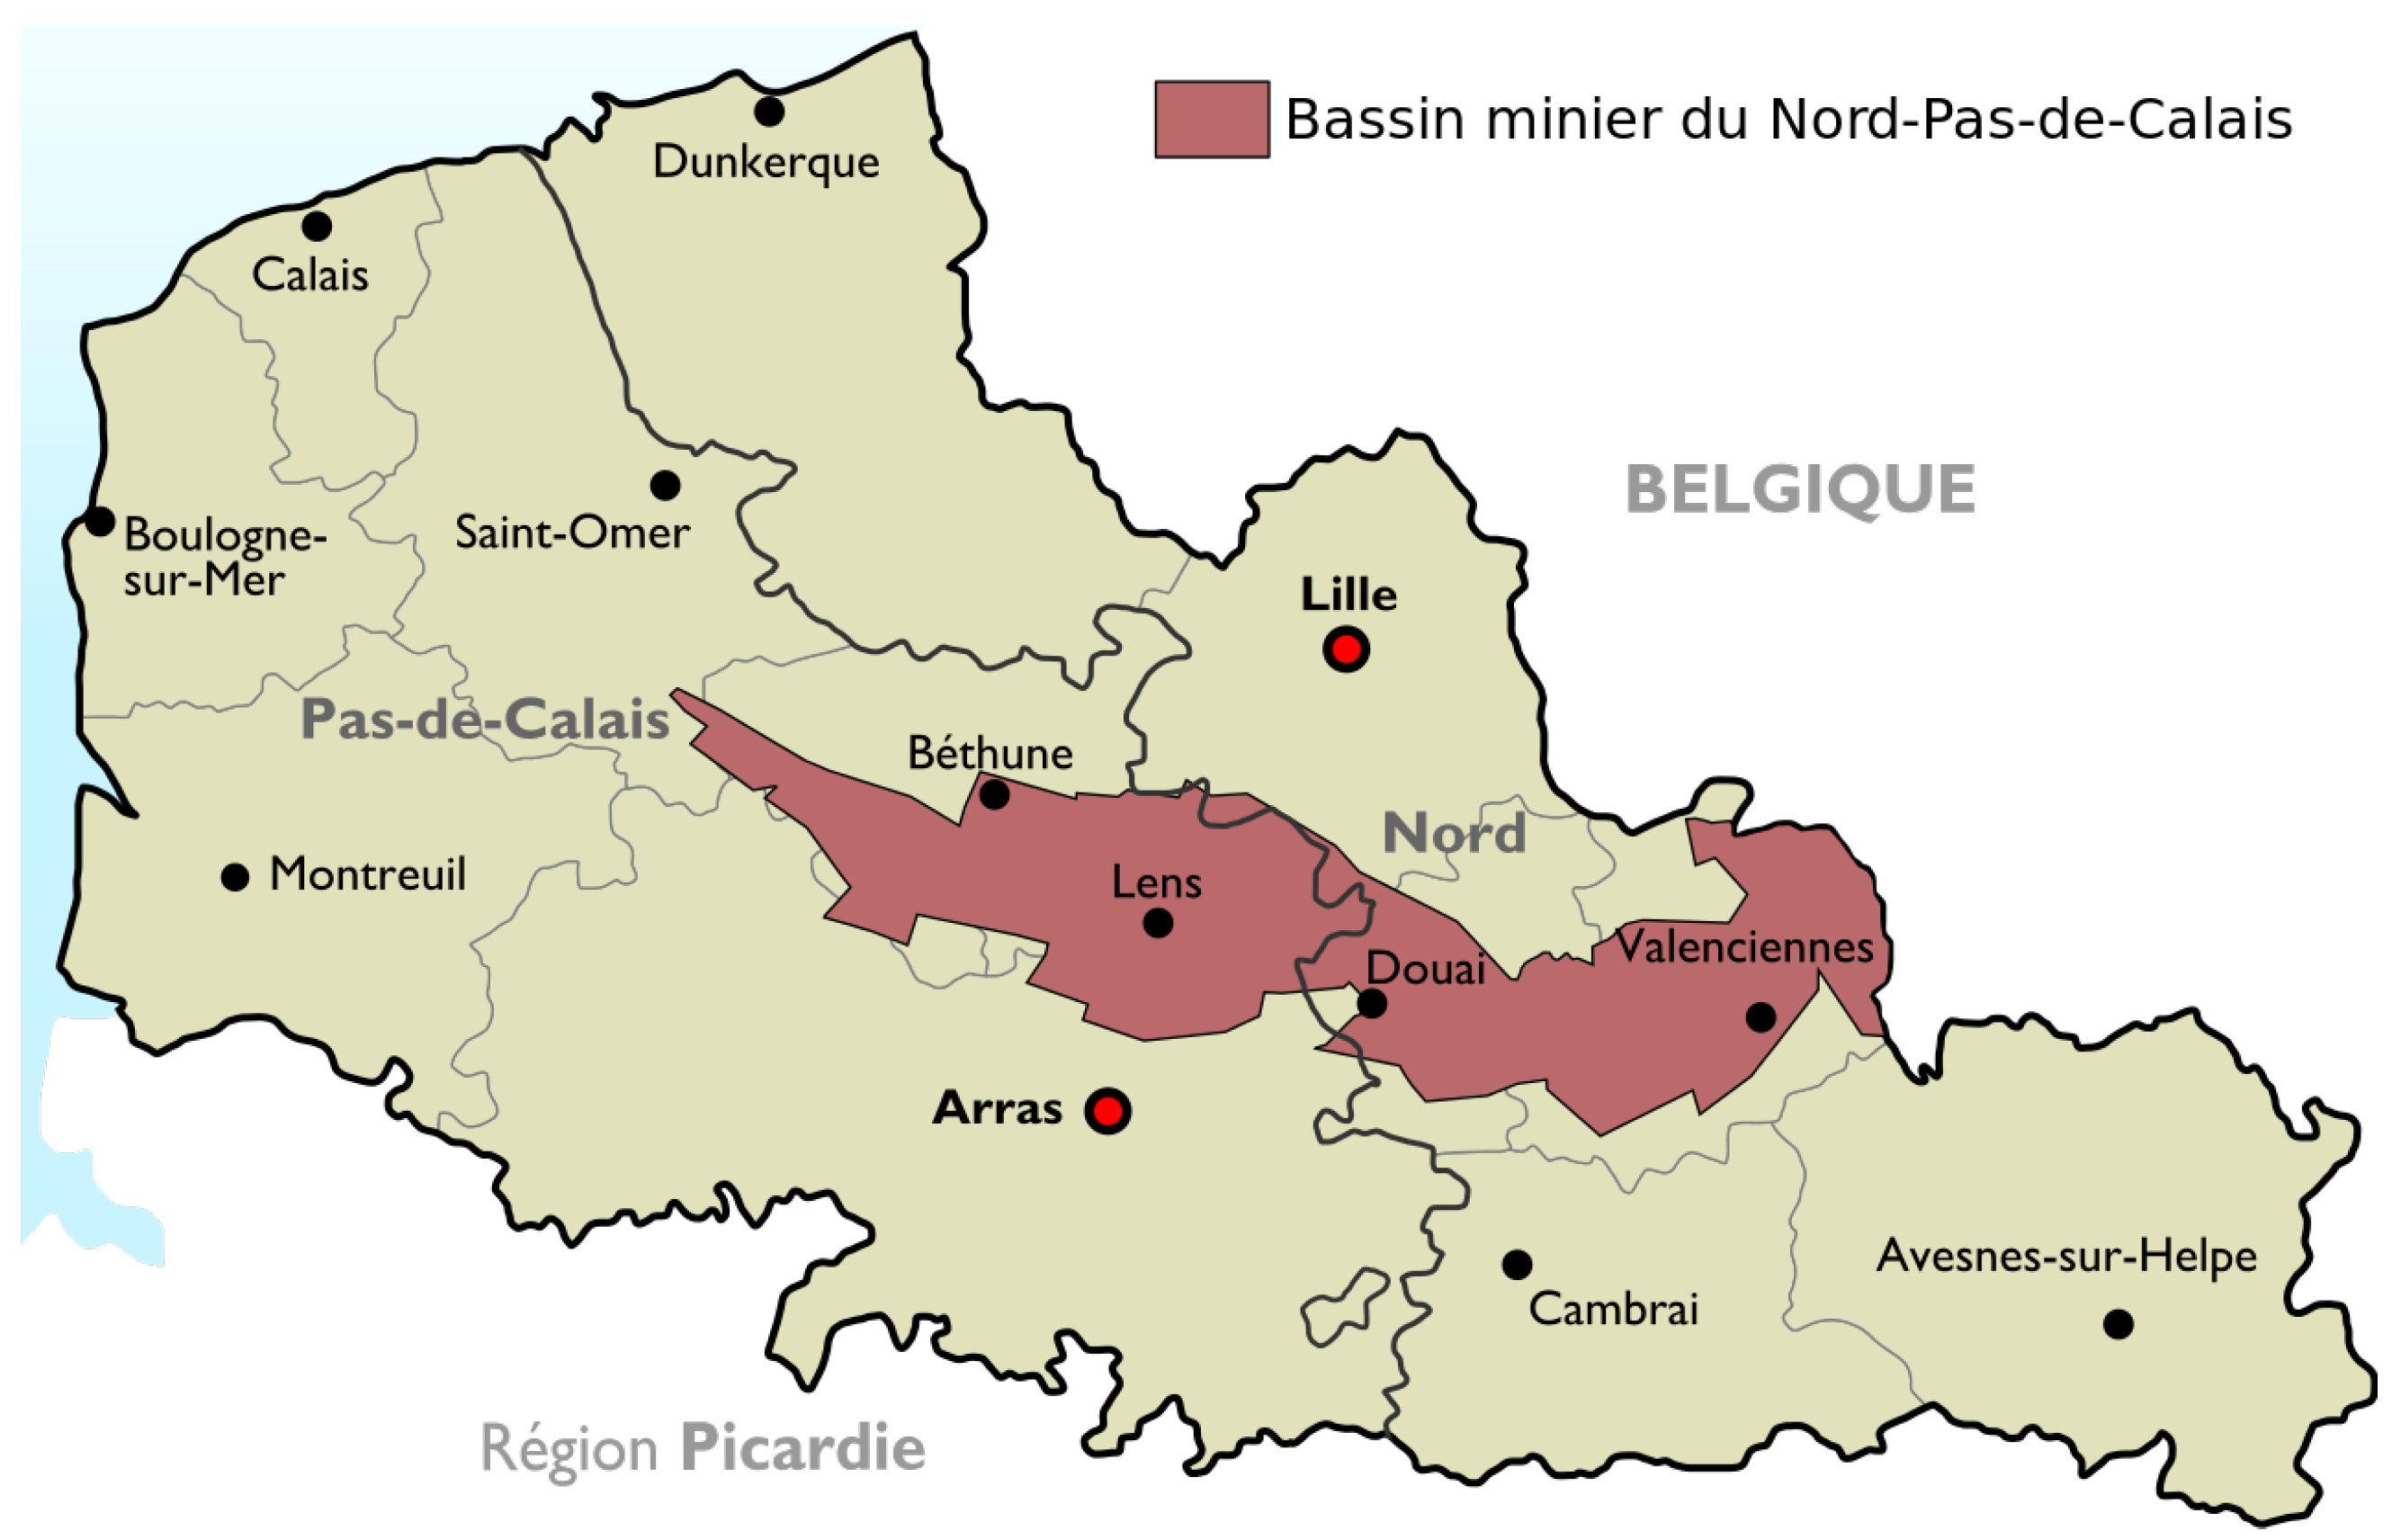
2. The Study Region and Input Data

The objective of this research is to develop a multimodal transport model for the North of France. The study region covers the departments “Le nord” and the “Pas-de-Calais” as illustrated in Figure 1. The total population in this region is about four million inhabitants. The North of France is particularly relevant for transport modeling and simulation. It is a region that connects Northern Europe to the Paris Metropolitan area and to Southern Europe. Several policies have been considered to alleviate congestion and reduce the emissions of pollutant gases. Some innovative decisions have been debated and sometimes adopted by local authorities. For example, Lille was the first city worldwide to implement a fully automated metro line in the early eighties of the last century, and Dunkerque is now the largest agglomeration in France where public transport is free.
There is a significant heterogeneity between the trips with respect to the purpose, the mode and the length. For example, within all population, there are about 1.2 million persons having a daily trip longer than 10 km. For a simulation where only the regional scope matters, it may be appropriate to reduce the population size by taking into account only this group. Lille is the largest metropolitan area, with more than 1.1 million inhabitants, and other major cities include Valenciennes, Dunkerque (Dunkirk), Calais, Boulogne-sur-Mer and Arras. Historical mining activities explain part of trip patterns observed between the mining area (the shaded region in Figure 1) and other cities, particularly Lille. Motorways around this city are severely congested during the peak hours. Moreover, the “A1” motorway, linking Lille to Paris, is the main connection for freight transport between Northern Europe, Paris region and other southern cities in the south of France and Spain. The study area is a main location for logistics activities, including warehousing, since it connects several ports (Dunkerque, Calais and Boulogne-sur-Mer) and multimodal platforms (for example, Dourge, which is located in the south of of Lille).
The model has several variations. Basically, it is a regional model, but it is straightforward to focus on a particular subregion or a given agglomeration. We particularly consider the cases of the agglomerations of Dunkerque and Lille. Other variations are considered with respect to user heterogeneity and with respect to income, available transport modes and how mode combinations are possible.

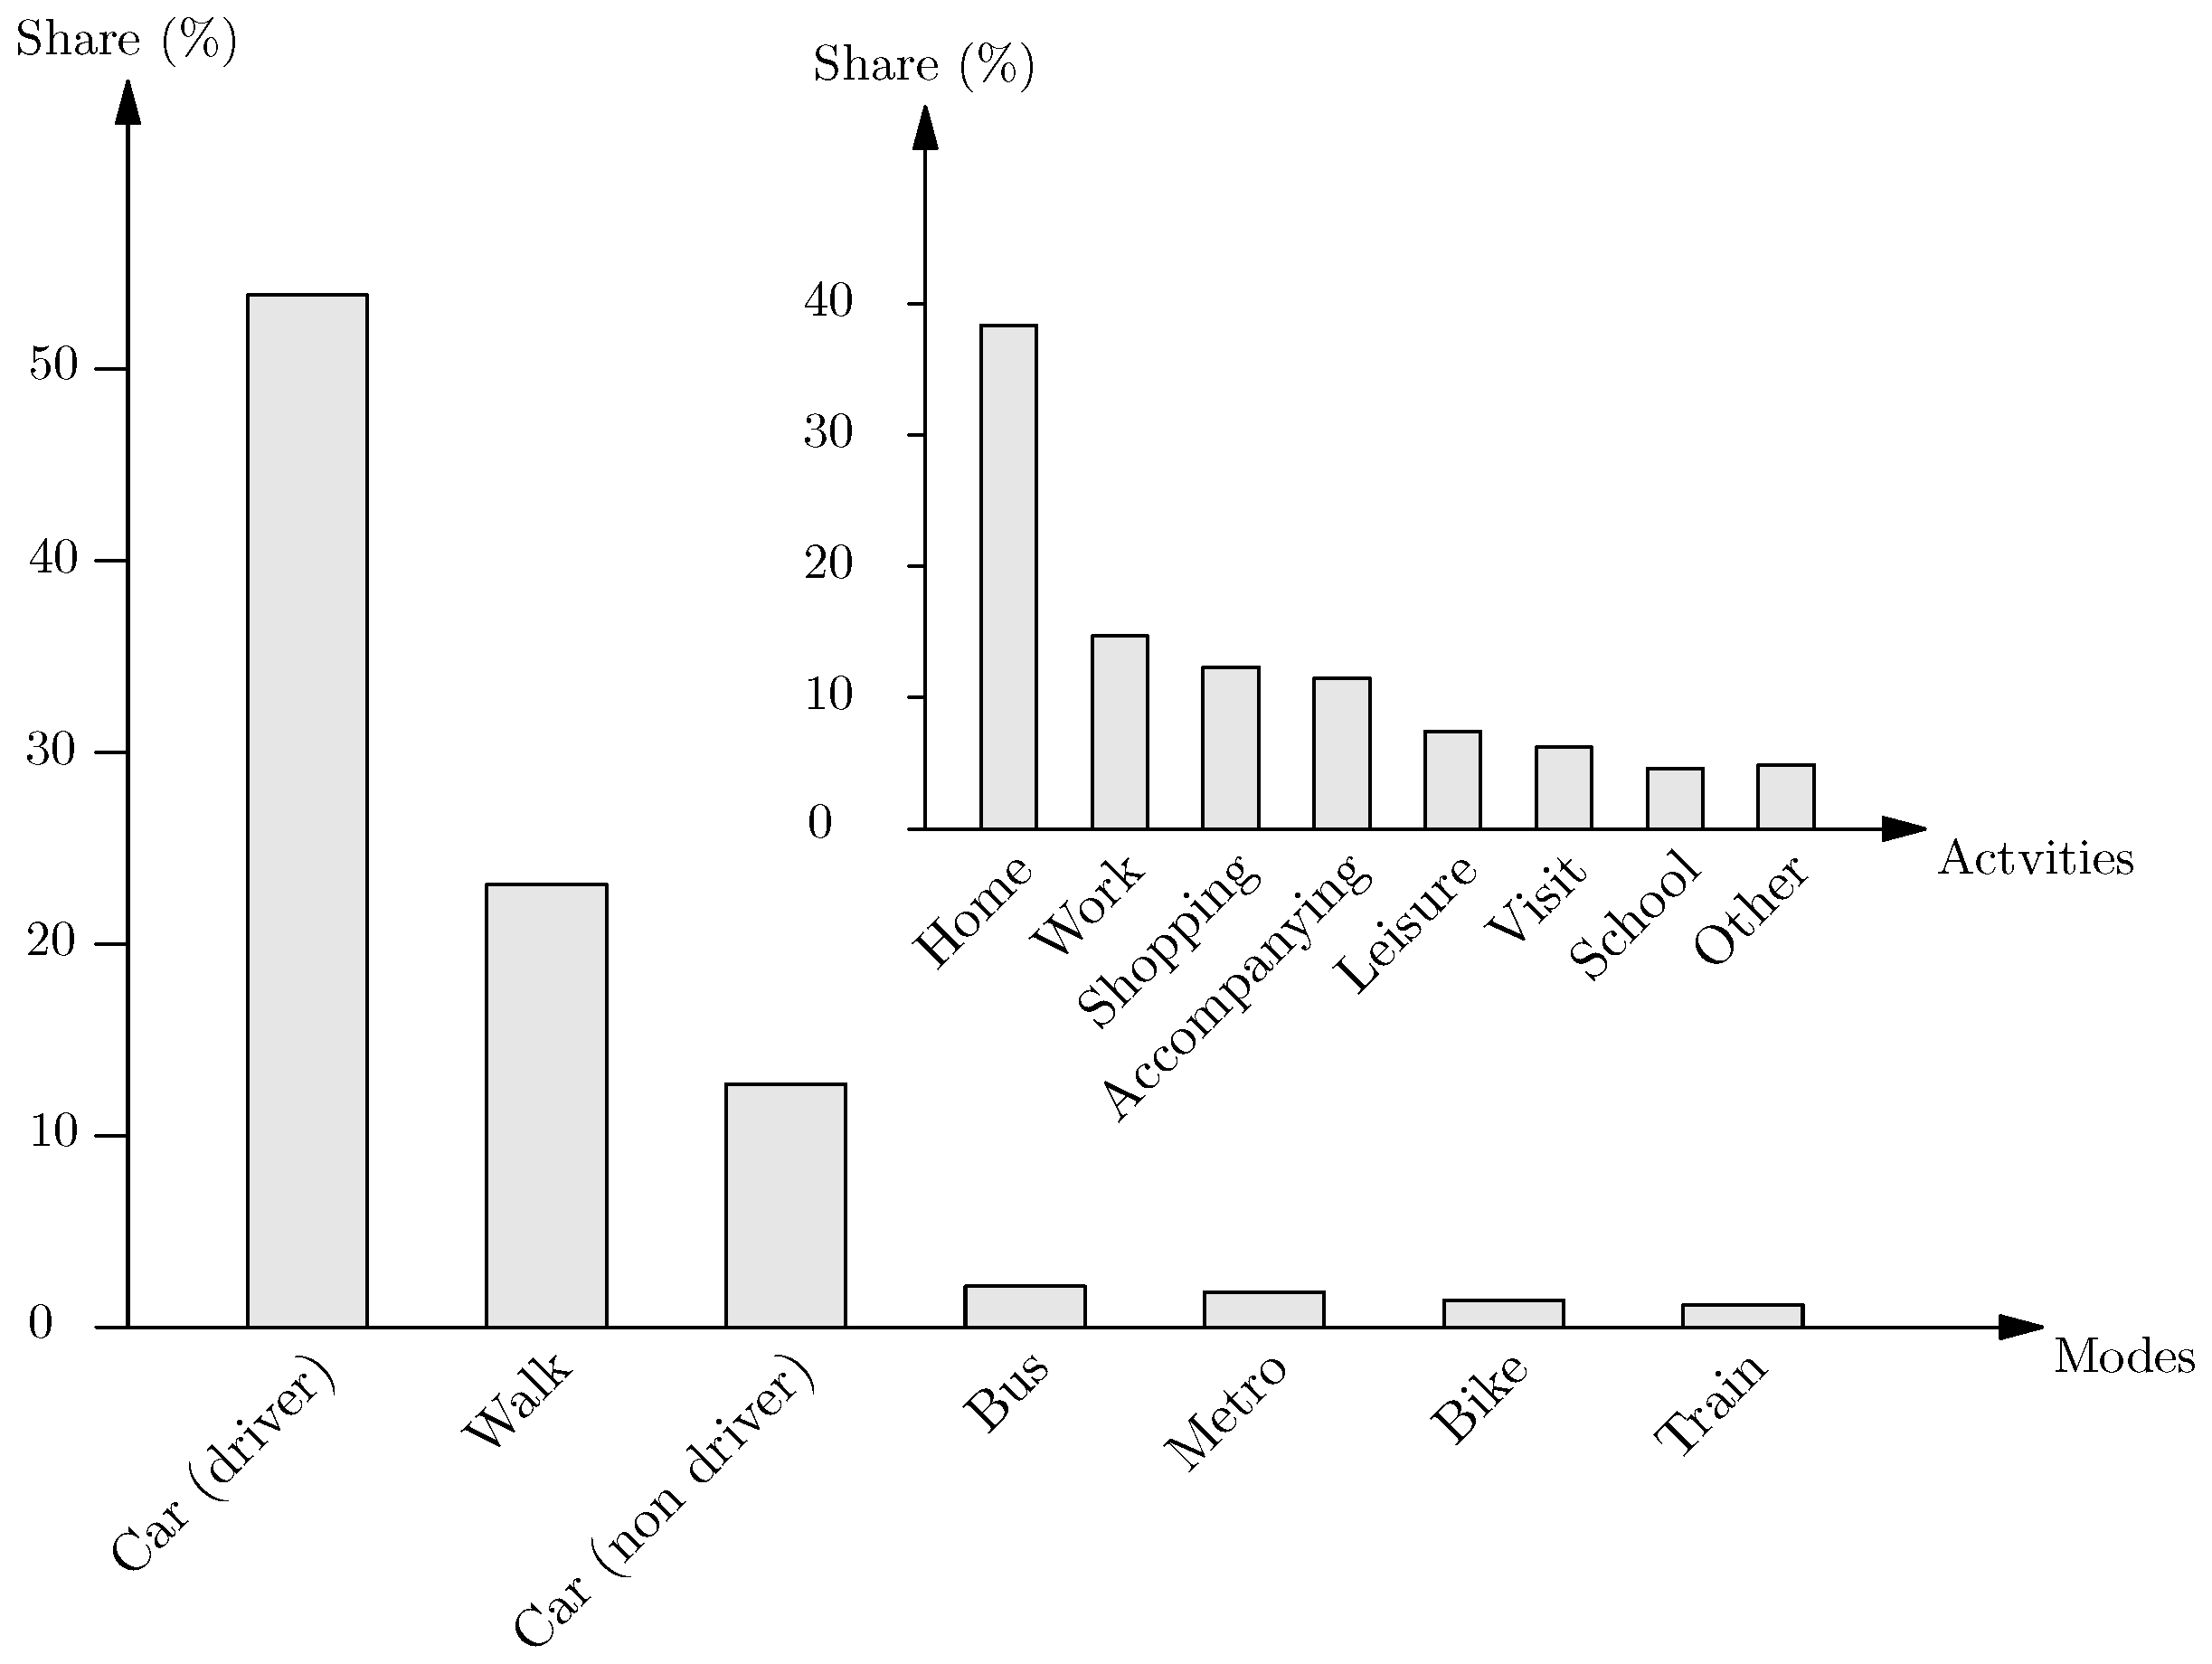
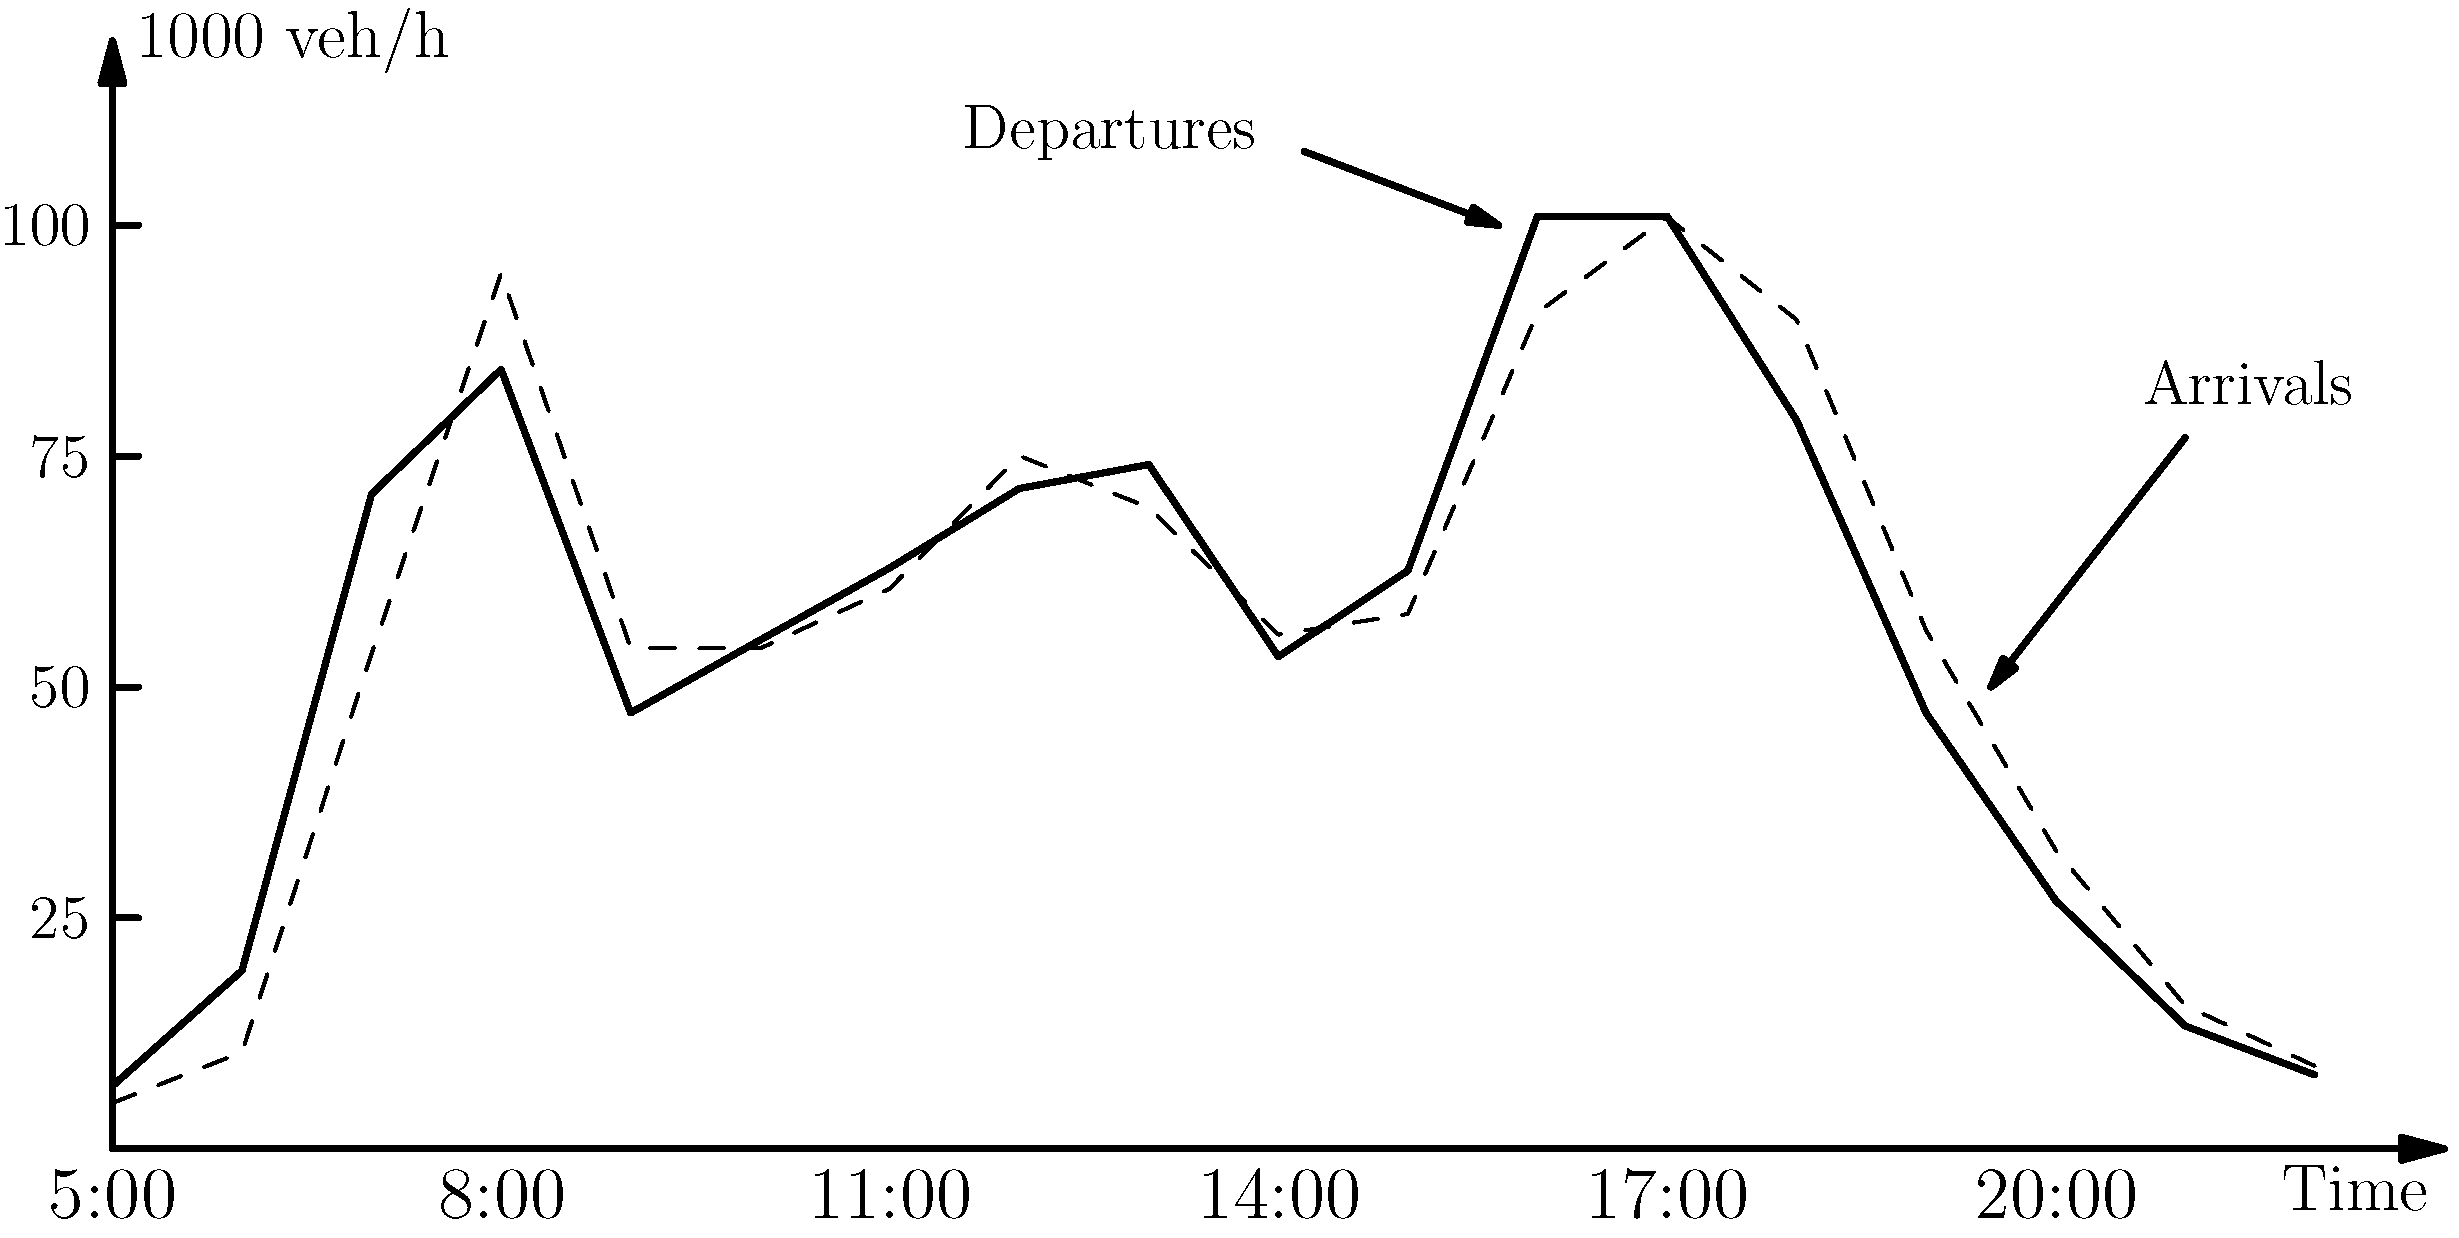
2.1. Census Data on Daily Trips

The model includes four modes “walk,” “bike,” “car” and “public transport” and allows for their combinations (to some extent). It covers both urban and intercity trips. Survey data from the Regional Household survey of 2016 are used to build daily trips. Mode shares are shown in Figure 2 (the lower left panel). The usage of the private car is the dominant mode, and most short trips, less than one kilometer, are made by walking. Public transport modes are used for urban (bus and metro) and intercity (train) trips. Other modes, such as tramways and intercity buses, have a very small share and are not reported here. The data we use not only cover all trips departing and arriving inside the study region but also inflows and outflows with other regions in France. Our simulation model includes all of these trips. However, it does not include cross-border traffic. As we explain below, it is complemented, at the calibration stage, by census data to include cross-border traffic and freight transport.
For each trip, survey data report several activities as the trip purpose, at the origin or at the destination. The smaller panel in Figure 2 reports the most important trip purposes. The most frequent ones are “home,” “work,” “shopping” and “accompaniment” (family or friends). These values are reported for the entire population and should, of course, significantly differ when we focus on specific groups with respect to age or jobs qualification.
Departure and arrival times of the trips are given in the main panel in Figure 3. The dynamic is standard with two main peaks occurring in the morning and the evening, respectively. A relative increase in traffic flow is also observed during the midday. The length of the delay of arrivals increases with travel times. This delay is larger during peak hours when congestion is high.

2.2. Cross-Border and Freight Transport

In order to obtain realistic traffic flows, we need to add cross-border trips and freight transport. Unfortunately, there are no comprehensive datasets available to use for this purpose. Cross-border trips are important since the study region is adjacent to Belgium and cross-border commuting is central to several regional policies focusing on the development of European metropolitan Areas.
To overcome the lack of available information on cross-border traffic flows, we used census data for home-to-work trips, which is available at the scale of the “commune.” The database reports only flows departing from France to Belgium and not trips in the opposite direction. We assume a symmetric distribution of the trips and generate a random flow from Belgium to the study region in France. At the destination, these trips are directed towards most important agglomerations, i.e., activity zones.
Freight transport is not yet fully implemented in our model. The main reason is again the lack of an available database for these trips. Freight transport remains an important part of traffic flows since several logistic activities take place in the north of France. This region is crossed by the A1 motorway that connects the countries in the north (The Netherlands and Belgium) to Paris and southern regions in Europe. To include representative traffic flows, we produced freight transport, along the motorways crossing the study region, that matches counting data for trucks running on the corresponding links. We check that the calibrated model produces realistic patterns of congestion.

2.3. Incomes and the Synthetic Population

The distributions of income are available at the level of communes. For communes with a small population, only median income is provided. For very small communes, with some dozens inhabitants, no information is provided in order to keep information anonymous. We assign incomes to each person by using the following procedure. For each person, we check if the distribution (by decile) is provided. In that case, we draw a random income from the cumulative distribution corresponding to the deciles. If only the medium income is given, then we shift the last decile distribution to match the medium income and draw a random income accordingly. If no information is given for the commune, we draw a random income from the aggregate distribution (covers all the study region). Given the spatial scope of our model, the loss in information should not be large since small differences exist between the communes.
Selected income deciles of income distribution corresponding to the entire region are provided in Figure 4. The are three curves, respectively, corresponding the first, fifth and ninth deciles. The lowest 10% of income includes the less dispersed between 8000 and 15,000 (in Euros). The highest 10% of income includes the much more dispersed and range from 25,000 to more than 50,000 (in Euros). Medium incomes are about EUR 20,000. Overall, the income in the north of France is smaller than the average income in France. The population is subdivided into three groups that we refer to as “low,” “medium” and “high” income groups, respectively. The threshold income between low and medium groups is EUR 11,000, and the second threshold between medium and high groups is EUR 23,000. There are 499,060, 1,568,380 and 871,510 users, respectively, in the low, medium and high income groups.
In order to run large-scale simulations, it is difficult to include the entire population. Each iteration would require a long period time, and the calibration, which requires a large number of iterations, becomes unpractical. It is a normal practice, including in MATSim, to work with a synthetic population instead. The idea is to consider only a proportion of the population uniformly drawn from the initial population and to scale down the network capacity so that traffic congestion and public transport flows remain consistent. Several sampling levels, ranging from less than 1% to 50%, were used in our simulations. With a very small population, the simulations can be run quickly, but they do not produce very representative outputs. At this level, the simulations were mainly designed for testing and checking the code. Large samples produce realistic traffic flows but require more time to run. The results reported here are produced with a 10% and 30% synthetic population.

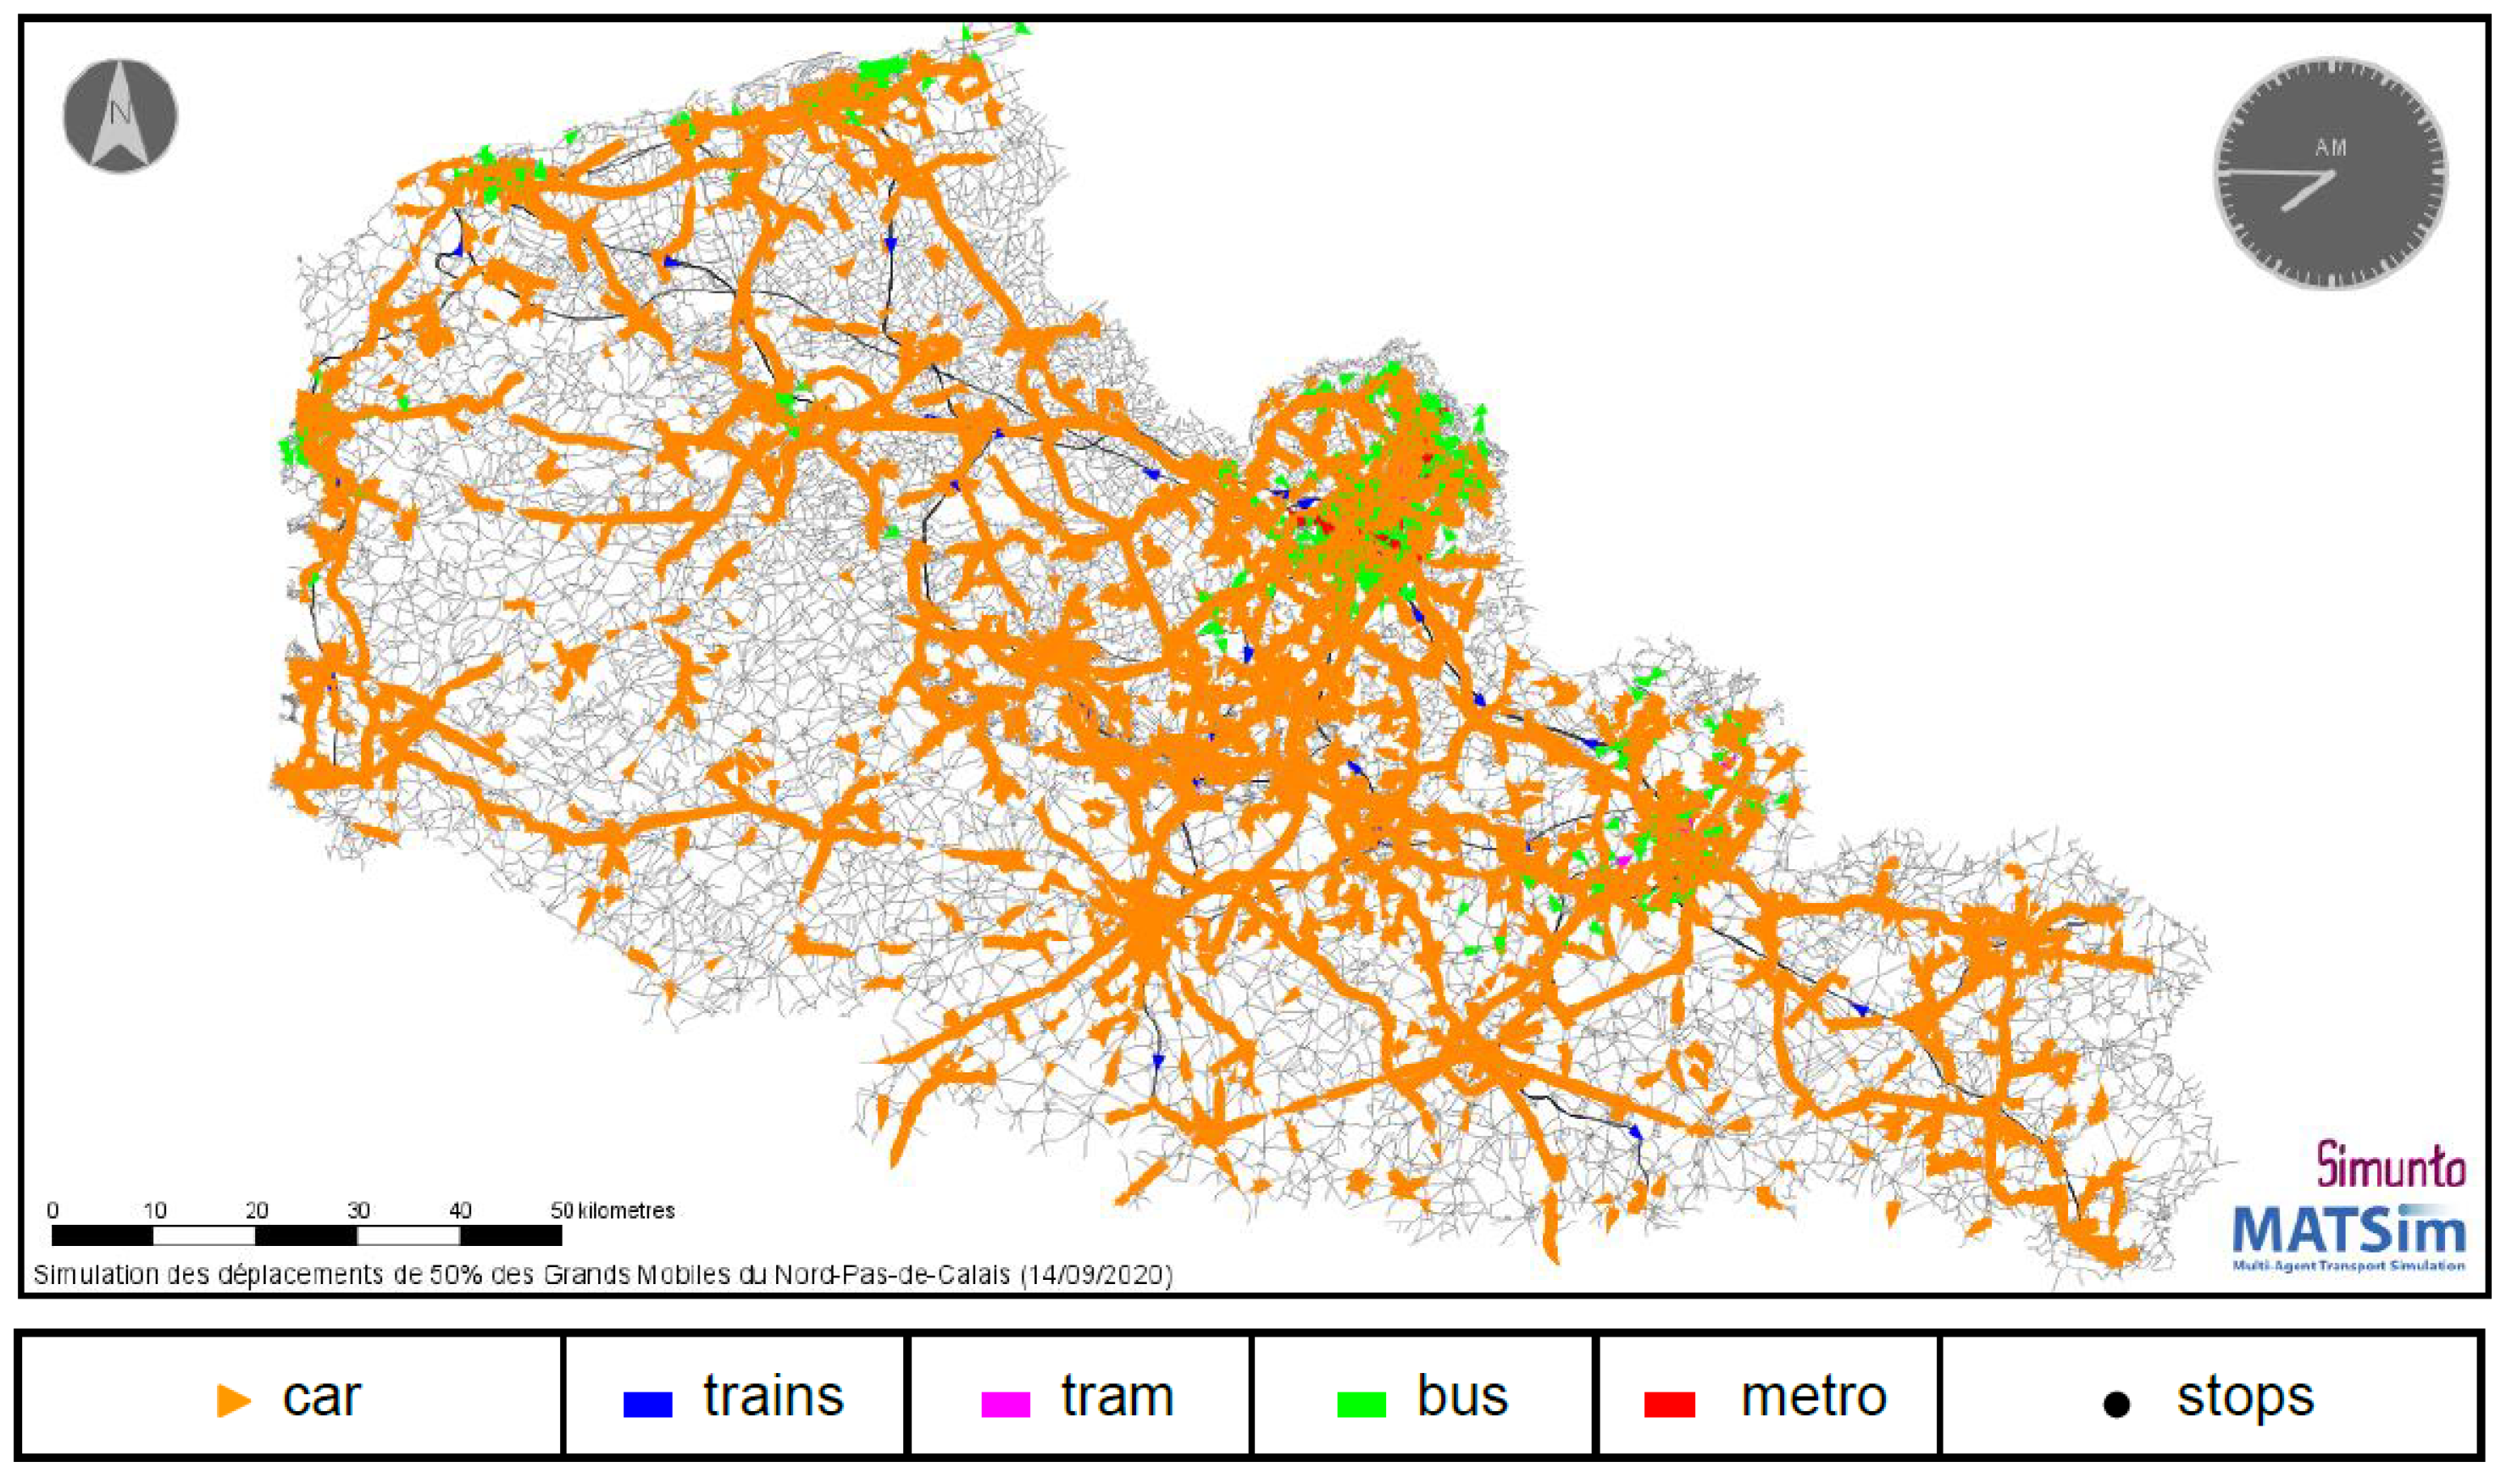
2.4. Infrastructure and Public Transport Services

For the road network, we have used the open database provided by IGN (https://geoservices.ign.fr/documentation/diffusion/index.html, accessed on 15 March 2020), which is derived from OpenStreetMap databases with some corrections and standard formatting. This database provides the attributes of each link (speed limit, capacity, number of lanes, etc.) and is globally satisfactory for the road network. The road network has a large number of links that are grouped with respect to their importance (motorways, main links, secondary roads, etc.). The main limitation is the incomplete rail network, which is composed of a dozen of service lines. We have then manually added train lines and the corresponding stations directly in the MATSim format.
Public transport includes several urban bus networks, the TER (and TERGV) network, metro and tramway in Lille. The public transport fleet consists of 14,748 vehicles spread over the conurbations of Lille (Figure 5), Dunkerque, Boulogne sur Mer, Calais, Valenciennes and Saint Omer, in addition to the region’s rail network. The modelled network reflects the actual situation and is composed of 218,438 nodes and 485,072 links.
Public transport services include buses operating at urban and suburban areas; tramways in Lille and Valenciennes; the two automated metro lines in Lille; and the regional trains. Fast train lines also connect Lille to Dunkerque and Boulogne-sur-Mer. Most bus services are available in GTFS files provided by local operators. Some small local operators have not yet published the timetables of their services (Cambrai, Lens, Douai, Arras), but this does not have an important impact on simulated traffic given the relative size of the flows. The model will be updated when the corresponding data are made available.

3. Calibration

A topic issue in traffic modeling is the calibration of the model. The objective of the simulation is to produce realistic traffic flows over the study region and with respect to the set of transport modes considered (Figure 6). We focus on mode shares and optimize modes specific constants so that after several iterations the model converges to observed mode shares. A plan is a sequence of activities, and each one except the last is followed by a trip. In the utility function, a constant is attached to each mode. An increase in the value of the constant increases the share of the corresponding mode and vice versa. The formulation adopted in this model has an additive utility in the following form:
U plan = a = 0 N U a a = 0 N 1 C a ( m ) ,
where U a denotes the utility from activity a and C a ( m ) denotes the user cost related to transport occurring after activity a when the user chooses transport mode m (there are no transports after the last activity). The utility related to an activity depends on its duration and the schedule delay cost if the user arrives early or late to the activity. Notice that the utility expression in (1) is consistent with Vickrey’s utility maximization in [11]. Several formulations are possible to reflect the interactions between these variables. For this model, we use the CharyparNagel formulation [5]. The user cost of a trip by mode m between activity a and activity a + 1 is given by the following:
C a ( m ) = c m + β t t m , a + β m + β I γ m d a + χ a ,
where c m is a mode specific constant (shift parameter), β t is the opportunity cost of travel time and t m , a is the travel time required to proceed from activity a to activity a + 1 with mode m. β m is the monetary cost per unit distance of mode m. This parameter is usually zero for motorized modes and positive for non-motorized ones (bikes, walk, etc.). It reflects physical effort deployed. β I is the marginal utility of income. γ m is a mode specific monetary cost, d a is the travel distance between activity a and activity a + 1 and χ a is a transfer cost between activity a and activity a + 1 , if any. This formulation of the user cost reflects the intuition that users dislike trips with long durations and long distances, particularly if they do not use motorized modes.
The calibration’s objective is to adjust the parameters of the model so that it replicates observed traffic flows. Usually, we focus on mode shares and travel duration. With several modes, the calibration may not be straightforward since several parameters must be adjusted smoothly and each iteration is time consuming. For each mode m, let P m ref and P m mod , respectively, denote its observed share and its share produced by the model. We iteratively update the shift parameters c m , given in Equation (1), to reduce the gap between observed shares (given in Figure 2) and those produced by the model. For instance, a simple heuristics, based on [12], is used with an update rule given by c m new = c m old log ( P m mod / P m ref ) . A mode is more attractive when the shift parameters increase and vice versa. The idea here is to increase (respectively, decrease) the value of the shift parameter when mode m is underused (respecitvely, overused) in the output of the final completed iteration. More sophisticated techniques to find the best values of the shift parameters can be used. We intend to improve this step in future research.
When the model produces a distribution of mode shares close to the observed distribution, we check if traffic flow and travel times reflect realistic trends. In our case, the calibration process was satisfactory with respect to this test. Traffic flows for the study region are illustrated in Figure 6. It displays traffic flows for cars and public transport modes and shows an important congestion on the main road links. A focus on the Lille metropolitan area is given in Figure 5, where public transport modes (buses, trams and metro) are easier to observe.

4. Transport Policies

In this section, we consider some reforms of transport pricing that aim at reducing polluting gas emissions and congestion. Road transport is a source of large external costs [13] and the objective of most transport policies is to reduce the usage of private cars. Two main scenarios are examined:
(i)
free public transport on all the study region and
(ii)
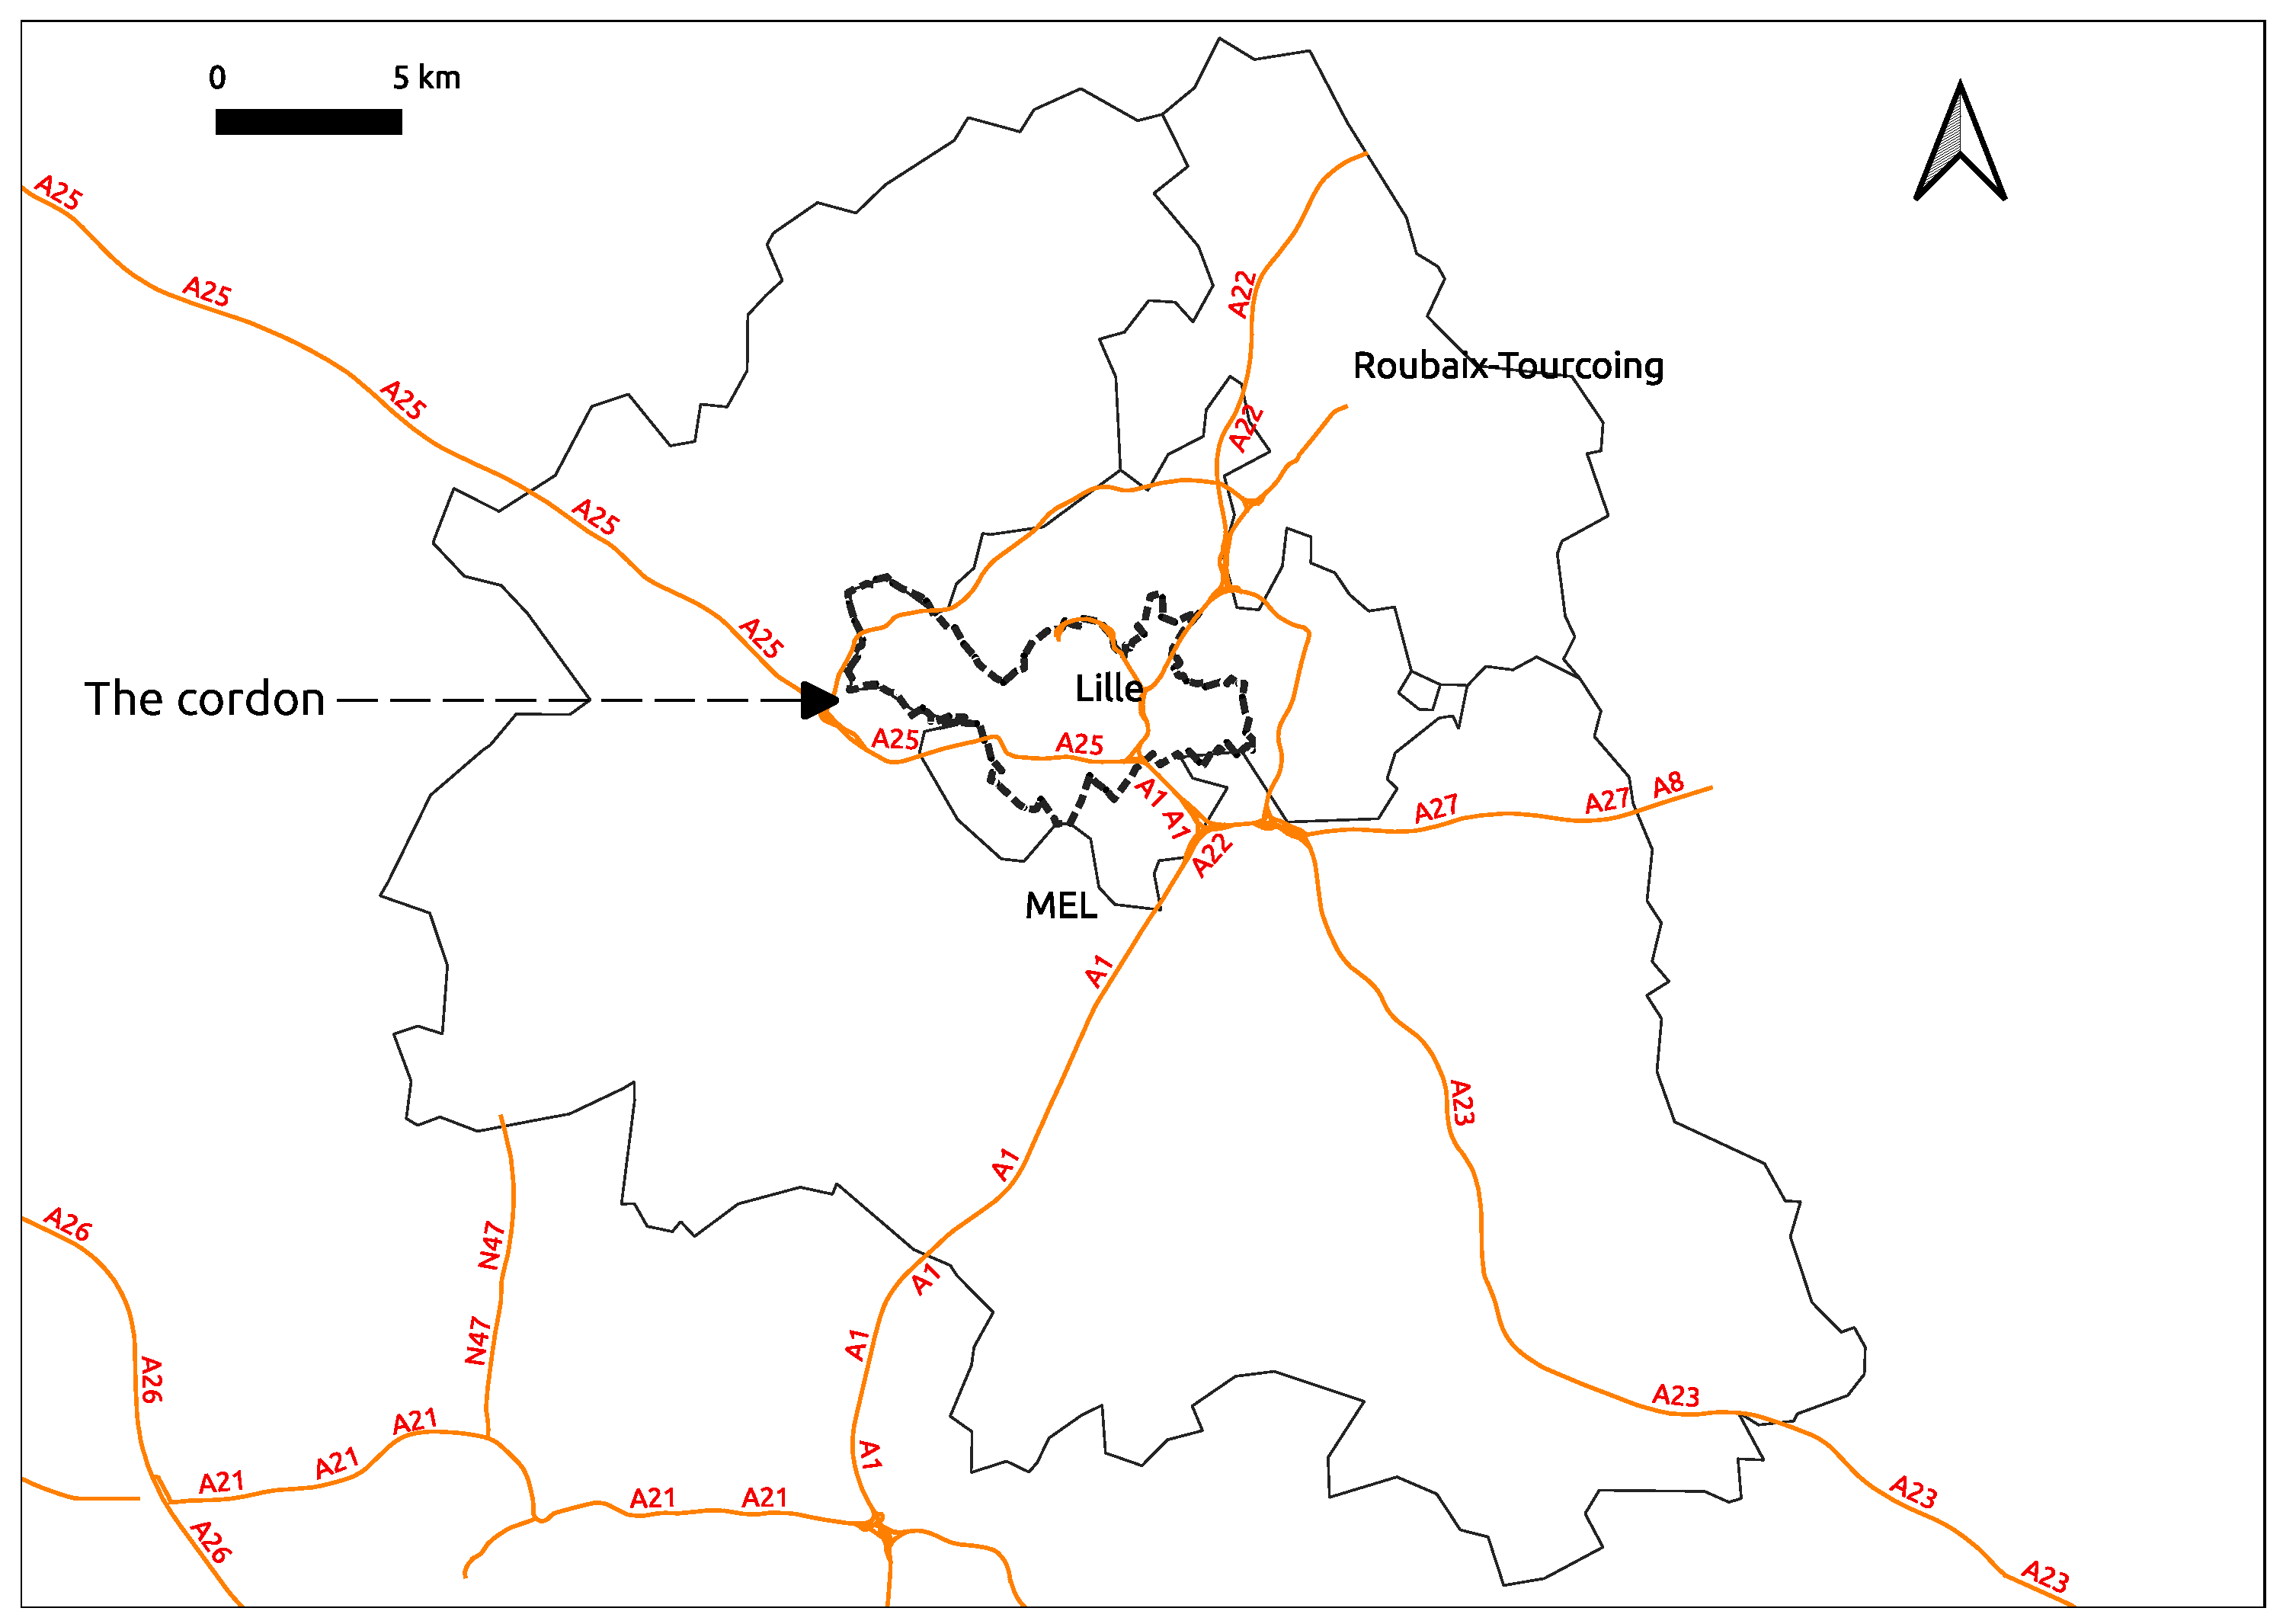
road pricing in the agglomeration of Lille.
In the first, public transport is made free on all study regions. This includes both urban modes (buses, tramways and metro) and intercity modes (regular trains and fast trains). Reducing fares of public transport aims at attracting more users in mass transport and could favor low income households. It raises the issue of collecting revenues to operate existing services and those produced for the induced demand, but it may reduce operating costs since there is no fare collection. In the absence of road pricing, free public transport should reduce congestion external costs and emissions insofar as it reduces the usage of the private cars.
Road pricing is, for many economists, the most efficient tool to reduce congestion and polluting gas emissions to their efficiency level. Users generally oppose the implementation of road pricing schemes because they see it as an additional tax [14]. Issues related to road pricing are the cost of collecting fares and controlling for the adherence of road users. These technical difficulties are now less important thanks to geolocation technologies and low cost of surveillance cameras. Some cities has already implemented road pricing schemes (London, Oslo, Singapore, etc.) and several others are considering road pricing in their transport policies.
For the two main scenarios, we focus on traffic flows (the level of congestion) and polluting gas emissions. The reference values are those obtained in the calibration stage and given in Table 1. The upper part of the table reports values for the entire study region and the lower part reports values corresponding to the metropolitan area of Lille. Mode shares are given for each user group. Intermodal transport involves at least two modes, and each trip in this category appears at least twice (on two lines) in the values of the table. The share of biking remains small by comparison to the other modes. Walking and public transport are more frequent in Lille (and other urban areas) than compared to less urbanized areas. Public transport is used twice as much in Lille. The private car, which is the source of important congestion and emissions, is dominant, particularly for intercity trips where it accounts for more than 50% of total flows. Walking has an important share, but remains limited to very short trips and, thus, cannot play a central role in public policies. There is clearly more potential to explore for biking and public transport and possibly their combination.

4.1. Free Public Transport

The agglomeration of Dunkerque, with more than 200,000 inhabitants, is the largest city in France offering free public transport services since 2018. Lille is offering free public transport for those who are less than eighteen years old starting from January 2022. The issues of free public transport have been largely debated in the regional elections, June 2021, in several regions, including the north of France and the metropolitan area of Paris. Attracting users of private cars is one of the main objectives of free public transport. The precise magnitude of this impact will depend on the cross elasticities between the modes and these are generally low [15,16]. Free public transport is sometimes criticized as mainly attracting walkers and bikers and does not really attract the users of private cars. Unpriced public transport has other benefits. In particular, it improves the mobility of the low income group [17] and contributes in reducing frictions in the labour market [18]. A comprehensive review of the literature and experiences with respect to free public transport is provided in [19].
To evaluate the impacts of free public transport, we consider the model where the population is composed of three income groups, as described in Figure 4, and remove the monetary cost for users of public transport. This is performed for the entire regional transport system, but it is straightforward to focus on a specific agglomeration.
The aggregate simulation outputs for free public transport are reported in Table 2. Removing fares creates an important modal shift towards public transport. For low income groups, the number of trip in public transport is twice as high. It increases by more than 50% for the medium income group and less than 20% for the high income group. Overall, the number of trips in public transport increases by 54%. Higher income users are less sensitive to monetary costs. We have then set a smaller value of cross elasticity for this group to reflect the fact that they are less likely to switch to public transport. Walking is more frequent since it is a direct complement for public transport.
Free public transport is more effective when the modal switch involves a significant number of car users. The output of our simulations shows that the number of trips made by a car decreases by about 9%, while the number of trips made by bike, which are already small, decreases by 17.5%. This impact is important to be taken into account in considering the promotion of public transport. Policies based on the combination of soft modes (bikes) and public transport modes should be considered. The reduction in trips by car is significant but may be considered unsatisfactory. This is a recurring question; however, again, the smart combination of soft modes and public transport may provide satisfactory flexibility for car users. Instead of subsidizing pubic transport, the reduction in trips made can be targeted directly through road pricing. We consider this alternative in the next subsection.

4.2. Road Pricing

The objective of road pricing is to make users bear the full cost of their trips, including the social marginal cost they impose on other users [20]. First-best tolls are generally difficult to implement since they require the availability of quantity of information for each single trip (departure and arrival times, route choice, vehicle characteristics, etc.). De Palma et al. (See Ref. [21]) show that first-best toll is time varying, and that it increases during the peak hours when congestion levels are high. In practice, increasingly simpler pricing schemes are adopted. For example, zone tolls, where users pay a charge for driving within a given zone (city center), are used in London. Alternatively, in Norway, for example, cordon tolls are used instead. In this case, users pay a charge when they cross a border between two zones, usually between the city center and the periphery. Which pricing scheme is better will generally depend on cities’s geometry and the trade-off between simple schemes and efficiency. The outcome can also depend on whether we focus on short term impacts (fixed location of households and activities) or long term impacts where households and firms are allowed to relocate to optimize the trade-off between accessibility and benefits of real estate services (housing of office space). Lara et al. (See Ref. [22]) discussed several cases and showed that cordon tolls remain simple and usually reach a good efficiency, particularly in the long run when households can relocate.
We focus here on the metropolitan area of Lille, which is the largest agglomeration in our study area, and evaluate the impacts of a cordon pricing covering the city center and a small part of motorways A1 and A25. This is important since, during peak hours, these two motorways are severely congested. Moreover, agglomeration of Lille is somewhat sprawled with a CBD (Central Business District) in the city center, but several other SBDs are observed (secondary business districts), as reported in [23]. Moreover, congestion is not particularly important in the city center but it is in the periphery. This pattern is accentuated as a significant part of home-to-work trips connecting the (historical) mining area (refer to Figure 1) to the agglomeration of Lille.
The cordon toll area is provided in Figure 7. Tolls are imposed on private cars in each crossing of the cordon. For some trips, such as those proceeding through motorways A1 and A25, the toll is paid twice. Drivers can avoid the toll by using secondary roads or other highways. Drivers living (respectively, working) inside the cordon area and working (respectively, living) outside the cordon area pay the toll at least once. They may switch to public transport to avoid the toll, and low income groups are more likely to perform this compared to than higher income groups. Traffic is more congested in the peak period. We consider a (dynamic) toll that targets the peak period. The toll is EUR 10 during the peak period (from 7 a.m. to 10 a.m. and from 4 p.m. to 6 p.m.) and EUR 5 in the off-peak period.
The main impacts of the cordon toll are given in Table 3 for the Lille agglomeration. The usage of private cars decreases by 4.02% and, almost, only low and medium income groups are concerned by this change. Modal switches for the high income group are very small since they are less sensitive to the monetary cost. The impact of biking remain small, but a significant increase of about 5% was observed for public transport, which is about 10% for the low income group. Indeed, as in the case of free public transport, the impacts decrease in users’ revenue. Walking is also positively impacted by cordon tolls, but the model switch is limited to urban and very short trips.
Note that an overall comparison of the two scenarios, free public transport and cordon tolls, must take into account also the financial balance of each. Indeed, free public transport needs financial resources, as users do not pay for the corresponding services while road pricing. Here, the cordon toll generates additional revenues.

4.3. Environmental Impacts

In this section, we evaluate the impacts of the two scenarios on the emissions of CO 2 and fine particles. On 1 January 2021, the French fleet of cars is evaluated to 45 million vehicles (www.statistiques.developpement-durable.gouv.fr (accessed on 10 October 2021)). It is mainly composed of passenger cars (85%), by delivery vehicles with 5.9 million light commercial units (LCVs) and 600,000 heavy goods units. The remainder is made up of buses and coaches in circulation with 94,000 units. In Hauts-de-France, there are 3.5 million private cars for a population of 6 million, i.e., about one car for two people.
The statistics show that most cars run on diesel (61%). Gasoline is quite common (38%) compared to cleaner vehicles such as 100% electric cars and hybrid cars, for which their shares remain low (less than 1%). However, the penetration rate of electric vehicles in the region has increased significantly by the end of 2021. Given the unavailability of engine type in the household survey, we have considered a random assignment with respect to the available shares of each type: 61% diesel, 38% gasoline and 1% electric to account for the latest advances in energy transition. From the energy profile of vehicles, the emission profiles for the different modes of transport are based on HBEFA (“Handbook of emission factors for Road Transport”) (https://www.hbefa.net/e/index.html (accessed on 10 October 2021)) Handbook of Emission Factors for Road Transport (HBEFA). The simulation of the results of the transport model and the emission profile result in pollutant emissions and energy consumption. Our current focus is on CO 2 emissions, fine particles and fuel consumption. CO 2 emissions are the most decried greenhouse gases and PMs are increasingly discussed because of their direct impact on the health and wellbeing of users and residents.
The regional baseline scenario for the Nord and Pas-de-Calais departments results in daily emissions of 2.8 kg of CO 2 per person. This pollution is justified by the high use of cars and the more frequent long-distance trips in this region compared to more urbanized areas. According to INSEE, in 2007, each commuter in the Nord-Pas-de-Calais emitted 2 kg of CO 2 per day for home-to-work or home-to-study trips with an average distance of 21 km (1 km more than in Paris region) (https://www.insee.fr/fr/statistiques/1292919 (accessed on 10 October 2021)) (CO 2 emissions related to daily travel in Nord-Pas-de-Calais, INSEE 2012). The departments of Oise, Aisne and Somme, which represented the most CO 2 -emitting area, are considered in the model and increased the average CO 2 rate per person in the area. Despite important reforms to reduce CO 2 emissions, the French car fleet continues to grow with a high rate of diesel engines. National statistics on the French car fleet show that, since 2012, the shares of diesel and gasoline have always been around 61% and 37%, respectively.
Free public transport reduces road traffic, private cars in particular and has a positive impact on pollutant emissions. Table 4 reports the impacts by transport mode and for each user group and for each type of engine fuel. Overall, a decrease in emissions is about 5% for greenhouse gas (CO 2 ), fine particles (PM) and fuel consumption. As expected, with respect to these three variables, there is an important correlation. With respect to the three income groups, we have an important heterogeneity with respect to the modal switch. The impact is high for the low income group (about 15%) since many of those reduce their car usage and/or shift to other less polluting alternatives. It is much smaller (about 2.3%) for the high income group. The reduction in emissions is slightly more important for diesel cars, but the value remains comparable.
The impacts of a cordon toll on emissions are reported in Table 5. By comparison to free public transport, the impacts are smaller but display a similar structure. The impacts are highest for diesel cars and the low income group and are the lowest for the high income group (and diesel cars). An overall decrease in emissions by 3% is obtained. With respect to traffic flows and polluting gas emissions, free public transport is more efficient, but a global comparison of the two scenarios requires a more general framework where subsidies and collected revenues are taken into account. What is important to notice in all these scenarios is the differentiated impacts on the three groups. Transport policies aiming at a reduction in emissions (and road traffic) seem to impact significantly more users in the low income group. This issue has been raised frequently to oppose the implementation of road pricing.

5. Conclusions

We have developed a multimodal transport model for the north of France and used it to discuss some reforms that focus on the reduction in external costs (pollution and congestion) produced by transport activities. Since both urban and intercity trips are taken into account, this model can be used to study policies at the regional and/or urban scales.
The model has several interesting features. It includes several modes of transport (motorized and non-motorized) and is based on a dynamic assignment structure [3]. Our approach is modular and transparent and should be relatively easy to replicate for other regions. It already includes most available data on travel patterns in the study region and can be updated as soon as new data are made available. For example, service schedules of public transport can be updated to new changes or new published schedules.
We have reported the main results for the first two scenarios that we have examined. Free public transport attracts a large number of users to mass transit. This will be followed by a significant reduction in the number of users of the private car. Overall, there is a decrease in the levels of congestion and pollution. Cordon pricing yields also congestion and pollution reduction but with a limited magnitude. The decrease in the usage of the private car is relatively small and is comparable to the modal switch to public transport. The limited impact of the cordon toll we have examined should not be generalized to all road pricing schemes. We may obtain distinct outcomes with zone tolling (drivers pay a toll when they drive inside a given zone). Moreover, improved impacts may be possible if cordon tolls that are set in a narrower or larger area. The level of the toll may also be optimized to obtain higher impacts. Further investigations that we plan to conduct in the near future are necessary before we can definitely make conclusions with this respect to this issue. As we discussed above, the financial balance of each scheme should be taken into account for a full comparison of competing policies.
The model can be improved in several directions:
  • Improvement of the calibration techniques. The procedure we have used is very simple and does not always converge, particularly when the number of control parameters is large (more than ten). The number of parameters increases, for example, when there are several groups of agents with respect to their income. In that case, a manual adjustment was necessary to complement the automatic update of model parameters. Appropriate procedures based on Broyden’s algorithm for non-linear equations [24] should yield better outcomes. By performing this, it will allow us to implement finer calibrations based on count data.
  • Improve freight transport, which is now simply integrated. This will allow us to discuss the organization of urban logistics [25] and the locations of distribution centers [26,27].
  • A more comprehensive account of multimodal trips. In the current version, the combination of several transport modes is not sufficiently flexible and remains limited to some predetermined possibilities.
  • Alternative formulation of the utility function. For instance, we use a basic formulation where all components enter linearly. More complex formulations are more consistent with microeconomic descriptions of the users’ choice. In particular, travel time uncertainty turns out to be an important determinant in the choice of the transport mode (and even the households’ location choice). Recent literature has focused on this topic, and several estimations confirm that travel time reliability is as important as the value of time [28].
The model can be used to examine several other scenarios. In particular, complex time-varying tolls may produce a much better impact than flat cordon tolls [21]. The list of possible policies is quite long. The most important ones are as follows: automated and shared vehicles [29,30], electric vehicles and related energy and pollution impact [31], network design and resilience [32], etc. Given the current pandemic context, an important theme is to study how to adapt public transport services to health emergency situations and how to recover pre-pandemic traffic flows in the public transport sector.

Author Contributions

Analysis, M.K., N.D. and D.D.W.; writing—original draft preparation, M.K., N.D. and D.D.W.; writing—review and editing, M.K., N.D. and D.D.W. All authors have read and agreed to the published version of the manuscript.

Funding

ANR (Agence Nationale de la Recherche) under project fund ANR-21-HDF1-0014.

Institutional Review Board Statement

Not applicable.

Informed Consent Statement

Not applicable.

Data Availability Statement

Data available in a publicly accessible repository. The data presented in this study are openly available at https://murdasp.univ-littoral.fr (accessed on 3 December 2021).

Acknowledgments

Experiments presented in this paper were carried out by using the CALCULCO computing platform and supported by SCoSI/ULCO (Service COmmun du Système d’Information de l’Université du Littoral Côte d’Opale).

Conflicts of Interest

The authors declare no conflict of interest.

Abbreviations

CO 2  Dioxyde carbone
GTFS General Transit Feed Specification
HBEFA Handbook of emission factors for Road Transport
INSEE National Institute of Statistics and Economic Studies
LCV Light commercial vehicles
MATSim Multi-Agent Transport Simulation
PM Particulate Matter
TER Regional Express Train
TERGV Regional High Speed Train

References

  1. Marek, W. Will the consequences of covid-19 trigger a redefining of the role of transport in the development of sustainable tourism? Sustainability 2021, 13, 1887. [Google Scholar]
  2. de Dios Ortúzar, J.; Willumsen, L.G. Modelling Transport; John Wiley & Sons: Hoboken, NJ, USA, 2011. [Google Scholar]
  3. Brotcorne, L.; De Wolf, D.; Gendreau, M.; Labbé, M. A dynamic user equilibrium model for traffic assignment in urban areas. In Transportation and Network Analysis: Current Trends; Kluwer Academic Publishers: Dordrecht, The Netherlands, 2002; pp. 49–69. [Google Scholar]
  4. McNally, M.G.; Rindt, C.R. The activity-based approach. In Handbook of Transport Modelling; Emerald Group Publishing Limited: Bingley, UK, 2007; pp. 55–73. [Google Scholar] [CrossRef] [Green Version]
  5. Axhausen, K.W.; Horni, A.; Nagel, K. The Multi-Agent Transport Simulation MATSim; Ubiquity Press: London, UK, August 2016. [Google Scholar] [CrossRef]
  6. Petru, J.; Krivda, V. An analysis of turbo roundabouts from the perspective of sustainability of road transportation. Sustainability 2021, 13, 2119. [Google Scholar] [CrossRef]
  7. Nguyen-Luong, D.; De Palma, A.; Motamedi, K.; Ouaras, H.; Picard, N. Simaurif: Simulation of the Interaction between Land Use and Transportation in the Region Ile-de-France (Paris Region). In European Transport Conference 2008; Proceedings; the Transportation Research Board: London, UK, 2008; Available online: https://trid.trb.org/view/919672 (accessed on 3 December 2021).
  8. Delons, J.; Coulombel, N.; Leurent, F. PIRANDELLO an Integrated Transport and Land-Use Model for the Paris Area. 2008. Available online: https://hal.archives-ouvertes.fr/hal-00319087/document (accessed on 3 December 2021).
  9. Palma, A.D.; Marchal, F. Real cases applications of the fully dynamic metropolis tool-box: An advocacy for large-scale mesoscopic transportation systems. Netw. Spat. Econ. 2002, 2, 347–369. [Google Scholar] [CrossRef]
  10. Raux, C.; Ma, T.-Y.; Lemoy, R.; Ovtracht, N. A luti agent-based model of Lyon area: Welfare analysis of some scenarios. In Proceedings of the Transport Research Arena 2014: Innovate Mobility, Mobilise Innovation, Paris, France, 14–17 April 2014. [Google Scholar]
  11. Vickrey, W. Pricing, metering, and efficiently using urban transportation facilities. Highw. Res. Rec. 1973, 476, 36–48. [Google Scholar]
  12. Kickhofer, B.; Hosse, D.; Turnera, K.; Tirachinic, A. Creating an Open Matsim Scenario From Open Data: The Case of Santiago de Chile. VSP Working Paper 16-02. TU Berlin. Transport Systems Planning and Transport Telematics. 2016. Available online: http://www.vsp.tu-berlin.de/publications (accessed on 3 December 2021).
  13. Abdallah, K.B.; Belloumi, M.; Wolf, D.D. International comparisons of energy and environmental efficiency in the road transport sector. Energy 2015, 93, 2087–2101. [Google Scholar] [CrossRef]
  14. Borger, B.D.; Glazer, A. Support and opposition to a pigovian tax: Road pricing with reference-dependent preferences. J. Urban Econ. 2017, 99, 31–47. [Google Scholar] [CrossRef]
  15. Goodwin, P.; Dargay, J.; Hanly, M. Elasticities of road traffic and fuel consumption with respect to price and income: A review. Transp. Rev. 2004, 24, 275–292. [Google Scholar] [CrossRef]
  16. Litman, T. Transit price elasticities and cross-elasticities. J. Public Transp. 2004, 7, 3. [Google Scholar] [CrossRef] [Green Version]
  17. Guzman, L.A.; Oviedo, D.; Cardona, R. Accessibility changes: Analysis of the integrated public transport system of bogotá. Sustainability 2018, 10, 3958. [Google Scholar] [CrossRef] [Green Version]
  18. Pilegaard, N.; Fosgerau, M. Cost benefit analysis of a transport improvement in the case of search unemployment. J. Transp. Econ. Policy JTEP 2008, 42, 23–42. [Google Scholar]
  19. David, Q. Gratuité des Transports en Commun et Congestion Routière: Revue de la Littérature et Implications Pour Paris; LEM, UMR 9221, Discussion Papers 2021-10; LIEPP Working Paper, Paris. 2021. Available online: https://hal.archives-ouvertes.fr/hal-03403442/ (accessed on 3 December 2021).
  20. Small, K.A.; Verhoef, E.T. The Economics of Urban Transportation; Routledge: London, UK, 2007. [Google Scholar]
  21. De Palma, A.; Kilani, M.; Lindsey, R. Congestion pricing on road network: A study using the dynamic equilibrium simulator metropolis. Transp. Res. A 2005, 39, 588–611. [Google Scholar] [CrossRef]
  22. Lara, M.D.; Palma, A.D.; Kilani, M.; Piperno, S. Congestion pricing and long term urban form: Application to paris region. Reg. Sci. Urban Econ. 2013, 43, 282–295. [Google Scholar] [CrossRef]
  23. Aboubacar, A.; Hammadou, H.; Kilani, M. Distribution des emplois et identification des sous-centres d’affaires dans l’agglomération lilloise. Rev. Deconomie Reg. Urbaine 2019, 5, 913–936. [Google Scholar] [CrossRef]
  24. Broyden, C.G. A class of methods for solving nonlinear simultaneous equations. Math. Comput. 1965, 19, 577–593. [Google Scholar] [CrossRef]
  25. Gonzalez-Feliu, J.; Semet, F.; Routhier, J.-L. Sustainable Urban Logistics: Concepts, Methods and Information Systems; Springer: Berlin/Heidelberg, Germany, 2014. [Google Scholar]
  26. de Carvalho, N.L.; Vieira, J.G.V.; da Fonseca, P.N.; Dulebenets, M.A. A multi-criteria structure for sustainable implementation of urban distribution centers in historical cities. Sustainability 2020, 12, 5538. [Google Scholar] [CrossRef]
  27. Katsela, K.; Güneş, S.; Fried, T.; Goodchild, A.; Browne, M. Defining urban freight microhubs: A case study analysis. Sustainability 2022, 14, 532. [Google Scholar] [CrossRef]
  28. de Jong, G.C.; Bliemer, M.C. On including travel time reliability of road traffic in appraisal. Transp. Res. Part Policy Pract. 2015, 73, 80–95. [Google Scholar] [CrossRef]
  29. Alessandrini, A.; Campagna, A.; Site, P.D.; Filippi, F.; Persia, L. Automated vehicles and the rethinking of mobility and cities. Transp. Res. Procedia 2015, 5, 145–160. [Google Scholar] [CrossRef] [Green Version]
  30. Wang, X.; Liu, S.; Shi, H.; Xiang, H.; Zhang, Y.; He, G.; Wang, H. Impact of penetrations of connected and automated vehicles on lane utilization ratio. Sustainability 2022, 14, 474. [Google Scholar] [CrossRef]
  31. Sechel, I.C.; Mariasiu, F. Efficiency of governmental policy and programs to stimulate the use of low-emission and electric vehicles: The case of romania. Sustainability 2022, 14, 45. [Google Scholar] [CrossRef]
  32. Vishnu, N.; Kameshwar, S.; Padgett, J.E. Road Transportation Network Hazard Sustainability and Resilience: Correlations and Comparisons. Struct. Infrastruct. Eng. 2021, 1–21. Available online: https://doi.org/10.1080/15732479.2021.1945114 (accessed on 3 December 2021). [CrossRef]
Figure 1. The region covered by the model (north of France). The two departments “Le nord” and “le Pas-de-Calais” are represented as well as the historical mining region.
Sustainability 14 01535 g001
Figure 2. The main figure shows mode shares for daily trips (only main modes are reported). Activities and their relative importance, whether they appear at the origin or at the destination of a trip, are reported in the upper right corner.
Sustainability 14 01535 g002
Figure 3. Departure and arrival rates of trips during a representative day.
Sustainability 14 01535 g003
Figure 4. Selected deciles for revenue distribution.
Sustainability 14 01535 g004
Figure 5. The model scaled on the metropolitan region of Lille (the same legend as in Figure 6).
Sustainability 14 01535 g005
Figure 6. The region covered by the model (north of France).
Sustainability 14 01535 g006
Figure 7. The cordon toll area (Lille agglomeration).
Sustainability 14 01535 g007
Table 1. Base case: mode shares of the calibrated model.
User Groups (by Income)
ModesLowMediumHighTotal(%)
Regional model: Nord and Pas-de-Calais
bike736821,00011,32139,6892.70
car142,677465,000259,694867,37159.05
pt14,34841,97428,64184,9635.78
walk85,281246,771144,791476,84332.46
Urban model: Lille
bike18095721402011,5502.01
car31,548125,928104,347261,82345.57
pt11,48531,71624,11067,31111.71
walk39,482111,90082,516233,89840.71
Table 2. Impact of the free public transport on mode shares.
User Groups (by Income)
ModesLowMediumHighTotal
bike−28.14%−17.73%−9.71%−17.47%
car−18.62%−8.40%−3.37%−8.82%
pt+115.06%+55.18%+18.82%+54.24%
walk+14.22%+7.95%+3.07%+7.84%
Table 3. Impacts of a cordon toll (Lille agglomeration). The toll is EUR 10 in peak period and EUR 5 in the off-peak period.
User Groups (by Income)
ModesLowMediumHighTotal
bike+2.51%+0.26%−0.99%+0.25%
car−11.68%−4.47%−0.87%−4.02%
pt+9.92%+6.12%+1.27%+5.14%
walk+6.33%+3.29%+0.77%+3.01%
Table 4. Free public transport (regional model).
User Groups (by Income)
ModesLowMediumHighTotal
Nord and Pas-de-Calais model: Diesel car
CO 2 −15.08%−4.01%−2.30%−5.11%
PM−14.96%−4.01%−2.35%−5.10%
Fuel−14.95%−3.98%−2.27%−5.06%
Nord and Pas-de-Calais model: Petrol car
CO 2 −13.82%−4.92%−2.23%−5.33%
PM−13.84%−4.89%−2.32%−5.35%
Fuel−13.70%−3.88%−2.19%−5.28%
Table 5. Cordon toll (Lille agglomeration).
User Groups (by Income)
ModesLowMediumHighTotal
Lille Metropole model: Diesel car
CO 2 −10.15%−3.31%−0.85%−3.04%
PM−10.02%−3.19%−0.75%−2.92%
Fuel−10.12%−3.28%−0.83%−3.01%
Lille Metropole model: Petrol car
CO 2 −6.13%−3.94%−1.42%−3.15%
PM−6.47%−3.77%−1.32%−3.06%
Fuel−6.14%−3.89%−1.41%−3.12%
Publisher’s Note: MDPI stays neutral with regard to jurisdictional claims in published maps and institutional affiliations.

