Article

System-Wide Seismic Risk Assessment of Port Facilities; Application to the Port of Thessaloniki, Greece

by
Stavroula Fotopoulou
*,
Stella Karafagka
,
Anna Karatzetzou
and
Kyriazis Pitilakis
Department of Civil Engineering, Aristotle University, 54124 Thessaloniki, Greece
*
Author to whom correspondence should be addressed.
Sustainability 2022, 14(3), 1424; https://doi.org/10.3390/su14031424
Submission received: 1 December 2021 / Revised: 12 January 2022 / Accepted: 18 January 2022 / Published: 26 January 2022

Abstract

:
Damages in port facilities during past seismic events have led to widespread direct and indirect losses, with serious impact on the economic, operational, and emergency management of the port itself and, as a consequence, on the related society. Ground shaking is among the most widespread sources of seismic damage to port structures and infrastructure, together with the induced phenomena principally associated with the liquefaction of loose, saturated soils that often prevail in coastal areas. This study presents a methodology for the seismic risk assessment of port facilities which considers the combined effects of ground shaking and liquefaction as well as various interdependencies among port elements, which affect the port’s operation and, consequently, the total risk impact. The methodology, based on either probabilistic or deterministic scenario-based approaches, is demonstrated through an application to the Thessaloniki port, one of the most important ports in Southeastern Europe and the largest transit-trade port in Greece. The systemic risk analysis of the port is carried out using as a performance indicator the reduction in the container and bulk cargo movements affected by the seismic performance of the piers, the waterfront, and container/cargo handling equipment, as well as their interaction with the seismic performance of the electric power system. Two different functionality analyses of the port system are performed, one basic and one less conservative alternative. The results of the probabilistic seismic risk assessment are illustrated in terms of annual probabilities of collapse and loss exceedance curves for each individual port component as well as normalized performance loss for the whole port system for the container and cargo terminal. For the scenario-based deterministic approach, the results are given in terms of risk maps presenting the spatial distribution of damages/losses for all components as well as in terms of the expected loss of performance of the port system. The proposed methodology may provide the basis for an efficient seismic risk management of ports. It may also be adjusted and applied to other port infrastructures in Greece and worldwide considering additional components, interactions among elements, and different earthquake induced hazards.

1. Introduction

Ports are critical components of national, regional, and sometimes international transportation systems, often being regional economic centers. They represent complex systems comprising several buildings, cargo facilities, lifelines, and infrastructures which interact with each other and with the urban fabric and transportation networks. Ports play a key role in the world’s economy, considering that approximately 90% of world trade is performed by the international shipping, while seaborne trade volumes surpassed 11 billion tons in 2019 [1]. For these reasons, ensuring the sustainability and continuous operation of ports is a crucial task that should be interconnected with international, national, and regional preventive measures.
Damages sustained by port facilities during past seismic events (e.g., Loma Prieta M6.9 1989, Hyogo-ken Nanbu (Kobe) M6.9 1995, Chi-Chi M7.3 1999, Maule M8.8 2010, Port-au-Prince Hait M7.0 2010) led to significant direct and indirect losses, with serious impacts on the economic, operational, and emergency management of modern societies. For instance, the port of Kobe lost almost 50% of its commercial flow after the strong M6.9 earthquake in 1995 [2] and sustained major long-term traffic loss in the context of Asian port competition that endured despite the restoration of damaged physical facilities [3]. The most widespread source of seismic damage to port structures and infrastructure is not related only to ground shaking itself but also to induced phenomena which are principally associated with the liquefaction of loose, saturated soils that are often present in coastal areas [4]. Previous studies have shown that even moderate levels of earthquake shaking can trigger liquefaction, modifying seismic response at the ground surface and potentially leading to induced soil settlements and lateral spreading that may produce serious damages to port infrastructures [5]. In addition to soil liquefaction, soil-structure interaction (SSI) may affect the seismic vulnerability of port facilities modifying the free field seismic input motion as well as the dynamic response of the port structures [6].
The impact of earthquake-induced damage to ports is not only related to repair costs for individual port components but, more importantly, to the disruption of port functionality in the immediate aftermath of an earthquake, often associated with extended downtimes and disruption of shipping operations. Therefore, to assess the seismic performance of a port, one must take into account the interaction and contributions of all its infrastructural and operational components such as waterfront structures, cargo handling and storage components, buildings, utility systems, and transportation infrastructures [7,8,9]. Engineering practice for seismic risk assessment and the management of port facilities currently relies on the performance of specific critical components. However, the resilience of a port, i.e., its ability to promptly recover to a serviceable status after an earthquake, depends not only on the performance of its individual components but also on their location and physical and operational connectivity, as well as on the port system as a whole [10]. For example, the failure of the electric power system may neutralize the cranes, which may be also seriously damaged if, as a consequence of seismic shaking, the deformations of the quay walls exceed a certain level. In the latter case, the deformation of the quay walls, because of their sheer size and weight, may potentially put cranes out of balance, increasing the risk of their collapse. In this context, Conca et al. [11] recently investigated the effect of interdependencies in a seismic risk analysis of ports. They compared the results for specific seismic scenarios obtained in the assessment of the seismic vulnerability of the seaport, considering and neglecting the interactions among its components, and they found that the modeling of the port system without considering interdependencies led to less conservative results. Within the SYNER-G project (http://www.vce.at/SYNER-G/files/project/proj-overview.html, accessed on 1 January 2013, [8]), a general framework and pertinent tools were developed for the systemic risk assessment of ports, modeling port operations, and considering, also, the interactions among port elements. The quantitative measure of the performance of the whole port system with all its elements was described by appropriate Performance Indicators (PIs), expressed as the total cargo/containers handled in a pre-defined time frame per terminal. The methodology, originally designed for seismic hazard only, was extended in the STREST project (http://www.strest-eu.org/, accessed on 1 October 2016) to encompass tsunami hazard [9,12], while further developments are presented in this work, performed in the framework of the RESPORTS project (www.resports.gr, accessed on 1 January 2019).
Under these considerations, the objective of this paper is to present a seismic risk assessment methodology for ports focusing on critical components and systems and considering various interdependences among elements. Depending on the importance of the induced phenomena (principally associated with liquefaction effects), probabilistic or deterministic scenario-based seismic risk approaches are proposed, resulting in the estimation of expected losses at the component level and the normalized performance loss of the whole port system. In the former approach, ground shaking is only taken into account in the assessment while, in the latter, the combined effects of ground shaking and induced phenomena are accounted for. The developed methodology combines a systemic risk analysis framework of port facilities with a detailed definition of seismic hazard (both probabilistically and deterministically sound and, therefore, may account for site effects and liquefaction potential) and of the seismic vulnerability (that allows the consideration of the combined damages due to ground shaking and liquefaction), which represents a novelty in the current scientific literature. The methodology is demonstrated and specified through its application to a real case study, i.e., the port of Thessaloniki in Northern Greece. The proposed methodology may be a valuable tool for the port stakeholders, enabling the efficient allocation of resources to reduce seismic risk toward more resilient and sustainable ports.

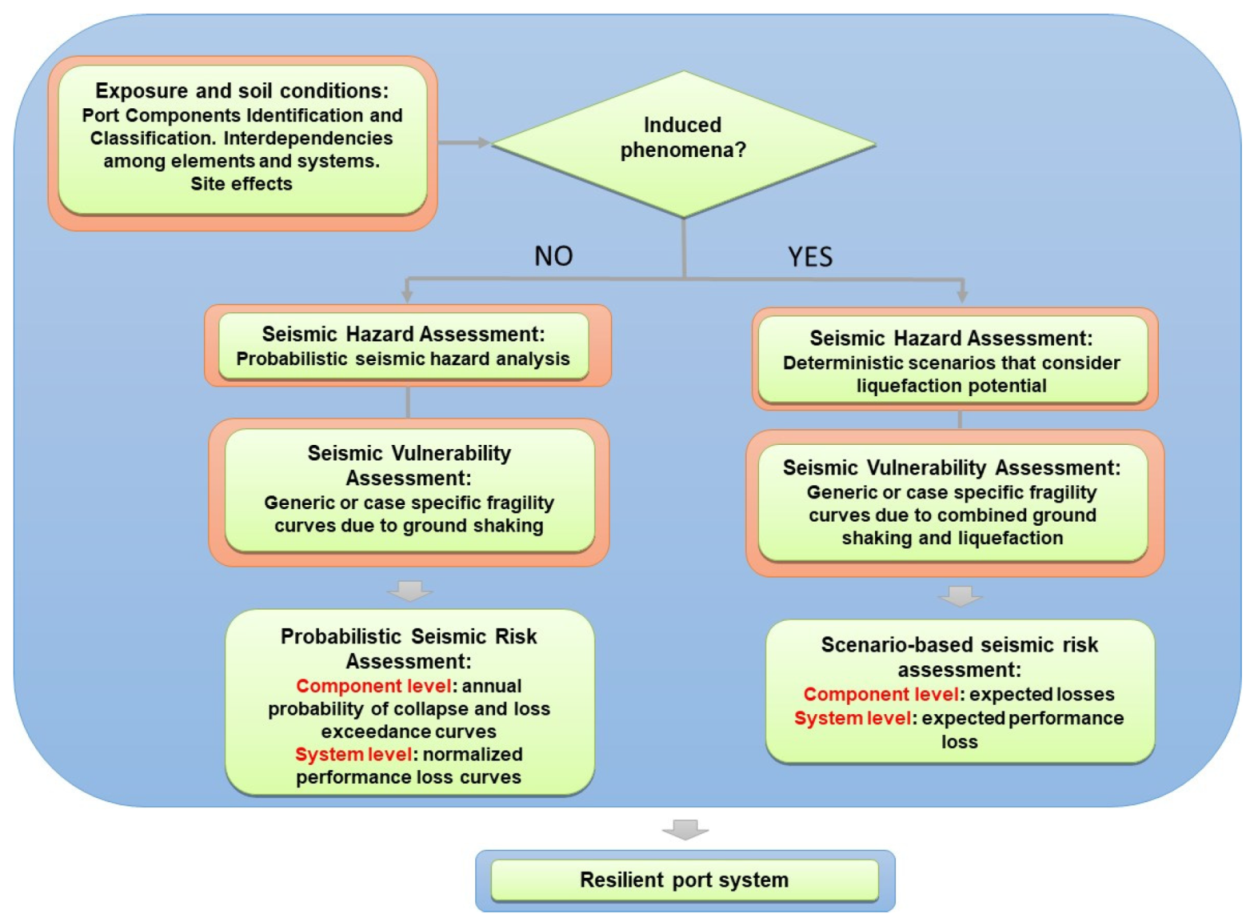
2. Outline of the Proposed Methodology

We present a system-wide seismic risk assessment methodology for ports, aiming to provide the basis for an efficient seismic risk management. When deemed necessary, it allows combining seismic ground shaking with induced phenomena (e.g., liquefaction), as well as considering various dependencies among port elements and systems. Figure 1 presents a general flowchart of the proposed methodological framework, giving a brief description of the main steps that will be followed. In the proposed framework, seismic hazard and, consequently, seismic risk may be either probabilistic or deterministic, depending on the importance of induced phenomena to the port’s performance. Therefore, the probabilistic approach is applied when we consider only ground shaking without the potential of induced phenomena (e.g., liquefaction). When both ground shaking and induced phenomena are considered simultaneously, then the analysis is performed in a deterministic way based on specific scenarios. The probabilistic analysis for the combined ground shaking and liquefaction is scheduled for a future paper.
Various procedures are associated with the components enclosed in the definition of risk [R] following the general, well-known form:
[Risk] = [Exposure] ∗ [Hazard] ∗ [Vulnerability]
The exposure concerns the inventory of all port components, namely waterfront structures, piers, cranes, buildings, warehouses, and their interdependencies with other systems, such as transportation or the electric power supply system. In the herein presented example, we consider only interactions with the electric power supply system, as a preliminary systemic analysis of the port of Thessaloniki has shown that the interaction with other systems (e.g., the transportation system) does not alter its seismic performance [13]. Other systems, such as onshore transportation networks or utility systems, can also be added for other applications. The seismic hazard analysis is carried out either in a probabilistic way, in case only seismic ground shaking is considered, or with a deterministic scenario-based approach, when site specific nonlinear numerical analysis is deemed necessary to account for induced phenomena (e.g., in case local soil conditions present high susceptibility to liquefaction). Finally, vulnerability is the degree of loss of a given port element at risk, subject to sole ground shaking or to combined effects of ground shaking and liquefaction. Generic or case-specific seismic fragility curves, due to ground shaking or to combined ground shaking and liquefaction, are considered for the different port elements. For specific elements which are lacking fragility curves due to combined ground shaking and liquefaction, separate fragility curves for ground shaking and liquefaction are utilized, and the combined damages are estimated at a second stage by combining the damage state probabilities due to liquefaction and ground shaking.
Similar to seismic hazard, the evaluation of the seismic risk of port buildings and infrastructures at the component level is carried out considering the physical damages and corresponding losses of the port elements, using either probabilistic (i.e., in case of ground shaking) or deterministic scenario-based (i.e., in case of ground shaking and liquefaction) approaches. For the seismic performance of the whole port, a systemic analysis is necessary to evaluate the performance loss of the container and bulk cargo movements affected by the seismic performance of the piers, the waterfront structures, and the container/cargo handling equipment (cranes), also considering the interaction with the performance of other systems necessary for their operation, i.e., the electric power supply system. The Performance Indicators (PIs) of the port system as a whole for the container and cargo terminal are estimated based on the damages and corresponding functionality states of each component, taking into account specific interdependencies between different systems, namely between the cargo handling equipment and the Electric Power Network supplying the cranes, and intra-dependencies, i.e., between the performance of quay walls and the affected cranes. The normalized performance loss (NPL) of the port system is defined as:
NPL = 1 − PI/PImax
where PImax is a baseline value referring to non-seismic conditions under the assumption that all cranes are working at their full capacity 24 h/day.
The results of the probabilistic risk assessment are presented in terms of annual probability of collapse and loss exceedance curves for each individual port component, and in terms of normalized performance loss curves for the whole port system. Through these curves, the annual probability of exceedance for specific levels of loss can be assessed and the performance loss for given mean return periods of the particular PI may be computed. For the deterministic scenario-based risk assessment, the distribution of damages/losses for all components as well as the expected loss of performance of the port system are obtained.
The methodology is described and illustrated through an application to a real case study, the Port of Thessaloniki in Northern Greece.

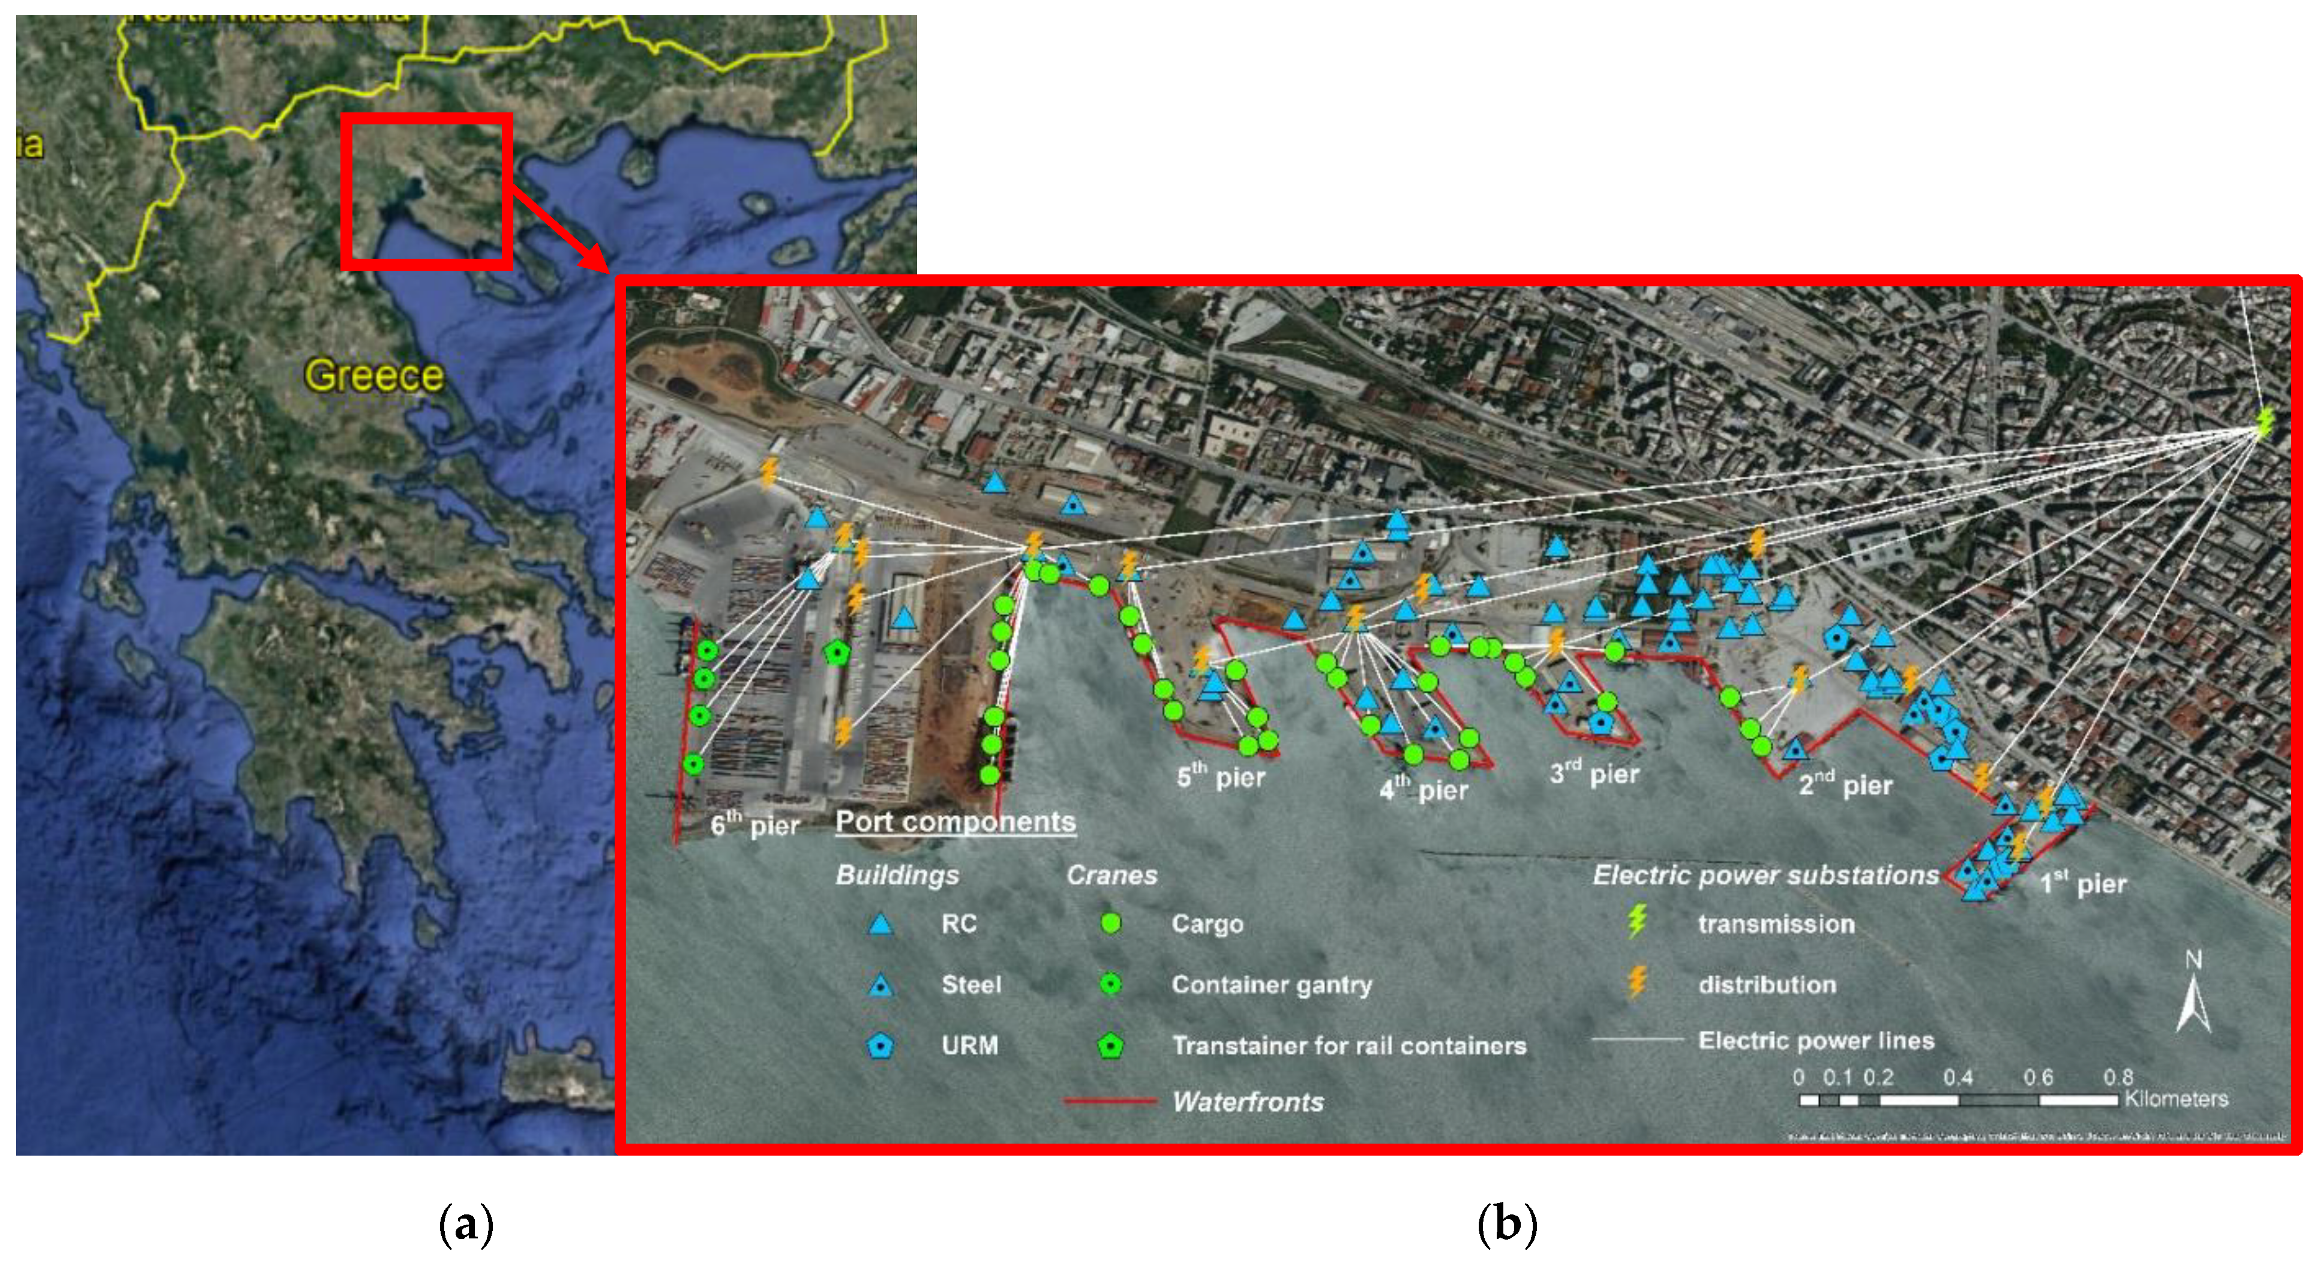
3. The Port of Thessaloniki: Exposure and Soil Conditions

The Port of Thessaloniki is one of the most important ports in Southeastern Europe and the largest transit-trade port in Greece. It occupies a total space of 1.5 million m2, including six piers spread across a 6200 m long quay and with a sea depth down to 12 m, with open and indoors storage areas, suitable for servicing all types of cargo and passenger traffic. The port also has installations for liquid fuel storage, is located close to the international natural gas pipeline (Trans Adriatic Pipeline, TAP), and is connected to the national and international transportation network (www.thpa.gr, accessed on 1 July 2021). In 2020, the Port of Thessaloniki handled 17,091,263 tons of cargo and 460,724 TEU, making it one of the busiest cargo ports in Greece and the second largest container port in the country (https://en.wikipedia.org/wiki/Port_of_Thessaloniki, accessed on 1 November 2021). In the same year, Rotterdam, the busiest container European port and the world’s tenth-largest container port, handled 14,300,000 TEU.

3.1. Port Facilities

The inventory of port critical components and their dependencies include all waterfront structures, piers, cranes, various buildings, and, in this application example, the electric power supply system. It is based on the existing GIS database for port facilities developed by the Research Unit of Soil Dynamics and Geotechnical Earthquake Engineering (SDGEE, sdgee.civil.auth.gr) at the Aristotle University of Thessaloniki in collaboration with the Thessaloniki Port Authority in the framework of previous research projects. The taxonomy used to define the different typologies is described in Crowley et al. [14]. Figure 2 presents the location of Thessaloniki port in Greece as well as a geographical representation of the port facilities considered in this study. Although not presented in the figure, information on other elements and systems (e.g., utility system, road/rail network, etc.) is also available, allowing their potential exploitation in a future work.
Waterfront structures are classified as concrete gravity quay walls with surface foundation and non-anchored components. Cargo handling equipment includes non-anchored components without backup power supply. Four gantry cranes are utilized for container loading-unloading services, placed in the western part of one of the piers. We assume that the electric power supply to the cranes is provided through non-vulnerable lines (an assumption that is based on the considerations of the port Authority) from the distribution substations that are located within the port area. The distribution substations are low voltage with non-anchored components.
Critical buildings of the port considered in this study include 69 buildings and storage facilities. Fifty-two of these buildings are RC buildings of different heights, including, principally, MRF systems with low or no-code seismic design level, while the remaining 17 buildings are basically steel light frame warehouses with one or two stories. Within the area of the port, there are also 16 buildings, namely 8 RC dual buildings and 8 unreinforced masonry (URM) buildings that are ignored herein. The main reason for this is related to the fact that, for these building typologies, fragility functions due to the combined effects of ground shaking and liquefaction are not available and, therefore, they could not be taken into account in the scenario-based approach. Therefore, in order to have the same dataset for the two analysis approaches, we preferred to ignore them.

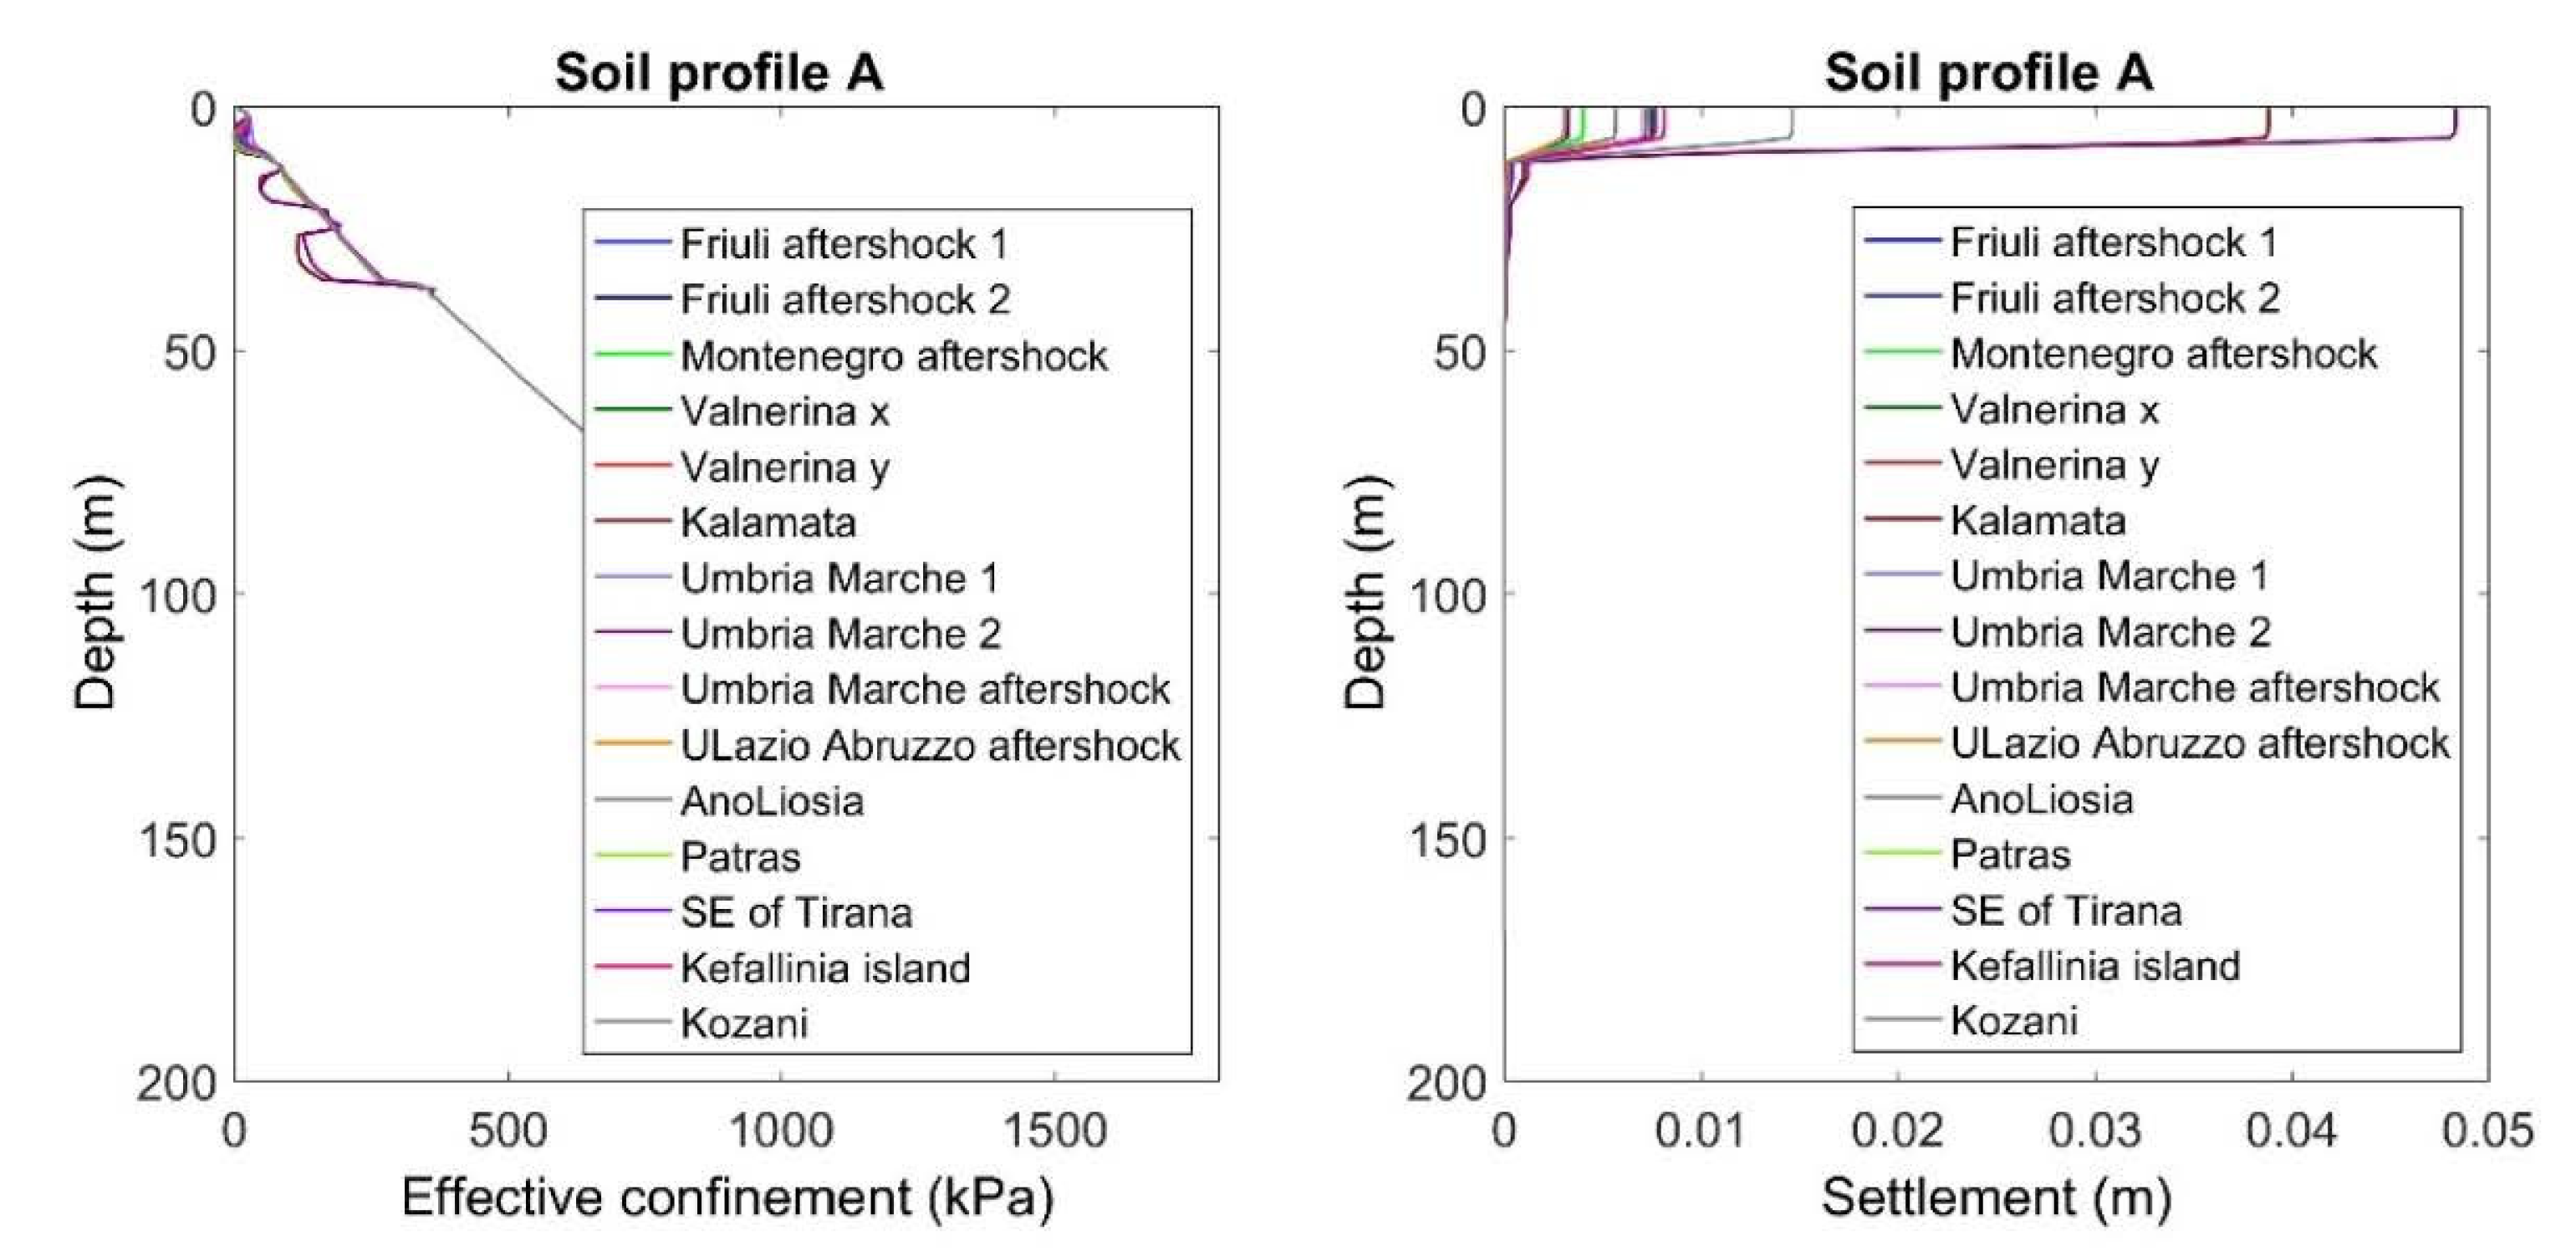
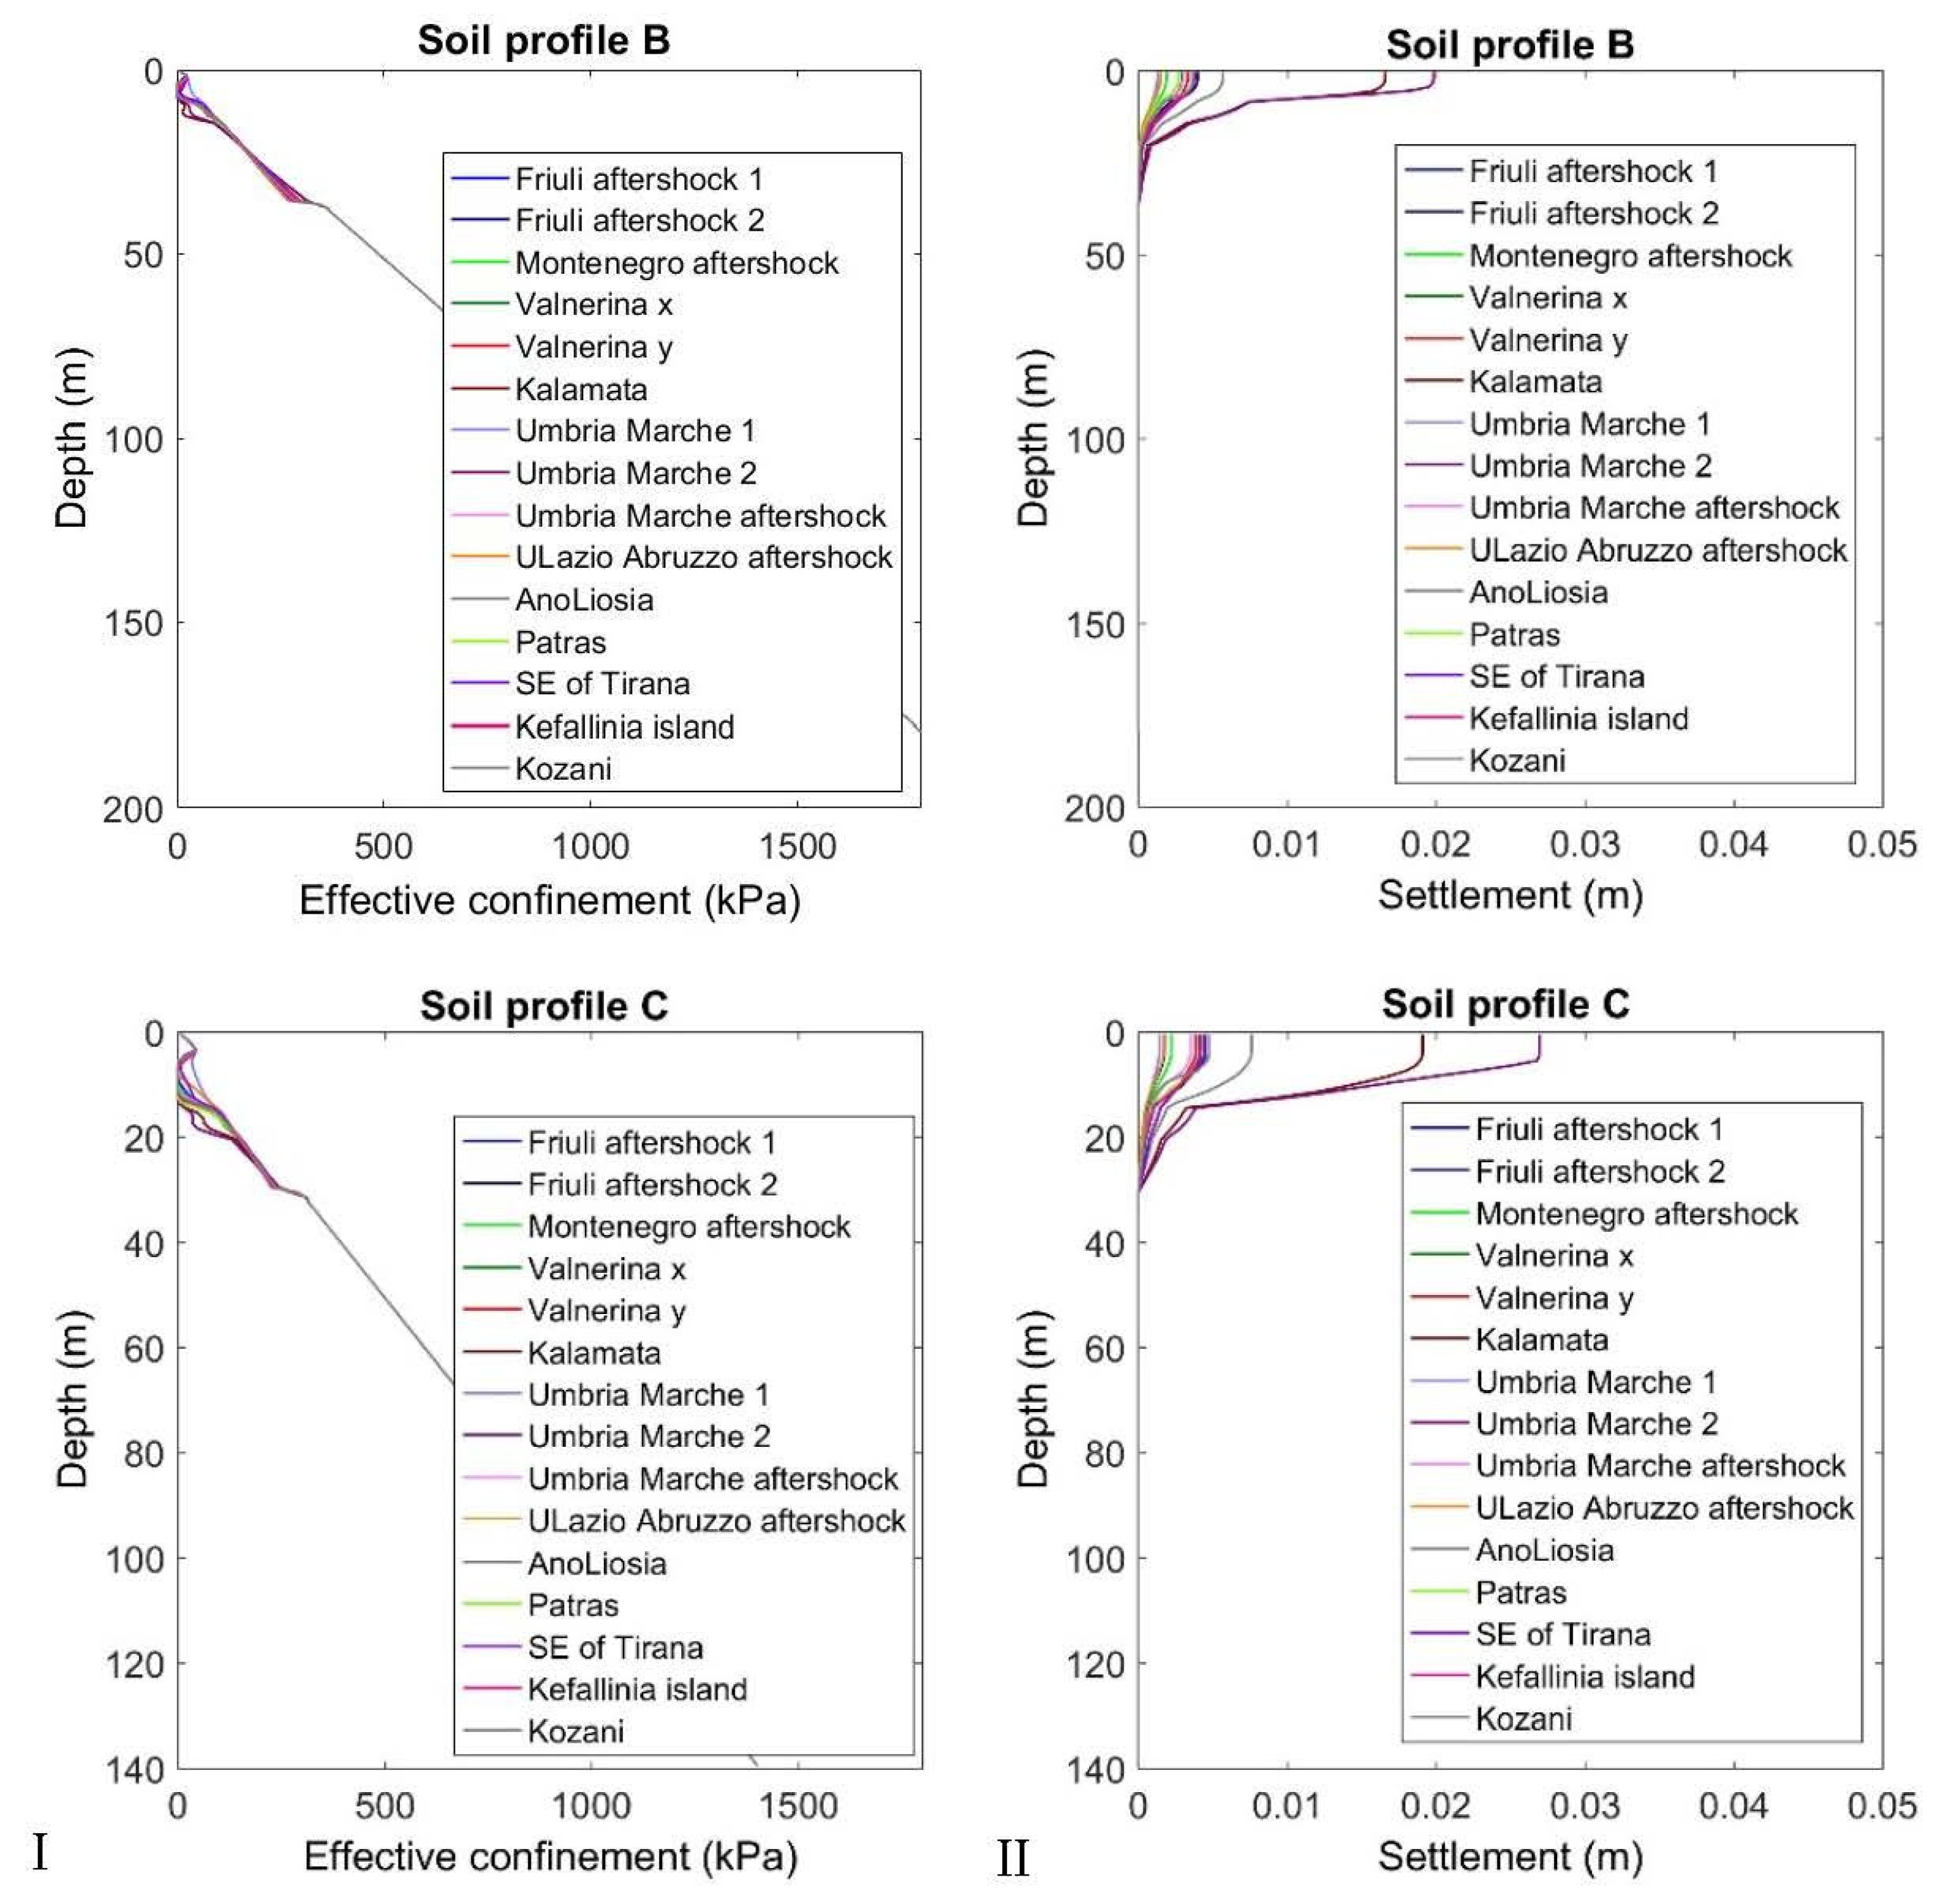
3.2. Soil Conditions

Thessaloniki Port subsoil conditions are characterized by soft alluvial deposits, locally susceptible to liquefaction. The thickness of the very soft loose and soft alluvial deposits may reach a few tens of meters, while the total depth to the assumed seismic bedrock (VS > 800.0 m/s) is found at about 170.0 m. In-situ geotechnical investigation (e.g., drillings, sampling, SPT, and CPT tests), laboratory tests, and measurements, as well as geophysical surveys (cross-hole, down-hole, array microtremor measurements) at the broader area of the port provide all the information needed to conduct any site-specific ground response analysis [15,16]. All available data are properly archived in a GIS format (Figure 3). Further details on the field geotechnical and geophysical surveys in the port of Thessaloniki can be found in Pitilakis et al. [12]. Several representative 1D soil profiles were also constructed [15,16] based on detailed 2D cross sections.

4. Seismic Hazard Assessment

The way the seismic hazard is modelled and assessed has a significant impact on the estimated seismic risk; it may introduce significant uncertainties. This important issue is beyond the scope and framework of the present work, which aims at testing and illustrating the proposed methodology through a specific case-study.

4.1. Probabilistic Seismic Hazard

Probabilistic Seismic Hazard Analyses (PSHA) may be performed with different available tools and methods. In this study, we applied OpenQuake [17] using the ESHM13 seismic hazard logic tree [18]. The main calculators used are the Logic Tree Processor, the Earthquake Rupture Forecast Calculator, and the Classical Probabilistic Seismic Hazard Analysis Calculator. The Logic Tree Processor (LTP) receives as an input the PSHA Input Model and produces a Seismic Source Model. LTP utilizes the information in the Initial Seismic Source Models and the Seismic Source Logic Tree to generate a Seismic Source Input Model. The latter feeds input information for the Earthquake Rupture Forecast (ERF), which creates a list of earthquake ruptures admitted by the source model, each one characterized by a probability of occurrence over a specified time span. Finally, the classical PSHA calculator uses ERF and the Ground Motion model to compute hazard curves on each site specified in the calculation settings. Traditional results, such as hazard curves and hazard maps for specific scenarios, can be obtained by postprocessing the set of computed ground-motion fields.
To estimate the hazard curve, different ground motion prediction equations (GMPEs) may be used. In our application, we adopted the ESHM13 ground motion logic tree for active shallow crustal regions, which used GMPEs by Akkar and Bommer [19], Cauzzi and Faccioli [20], Chiou and Youngs [21], and Zhao et al. [22]. Among these models, only Chiou and Youngs’ [21] GMPE directly adopts Vs,30 as an amplification parameter (and has the relatively low weighting factor in the logic tree of 0.20), while the other three GMPE models use broad Vs,30-based site classes. Akkar and Bommer [19] and Cauzzi and Faccioli [20] use the EC8 Vs,30 ranges, while Zhao et al.’s [22] GMPE adopts the NEHRP Vs,30 ranges. Generic, simplified, or site-specific Vs,30 values may be used in GMPEs. For the present application, rigorous Vs,30 values have been used, obtained from measured Vs profiles at the study area [15].
Figure 4 shows the computed mean, median, 15%, and 85% quantile seismic hazard curves for the seismic basement (VS > 800.0 m/s) and for the ground surface. To obtain an idea of the results of the PSHA analysis in the broader area for a specific mean return period, i.e., Tm = 475 years, in Figure 5, we present the spatial distribution of the peak ground acceleration (PGA) for rock conditions and at the ground surface in the whole area of Thessaloniki city for a 10% probability of exceedance in 50 years. At the port area, mean PGA at the ground surface varies from 0.34 g to 0.37 g, without considering the potential of liquefaction in the shallow layers. These values are much different, as we will see in Section 4.2, from the corresponding ones computed using the deterministic scenario-based approach, which, in this example application, is carried out when liquefaction effects are considered. The important differences highlight how significant it is to accurately evaluate seismic hazard when considering site-specific conditions.

4.2. Deterministic Scenario-Based Seismic Hazard

The previous PSHA analysis is conducted without considering the possibility of occurrence of induced phenomena associated with liquefaction. Such a hypothesis could be sufficient and acceptable in case estimates of liquefaction susceptibility and associated risk are rather low. When, however, liquefaction susceptibility and risk are high (e.g., for fine-grained soils that satisfy specific criteria summarized, among others, in Youd et al. [23]), then, according to this methodology, a deterministic approach would be more appropriate.
Based on these considerations, a scenario-based seismic hazard assessment is conducted to investigate the liquefaction effects on the seismic response and, finally, on the estimated performance loss of the port system. The site effect analysis is based on non-linear site response analyses, performed using a target spectrum for seismic bedrock conditions (Vs = 700.0–800.0 m/s) and a set of seismic records.
The target spectrum is defined based on the disaggregation of the probabilistic seismic hazard analysis [24], by which the most significant contribution to seismic hazard for the Thessaloniki port is associated with the Anthemountas normal fault system [25,26], regardless of the return period. For this specific fault system, the expected or most likely moment magnitude Mw and epicentral distance Repi to cause the exceedance of a specified PGA value corresponding to Tm = 475 years for the port area were estimated as 5.7 and 15 km, respectively [24]. In addition to magnitude and distance, the hazard scenario should include an error term ε that will be responsible for a sizable share of spectral ordinates. Thus, the median spectral values plus 0.5 standard deviations (σ) were adopted, which are in agreement with the earthquake scenarios selected in Akkar et al. [27] to generically represent the moderate seismicity regions in Europe (median + 0.5σ for a Mw 6 event). Figure 6a shows the spectral ordinates of the 5% damped Akkar and Bommer [19] target spectrum (including the corresponding ε term) in comparison with the uniform hazard spectra found in the literature.
A suite of 15 seismic records was selected from the European Strong-Motion Database (Table 1) using, as a target spectrum, the 5% damped median plus 0.5σ spectrum of Akkar and Bommer [19]. They all refer to ground types A and B according to EC8 (rock type or stiff soils) with Mw ranging between 5.5 and 6.5 and epicentral distances R between 0 and 45 km. The main selection criterion is for the mean acceleration spectra of the set to approach the corresponding target spectrum so as to minimize “epsilon” [30] at the period range between 0.00 and 2.00 s [31]. Figure 6b depicts the mean elastic response spectrum of the records in comparison with the corresponding median plus 0.5 standard deviations of Akkar and Bommer’s [19] spectrum. As shown in the figure, a good match between the two spectra is achieved.
Three typical soil profiles denoted as a, b, and c (Figure 7) are selected to perform the effective stress nonlinear site response analyses. Profile A is located close to the site of the down-hole test CH-1 (data provided by the Institute of Engineering Seismology and Earthquake Engineering, ITSAK) and to the existing 1D cross section CS-4, where in situ and laboratory geotechnical surveys are available. Profiles B and C are located close to the existing 1D cross sections CS-7 and CS-1, respectively. Profiles A, B, and C are also close to the sites where the new array measurements of microtremors M-2, M-1, and M-3 have been conducted, respectively. Figure 7 presents the initial Vs profiles derived from both down-hole tests and array microtremor measurements. The fundamental periods To of the selected representative soil profiles were theoretically estimated as equal to 1.58 s, 1.60 s, and 1.24 s for profiles A, B, and C, respectively. In the case of no liquefaction susceptibility, the three soil profiles refer to ground type C according to the EC8 classification with an average depth varying from 140.0 m (soil profile C) to 180.0 m (soil profile B). Knowing, however, that the liquefaction susceptibility in the port area is rather high, they could also be classified as ground type S according to EC8. However, in this latter case, EC8 does not provide design response spectra, suggesting site specific analysis.
Detailed one-dimensional (1D), non-linear (NL) ground response analyses under effective stresses were performed for the selected seismic scenario using the Cyclic1D code [32]. The formulation implemented in Cyclic1D is based on a fully coupled solid-fluid approach [33]. The employed liquefaction model [34,35] was developed within the framework of multi-yield-surface plasticity [36]. Based on the preliminary evaluation of the liquefaction potential according to the guidelines of Robertson and Wride [37], Seed et al. [38], NCEER 97 [39], and EC8 [40], and by engineering judgement, soil formations susceptible to liquefaction were considered at depths z = −2 ÷ 11 m, z = −15 ÷ 20 m, and z = −27 ÷ 36 m for soil profile A, at depths z = −3 ÷ 14 m for soil profile B, and at depths z = −5 ÷ 20 m for soil profile C. Grained soils (sands, gravels, non-plastic silts) not susceptible to significant pore pressure build-up are modeled using an elastic-plastic material in which a confinement-dependent shear response is adopted. For clay/rock materials, an elastic-plastic material model is used that is independent of confinement variation.
The variability in the shear wave velocity (Vs) profile was assessed considering upper and lower-range models with appropriate logarithmic standard deviations. Three runs were conducted for each soil profile and seismic record considering the basic-case model and the basic-case ±one logarithmic standard deviation models.
Representative results are presented in Figure 8 and Figure 9 for the three soil profiles, each one considering the basic-case and the basic-case ± one logarithmic standard deviation Vs models. Figure 8 shows graphs of the median ± one standard deviation variation in PGA with depth while Figure 9 depicts typical results of the non-linear analysis for all soil profiles.
As was expected, liquefaction is evident in all soil profiles. Due to the liquefaction effects, calculated PGA values at the ground surface are modestly amplified compared to the corresponding computed ground motion at the bedrock basement. In return, we observe the presence of permanent vertical displacements (settlements) and lateral deformations. As shown in Figure 8, estimates for median PGA values at the ground surface are 0.141 g, 0.169 g, and 0.149 g for soil profiles A, B, and C, respectively.
According to Figure 9—I, among the three soil profiles, liquefaction effects in terms of permanent ground displacements at the ground surface are shown to be more pronounced in profile A; however, these effects are generally low (<5.0 cm) for the specific deterministic seismic scenario used in this example application (Mw = 5.7 at R = 15 km). A considerable variability in the estimated permanent displacements is observed for the different seismic records (see Figure 9—II). Low-frequency input motions are generally associated with the increased accumulation of lateral deformations and settlements. The computed maximum horizontal displacement (resulting from lateral spreading) considering the basic geotechnical models is 4.5 cm, whereas the corresponding value for the maximum vertical displacements (settlements resulting from reconsolidation of the liquefied or partially liquefied soil) is 4.8 cm.

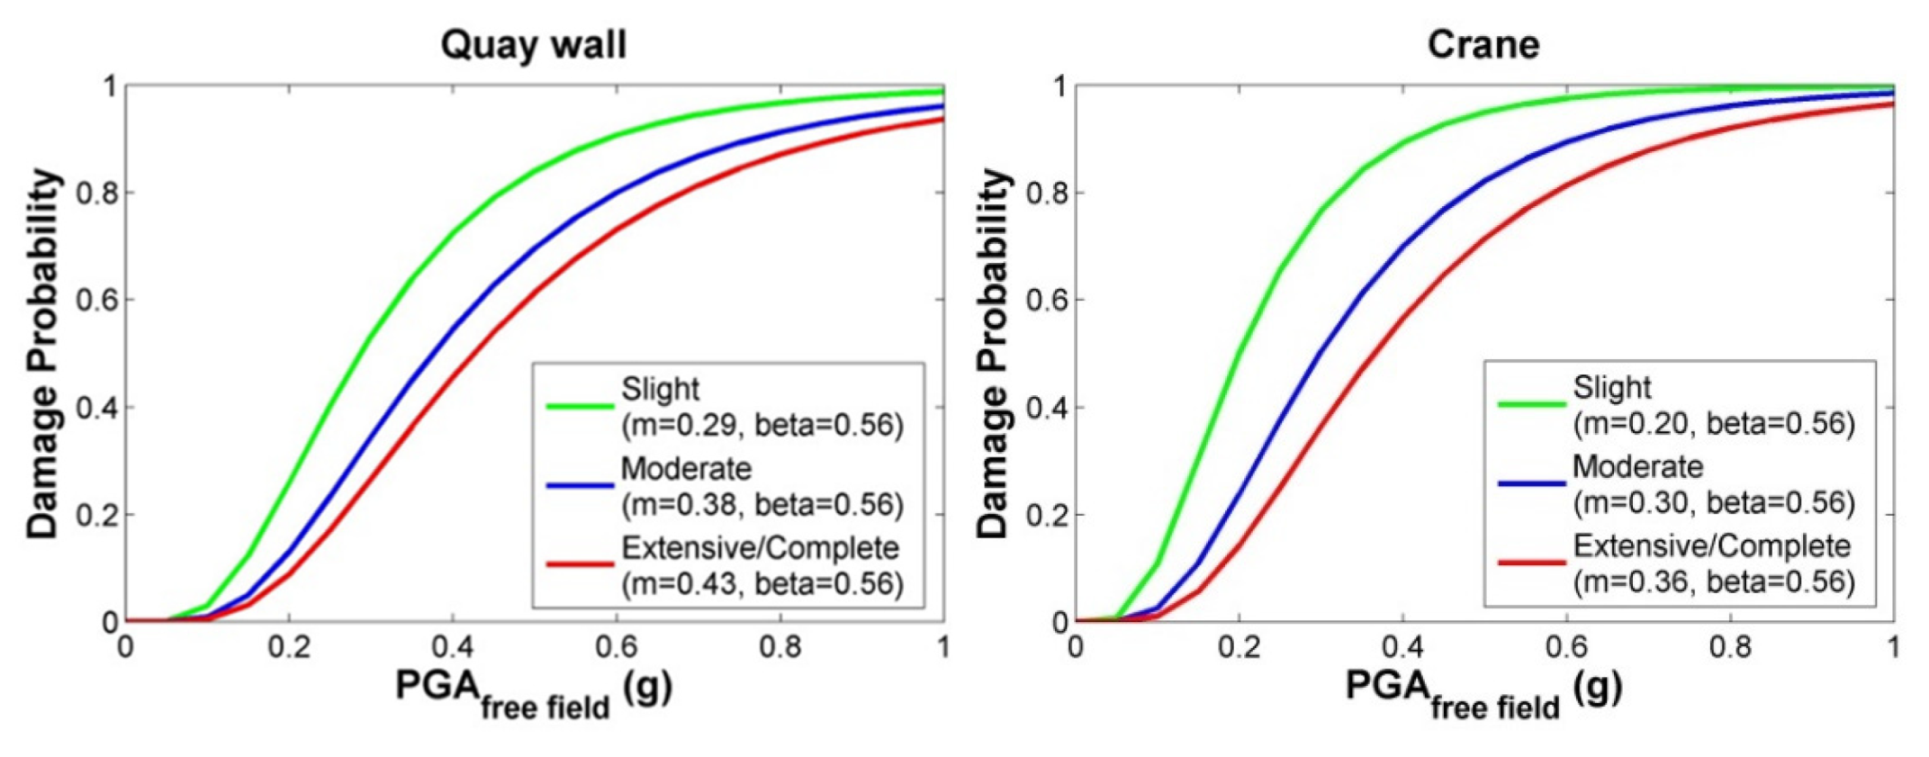
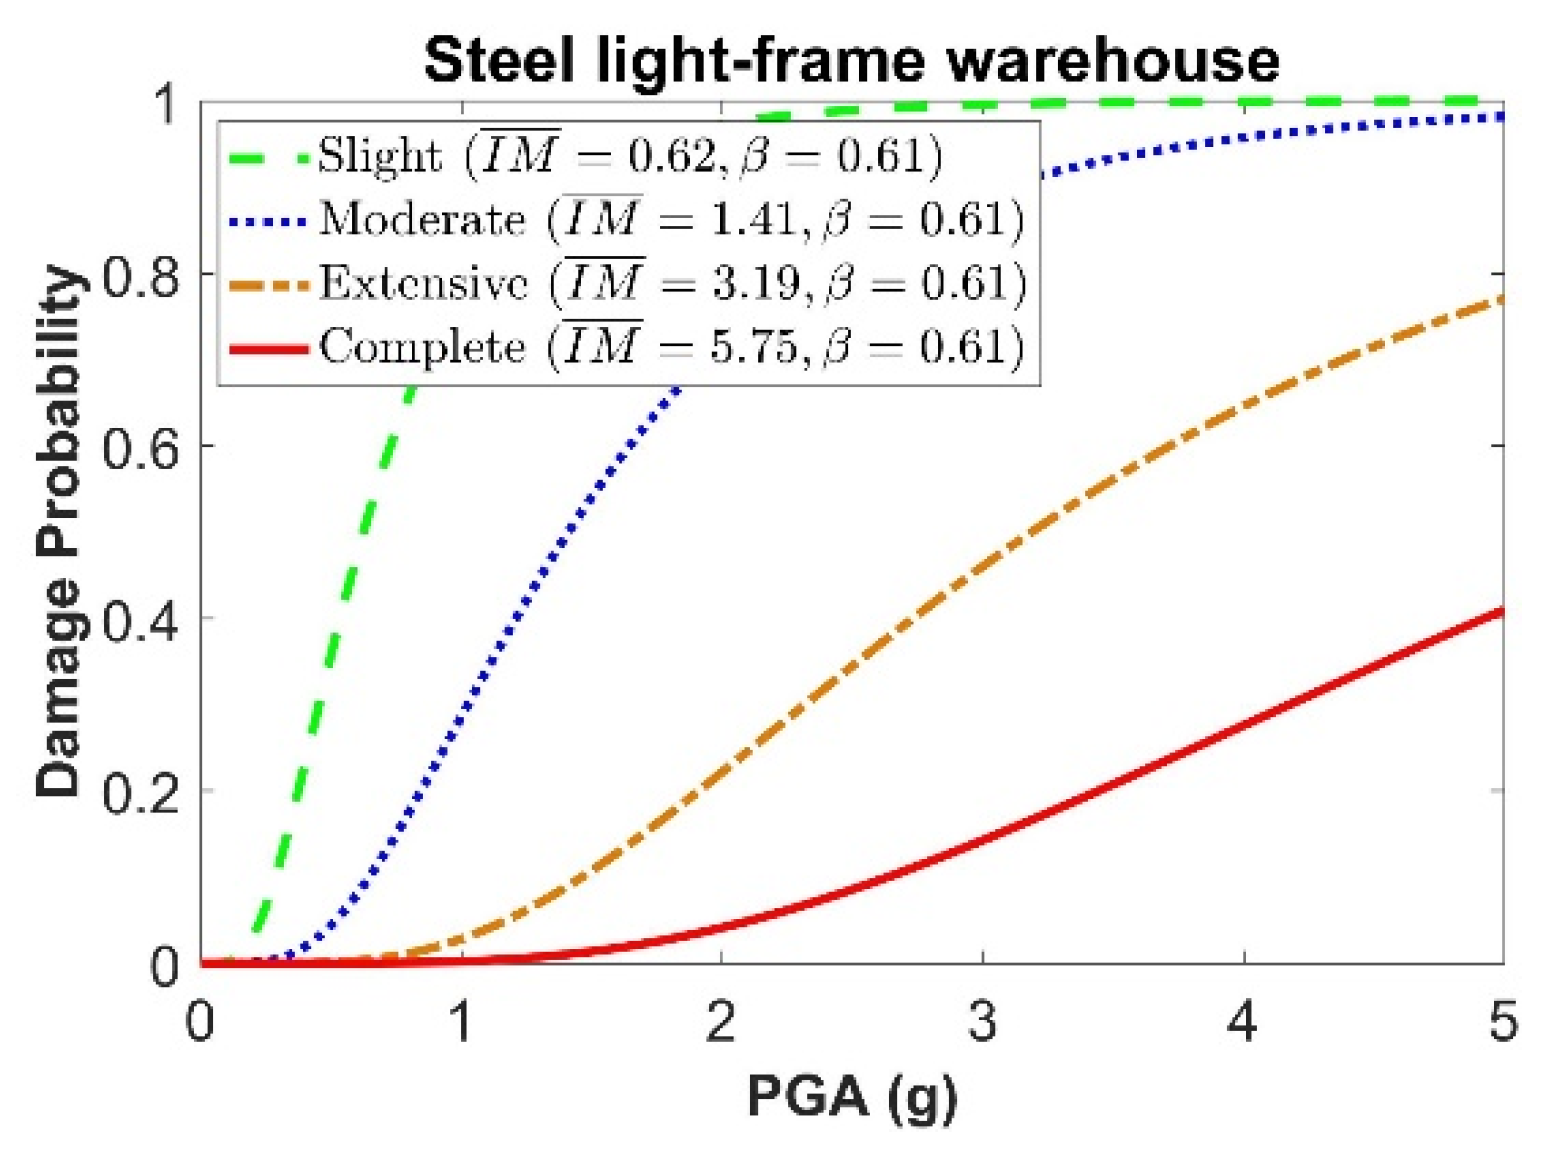
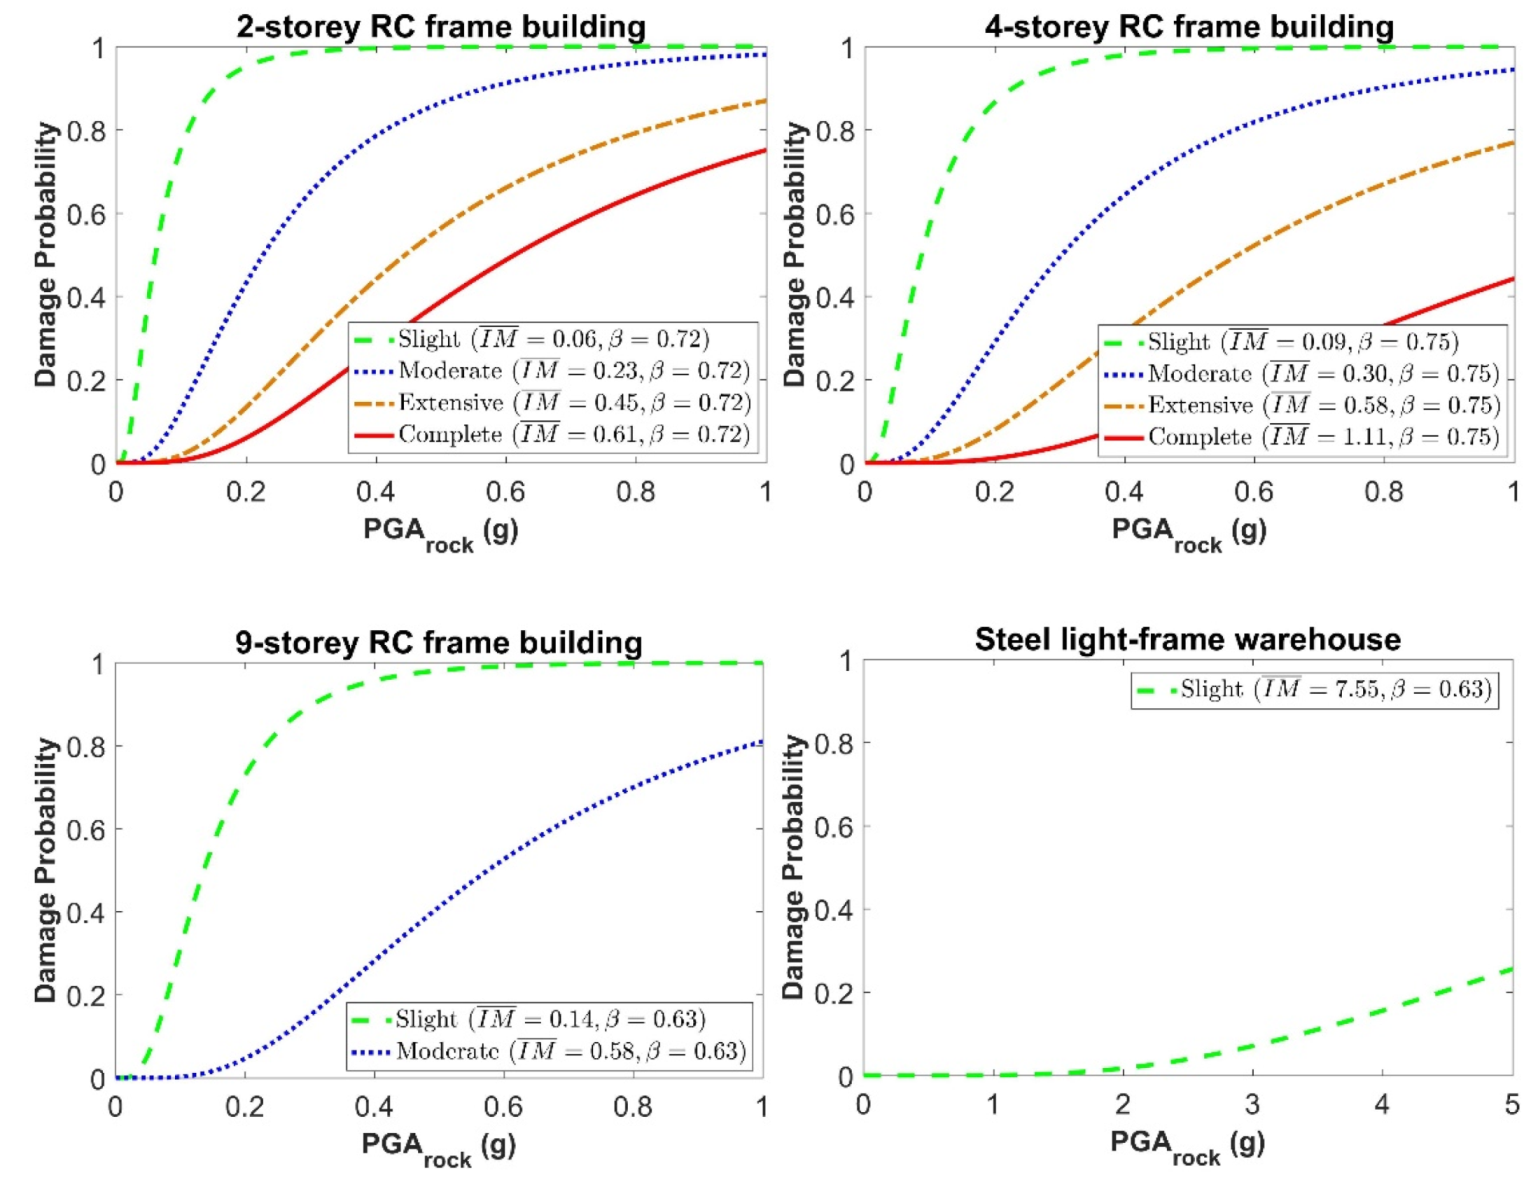
5. Fragility Models for Port Structures

The vulnerability of the different port facilities at the component level is evaluated using fragility functions, which describe the probability of exceeding predetermined damage states (DS) for given levels of seismic intensity. In the literature, there are several empirical, analytical, or hybrid sets of fragility curves for different typologies of buildings and port facilities. For instance, a comprehensive collection of fragility curves for various typologies of port buildings and infrastructures is presented in HAZUS [41] and SYNER-G [42].
For the probabilistic assessment approach, fragility curves solely due to ground shaking are selected for all port components. Regarding the fragility functions for the gravity quay walls, cranes, and electric power substations considered in this application example, the fragility curves found in the literature are used to assess the damages due to ground shaking which are either case specific [43] or generic [41]. Specifically, as regards the electric power distribution, substations generic fragility functions due to ground shaking based on the HAZUS model [41] are used. For the typical gravity quay walls and the gantry cranes of the port subjected to ground shaking, we use seismic fragility curves that have been developed based on nonlinear dynamic analyses in collaboration with the National Technical University of Athens in the framework of another research project [43]. Figure 10 shows the fragility curves and their parameters (i.e., median m and log-standard deviation beta) for the quay walls and the cranes.
As far as the critical port buildings are concerned, Kappos et al. [44,45] and Karafagka et al.’s [46] fragility curves due to ground shaking are considered for the RC frame buildings and the steel light-frame warehouse, respectively. Figure 11 depicts Karafagka et al.’s [46] fragility curves and their parameters for the steel-light frame warehouse subjected to ground shaking derived from nonlinear incremental dynamic analyses of a specific representative warehouse typology.
For the deterministic scenario-based approach, fragility functions that consider the damages due to ground shaking and liquefaction are utilized. New seismic fragility curves have been developed in the framework of the RESPORTS project (https://www.resports.gr/, accessed on 1 January 2019, [46,47]) for typical low-code RC frame buildings, steel light-frame warehouses, and gravity quay walls. These curves take into account the combined effects of ground shaking and liquefaction, applying nonlinear incremental dynamic analyses, and were derived for different damage limit states through the statistical correlation of calculated damage indicators with appropriate intensity parameters. Figure 12 presents the derived sets of fragility curves for the critical port buildings considered in this application example generated for liquefiable soils, with Vs,30 values varying between 208.0 m/s and 242.0 m/s as a function of peak ground acceleration (PGArock) at rock outcropping conditions. In addition, Figure 13 depicts the fragility curves in terms of PGAsurf due to the combined effects of ground shaking and soil liquefaction, developed for the typical port gravity wall configuration of a 10.0 m height and 6.0 m base width corresponding to a base width/height (W/H) ratio of 0.6.
Regarding the fragility functions for cranes and electric power substations adopted in this specific application, different fragility functions that separately consider damage due to ground shaking and liquefaction are taken into account. This is because, to the best of our knowledge, there are no available fragility curves in the scientific literature for these specific port elements, which consider the combined damages due to ground shaking and liquefaction. Specifically, regarding the fragility curves due to ground shaking for cranes and electric power substations, the ones used previously for the probabilistic approach are utilized, while, to account for the damages due to liquefaction, HAZUS generic fragility functions [41] are used. The combined damages due to ground shaking and liquefaction for cranes and electric power substations are obtained in a further stage by combining damage states probabilities due to ground shaking and liquefaction [41,48].
For both probabilistic and scenario-based approaches, following Kappos et al. [45] for the RC buildings and NIBS [41] for the steel warehouses, quay walls, cranes, and electric power substations, the central value of the damage index at each damage limit state is presented in Table 2. A vulnerability curve is then constructed to provide a unique damage index for each level of seismic intensity. Figure 14 presents the developed vulnerability curves for the combined damages due to ground shaking and liquefaction used for the scenario-based approach given as a function of PGArock for the considered critical buildings of the Thessaloniki port, and as a function of PGAsurf for the considered quay wall configuration with a W/H ratio of 0.6.
Since the cost of the structural system of a building is less than the cost of a (new) building that also includes non-structural members, the estimated damage indices are then multiplied with an empirical reductive coefficient to obtain the final global damage or Loss Index (LI). For instance, according to Kappos et al. [45], for low, mid, and high-rise residential RC MRF buildings, this coefficient varies from 0.33 to 0.38 while, for steel warehouses, this reductive coefficient is taken to be equal to 0.5 [41]. For the remaining components, namely the quay walls, cranes, and the electric power substations, this coefficient is taken to be equal to 1.0.

6. Seismic Risk Assessment

Following the general flowchart in Figure 1, seismic risk assessment is performed separately for the probabilistic and deterministic approaches.

6.1. Probabilistic Approach

6.1.1. Component Level Assessment

The process of estimating the annual probability of collapse and of producing loss exceedance curves due to ground shaking for each individual port component is as follows:
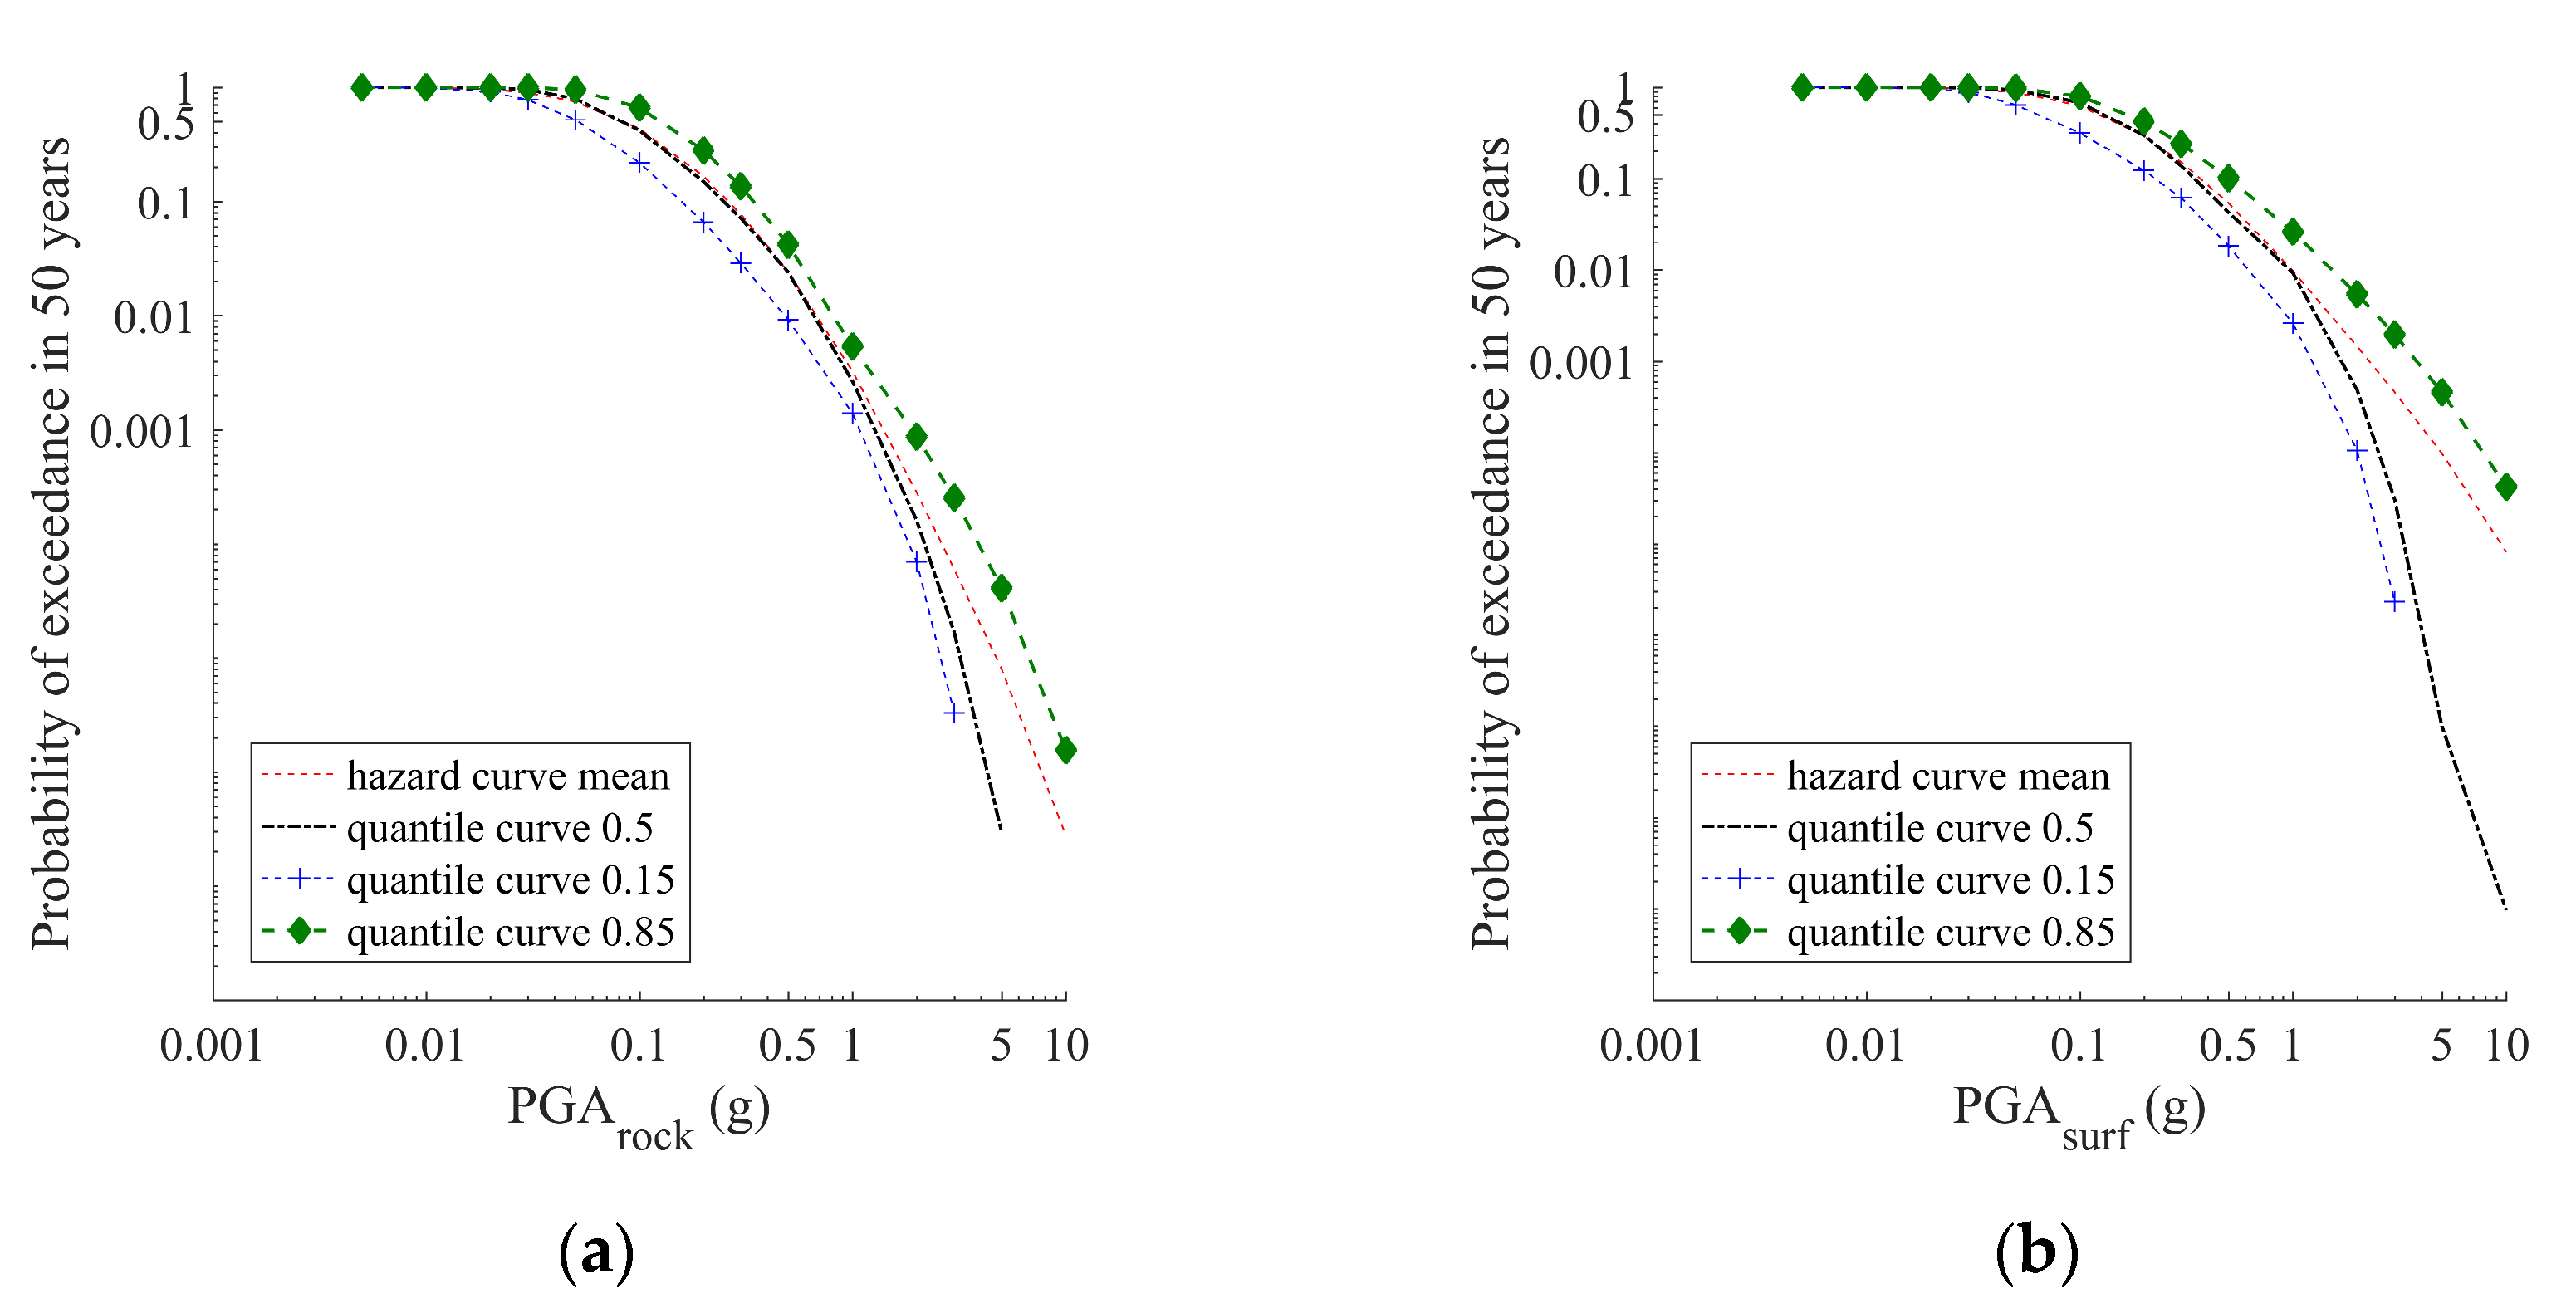
  • Mean, median, 15%, and 85% quantile seismic hazard curves are estimated for each location across the port area. Hazard curves at the ground surface, also considering site effects, are assumed to be consistent with the corresponding fragility/vulnerability curves that use PGA at the surface as an intensity measure (IM);
  • The computed seismic hazard curves (Figure 5b) are converted from probability of exceedance (PoEPGA) of PGA in 50 years (T) into annual rate of exceedance (λPGA) of PGA (Equation 3):
    λ PGA = ln ( 1 PoE PGA ) T
  • The annual probability of occurrence of intensity level PGAi, P [PGAi], can be computed from the discrete points on the seismic hazard curve for the selected intensity measure (IM), i.e., PGA at ground surface. Assuming that the event under consideration is rare, the annual frequency is approximately equal to the annual probability of exceedance. The annual probability that the intensity level will fall within a bin of IM centered around IMi (i.e., P [IMi]) can be approximated from seismic hazard values using the following simplified expression [49]:
    P   [ IM i ] = λ ι 1 2 λ ι + 1 2 = λ i + λ i 1 2 λ i + λ i + 1 2 = λ i 1 λ i + 1 2
    where λi−1, λi, and λi+1 are adjacent hazard values centered around the intensity level PGAi. Provided that the bin size of IM is sufficiently small, the estimated probabilities of the IM using Equation 4 will approach the exact values;
  • The probability of collapse conditioned on the central PGA value of each bin P ( C | PGA i )   is obtained from the complete damage state of the fragility functions presented in Section 5 for the port buildings and infrastructures under consideration [41,43,44,45,46,47];
  • The probability of collapse conditioned on the central PGA value of each bin P ( C | PGA i )   is then multiplied by the associated probability of occurrence for PGA values belonging to that bin, thus resulting in a distribution of probability of collapse for a set of ground motion intensities. By numerically integrating this distribution, the annual collapse probability (λc) is computed using the following expression:
    λ c = i = 1 m P ( C | PGA i ) . P [ PGA i ]
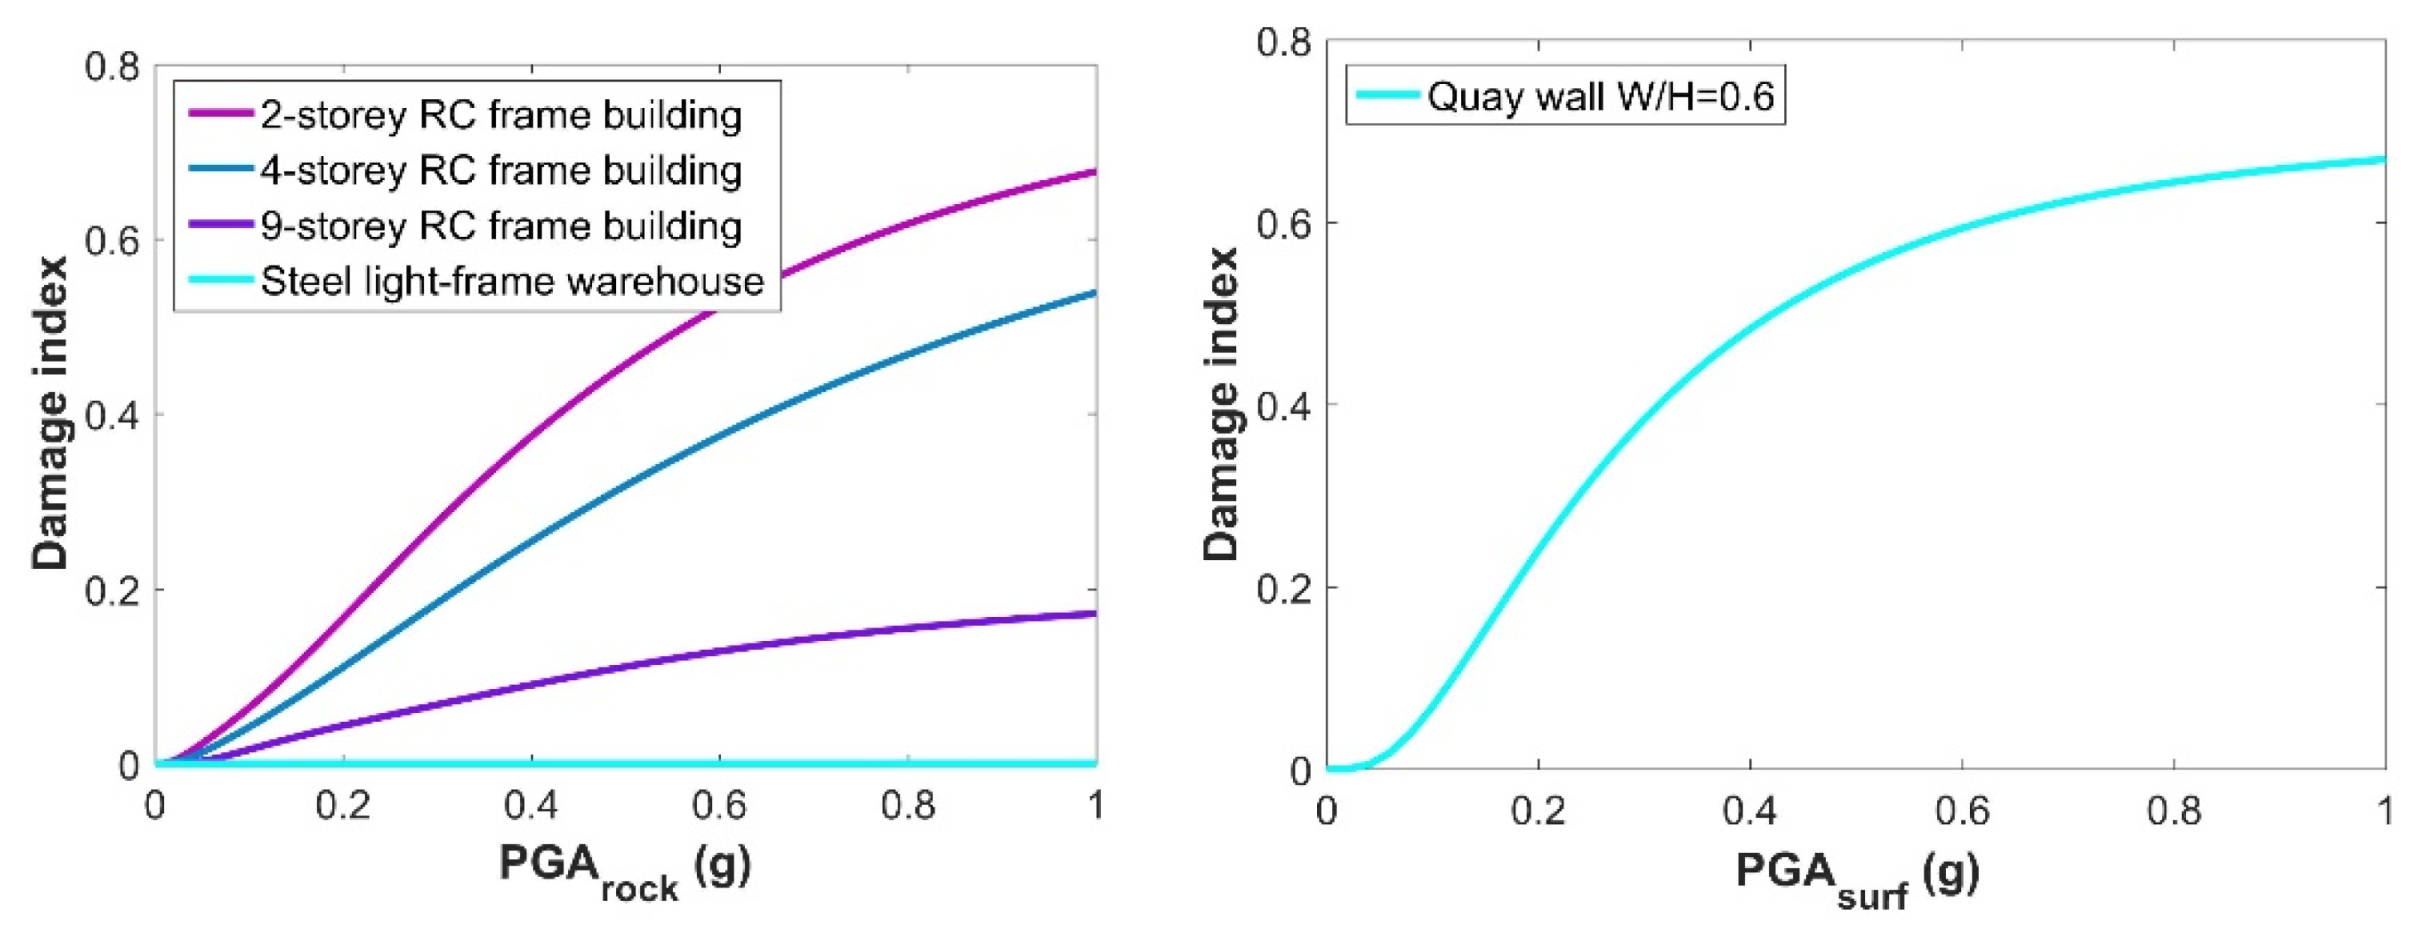
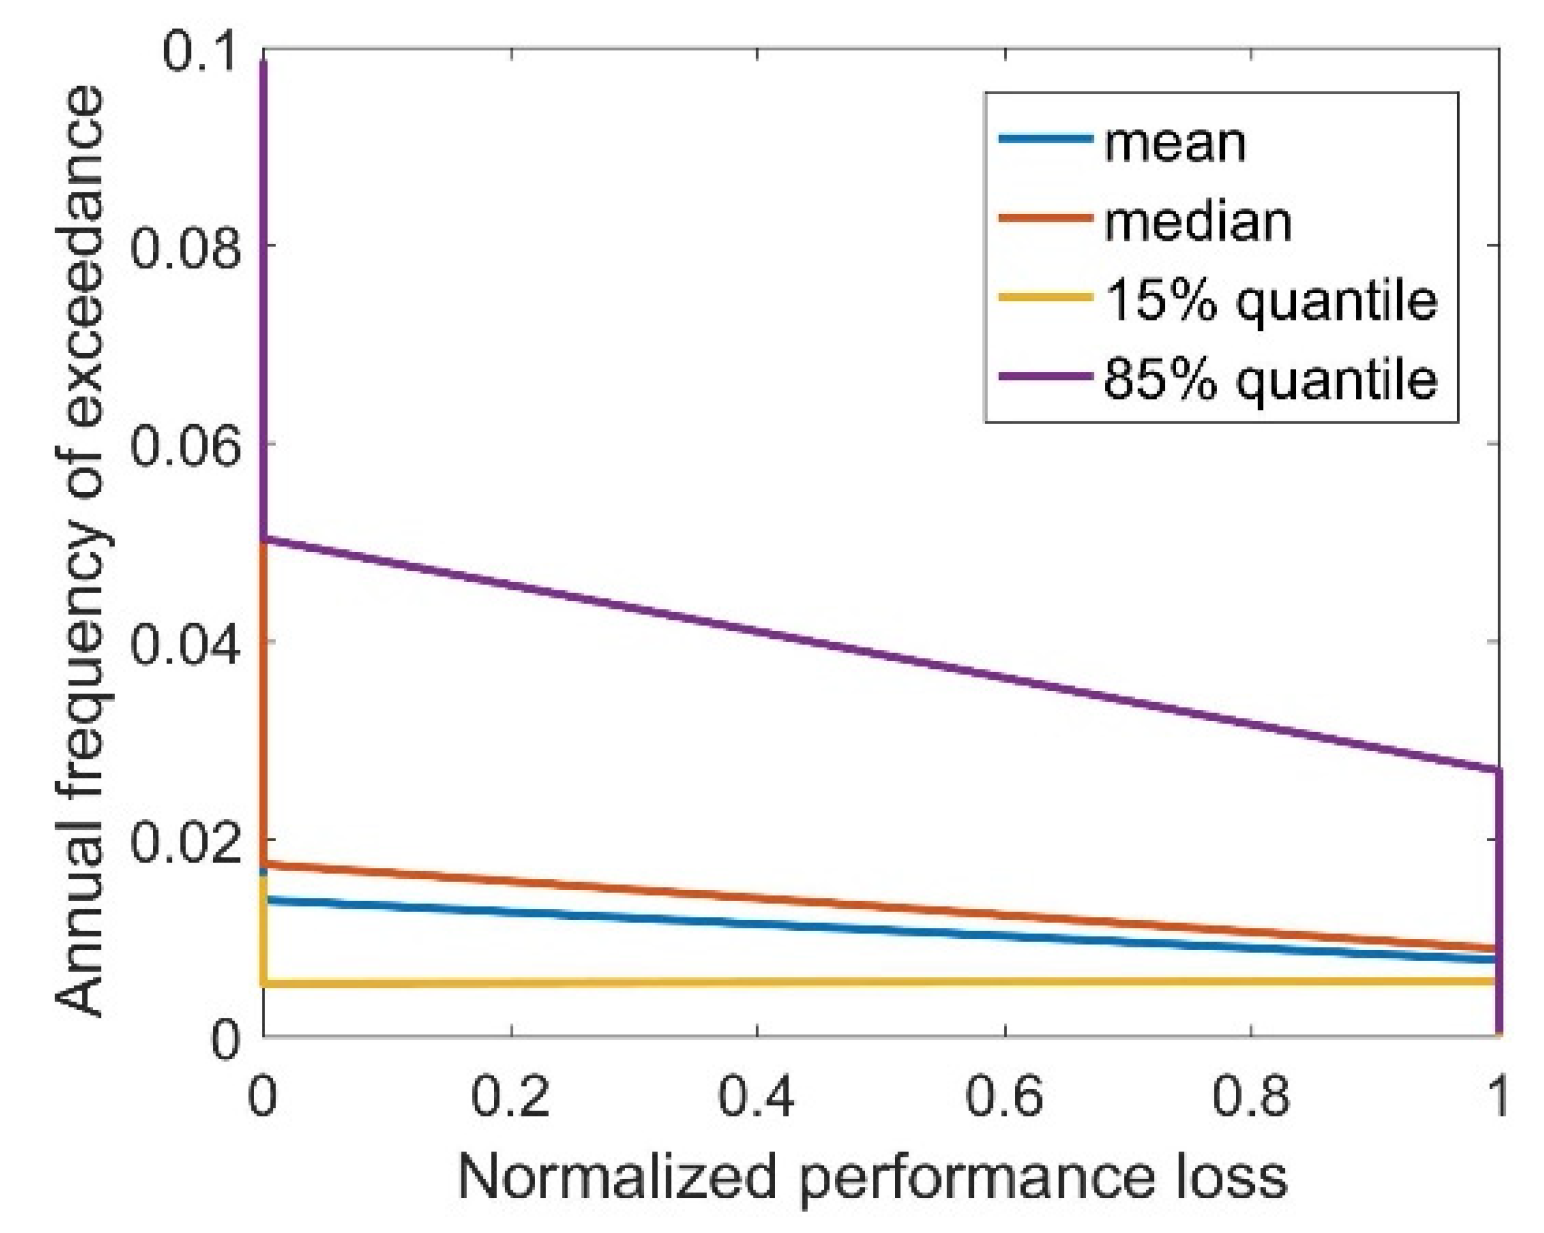
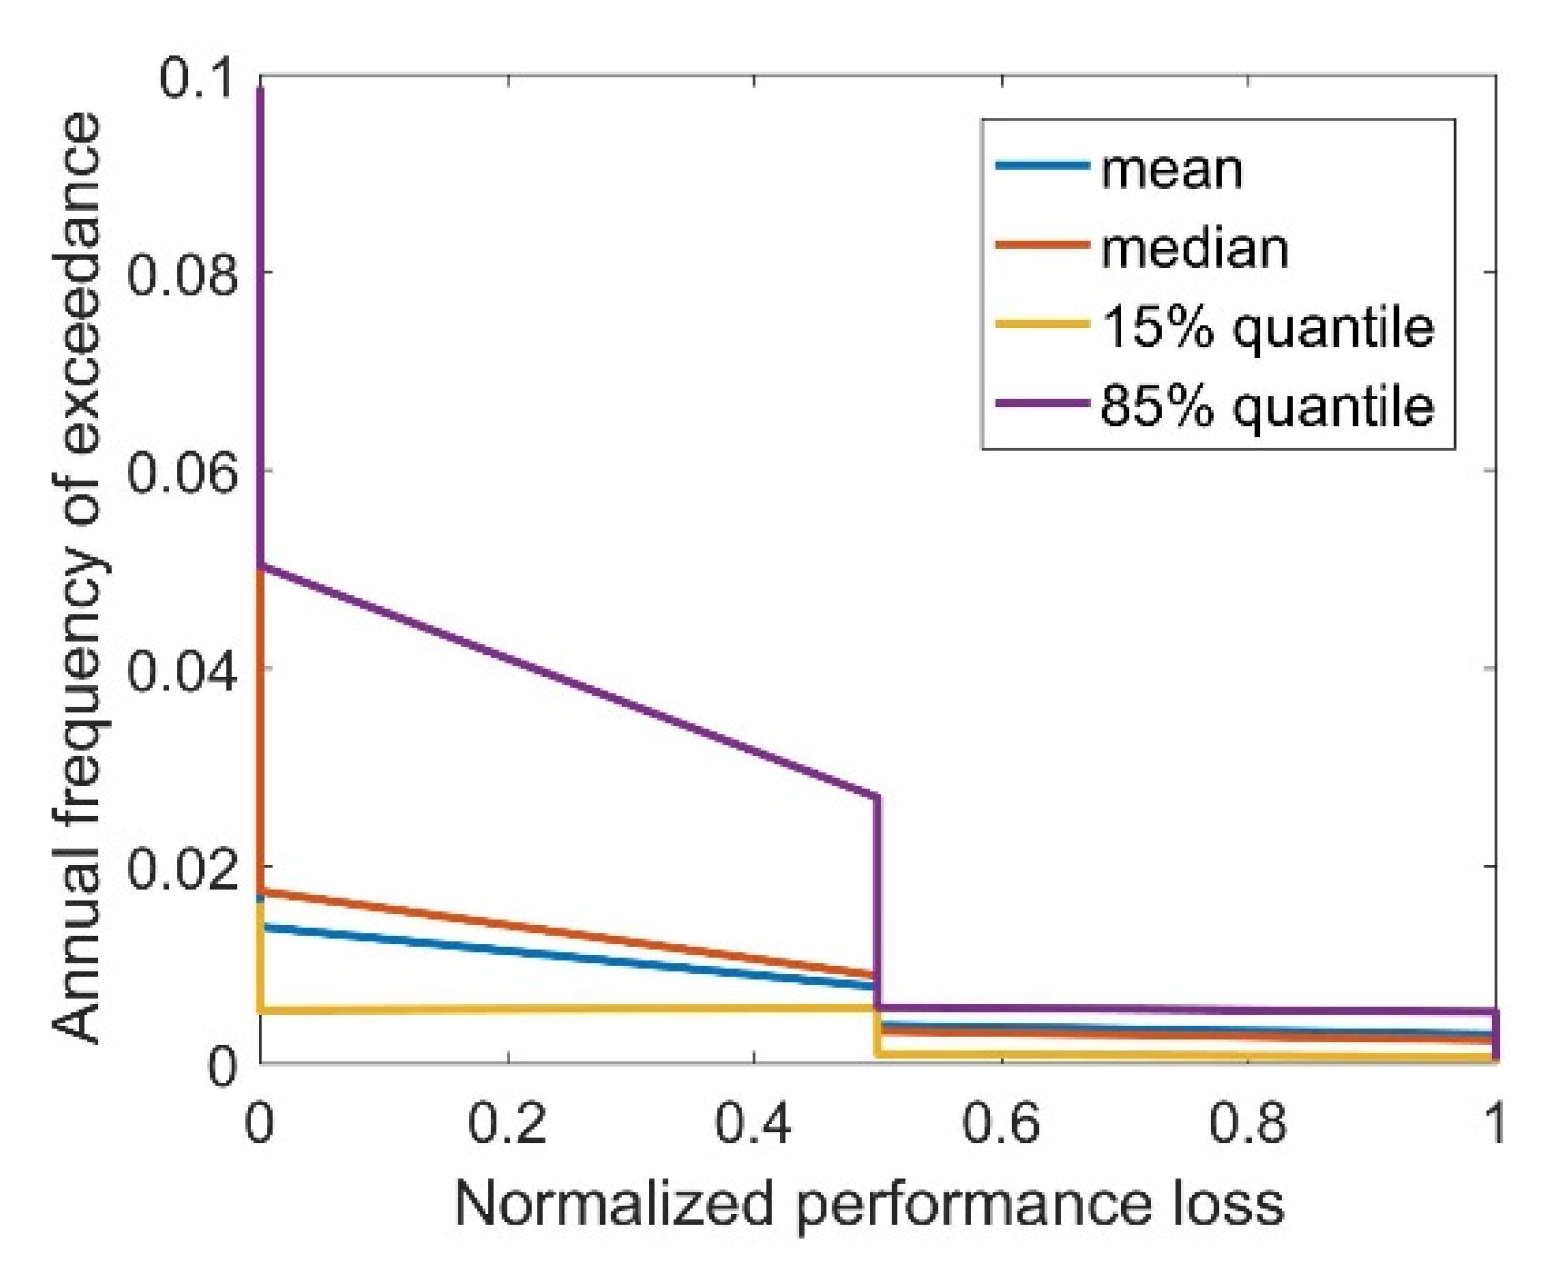
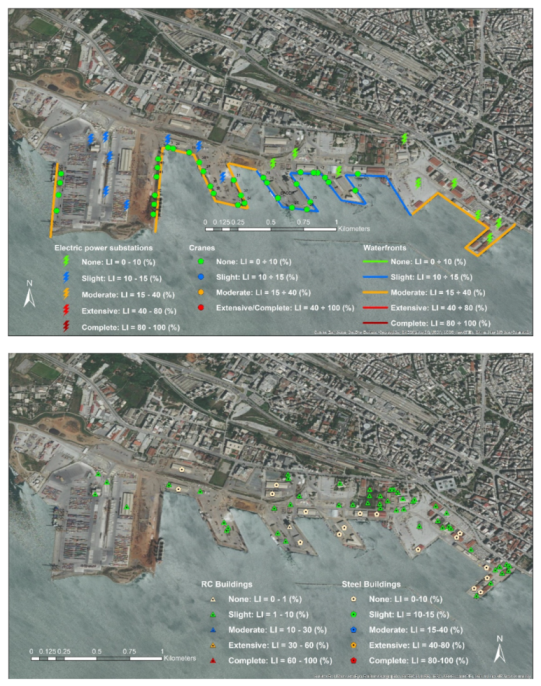
  • The annual probability (or frequency) of exceedance of different loss index (LI) levels conditioned on the PGAi is computed as follows:
    λ LI = i = 1 m P [ LI > LI j | PGA i ]   P [ PGA i ]
    where the term P [ LI > LI j | PGA i ] , integrated over all bins for PGAi, is obtained from the given loss index curves derived by multiplying the corresponding damage index (see, for example, Figure 14) with an empirically derived reductive coefficient. For each specific level of LI, different median PGA and beta values are assigned for the given set of PGA intensities. By numerically integrating this distribution for all considered PGA intensities, the annual probability of exceeding the given loss level is computed;
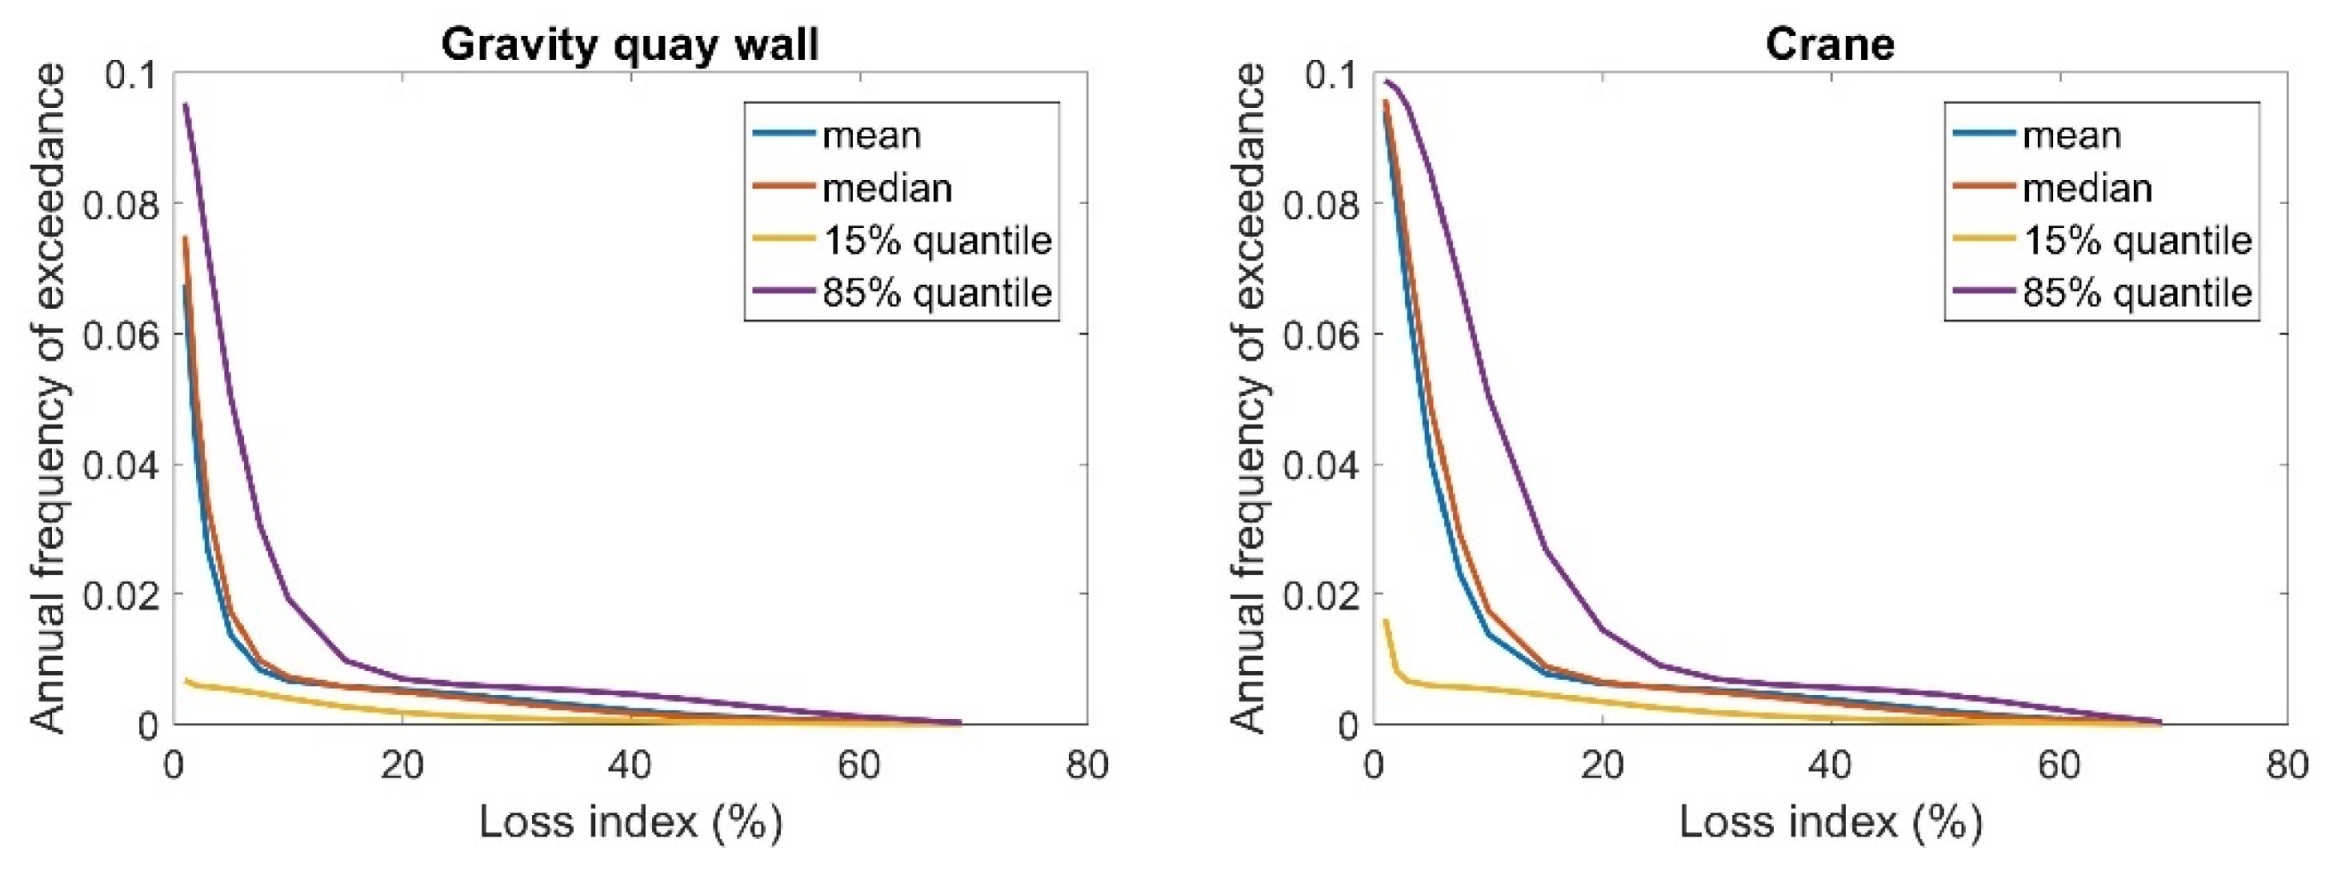
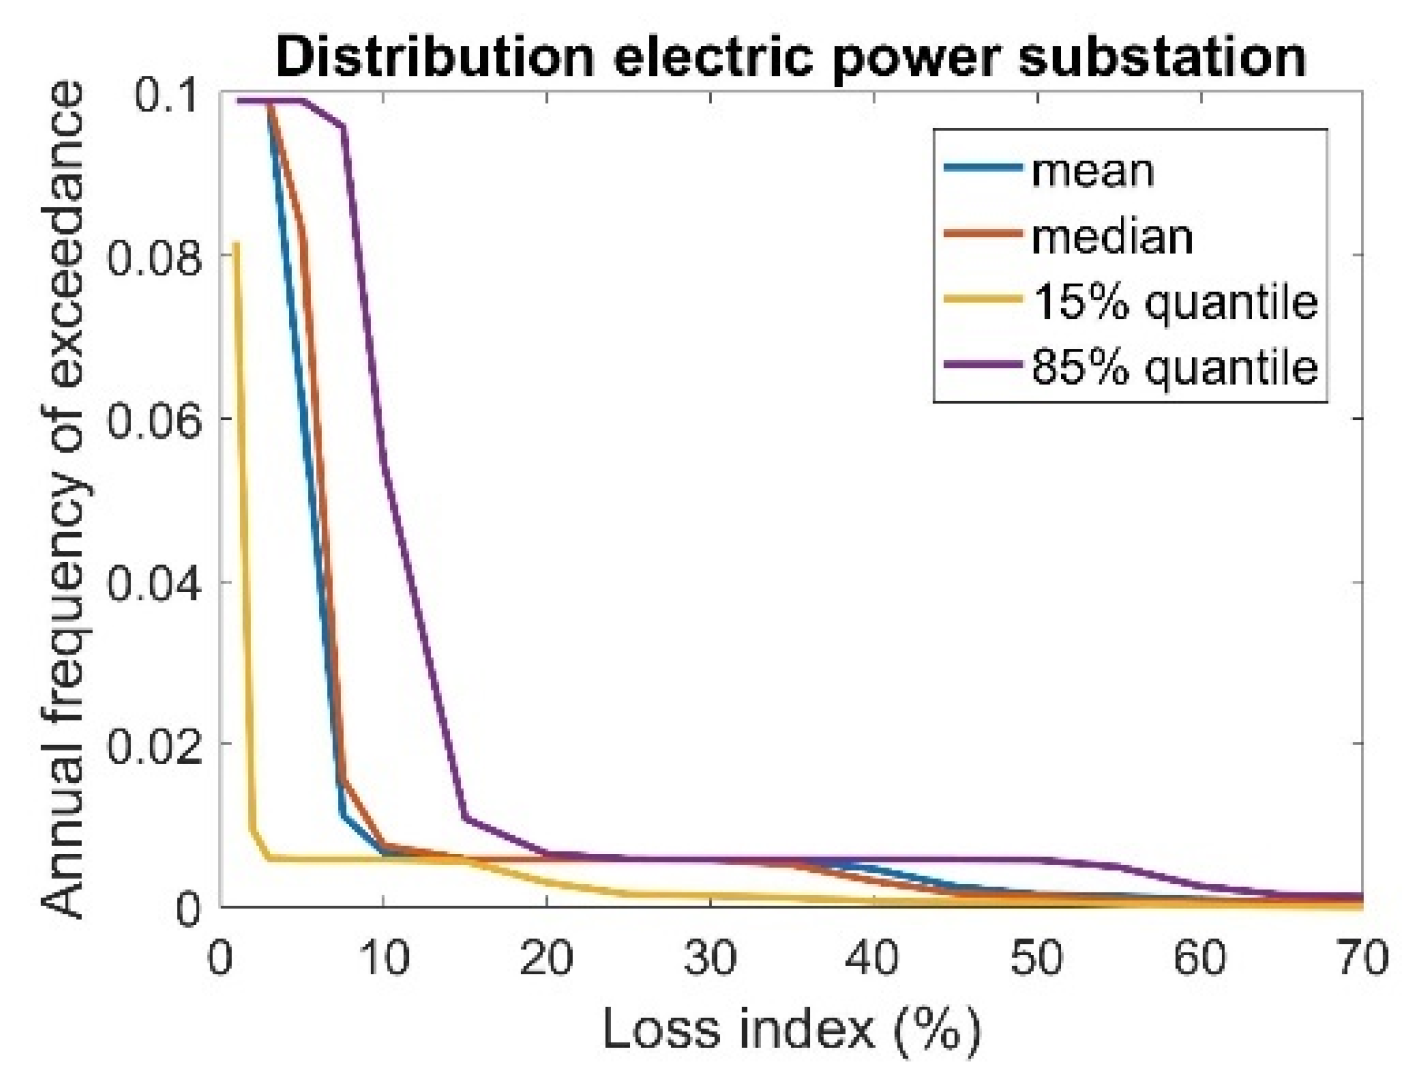
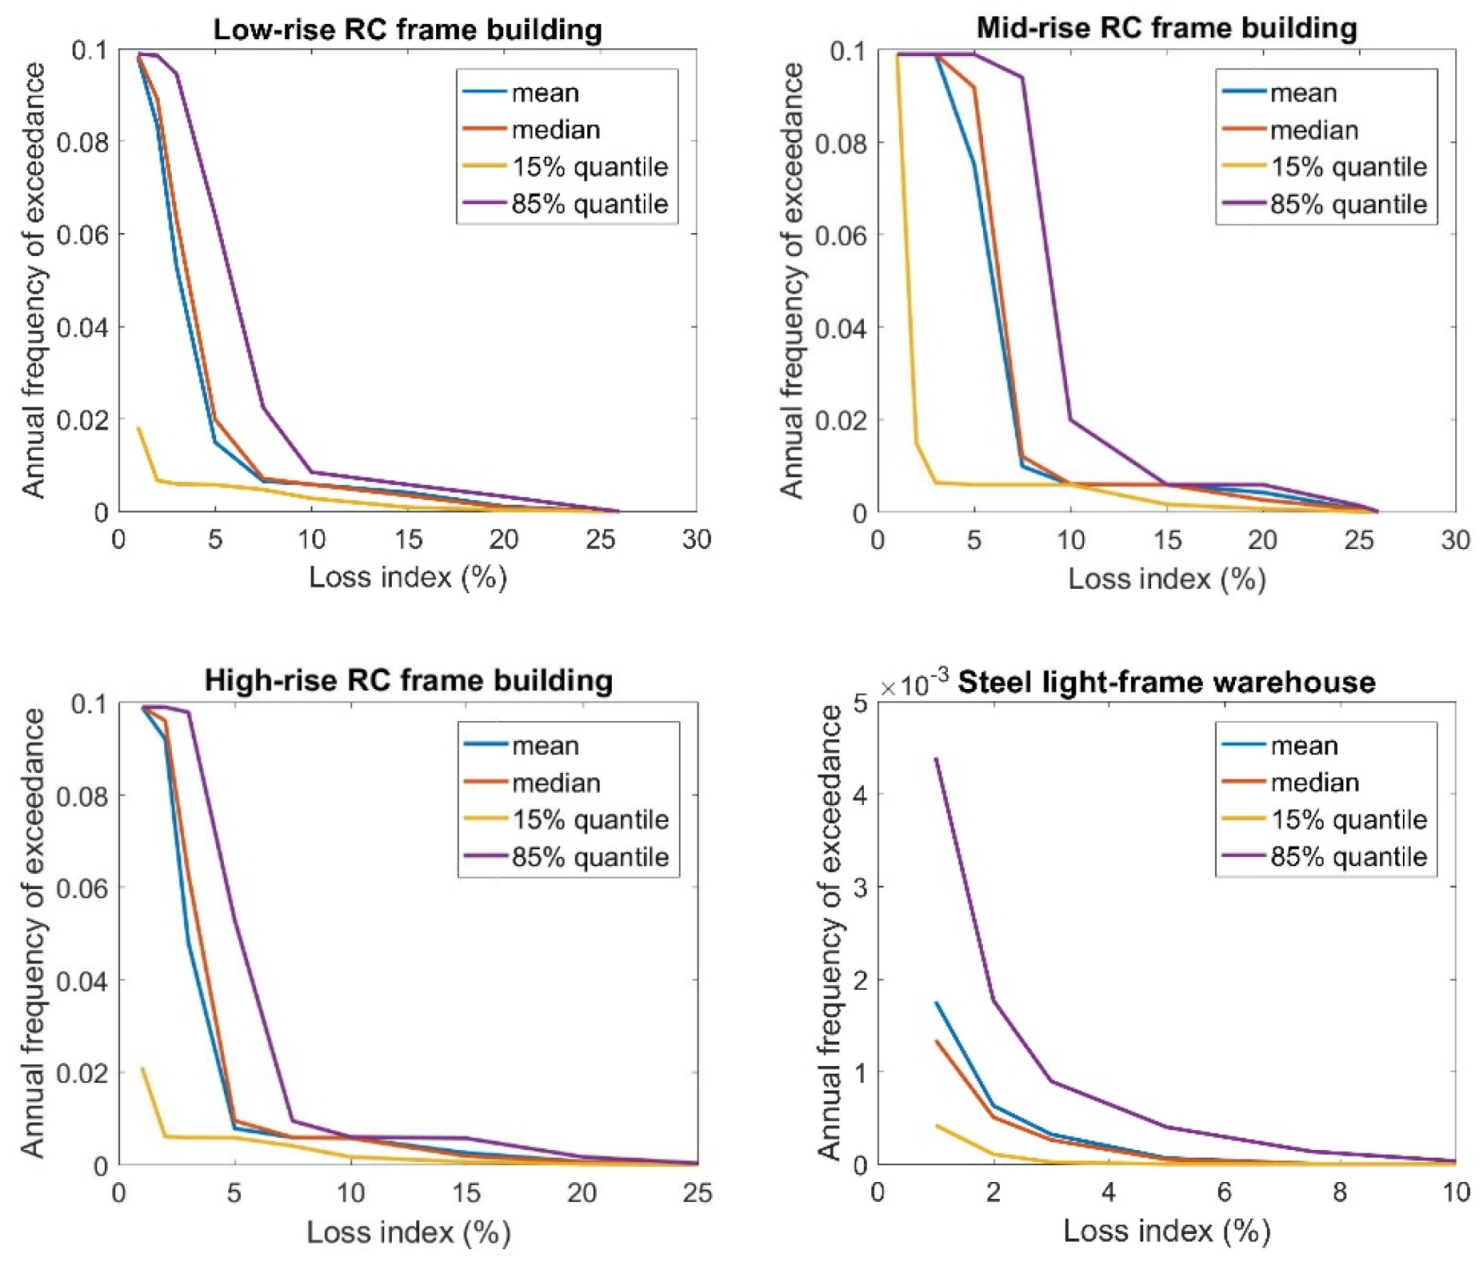
  • Mean, median, 15%, and 85% quantile loss exceedance curves are finally obtained for different levels of LI (%) for each port structure.
Table 3 presents the mean, median, 15%, and 85% quantile annual collapse probability (PC) for the gravity quay walls, cranes, and electric power substations due to ground shaking; Table 4 shows the corresponding annual collapse probabilities for the RC frame building typologies and the steel warehouse. As shown in Table 3, the cranes experience higher probabilities of collapse followed by the gravity quay walls and the electric power substations. According to Table 4, the annual collapse probabilities due to ground shaking are higher for the mid-rise RC frame buildings compared to the other RC building typologies. On the other hand, the steel warehouse presents much lower probabilities of collapse compared to all RC frame buildings, which is in line with the very low vulnerability of this structural typology (see Figure 11).
Figure 15 illustrates the mean, median, 15%, and 85% quantile loss exceedance curves for typical gravity quay walls, cranes, and the distribution electric power substations. As shown from these figures, depending on the loss index level (%), a higher annual probability may be computed either for the distribution substations or the cranes. For instance, for a loss index of 15%, the median exceedance annual frequency would be 0.0057, 0.00885, and 0.00585 for the gravity quay walls, cranes, and distribution electric power substations, respectively. For a loss index of 5%, the corresponding median annual probabilities would be higher compared to the previous ones, at 0.0173, 0.04875, and 0.0832 for the gravity quay walls, cranes, and distribution electric power substations, respectively.
Figure 16 shows the mean, median, 15%, and 85% quantile loss exceedance curves for the port buildings due to ground shaking. Among the RC building typologies, higher annual probabilities of exceeding the given loss index levels (%) are obtained for the mid-rise RC frame buildings compared to the corresponding low- and high-rise buildings. The steel warehouse shows much lower annual frequencies for given loss index levels (%) compared to the RC frame buildings. For example, for a loss index of 5%, the median annual frequencies of exceedance would be 0.0199, 0.0917, 0.0095, and 0.00005 for the low-rise, mid-rise, and high-rise RC buildings and the warehouse, respectively.
It is noted that port buildings do not contribute to the systemic analysis, as their seismic performance is not expected to significantly affect the performance of the port in terms of cargo and container movements. This decision has been made in collaboration with the port Authority. Under this consideration, results of the component level assessment in terms of a risk map are provided (Figure 17) which describe the spatial distribution of median losses (in terms of LI-%) for port buildings indicatively for a specific scenario derived from the probabilistic assessment with a mean return period Tm of 475 years. It is seen that the expected mean losses for the steel buildings are practically zero while the RC buildings present moderate (LI = 10–30%) losses.

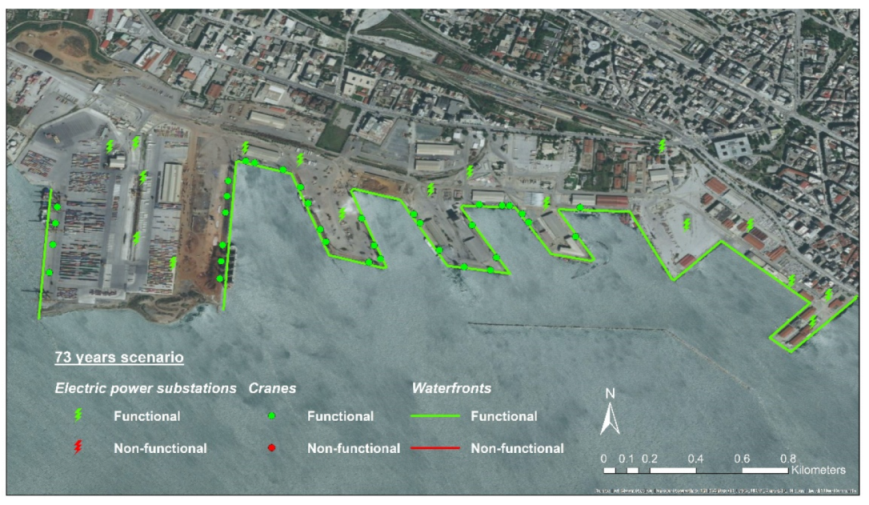
6.1.2. System Level Assessment

Once the component level seismic risk assessment of the selected port components is performed, the next step is the systemic risk assessment, which is conducted considering interdependencies of specific components and interacting systems based on the methodology initially developed in the SYNER-G project [8] and further extended in this study. The systemic analysis concerns the container and bulk cargo operations impacted by the performance of the piers, the waterfront structures, and the container/cargo handling equipment (cranes). As also noticed previously, buildings are not considered in the systemic analysis. Two terminals (i.e., container and bulk cargo) are considered and, therefore, the system performance is described in terms of the total number of containers loaded and unloaded per day (TCoH), in Twenty-foot Equivalent Units (TEU), and the total cargo loaded and unloaded per day (TCaH), in tons. The Performance Indicators (PIs) of the port system for both the container and cargo terminals are computed for each intensity level PGAi based on the damages and corresponding functionality state of each port component, also considering the interdependencies between them. Normalized PIs (PI/PImax) and normalized performance loss (1-PI/PImax) are finally computed. The main dependency concerns the cargo handling equipment in relation to the functionality of the waterfront and the Electric Power Network supplying the cranes.
For the PI evaluation, different criteria may be defined. This issue is practically open to the decision making and managing authorities of the port. In this application, it has been decided to define the following conceptual criteria for the PI estimation:
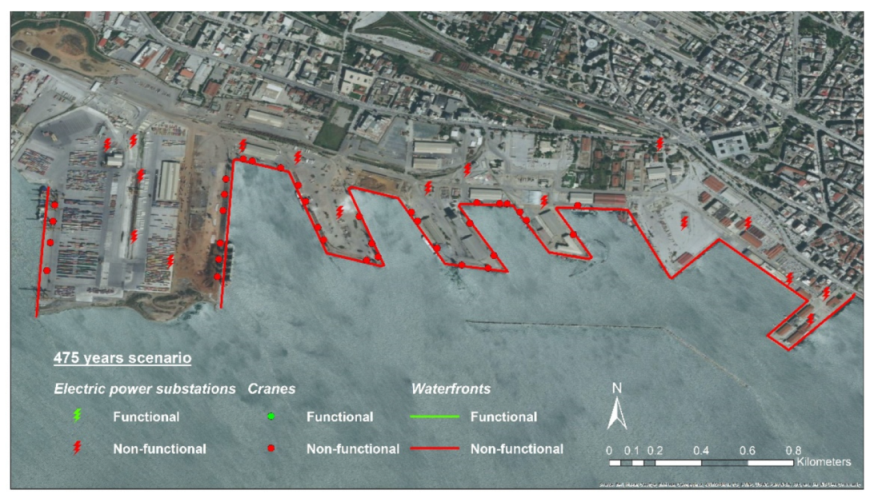
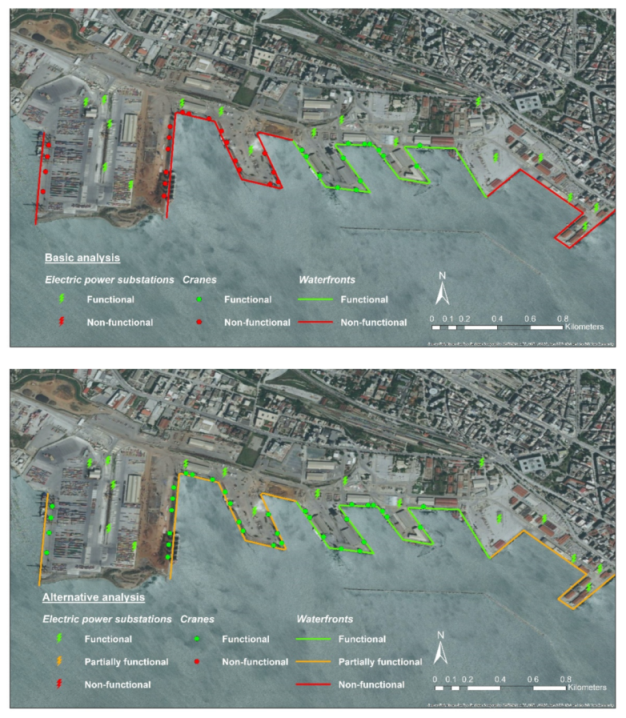
  • Waterfront-piers (berth) are functional if Damage (D) is lower than moderate;
  • Cranes are functional if Damage (D) is lower than moderate, the waterfront is functional, and there is electric power supply (either from the electric network or from the back-up supply);
  • The berth is functional if the waterfront and at least one crane is functional, otherwise the functionality of the berth is zero (PIbi = 0) and the whole berth is set to non-functional;
  • If the berth is functional, then PI is the sum of the crane capacities with respect to the functioning cranes that it includes. In case more than one crane is present, these can work simultaneously to download/upload containers from the same ship, reducing the time that the ship stays at each berth.
Based on the above operational and functional conceptual criteria for the PI, the results of the probabilistic systemic analysis may be achieved in terms of normalized performance loss curves for the whole port system for both the container and cargo terminals (Figure 18). Through these curves, the annual probability of exceeding specific levels of normalized performance loss can be estimated and the loss for specific mean return period of the particular PI may be evaluated. For instance, for a normalized performance loss of 1, the mean, median, 15%, and 85% quantile annual frequencies would be 0.0077, 0.00885, 0.00558, and 0.02687, respectively, for both TCaH and TCoH.
In the above basic functionality analysis, waterfronts, cranes, and distribution electric power substations are considered either fully functional if they suffer minor damage or non-functional for higher levels of damage. However, the functionality criteria may be different. For example, an alternative, less conservative analysis might be considered where the waterfront structures and distribution electric power substations are considered as fully (100%) functional if they suffer minor damages, partially (50%) functional if they suffer moderate damages, and non-functional for higher levels of damage. The functionality definition for cranes is kept the same as for the basic analysis, considering that the occurrence of damages higher than slight in cranes usually requires their withdrawal or even their replacement. It is also assumed that, in the case of the waterfront structures being partially functional, the cranes are considered fully functional provided that their damage is lower than moderate and there is electric power supply.
Figure 19 presents the corresponding normalized performance loss curves for the whole port system for both the container and cargo terminals. It is clearly observed that the port performance loss is reduced compared to the previous basic analysis for both TCoH and TCaH. More specifically, for a normalized performance loss of 1 (or 100%), the median annual frequency of exceedance would be at 0.00885 for both TCaH and TCoH for the basic analysis; the corresponding annual frequencies of exceedance of the normalized performance loss for the alternative, less conservative analysis would be much lower, at 0.00236 for both TCaH and TCoH.
Finally, Figure 20 provides risk maps describing the spatial distribution of functionality of the Thessaloniki port infrastructure for the basic functionality analysis for seismic scenarios derived from the PSHA with mean return periods Tm of 73 years and 475 years. It is shown that all port elements contributing to the system performance are functional for Tm = 73 years, while the same elements would be non-functional for Tm = 475 years. Therefore, the performance loss of the port system would be 0% for Tm = 73 years and 100% for Tm = 475 years for both TCoH and TCaH.
For the alternative, less conservative functionality analysis, waterfronts, distribution substations, and cranes would be, as previously, fully functional for Tm = 73 years (0% port performance loss for both TCoH and TCaH). For Tm = 475 years, the quay walls would be partially (50%) functional, while the distribution substations and cranes would be non-functional. Therefore, considering that all cranes are non-functional, based on the functionality criteria set (i.e., the berth is functional provided that the waterfront and at least one crane are functional), the berth would be non-functional. Consequently, the performance loss of the port, as for the basic functionality analysis, would be 100% for both TCoH and TCaH.

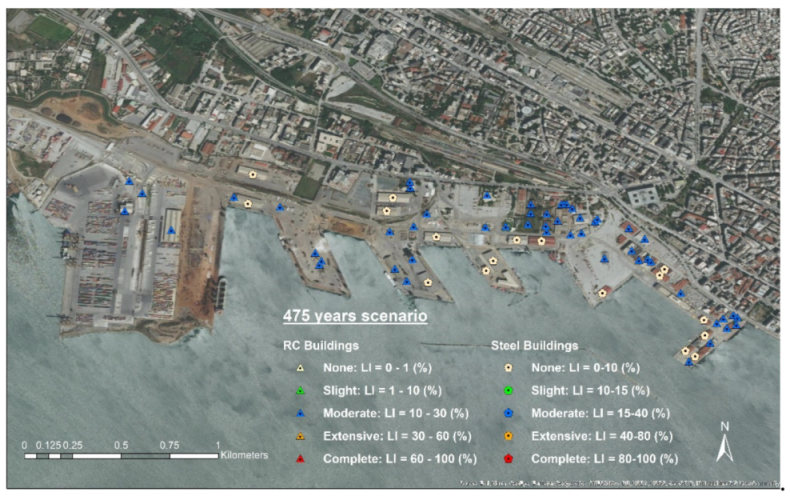
6.2. Deterministic Scenario-Based Approach

6.2.1. Component Level Assessment

The scenario-based risk assessment of the port facilities is initially conducted at the component level by considering the damages and losses of the different port elements due to the combined effects of ground shaking and liquefaction. Buildings, quay walls, cargo handling equipment (cranes), and the power supply system are examined using the proposed fragility models (see Section 5). Specifically, the vulnerability and risk assessment are performed based on non-linear site response analyses under effective stresses by considering the liquefaction potential. Results from soil profile A, B, or C were accounted for in the fragility analysis, based on the proximity of each component to the location of any of the three soil profiles. Depending on the intensity measure used in the fragility/vulnerability curves to consider the combined damage of ground shaking and liquefaction (Figure 12, Figure 13 and Figure 14), we extracted PGA values of the bedrock or ground surface, calculated from the total analysis cases.
For cranes and distribution substations, the permanent ground displacements (PGD) (horizontal and vertical) computed at the ground surface are considered to evaluate the potential damages due to liquefaction effects. Moreover, for these port elements, the combined damages are estimated by combining damage state probabilities due to the liquefaction (PL) and ground shaking (PGS), assuming that damage due to ground shaking is both independent from and ineffective on damage due to liquefaction [43]. Once the probability of exceeding the specified DS is estimated, a median ±1 standard deviation Loss Index LI (%) is evaluated to quantify the total losses (structural and nonstructural).
Figure 21 presents the spatial distribution of the estimated median losses for the scenario-based approach for the considered port infrastructures, including gravity quay walls, distribution substations and cranes (Figure 21, top), and critical port buildings (Figure 21, bottom), when considering the combined effects of ground shaking and liquefaction. The predicted LI (%) (in Figure 21, bottom) indicates that quay walls would suffer slight to moderate losses while the distribution substations and the cranes would sustain none to slight and no losses, respectively. Therefore, for the specific seismic scenario, which also considers liquefaction effects, the quay wall is the most critical port element. Figure 20 (bottom) shows that the steel warehouses and RC port buildings are expected to suffer none and slight damages/losses, respectively. This is in line with the very low predicted vulnerability of steel structures when subjected to the combined effects of ground shaking and liquefaction (see Figure 12 and Figure 14).

6.2.2. System Level Assessment

The systemic risk is then assessed using the already presented methodology by taking into account the interdependencies between (a) the cargo handling equipment and the Electric Power Network supplying cranes, and (b) the waterfront and the cranes. The estimated PIs of the port are normalized to the respective baseline value, referring to non-seismic conditions. For the basic functionality analysis, as defined previously, a 100% and 67% median performance loss is estimated for the TCoH and TCaH, respectively. For the alternative, less conservative analysis, the corresponding median performance loss would be reduced to 34% and 50% when considering the container and cargo terminal, respectively. Figure 22 depicts the spatial distribution of the port components’ functionality for the scenario-based approach, which considers the combined effects of ground shaking and liquefaction for the basic and alternative analysis, respectively. As shown for the seismic scenario and the basic functionality analysis, some quay walls, with the corresponding cranes resting, would be non-functional while the distribution substations would be fully functional. On the other hand, for the alternative analysis, only some quay walls would be partially functional while the other port components contributing to the systemic analysis, namely the cranes and the distribution substations, would be fully functional. Table 5 summarizes the estimated median ± StDev normalized performance loss for both TCoH and TCaH for the scenario-based approach, using the basic and the alternative analysis. It is shown that the median and median-StDev estimation for the normalized performance loss give the same values for both TCoH and TCaH; while, for the median + StDev estimation, the normalized performance loss grows for TCaH and is unchanged for TCoH.

7. Discussion-Conclusions

A system-wide seismic risk assessment methodology for port facilities has been presented which may take into account, if deemed necessary, the combined effects of ground shaking and liquefaction, as well as various intra-dependencies among port elements and interdependencies with supporting systems, e.g., the electric power system. Probabilistic and deterministic scenario-based approaches may be used depending on the significance of induced phenomena, often associated with liquefaction effects. In the proposed methodological framework, a general probabilistic risk assessment approach may be applied, considering only seismic ground shaking when induced phenomena (e.g., liquefaction) are not important. When induced phenomena may considerably contribute to the seismic hazard analysis and consequently affect the damages/losses and performance of the port, a more detailed deterministic scenario-based risk assessment is proposed, provided that the necessary geotechnical/geological data of the port area are available. In the latter case, the combined damages due to ground shaking and liquefaction of each port component contributing to the port performance should be evaluated. The proposed methodology illustrates the importance of identifying the appropriate seismic hazard methodology to be followed so as to provide appropriate intensity measures to adequate fragility models for all elements at risk. All of these are associated with various uncertainties. It should be strongly emphasized that assessing the seismic risk and performance of complex systems, such as a port, requires knowledge and proper treatment of these intrinsic epistemic and aleatory uncertainties.
The methodology has been illustrated through its application to a real case study, namely the port of Thessaloniki in Greece. Exposure, hazard analyses, and fragility models’ selection have been described and discussed. The results of the probabilistic seismic risk assessment have been illustrated in terms of annual probability of collapse and loss exceedance curves for each individual port component, and normalized performance loss for the whole port system considering PIs related to the container and cargo movements loss. Two different functionality analyses of the port system were conducted, i.e., a basic and an alternative less conservative one. It has been shown that cranes experienced higher probabilities of collapse due to ground shaking, followed by the gravity quay walls and the electric power substations. The loss exceedance curves for the distribution substations, quay walls, and the cranes demonstrated that, depending on the loss index level, higher annual frequencies of exceedance were obtained either for the distribution substations or the cranes, while the annual frequencies of exceedance were generally lower for the quay wall. As far as the critical port buildings are concerned, the annual collapse probabilities and annual frequencies of exceeding given loss index levels due to ground shaking were higher for the mid-rise RC frame building compared to the other RC building typologies, while the steel warehouse has shown much lower annual collapse probabilities and frequencies of exceedance, which is in accordance with the very low vulnerability of this structural typology. Indicative results for specific seismic scenarios derived from the PSHA with Tm 73 years and 475 years have shown that the port components contributing to the system performance are fully functional for the 73 years scenario for both the basic and alternative functionality analyses, resulting in a performance loss for the port system of 0%. For the 475 years scenario, the same port components would be non-functional for the basic functionality analysis while, for the alternative analysis, only quay walls would be partially functional, with the other port components resulting as non-functional, as for the basic analysis. Therefore, taking also into account the functionality criteria set, the performance loss of the port would be of 100% for both TCoH and TCaH for either functionality analysis.
The results of the deterministic scenario-based risk assessment, based on the disaggregation of seismic hazard for the port area, have been presented in terms of risk maps illustrating the distribution of damages/losses and functionality of specific elements and in terms of normalized performance loss of the port system. The quay walls have been shown to suffer greater damages and losses compared to the distribution substations and the cranes; therefore, for the specific seismic scenario which also considers liquefaction effects, quay walls would be the most critical port element. Moreover, it has been observed that the steel warehouses and RC port buildings would experience no and slight damages/losses respectively. The scenario-based systemic analysis resulted in a median performance loss of 100% and 67% for TCoH and TCaH, respectively, for the basic functionality analysis; for the alternative, less conservative functionality analysis, the performance loss was reduced to 50% and 34% for TCoH and TCaH, respectively.
In short, the loss of performance of a port system in terms of container and cargo movements’ reduction depends, on one hand, on the selected analysis approach, i.e., probabilistic or scenario-based, and on the accuracy of the evaluation of the main risk components (i.e., exposure, hazard, vulnerability); on the other, such loss depends on the conceptual criteria defining the functionality thresholds associated with the functionality of the port elements, as well as on the specific dependencies among elements and systems, which, to a certain extent, may depend on the managing and operation authorities. To demonstrate the importance of the latter parameter, the systemic risk analysis of Thessaloniki Port has been performed using both probabilistic and scenario-based approaches, by making two different functionality analysis hypotheses, a basic and an alternative, less conservative one. The differences are remarkable and may seriously affect risk management, decision making, and the resilience assessment of the port.
In the context of a multi-hazard, multi-risk assessment framework, e.g., [50], another natural hazard such as an earthquake generated tsunami may be also considered in the risk analysis. However, previous research has shown that earthquake generated tsunami hazard is not significant for the example application [9,12]; therefore, tackling the seismic hazard only may be considered sustainable for the sake of the Thessaloniki port’s continuing functionality. Of course, if another pilot application is considered (e.g., the Heraklion port in Crete, Southern Greece), the (earthquake-induced) tsunami hazard may be relevant and may be taken into account using as a basis the proposed methodology (i.e., using a scenario-based deterministic approach).
The methodology can be adapted and applied to other port facilities in Greece, the Mediterranean basin, and worldwide, considering their local characteristics (e.g., soil profiles, seismic hazard, exposure model, fragility model, etc.). Future work may include the seismic vulnerability of the electric power lines due to ground shaking and liquefaction using recently available fragility curves (e.g., by Kongar et al. [51] for buried cables) and the earthquake-generated tsunami hazard. Moreover, in future work, additional interdependencies can be modelled such as interaction with water and gas infrastructures as well interdependencies with the transportation network, which may be critical for the port operations in pre-seismic conditions and in the recovery process following an earthquake.

Author Contributions

Conceptualization, S.F., S.K., A.K. and K.P.; methodology, S.F., S.K., A.K.; software, S.F., S.K., A.K.; writing—original draft preparation, S.F.; writing—review and editing, S.F., S.K., A.K. and K.P.; All authors have read and agreed to the published version of the manuscript.

Funding

This research was funded by Hellenic Foundation for Research and Innovation (HFRI) and General Secretariat for Research and Innovation (GSRI), grant number 754.

Acknowledgments

The research reported in this paper was carried out in the framework of the ‘‘Resilient, system-wide seismic risk assessment of port facilities. Application to Thessaloniki Port system’’ RESPORTS project (http://resports.gr/, accessed on 1 January 2019), funded by the Hellenic Foundation for Research and Innovation (HFRI) and General Secretariat for Research and Innovation (GSRI) under Grant Agreement Number 754.
Sustainability 14 01424 i001

Conflicts of Interest

The authors declare no conflict of interest.

References

  1. United Nations Conference on Trade and Development (UNCTAD). Review of Maritime Transport; United Nations Publication: New York, NY, USA, 2020; ISBN 9789211129939. [Google Scholar]
  2. Shinozuka, M. (Ed.) The Hanshin-Awaji Earthquake of January 17, 1995: Performance of Lifelines; Technical Report NCEER-95-0015; National Center for Earthquake Engineering Research (NCEER), State University of New York: Buffalo, NY, USA, 1995. [Google Scholar]
  3. Chang, S.E. Disasters and transport systems: Loss, recovery and competition at the Port of Kobe after the 1995 earthquake. J. Transp. Geogr. 2000, 8, 53–65. [Google Scholar] [CrossRef]
  4. Werner, S.D. Seismic Guidelines for Ports; Monograph No. 12; American Society of Civil Engineers (ASCE): Reston, VA, USA, 1998; Chapter 2. [Google Scholar]
  5. Bernal, A.; Blazquez, R.; Burcharth, H.F.; Dickenson, S.; Ferritto, J.; Finn, L.; Iai, S.; Ichii, K.; McCullough, N.J.; Meeuwissen, P.W.H.; et al. Seismic Design Guidelines for Port Structures; Balkema: Rotterdam, The Netherlands, 2001; 474p. [Google Scholar]
  6. Stewart, J.P.; Fenves, G.L.; Seed, R.B. Seismic soil-structure-interaction in buildings I: Analytical methods. ASCE J. Geotech. Geoenviron. Eng. 1999, 125, 26–37. [Google Scholar] [CrossRef]
  7. Pachakis, D.; Kiremidjian, A.S. Estimation of Downtime—Related Revenue Losses in Maritime Ports due to Earthquakes; Technical Report No. 146; John A. Blume Earthquake Engineering Center: Stanford, CA, USA, 2005. [Google Scholar]
  8. Pitilakis, K.; Franchin, P.; Khazai, B.; Wenzel, H. (Eds.) SYNER-G: Systemic Seismic Vulnerability and Risk Assessment of Complex Urban, Utility, Lifeline Systems and Critical Facilities. Methodology and Applications; Geotechnical, Geological and Earthquake Engineering Series; Springer: Dordrecht, The Netherlands, 2014; Volume 31. [Google Scholar]
  9. Pitilakis, K.; Argyroudis, S.; Fotopoulou, S.; Karafagka, S.; Kakderi, K.; Selva, J. Application of stress test concepts for port infrastructures against natural hazards. The case of Thessaloniki port in Greece. Reliab. Eng. Syst. Saf. 2019, 184, 240–257. [Google Scholar] [CrossRef]
  10. Werner, S.; Taylor, C. Final Report: Seismic Risk Reduction Planning Evaluations for Wharf and Embankment Strengthening Program (WESP); Prepared by SEISEC-NHMI for Port of Oakland, Oakland, CA; Port of Oakland: Oakland, CA, USA, 2004. [Google Scholar]
  11. Conca, D.; Bozzoni, F.; Carlo, G.L. Interdependencies in Seismic Risk Assessment of Seaport Systems: Case Study at Largest Commercial Port in Italy. ASCE-ASME J. Risk Uncertain. Eng. Syst. Part A Civ. Eng. 2020, 6, 4020006. [Google Scholar] [CrossRef]
  12. Pitilakis, K.; Argyroudis, S.; Fotopoulou, S.; Karafagka, S.; Anastasiadis, A.; Pitilakis, D.; Raptakis, D.; Riga, E.; Tsinaris, A.; Mara, K.; et al. Deliverable D6.1: Integrated Report Detailing Analyses, Results and Proposed Hierarchical set of Stress Tests for the six CIs. STREST EC/FP7 Project: Harmonized Approach to Stress Tests for Critical Infrastructures Against Natural Hazards; ETH Zürich: Zürich, Switzerland, 2016; Available online: www.strest-eu.org (accessed on 1 September 2016).
  13. Kakderi, K.; Selva, J.; Argyroudis, S.; Pitilakis, K.; Anastasiadis, A.; Alexoudi, M.; Souli, A.; Fotopoulou, S.; Rovithis, M.; Senetakis, K. Application and Validation Study to a Harbor System (Thessaloniki, Greece). Deliverable 6.6, SYNER-G Project; Aristotle University of Thessaloniki: Thessaloniki, Greece, 2013. [Google Scholar]
  14. Crowley, H.; Casotto, C.; Pitilakis, K.; Kakderi, K.; Argyroudis, S.; Fotopoulou, S.; Lanzano, G.; Salzano, E.; Iervolino, I.; Basco, A.; et al. Deliverable D4.4: Report on the Taxonomy of Cis Based on Their Vulnerability Characteristics and Exposure to Natural Hazard Initiating Events. STREST Project: Harmonized Approach to Stress Tests for Critical Infrastructures against Natural Hazards; ETH Zürich: Zürich, Switzerland, 2016. [Google Scholar]
  15. Anastasiadis, A.; Raptakis, D.; Pitilakis, K. Thessaloniki’s detailed microzoning: Subsurface structure as basis for site response analysis. Pure Appl. Geophys. 2001, 158, 2597–2633. [Google Scholar] [CrossRef]
  16. Apostolidis, P.; Raptakis, D.; Roumelioti, Z.; Pitilakis, K. Determination of S-wave velocity structure using microtremors and spac method applied in Thessaloniki (Greece). Soil Dyn. Earthq. Eng. 2001, 24, 49–67. [Google Scholar] [CrossRef]
  17. Pagani, M.; Monelli, D.; Weatherill, G.; Danciu, L.; Crowley, H.; Silva, V.; Henshaw, P.; Butler, L.; Nastasi, M.; Panzeri, L.; et al. OpenQuake-engine: An Open Hazard (and Risk) Software for the Global Earthquake Model. Seismol. Res. Lett. 2014, 85, 692–702. [Google Scholar] [CrossRef] [Green Version]
  18. Woessner, J.; Danciu, L.; Giardini, D.; Crowley, H.; Cotton, F.; Grünthal, G.; Valensise, G.; Arvidsson, R.; Basili, R.; Demircioglu, M.B.; et al. The 2013 European Seismic Hazard Model: Key Components and Results. Bull. Earthq. Eng. 2015, 13, 3553–3596. [Google Scholar] [CrossRef] [Green Version]
  19. Akkar, S.; Bommer, J.J. Empirical equations for the prediction of PGA, PGV, and spectral accelerations in Europe, the Mediterranean region, and the Middle East. Seismol. Res. Lett. 2010, 81, 195–206. [Google Scholar] [CrossRef] [Green Version]
  20. Cauzzi, C.; Faccioli, E. Broadband (0.05 to 20 s) prediction of displacement response spectra based on worldwide digital records. J. Seismol. 2008, 12, 453–475. [Google Scholar] [CrossRef]
  21. Chiou, B.S.J.; Youngs, R.R. An NGA model for the average horizontal component of peak ground motion and response spectra. Earthq. Spectra 2008, 24, 173–215. [Google Scholar] [CrossRef] [Green Version]
  22. Zhao, J.X.; Zhang, J.; Asano, A.; Ohno, Y.; Oouchi, T.; Takahashi, T.; Ogawa, H.; Irikura, K.; Thio, H.K.; Somerville, P.G.; et al. Attenuation relations of strong ground motion in Japan using site classification based on predominant period. Bull. Seismol. Soc. Am. 2006, 96, 898–913. [Google Scholar] [CrossRef]
  23. Youd, T.L.; Idriss, I.M.; Andrus, R.D.; Arango, I.I.; Castro, G.; Christian, J.T.; Dobry, R.; Finn, W.D.L.; Harder, L.F., Jr.; Hynes, M.E.; et al. Liquefaction resistance of soils: Summary report from the 1996 NCEER and 1998 NCEER/NSF workshops on evaluation of liquefaction resistance of soils. J. Geotech. Geoenviron. Eng. 2001, 127, 817–903. [Google Scholar] [CrossRef] [Green Version]
  24. Papaioannou, C. Deliverable D3.B: Seismic Hazard Scenarios—Probabilistic Seismic Hazard Analysis, SRM-Life Project: Development of a Global Methodology for the Vulnerability Assessment and Risk Management of Lifelines, Infrastructures and Critical Facilities. Application to the Metropolitan Area of Thessaloniki (in Greek); AUTH Research Committee: Thessaloniki, Greece, 2004. [Google Scholar]
  25. Caputo, R.; Pavlides, S. The Greek Database of Seismogenic Sources (GreDaSS), Version 2.0.0: A Compilation of Potential Seismogenic Sources (Mw > 5.5) in the Aegean Region, 2013. Available online: https://gredass.unife.it/ (accessed on 1 July 2013).
  26. Caputo, R.; Chatzipetros, A.; Pavlides, S.; Sboras, S. The Greek Database of Seismogenic Sources (GreDaSS): State-of-the-art for northern Greece. Ann. Geophys. 2012, 55, 859–894. [Google Scholar]
  27. Akkar, S.; Sandıkkaya, M.A.; Bommer, J.J. Empirical ground-motion models for point- and extended source crustal earthquake scenarios in Europe and the Middle East. Bull. Earthq. Eng. 2014, 12, 359–387. [Google Scholar] [CrossRef] [Green Version]
  28. Giardini, D.; Woessner, J.; Danciu, L.; Crowley, H.; Cotton, F.; Grünthal, G.; Pinho, R.; Valensise, G.; Akkar, S.; Arvidsson, R.; et al. Seismic Hazard Harmonization in Europe (SHARE). Online Data Resource. 2013. Available online: http://www.share-eu.org/ (accessed on 25 November 2013).
  29. Pitilakis, K.; Riga, Ε.; Anastasiadis, A. New code site classification, amplification factors and normalized response spectra based on a worldwide ground-motion database. Bull. Earthq. Eng. 2013, 11, 925–966. [Google Scholar] [CrossRef]
  30. Baker, J.W.; Cornell, C.A. A vector valued ground motion intensity measure consisting of spectral acceleration and epsilon. Earthq. Eng. Struct. Dyn. 2005, 34, 1193–1217. [Google Scholar] [CrossRef]
  31. Iervolino, I.; Galasso, C.; Cosenza, E. REXEL: Computer aided record selection for code-based seismic structural analysis. Bull. Earthq. Eng. 2010, 8, 339–362. [Google Scholar] [CrossRef]
  32. Elgamal, A.; Yang, Z.; Lu, J. Cyclic1D Seismic Ground Response Version 1.4, User’s Manual; Department of Structural Engineering, University of California: San Diego, CA, USA, 2015. [Google Scholar]
  33. Chan, A.H.C. A Unified Finite Element Solution to Static and Dynamic Problems in Geomechanics. Ph.D. Dissertation, University College of Swansea, Swansea, UK, 1988. [Google Scholar]
  34. Parra, E. Numerical Modeling of Liquefaction and Lateral Ground Deformation Including Cyclic Mobility and Dilative Behavior is Soil Systems. PhD Dissertation, Department of Civil Engineering, Rensselaer Polytechnic Institute, Troy, NY, USA, 1996. [Google Scholar]
  35. Yang, Z. Numerical Modeling of Earthquake Site Response Including Dilation and Liquefaction. Ph.D. Dissertation, Department of Civil Engineering and Engineering Mechanics, Columbia University, New York, NY, USA, 2000. [Google Scholar]
  36. Prevost, J.H.A. Simple Plasticity Theory for Frictional Cohesionless Soils. Soil Dyn. Earthq. Eng. 1985, 4, 9–17. [Google Scholar] [CrossRef]
  37. Robertson, P.K.; Wride, C.E. Evaluating cyclic liquefaction potential using the cone penetration test. Can. Geotech. J. 1998, 35, 442–459. [Google Scholar] [CrossRef]
  38. Seed, R.B.; Cetin, K.O.; Moss, R.E.S.; Kammerer, A.; Wu, J.; Pestana, J.; Riemer, M.; Sancio, R.B.; Bray, J.D.; Kayen, R.E.; et al. Recent advances in soil liquefaction engineering: A unified and consistent framework; Keynote Presentation. In Proceedings of the 26th Annual ASCE Los Angeles Geotechnical Spring Seminar, Long Beach, CA, USA, 30 April 2003. [Google Scholar]
  39. Youd, T.L.; Idriss, I.M. (Eds.) NCEER 97. Proceedings of the NCEER Workshop on Evaluation of Liquefaction Resistance; Technical Report NCEER-97-0022; National Center for Earthquake Engineering Research (NCEER); State University of New York: Buffalo, NY, USA, 1997. [Google Scholar]
  40. European Committee for Standardization. EN 1998-5. Eurocode 8: Design of structures for earthquake resistance—Part 5: Foundations, Retaining Structures and Geotechnical Aspects; European Committee for Standardization: Brussels, Belgium, 2004. [Google Scholar]
  41. National Institute of Building Sciences, NIBS. Direct Physical Damage—General Building Stock. HAZUS-MH Technical Manual; Federal Emergency Management Agency: Washington, DC, USA, 2004; Chapter 5. [Google Scholar]
  42. Pitilakis, K.; Crowley, H.; Kaynia, A. SYNER-G: Typology Definition and Fragility Functions for Physical Elements at Seismic Risk. Buildings, Lifelines, Transportation Networks and Critical Facilities; Geotechnical, Geological and Earthquake Engineering Series; Springer: Dordrecht, The Netherlands, 2014; Volume 27. [Google Scholar]
  43. Laboratory of Soil Mechanics, Foundation and Geotechnical Earthquake Engineering of AUTH; National Technical University of Athens (NTUA). UPGRADE Research Project. Deliverable D8.2 Technical Reports with the Calculation Results of the Vulnerability of Specific Greek Port Facilities (in Greek). Contemporary Evaluation Methodology of Seismic Vulnerability and Upgrade of Port Facilities; NTUA Research Committee: Athens, Greece, 2015. [Google Scholar]
  44. Kappos, A.J.; Panagiotopoulos, C.; Panagopoulos, G.; Panagopoulos, E. WP4—Reinforced Concrete Buildings (Level I and II Analysis), RISK-UE: An Advanced Approach to Earthquake Risk Scenarios with Applications to Different European Towns; European Commission: Brussels, Belgium, 2003. [Google Scholar]
  45. Kappos, A.J.; Panagopoulos, G.; Panagiotopoulos, C.; Penelis, G. A hybrid method for the vulnerability assessment of R/C and URM buildings. Bull. Earthq. Eng. 2006, 4, 391–419. [Google Scholar] [CrossRef]
  46. Karafagka, S.; Fotopoulou, S.; Karatzetzou, A.; Malliotakis, G.; Pitilakis, D. The effect of soil-structure interaction and liquefaction on the seismic vulnerability of typical port steel light-frame warehouses. In Proceedings of the 8th ECCOMAS Thematic Conference on Computational Methods in Structural Dynamics and Earthquake Engineering, COMPDYN 2021, Streamed from Athens, Greece, 27–30 June 2021. [Google Scholar]
  47. Karafagka, S.; Fotopoulou, S.; Pitilakis, D. Fragility curves of non-ductile RC frame buildings on soft soils including liquefaction effects and soil-structure interaction. Bull. Earthq. Eng. 2021, 19, 6443–6468. [Google Scholar] [CrossRef]
  48. Fotopoulou, S.; Pitilakis, K. Vulnerability assessment of reinforced concrete buildings at precarious slopes subjected to combined ground shaking and earthquake induced landslide. Soil Dyn. Earthq. Eng. 2017, 93, 84–98. [Google Scholar] [CrossRef]
  49. Fotopoulou, S.; Pitilakis, K. Probabilistic assessment of the vulnerability of reinforced concrete buildings subjected to earthquake induced landslides. Bull. Earthq. Eng. 2017, 15, 5191–5215. [Google Scholar] [CrossRef]
  50. Lam, J.S.L.; Lassa, J.A. Risk assessment framework for exposure of cargo and ports to natural hazards and climate extremes. Marit. Policy Manag. 2017, 44, 1–15. [Google Scholar] [CrossRef]
  51. Kongar, I.; Giovinazzi, S.; Rossetto, T. Seismic performance of buried electrical cables: Evidence-based repair rates and fragility functions. Bull. Earthq. Eng. 2017, 15, 3151–3181. [Google Scholar] [CrossRef] [Green Version]
Figure 1. Proposed methodological framework.
Sustainability 14 01424 g001
Figure 2. (a) Location of Thessaloniki port in Greece. (b) Map of Thessaloniki’s port buildings and infrastructures considered in this study (modified from [8]).
Sustainability 14 01424 g002
Figure 3. Layout of geotechnical and geophysical tests in the port area (modified from [12]).
Sustainability 14 01424 g003
Figure 4. Mean, median, 15%, and 85% quantile hazard curves for (a) the rock basement (Vs,30 = 800.0 m/s) and (b) the ground surface at the port area considering the measured Vs,30.
Sustainability 14 01424 g004
Figure 5. Probabilistic Seismic Hazard: estimated mean PGA for (a) rock conditions and (b) the ground surface for the whole area of Thessaloniki for a 10% probability of exceedance in 50 years (Tm= 475 years). In blue: the studied buildings in the Thessaloniki port; in red: centroids of the polygons in the Thessaloniki port area.
Sustainability 14 01424 g005
Figure 6. (a) Median and median plus 0.5 standard deviation acceleration spectra of Akkar and Bommer [19] in comparison with ESHM13 [18] uniform hazard spectrum provided in the EU FP7 project SHARE [28] for the Thessaloniki port area for the 475 years scenario, the EC8 elastic response spectrum for PGA = 0.16 g according to the current Greek Seismic Code for the city of Thessaloniki for soil class A (rock) and Pitilakis et al. [29] spectrum; (b) median plus 0.5σ Akkar and Bommer [19] spectrum in comparison with the average elastic response spectrum of the input motions.
Sustainability 14 01424 g006
Figure 7. Vs profiles for site 9 ((a) left, (b) middle, and (c) right) together with the Unified Soil Classification System (USCS) USCS characterization.
Sustainability 14 01424 g007
Figure 8. Scenario-based approach: median ± standard deviation variation in PGA values with depth for the three representative soil profiles at the port area.
Sustainability 14 01424 g008
Figure 9. Scenario-based approach: (I) variation in effective confinement and (II) settlement with depth for the 15 selected time histories and the three representative soil profiles.
Sustainability 14 01424 g009aSustainability 14 01424 g009b
Figure 10. Fragility curves for the quay walls and cranes due to ground shaking.
Sustainability 14 01424 g010
Figure 11. Fragility curves for the steel-light frame warehouse due to ground shaking.
Sustainability 14 01424 g011
Figure 12. Fragility curves in terms of PGArock for the considered port buildings due to the combined effects of ground shaking and liquefaction.
Sustainability 14 01424 g012
Figure 13. Fragility curves in terms of PGAsurf for the quay wall configuration with a W/H ratio equal to 0.6 due to the combined effects of ground shaking and liquefaction.
Sustainability 14 01424 g013
Figure 14. Vulnerability curves for the considered port buildings (left) and the quay wall configuration with a W/H ratio of 0.6 (right) due to the combined effects of ground shaking and liquefaction.
Sustainability 14 01424 g014
Figure 15. Loss exceedance curves due to ground shaking for gravity quay walls, cranes, and distribution electric power substations.
Sustainability 14 01424 g015aSustainability 14 01424 g015b
Figure 16. Loss exceedance curves for the RC frame buildings and steel warehouse due to ground shaking.
Sustainability 14 01424 g016
Figure 17. Probabilistic approach: distribution of the mean losses of Thessaloniki’s buildings for Tm = 475 years due to ground shaking.
Sustainability 14 01424 g017
Figure 18. Normalized performance loss curves for both TCaH and TCoH.
Sustainability 14 01424 g018
Figure 19. Normalized performance loss curves for both TCaH and TCoH when applying an alternative, less conservative functionality analysis.
Sustainability 14 01424 g019
Figure 20. Probabilistic approach: spatial distribution of the port components’ mean functionality for the 73 years (top) and 475 years (bottom) seismic scenarios due to ground shaking.
Sustainability 14 01424 g020aSustainability 14 01424 g020b
Figure 21. Scenario-based approach: spatial distribution of the median losses of Thessaloniki’s port infrastructures (top) and buildings (bottom).
Sustainability 14 01424 g021
Figure 22. Scenario-based approach: spatial distribution of the port components’ median functionality for the basic (top) and the alternative (bottom) analysis.
Sustainability 14 01424 g022
Table 1. List of records used for the dynamic analyses for the scenario-based assessment.
Earthquake NameDateMwFault MechanismEpicentral Distance [km]PGA [m/s2]EC8 Site ClassWaveform ID
Umbria Marche (aftershock)6 October19975.5normal51.838A651
Valnerina19 September 19795.8normal51.510A242
SE of Tirana9 January 19885.9reverse74.037A3802
Lazio Abruzzo (aftershock)11 May 19845.5normal151.411A990
Valnerina19 September19795.8normal52.012A242
Kozani13 May 19956.5normal172.039A6115
Friuli (aftershock)15 September19766reverse121.339A149
Umbria Marche 126 September19975.7normal231.645A763
Friuli (aftershock)15 September 19766reverse142.586B134
Patras14 July 19935.6strike slip93.337B1932
Kalamata13 September 19865.9normal112.670B414
Umbria Marche 226 September 19976normal115.138B594
Montenegro (aftershock)24 May 19796.2reverse171.708B229
Kefallinia island23 January 19925.6reverse142.223B6040
Ano Liosia7 September 19996normal142.159B1714
Table 2. Damage indices for the different limit damage states for the considered port facilities.
Annual Collapse Probabilities
Port ElementLS1LS2LS3 LS4
RC building/ Steel warehouse0.050.200.450.80
Electric power substation0.08 0.2750.600.90
Quay wall/Crane0.08 0.2750.70-
Table 3. Annual probability of collapse for the gravity quay walls, cranes, and electric power substations due to ground shaking.
Annual Collapse Probabilities
Port ElementMeanMedian15% Quantile85% Quantile
Gravity quay walls0.004050.004120.001210.00850
Cranes0.006210.006570.001800.01291
Electric power substations0.000660.000530.000130.00165
Table 4. Annual probability of collapse for the critical port buildings due to ground shaking.
Annual Collapse Probabilities
Building TypologyMeanMedian15% Quantile85% Quantile
Low-rise RC frame0.007720.008230.002120.01432
Mid-rise RC frame0.014850.016200.003870.02720
High-rise RC frame0.002850.002850.000820.00596
Steel warehouse5.17 × 10−074.08 × 10−073.06 × 10−084.2 × 10−06
Table 5. Median ± StDev normalized performance loss of the port system for TCaH and TCoH for the basic and alternative functionality analysis.
Normalized Performance Loss
Basic AnalysisAlternative Analysis
TCaHTCoH TCaHTCoH
Median0.671.000.340.50
Median + StDev1.001.000.500.50
Median − StDev0.671.000.340.50
Publisher’s Note: MDPI stays neutral with regard to jurisdictional claims in published maps and institutional affiliations.

