1. Introduction
A general new sensibility on sustainability has emerged in several ambients, institutional, commercial, educational, and political, even if a true commitment to fighting climate change can occur only when all stakeholders share the task.
Many attempts have been made over time, introducing acronyms able to synthesize this wide contest. PPP, originally conceived as associated with the words people, profit, planet, has been slightly modified recently at the States Symposium G20 held in Rome in October 2021, as people, planet, prosperity. In addition, the 4Rs, until now limited to insiders, are explained, i.e., to the customers of a special store such as IKEA, where during browsing the customers may hear a voice suggesting them to buy their products, because they have been conceived from the first step of the design to be reduced, reused, recycled, and recovered.
In Government Institutions, such general new sensibility on sustainability is emerging. In June 2020, with the rule 2020/852, the European Parliament and the Council of the European Union established a frame that promotes investments that do not cause harm to the environment. In particular, an activity is compatible with the DNSH (do no significant harm) principle if it concurs in a significant manner to reach one or more environmental goals, does not cause significant harm to any of the environmental goals, or if the activity is performed in respect of the minimal guarantee established by the rule.
Therefore, it is mandatory to define a set of elements, once and for all, during products design, which can aid designers to assess the impact that each design solution may have on the planet.
Axiomatic design (AD) is an approach able to give valid answers to the main question that a designer has in mind when he/she tries to design a product able to solve a problem emerging from real life: is the product able to perform well? Translating the first idea into a relation between functionalities and design parameters, AD can guide designers to discover if the concept really will be able to do this [
1]. Furthermore, if designers would like to propose products that will also have a positive impact from the environmental point of view, he/she has to be supported adequately with new information.
There have been many methodologies proposed in design methods over time, since their first appearance in the last 80 years of the past century [
2].
Many authors proposed integrated approaches [
3,
4], in which many methods are adopted to address diverse aspects of product design; and, if data are collected at each stage inside the matrix, the interoperability of these methods is fostered, and a unique central database is implemented.
Axiomatic design appeared in that period, even if it had a certain diffusion mainly thanks to the ICAD conferences that started in 2000 (first editions held in Cambridge and Worcester—MA, USA) and are periodically held worldwide. The community of researchers that shares the interest in such an approach is wide and heterogeneous in all sectors of engineering science [
5].
Checking whether a design solution is also valid for sustainability needs the introduction of other elements in the original formulation. The original mapping from Customer Domain to Functional Domain and then to Physical Domain remains the basic passage to validate the design solution for functionality. The next step needs a certain modification. The original proposal required mapping from the Physical domain to Process Domain, considering the need to really decide how to manufacture each main characteristic of the design solution. This is no longer sufficient if designers would like to check the validity of their conception and analyze it from the environmental point of view.
In a certain sense, the latter domain must be extended, introducing the manufacture, not only in the strict sense but requiring that products must be sustainable. Furthermore, all the aspects of the product life cycle must be taken into account. In order to do this, the domain must be considered a Sustainable Domain.
New data structures must be used to collect such kinds of data, and further checks must be introduced in order to assess the sustainability of a design solution. This paper presents an updated version of the classic presentation of the design process depicted by axiomatic design.
During the last decade, the extension of the first formulation of axiomatic design has been attempted by many authors to study environmental sustainability issues.
Seyajah et al. [
6] proposed the concept of a Sustainable Design Index (SDI) for structured and systematic furniture design, based on modular product architecture supported by a design structure matrix (DSM) and AD, integrated into a CAD environment.
Brown and Rauch [
7] promote AD to foster designers’ creativity oriented to Industry 4.0 and sustainability, by a proper definition of functional requirements (FRs) supported by the first canon of ethics for engineers (“…engineers shall hold paramount the safety, health, and welfare of the public…”).
Beng and Omar [
8,
9] proposed a framework based on AD principles to facilitate sustainable product development; the focus is on three key areas considered in design stages: End-of-Life management, green supply chain, and sustainable manufacturing. The aim is pursued by pointing out the proper FRs and design parameters (DPs).
Linke and Dornfeld [
10] connected sustainability metrics to the axiomatic process for modeling the grinding technology; the FRs of the machining have been linked to processing, tool, and coolant design parameters for life cycle assessment.
Kuo and Wang [
11] integrated robust design criteria and AD principles to support sustainable product development; in this study, they basically used AD to fulfill customers’ environmental requirements.
Stiassnie and Shpiltalni [
12] incorporated life cycle considerations in AD, setting environmental issues in FRs and constraints; in their work, they tried to assess environmental performances through information content.
Malik et al. [
13] present a literature review on the integration of AD and quality function deployment (QFD), in which they highlighted how QFD is more suitable for problem identification whereas AD is more suitable for product development decision making with high-quality needs and, even more, when environmental issues are present.
Ashtiany and Alipour [
14] integrated AD, QFD, and the eco-design concept for the sustainable design of an airplane tail. They demonstrated how the integration of AD and QFD makes the determination of both traditional and sustainable attributes of a product easier in the design process.
Giorgetti et al. [
15,
16] showed how AD is used as the core of the Smart Eco-design Platform, a multilayer structure for the detection of potential areas of improvement and for the introduction of innovative solutions with regard to the sustainability of products. The goal is reached through the introduction of an EI (environmental information) database, which is queried through the FRs. The EI database (populated by sharing eco-design experiences among technicians and managers) suggests constraints regarding the employment of design parameters (DPs), according to the most ecological way to fulfill their corresponding FRs.
Marchesi et al. [
17] introduced the use of an engineering framework based on AD to support architects in developing small sustainable houses; the goal is reached by focusing the attention on the proper FRs and constraints (Cs).
Shin et al. [
18] used eFRs to refer to ecologically oriented functional requirements and, similarly, used eDPs, eCs, eSCs (selection criteria), and eOCs (optimization criteria) in order to address environmental aspects in product design by AD. Furthermore, they introduced an augmented design matrix to consider costs and LCA scores.
Morrison et al. [
19], in the wake of [
18], developed an eco-design methodology based on AD, called eAD+, in which they identified hundreds of factors that are relevant for eco-design from stakeholders, the literature, and company websites. These are condensed into 94 ecological customer needs (eCNs); from these, about 20 ecological functional requirements (eFRs) have been identified that can be used at the enterprise and product/system level. They considered how the eCNs, eFRs, and ecological metrics such as LCA could be included in AD. To avoid issues related to functional independence, which is essential in AD, they considered LCA as a selection criterion, which is included in the AD design matrix by appending additional rows.
The paper presents a new approach able to integrate new data structures to the basic formulation of the axiomatic design model. It does not require the definition of specific ecological customer needs or functional requirements, but maintaining the original formulation push designers to globally pursue a step towards sustainable products, assessing the quality of each component and the whole product.
For the evaluation of the functionalities, a set of graphs has been added to the decomposition tree that allows designers to check whether the device performs validly. The adjacency matrix, strictly associated with such graphs, gives the opportunity to collect relevant data also for environmental assessments.
On the basis of such data, designers and stakeholders have the possibility of reasoning about the device throughout its life cycle. In the design phase, many modifications can be considered following the suggestions that emerge from such data. Following a case study, such new organization and mapping among domains is clarified and discussed.
2. Suggestion of a New Mapping among Domains
Axiomatic design condensed its main characteristics in a very synthetic representation of the interaction among the main design phases.
Figure 1 reproduces an image where the interaction between the domains is considered as
mapping or a correspondence among the parameters that characterize each of them. This mapping, in a few cases, can have a bi-univocal nature, although in general, it may assume a variety of forms: one to many, many to one. This kind of relationship attests to the degree of complexity hidden in every problem.
Each domain is characterized by an array, which collects the main elements that depict the product design elaboration. Customer attributes {CA} collects the needs from customers that have been identified by classical surveys or interviews and ordered in such a way as to identify their relative importance. The dimension n of such an array can vary according to the clear and right identification of customer needs by the designers and stakeholders involved. Functional requirements {FR} is a list of characteristic elements that designers have conceived in order to solve a problem, bearing in mind the {CA} from which they have to see and investigate the problem. This list has an m dimension that is determined by the degree of complexity that designers decide to adopt. This dimension is not determined by {CA}, even if {FR} must be thought of as a collection of basic elements of the main functionalities that have to be performed in strict relation to how they have been obtained and classified in {CA}.
Design parameters {DP} is an array of dimension m, the same as {FR}. Each parameter is in strict relation to the corresponding functionality. The identification of each parameter is determined by designer creativity because each functionality can be performed in many alternative ways, employing standard components, or conceiving original solutions. The dimension m of {FR} and {DP} must be the same, attaining that the mapping is formalized by the m × m design matrix. The form of this matrix can only be diagonal in the case of a bi-univocal relation between both domains. In general, the matrix assumes the uncoupled form, where more DPs can control the same FR. In this case, in order to be able to control and validate the behavior of the product, the matrix has to be triangular.
The further mapping of the product development process is conducted through the manufacturing domain, or, as stated by Suh [
1], the
Process Domain, where a set of process variables {PV} must be fixed after having chosen the right manufacturing process. The dimension
k of this domain is in relation to the
m dimension of {DP} in the sense that the latter can be considered as a lower bound of a set of processes and variables that can be employed to obtain the value and the tolerance of each DP. This domain was introduced to complete the steps of the product development process and has remained almost uninvestigated up to now.
Investigation on sustainable product design requires the collection of a variety of data related to the product life cycle. The fourth domain can become the place to organize and collect all such data that may support designers and stakeholders to make the right choice when they have to assess several alternative product solutions comparatively. Considering that all design parameters have to be instantiated in a set of real components or parts, it can be imaged that further mapping occurs between the physical domain and a domain where all the parts/components are positioned to form a product architecture. This kind of domain must be analyzed in terms of sustainability, so this domain can be called a Sustainable Domain composed of all the design components {DC}.
The number of components that constitute a design solution can be different from the number of the design parameters, just because more DPs can be merged in only one component. The investigation regarding the environmental assessment and the performance of each component and the design solution, as a whole, can be conducted on the basis of new information that must be collected in new data structures. Considering
l the number of components employed in a design solution, these data can be collected in a square matrix
l ×
l with four layers, as described in the following section, and a vector of
l elements, each one composed of seven environmental indicators (EIs), as can be seen in
Figure 2. The choice of such EIs can be adapted and tailored to the specific ambit where the product has to perform.
The possibility of investigating all aspects of the product life cycle (see
Figure 3) requires a lot of information that attain the behavior of the product during its use phase, the manufacturing process, considering materials and technologies, and the End-of-Life management.
The Need for a New Data Structure
The data structure employed in axiomatic design to describe the functionality of a product is the tree that moves from the main functionality up to the granularity that the designer recognizes as an association between functional requirements with the corresponding design parameters. This is the so-called zig-zagging decomposition. The decomposition stops when there is no need to decompose a functional requirement further.
During product design, it is not sufficient to consider only the tree structure because the designer moves further to image and conceive real product architectures where each design parameter can be recognized inside real components or parts. In order to verify whether such an idea can be considered valid, designers must sketch several attempts where design parameters are substituted with real forms or objects that perform the associated functionality. It is necessary to build a graph able to describe the real connection among the parts. To each level of decomposition, a different and detailed graph appears, where designers may verify the consistency of his/her work. This minimal graph that describes the physical connection of all components/parts of the device under development can be further enriched considering the way in which signal, materials, and energy are exchanged.
Formally, the first graph, where the interaction among components is described, is an undirected one, the interaction between components being mutual. Each flux of signal, material and energy is described by a directed graph. To control what really will happen in the device that instantiates the design parameters on which designers are working, a data structure must be built that collects all such information. The adjacency matrix associated with a graph has a dimension l × l, considering that the m design parameters can be instantiated in l components. There is not one definitive relationship between m and l because there can be several choices to be made. This particular relationship depends greatly on the design for manufacturing and assembly approach designers and stakeholders decide to implement. Frequently, more design parameters are grouped in only one component, reaching a multi-functionality.
In
Figure 4, the structure of this adjacency matrix is reported, where the nodes or components are named as capital letters.
Each off-diagonal cell is divided into four sub-cells (as an array of four positions) where data are stored. Data have different natures and refer to the links of force, signal, material, and energy that the archetypes/components exchanged among each other in the concept architecture.
Data related to functional links have to be stored according to the following rules:
In the force sub-cell, in blue, the value is Boolean, with the meaning: 1 if there is a physical connection, or otherwise 0 (or “empty”);
In the signal sub-cell, in green, the value is a number type: −1 if a signal or information is in input, 1 if it is in output, or otherwise 0 (or “empty”);
In the material sub-cell, in yellow, the value is a number type: it represents a quantity with a proper unit (e.g., g, kg, etc.); it is positive if the link is in output from the node/archetype or negative if the link is in input; it is 0 (or “empty”) if the link is not present;
In the energy sub-cell, in red, the value is a number type: it represents a quantity with a proper unit (e.g., kJ, J, etc.), and it is positive if the link is in output from the node/archetype or negative in case of link in input; it is 0 (or “empty”) if the link is not present.
In order to investigate the interaction of the device with the outside, the other two vectors have been added to the matrix and ordered as columns. In Ω1, each element is subdivided into four sub-cells and contains the same 4ple. The last column denotes “Sustainability Issues” (Ω2) and contains cells with only two slots in order to store links and quantities referring to material and energy; data follow the rules for these. It reports the quantity of energy that is lost and materials that are wasted.
Assembling such elements, the l × (l + 2) matrix called the Sustainability Matrix is obtained where l + 1 columns have four sub-cells and the last one only has two sub-cells.
The diagonal cells, typically unemployed in an adjacent matrix, can be filled with a set of parameters describing the nature of each component, collecting information from which the impact of the device on the environment during its use, the relation to materials and technologies employed, and the End-of-Life policy can be quantified.
In this proposal, a set of seven environmental indicators have been selected. The choice is not unique and may be tailored to the peculiar nature of the device to be designed. All such considerations must not be limited to the assessment of a unique design solution but as a means by which to compare several alternatives. Therefore, what we are discussing here is how to organize and collect data. A further step will be required to compare all the design solutions with each other.
The indicators give essential information that allows identifying and quantifying the environmental impact of each specific component related to the typical phases of the life cycle, in particular: “Raw material”, “Manufacturing”, “Transportation”, “Use”, and “End-of-Life”. Generally, researchers choose the number of indicators on the basis of the aim of the specific investigation.
The indicators were limited to seven in the present analysis and selected as a good trade-off among relevance in the literature and acceptance in the scientific community, availability of data, associability of each of them with one lifecycle phase and being easy to handle. Furthermore, they were chosen as they are quantitative values that can be obtained from appraisable or computable data and are available in the design process. Obviously, this is not the only choice of indicators, and this may differ when changing the kind of product under examination.
Although some of them are present in different eco-design methodologies, they are used jointly here in order to evaluate a product concept from a life cycle perspective, as reported in
Table 1. They include:
Mass (M). This value indicates the amount of material used for the creation of a component. In the design phase, it can be determined, for example, by calculating the volume of the CAD model and multiplying this by the density of the material that will be employed, and measuring the values obtained in [kg], [g], etc.;
The presence of hazardous substances (HS). This represents the number of hazardous substances that may be present in a component, such as a PCB. Generally, it is measured in [g] or submultiples;
Global warming potential (GWP). It indicates the potential contribution to the greenhouse effect (GHG) due to emissions of substances employed for obtaining the raw materials chosen for the creation of the component. In practice, the unit used in measurement is [kg CO2eq] generally obtained by means of LCA;
Impact indicator in the manufacturing phase (IM). This measures the environmental impact for the creation of each component that will be developed from the archetype. It takes into account the impact of the material along with all processes of production that can be hypothesized in order to create the component. This indicator can be expressed, according to one of the LCIA methods, for example, in [mPts] (millipoints Eco-Indicator 99);
Indicator of transport (TR). This measures the distance [km] from the sources of raw materials of the manufacturing plant, or in the case of the component supplied, it indicates the distance from sources of supply (finished or semi-finished product) to the assembly plant;
Indicator of power during use (PU). Indicates the maximum power that can be employed by the element represented by the archetype. It refers typically to generators and engines (in many cases, it is a technical detail) and is measured in [W] and multiple;
Not recyclable fraction (NRF). This indicator is the amount of material assumed not to be recyclable in a component. It is calculated as an amount (in [kg], or [g]), or as a ratio: the weight of the material that cannot be recycled compared to the total mass of the component. In any case, preliminarily, one of these two ways must be chosen in order to perform a pairwise comparison.
At this stage of the design, when the product definition is not yet definitive, indeed it is often only a draft, many of these indicators are estimated at times in a rough way, but in any case with tools that are now in common use. For commercial components, much of the data can be deduced from the technical documentation. Regarding new components, some indicators can be deduced once a model, even a rough one, has been created with a CAD modeler. From the 3D model, it is possible to estimate the weight, for example, but also some quantities such as the GWP, since now many CADs have simplified LCA tools in bundle (e.g., as created by the Eco Material Advisor and its evolution).
3. Case Study
In order to explain how the methodology can be employed during product development, a case study is focused on the design of an orange juicer. The analysis is carried out on the concept shown in
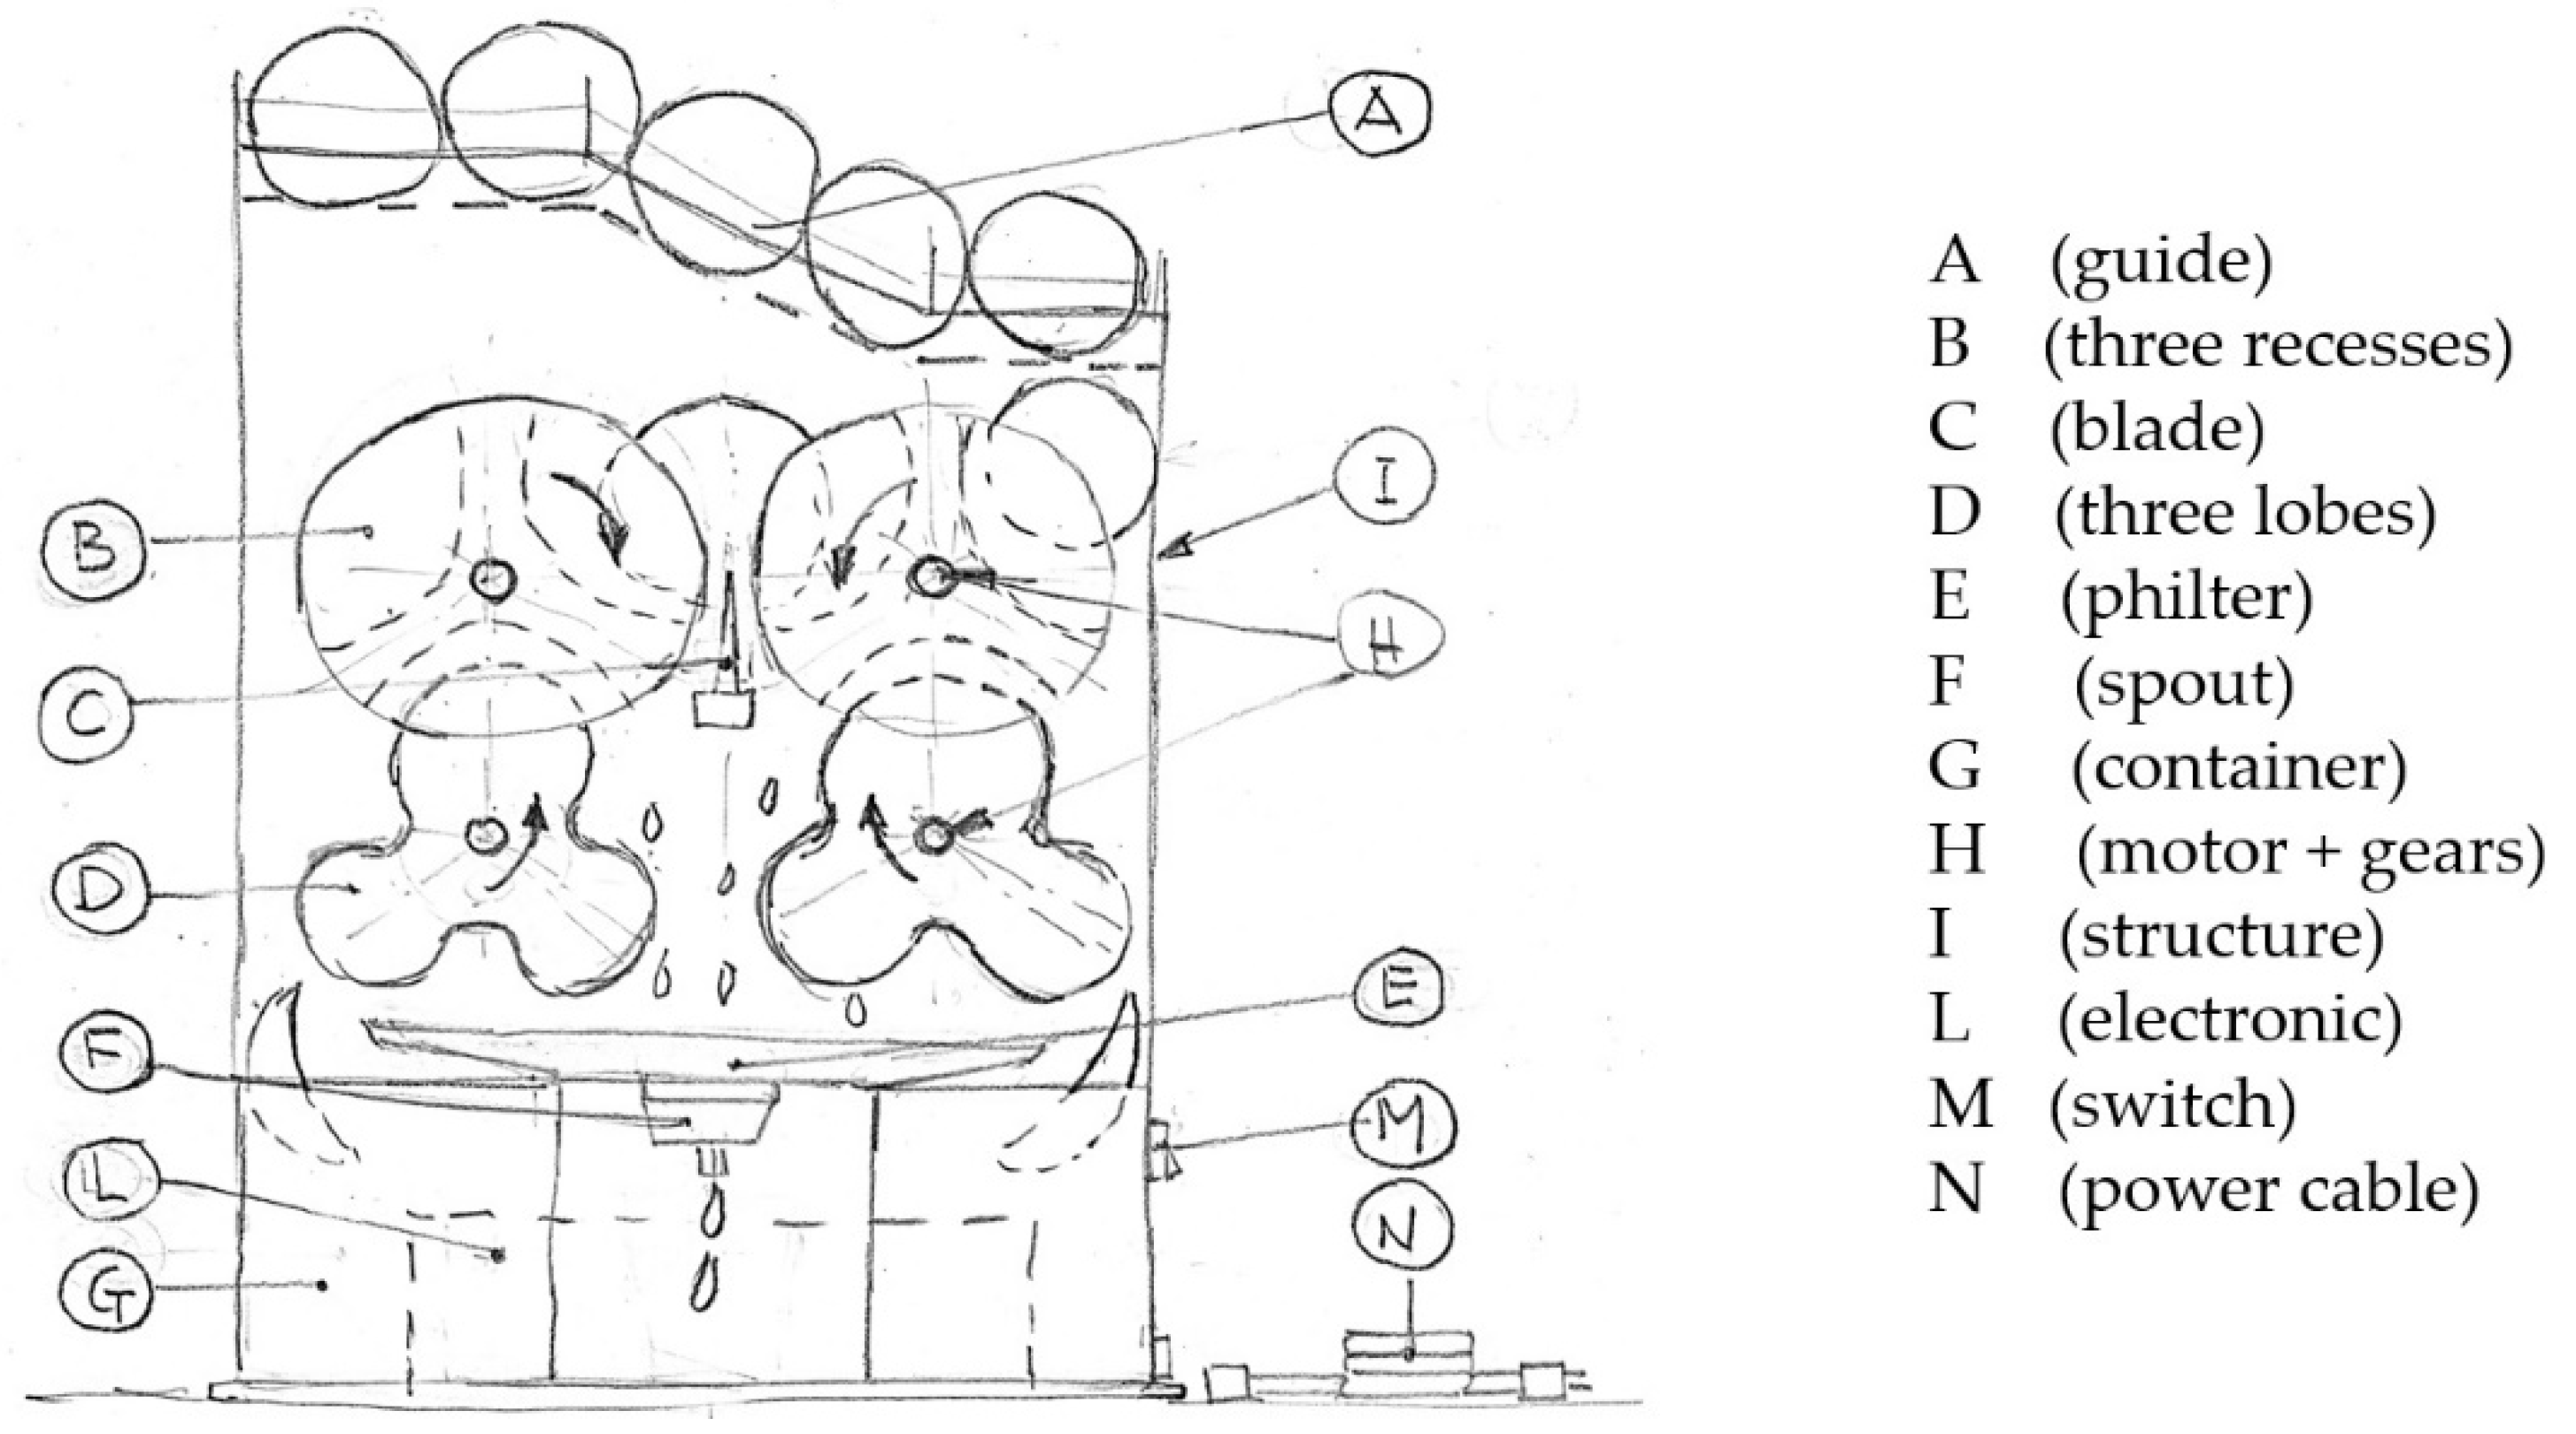
Figure 5, which has been developed with a certain degree of detail. In this, each capital letter indicates a component or a part of the device. The device has certain popularity, being conceived for community or public premises, and it is a completely automated device.
It has been conceived for obtaining a high volume of juice. A number of oranges are put on the upper side of the device, from which they are guided [A] toward a side where one orange at a time drops in the device. Each orange is trapped between two recesses [B], guided towards a blade [C] that divides it into halves, each one crushed by the lobes [D]. Each half of squeezed orange falls into its peel container [G], and the mixture juice-pulp falls down towards a filter [E], which separates the juice from seeds or other wastes. Then the juice is obtained by means of a spout [F].
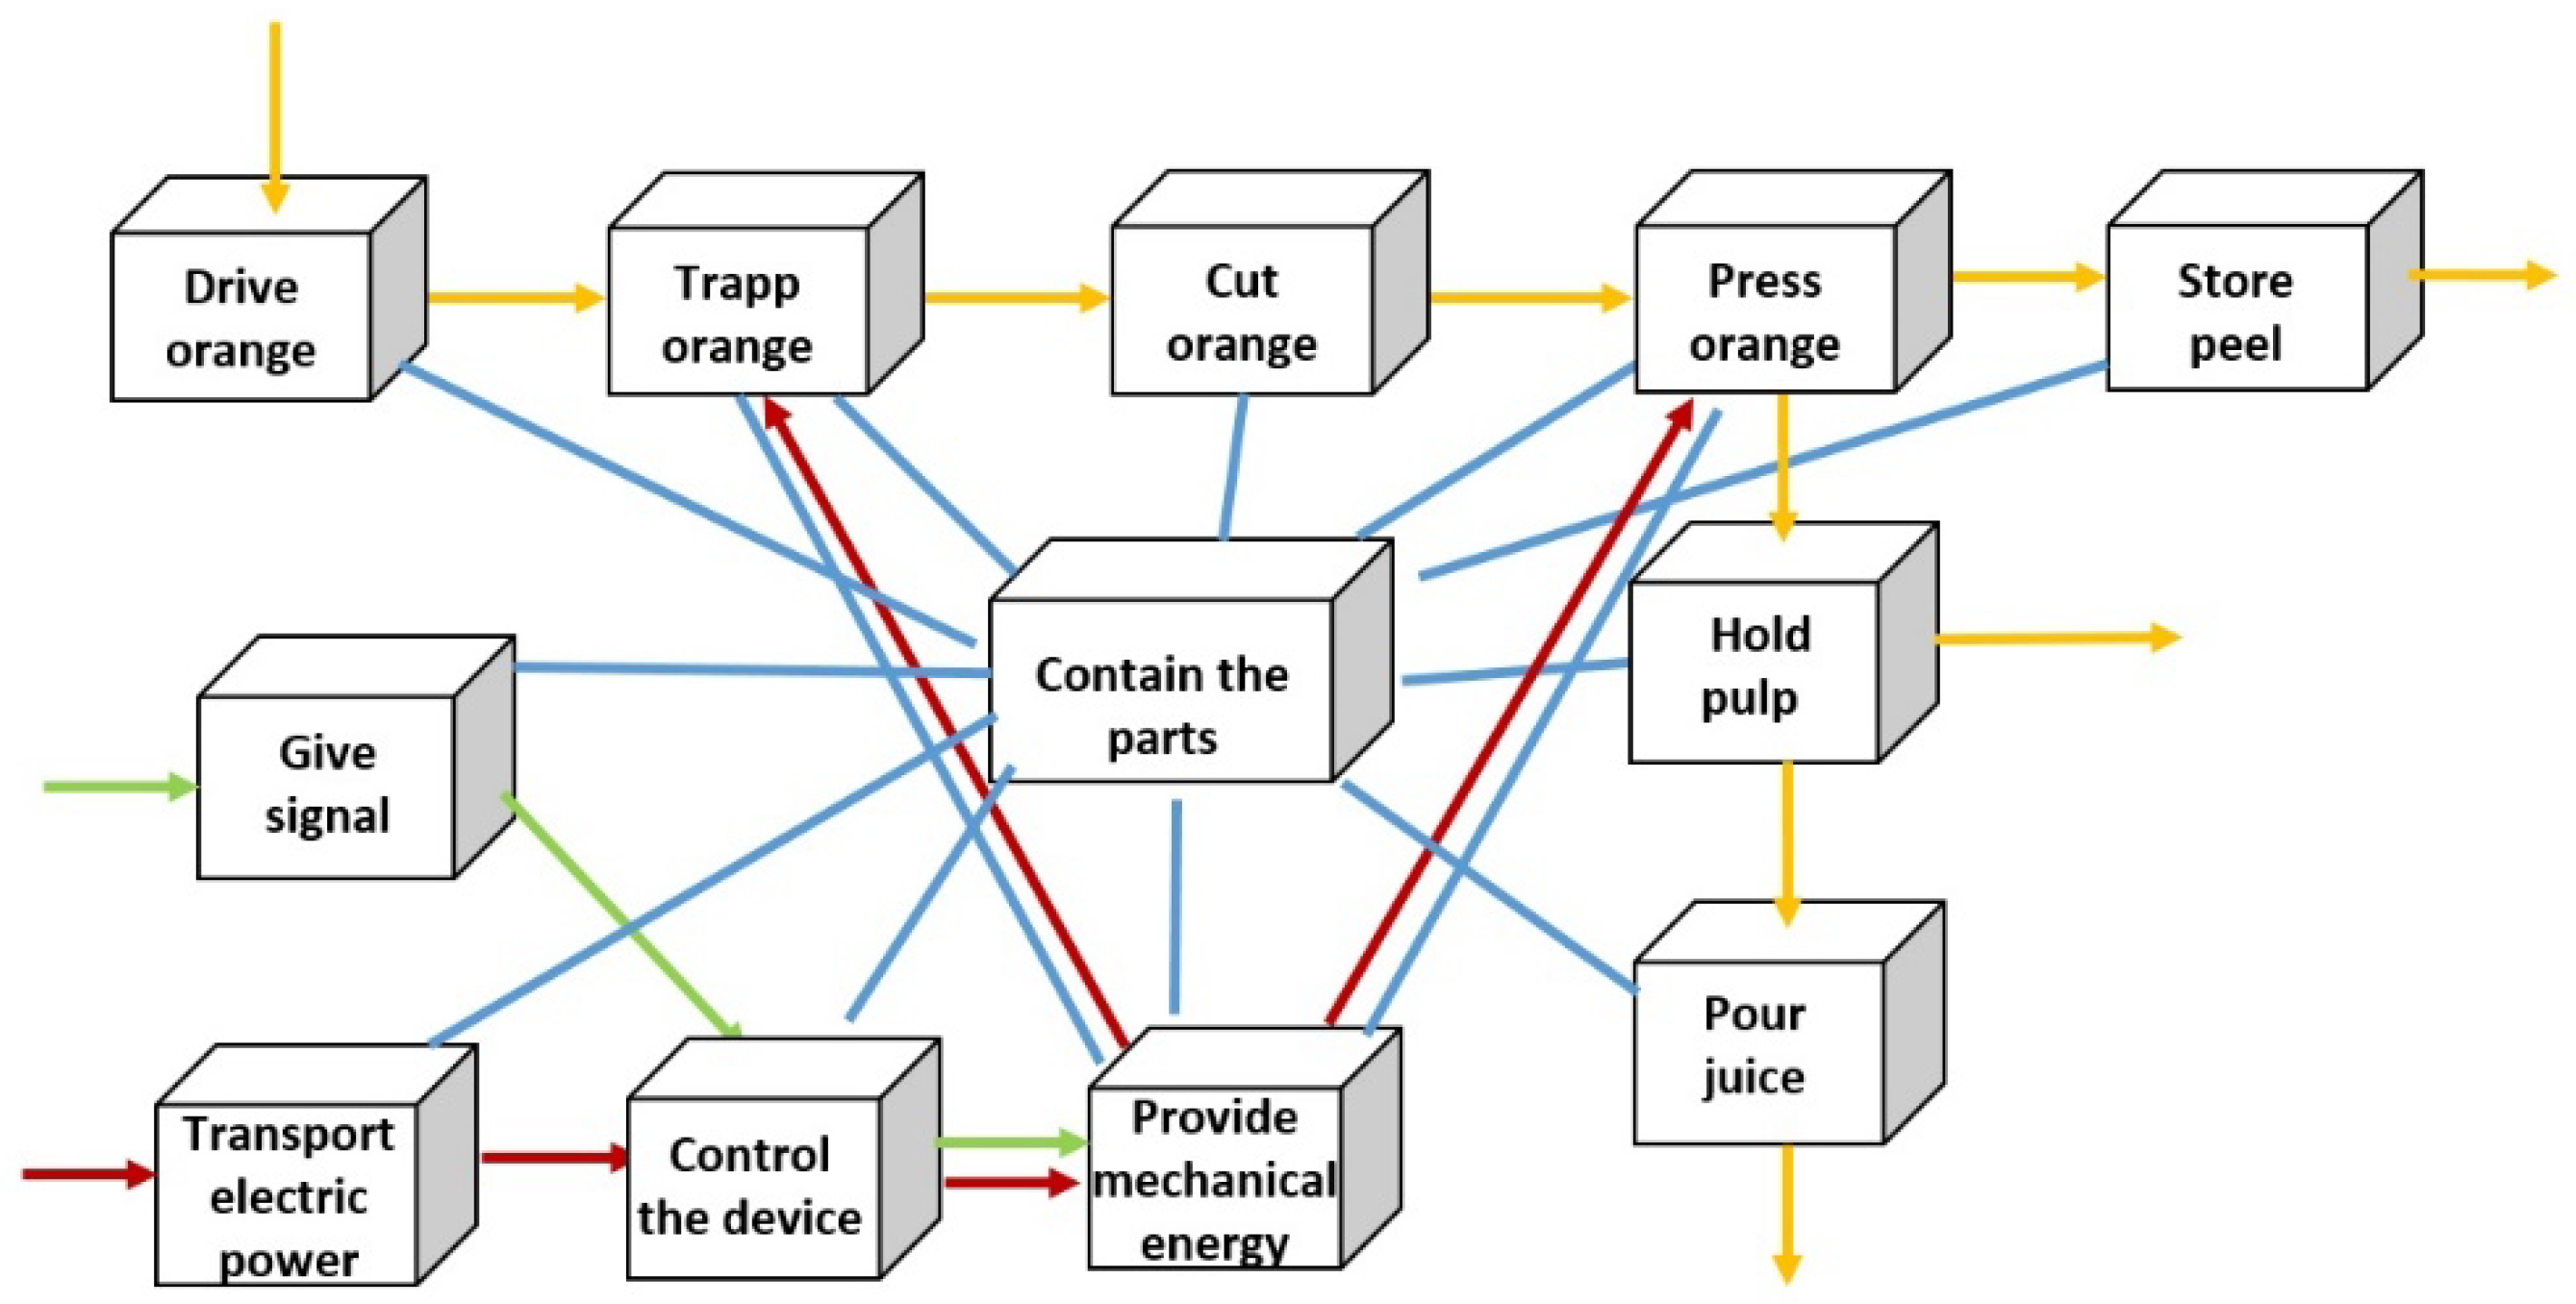
Figure 6 describe the tree of functional decomposition. In it appears the first functions that must be pursued. Only the first level of decomposition has been used; each function would require finer description.
Figure 7 represent the graph of these functions, which has the main task to describe the interconnections between them in terms of force, signal, material, and energy links.
This kind of graph is the first step towards the building of an architecture and tries to depict which kind of relation should be present inside the product in the development phase. In
Figure 5, a preliminary sketch of a possible product instantiates the functions in real components where the design parameters should perform and allow control of the related functionality. In it, a set of other components appear that complete the architecture and that allow the device to operate. Structure [I] contains all components and an electro-mechanical group [H] that provides suitable energy. The device operability is controlled by an electronic board [L] activated by a switch [M]. The connection with the power line is facilitated by a connector [N].
Figure 8 translate the graphs of
Figure 7 in the context of the physical domain and substitutes the functional requirements with the components that perform those functionalities.
Figure 8a describe how the components must interact with each other, and each blue line represents a physical connection between two components. The blue link represents a physical joint as force or torque. This second one is present in the connection between H-B and H-D, where the rotation is transferred synchronously to lobes and recesses.
Figure 8b depict the flow of signal, material, and energy. Observing both figures conjointly, a designer can identify if some mistakes have been made in the conception of the solution. If, for example, a link of mechanical energy is present without the corresponding link of force.
Table 2 collect the instantiation of the design solution sketched in
Figure 5 with the functionalities that emerged in the functional tree of
Figure 6 and the graphs shown in
Figure 7 and
Figure 8. Each line associates the FR (classified with a number as in the tree) with the function expressed by the verb + noun couple. Then the function is performed by an archetype, which reports the quantity and the design parameter able to perform it. The latter is classified as the corresponding DP. For example, FR8 (Provide mechanical energy) is performed by an electric motor and a set of gears (not well specified at this level). The associated design parameter may be the power of the motor or the rotation of the gears, which will be named DP8.
This association FR-DP must be checked in terms of the design matrix. At this level of decomposition, the form of this matrix in this specific case is diagonal, and no problems are found in terms of axiomatic design. The first axiom of independence is satisfied. Obviously, deeper investigation to some zones of the device will require more levels of decomposition and detail, with the individuation of more than only one parameter and the need for a check in terms of satisfaction of this axiom.
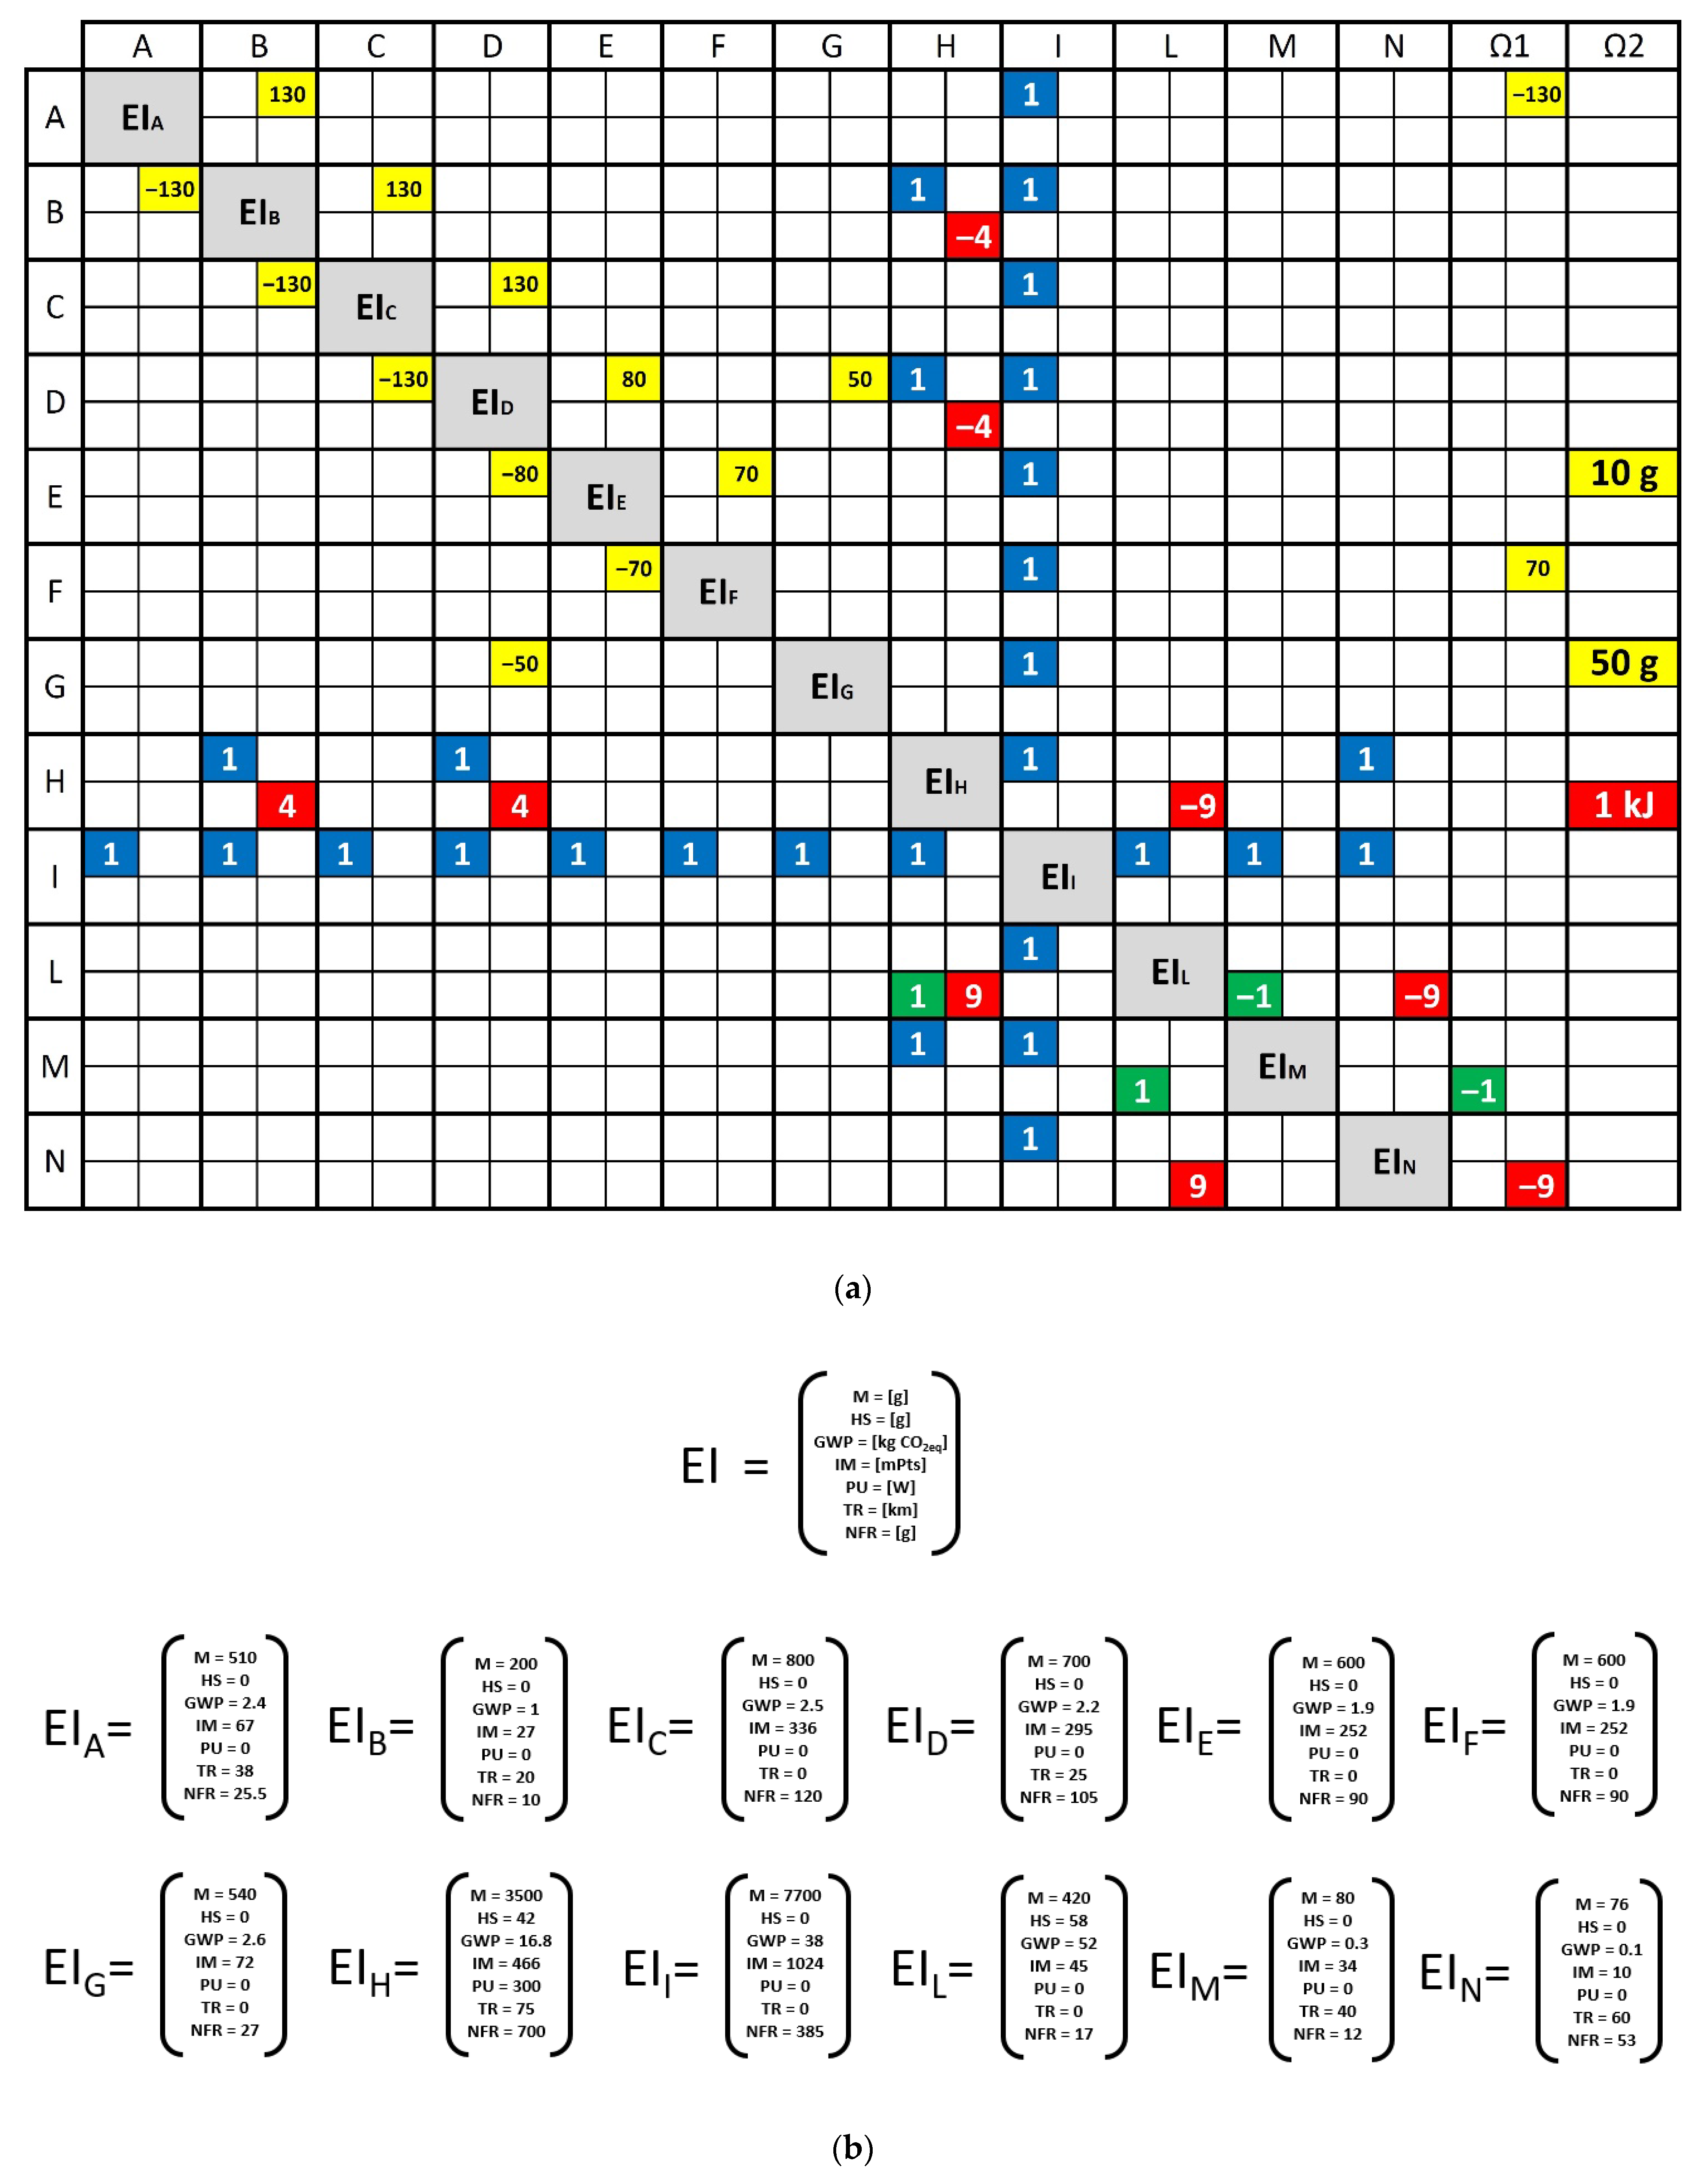
Figure 9a represent the
Sustainability Matrix described in
Section 2 with the sub-cells colored and filled with the value of interest for the sustainability assessment of the device. The contact of force is verified by the corresponding sub-cells filled in blue and marked with 1. The position of these cells is symmetrical due to the concept of mutual interaction among the components.
The signal link involves the actuation of the device, imagining someone acting on the switch (M) that allows the PCB (L) to provide energy to the electro-mechanical component (H).
The energy link originates from the outside (N) that supplies the PCB (L). After the activation by (M), the electric motor and gear (H) start to move. During functioning, it is reasonable to consider that nearly 10% is dissipated towards the outside, registered in column (Ω2). The same amount of energy is spent by (B) and (D) to squeeze the orange.
The material link describes the operation of squeezing. When started, the device grasps an orange in (B), and both recesses guide the orange toward the blade (C), which divides the fruit into two halves, each squeezed with the mutual action of recesses (B) and lobes (D). Each of the halves of squeezed oranges drops into the container (G) while the majority of the juice drips toward the filter (E) and the spout (F). From the original mass of 130 gr, 50 gr of peel and 10 gr of seeds are registered in column (Ω2), while the amount of 70 gr of juice is obtained and registered in (Ω1).
Following the flows registered in the sub-cells involved, it is possible to verify the functioning of the device. Synthetically the matrix allows the necessary set of data to be collected.
Figure 9b represent the
l diagonal terms of the adjacency matrix
l ×
l. Each diagonal term is a vector of seven positions structured as a collection of different data, as reported in
Table 1. For each component, the environmental indicators are evaluated. For example, for the component H (motor and gear) a mass of 3500 gr, an amount of 42 gr of hazardous materials, 16.8 kg CO
2eq as GWP, and 466 mPts of impact in manufacturing (IM) is reported, all a result from an LCA analysis. Then 300 W of power in use, 75 km of transportation, and 700 gr of not recyclable fraction. These data may be used as in
Section 4.
4. Results
The main task of this methodology consists in extending the solid theoretical framework of the axiomatic design up to the environmental assessment of a product in the phase of development.
The information collected in the
Sustainability Matrix allows the designer and stakeholders to reach a rough assessment of the device in which they are involved. First of all, the off-diagonal cells of the
l ×
l part contain information on the real functioning of the device. A check from these data and the graphs reported in
Figure 8a,b allow verification of whether the connection among components is well suited; otherwise, a modification on the architecture is mandatory.
The environmental assessment can start collecting data for each of the life cycle phases depicted in
Figure 3.
Raw material and Production phases obtain information from the EIs collected in the diagonal cells, according to
Table 1.
The Use phase is described by the interaction among components stored in the off-diagonal cells. From the values stored, it is possible to follow the device behavior checking the flux of material and energy. These data describe not only what happen inside the device but also what are the exchanges with the outside. The cells of the last column of the Sustainability Matrix store the energy dissipation and material wastes that occur in the design solution. These amounts can suggest whether device functionality is suitable to the design intent.
In addition, the End-of-Life phase obtains information from the specific EIs collected in the diagonal cells, according to
Table 1.
This collection of data may be used to improve a single solution, considering that in many cases, the design task is to upgrade a previous product already well accepted on the market, on which firm or enterprise would like to hint to their client about a new more “eco-friendly” version. Furthermore, designers can be urged to propose many alternatives, and, in this case, it is necessary to have a tool to answer which can be considered the best. In any case, the basic role of the axioms of ADM cannot be forgotten and how their satisfaction can guide the designer towards the identification of the best choice that includes environmental assessments.
4.1. Improving a Single Solution
Analyzing the interaction among the components, the way in which the fluxes operate is clear. Designers can check whether the architectural solution is really so advantageous in terms of dissipation of energy and material. The environmental indicators collected in the diagonal cells can also suggest whether the components employed are really good in terms of sustainability or whether it would be better to introduce alternatives. This requires a check on the architecture and the connection between the components.
4.2. Comparison among Several Solutions
After having conceived alternative solutions to a problem, a pairwise comparison can give information on which design solution would be better to invest in. The comparison can be made on each environmental indicator considering that the EIs employed in
Table 1 are defined in a sort of the “lower the better” law, and an algorithm could be implemented able to differentiate among all the alternatives, ordering them in an increasing order and establishing a ranking among them.
The authors have suggested an algorithm [
22] here to put in evidence the strength and weakness points of each design solution, from which the designer can modify those aspects that heavily have an impact on the environment.
4.3. The Role of 1st and 2nd Axioms
The proposed methodology continues to take advantage of the original formulation of the axiomatic design model. The axiom of independence must be continuously verified in order to guarantee that the design parameters identified in the solution are able to control product functionality. The axiom of information can be more easily verified if a robust design analysis is performed. Designing experiments by means of the Taguchi method, the impact of each environmental indicator can be associated with the general performance of the device, and the trend of bias between design range and system range can be taken under control. Following the loss function “lower the better” designers can reach more sensibility in the search for solutions that have reduced impact on the environment.
5. Discussion
The enrichment of the axiomatic design model with the introduction of the sustainable domain gives the designer a tool that allows him/her to follow the whole design process till the environmental assessment.
The mapping from one domain to the other can be seen as moving backwards and forward till the environmental assessment of a design solution, and a moving backwards can suggest after verification that a solution, even if good in terms of functionality, must be further improved from the environmental point of view.
Reconsideration can be made up to a reexamination of the functional requirements. Obviously, if designers and stakeholders have already started the initial discussion adopting a “green thought”, all solutions may have a better starting point. In any case, an assessment of the validity of each solution is mandatory, and this can be made by reasoning on the data collected in the Sustainability Matrix.
Some authors introduced a similar re-exam but limited to the first relation FR-DP [
8,
9,
12,
15,
16,
17]. Others have identified some FRs and DPs by means of QFD [
13,
14], differentiating them in their position in the design matrix. Some others [
12,
18,
19] addressed the eco-design by means of an a-posteriori environmental assessment.
The opinion of the present authors is that without taking into account how a design parameter can be instantiated in a device by means of a suitable component, it is not possible to have a minimal quantification of its impact on sustainability.
The red lines moving backwards, as depicted in
Figure 10, have the meaning of greater strength in the research for a greener device or solution, identifying new design parameters on new components.
In any case, the whole structure of the adjacency matrix must be checked, and the fluxes must be updated accordingly.


