Article

Parameter Estimation-Based Slime Mold Algorithm of Photocatalytic Methane Reforming Process for Hydrogen Production

1
College of Engineering at Wadi Addawaser, Prince Sattam Bin Abdulaziz University, Al-Kharj 11911, Saudi Arabia
2
Computers and Automatic Control Engineering Department, Faculty of Engineering, Tanta University, Tanta 31733, Egypt
3
Renewable Energy Engineering Department, Faculty of Engineering, Amman Arab University, Amman 11953, Jordan
*
Author to whom correspondence should be addressed.
Sustainability 2022, 14(5), 2970; https://doi.org/10.3390/su14052970
Submission received: 10 February 2022 / Revised: 25 February 2022 / Accepted: 1 March 2022 / Published: 3 March 2022

Abstract

:
The key contribution of this paper is to determine the optimal operating parameters of the methane reforming process for hydrogen production. The proposed strategy contained two phases: ANFIS modelling and optimization. Four input controlling parameters were considered to increase the hydrogen: irradiation time (min), metal loading, methane concentration, and steam concentration. In the first phase, an ANFIS model was created with the help of the experimental data samples. The subtractive clustering (SC) technique was used to generate the fuzzy rules. In addition, the Gaussian-type and weighed average were used for the fuzzification and defuzzification methods, respectively. The reliability of the resulting model was assessed statistically by RMSE and the correlation (R2) measures. The small RMSE value and high R2 value of testing samples assured the correctness of the modelling phase, as they reached 0.0668 and 0.981, respectively. Based on the robust model, the optimization phase was applied. The slime mold algorithm (SMA), as a recent as well as simple optimizer, was applied to look for the best set of parameters that maximizes hydrogen production. The resulting values were compared by the findings of three competitive optimizers, namely particle swarm optimization (PSO), Harris hawks optimization (HHO), and evolutionary strategy HHO (EESHHO). By running the optimizers 30 times, the statistical results showed that the SMA obtained the maximum value with high mean, standard deviation, and median. Furthermore, the proposed strategy of combining the ANFIS modelling and the SMA optimizer produced an increase in the hydrogen production by 15.7% in comparison to both the experimental and traditional RSM techniques.

1. Introduction

Rapid technological advances and population growth have resulted in the heavy usage of fossil fuels. Such fossil fuels are not only fluctuating in price and are limited resources, but they are also having severe environmental impacts that are clearly seen in global warming and health issues [1,2]. Hydrogen energy is a clean fuel with a high gravimetric energy density that can be obtained from several abundant resources, such as water and biomass [3,4]. Recent progress in fuel cells, which is one of the efficient energy conversion devices with low or no environmental impacts [5,6], has resulted in more attention being paid to hydrogen production. Hydrogen fuel cells can be used in the transportation sector, thus eliminating one of the main pollution sources [7,8]. Additionally, hydrogen fuel cells can be used at a large scale in power generation and power plants [9,10] or internal combustion engines [11,12]. High purity hydrogen can be obtained from water using renewable energy sources such as solar energy [13,14], geothermal energy [15,16], and wind energy [17,18]. Although high purity of hydrogen is obtained by water electrolysis, it challenges the high cost compared with steam reforming, which is known as the cheapest method used for hydrogen production on the commercial scale [19,20]. Currently, steam reforming is used for converting methane and other hydrocarbons into hydrogen on the surface of a catalyst [21,22]. The steps in the production of hydrogen from steam reforming can be expressed by the following equations [23]:
Steam methane reforming reaction:
C H 4 + H 2 O                                                                       C O + 3 H 2                                                                   Δ H 298 K = 206   kJ / mol                            
Water–gas shift reaction:
C O + H 2 O                                                                       C O 2 + H 2                                                                           Δ H 298 K = 41   kJ / mol                            
The overall reaction:
C H 4 + 2 H 2 O                                                                       C O 2 + 4 H 2                             Δ H 298 K = 165   kJ / mol                                      
As can be seen from the reactions, the overall process is an endothermic reaction that requires the supplying of energy to the system. The current energy is used from fossil fuel sources, which have high environmental impacts. Securing the energy required for steam reforming from renewable energy sources will save the environment [24]. Among the different renewable energy sources, solar energy is abundant, has low environmental impacts [25], and can be produced at a large scale [26].
Recently, photocatalytic steam reforming has come to be considered as a promising route for hydrogen production [27,28,29]. There are several factors affecting hydrogen production in photocatalytic steam reforming, such as the intensity of the solar radiation, type and amount of the active photocatalyst, time of the irradiation, the methane to steam ratio, etc. Optimizing such parameters will play a significant role in maximizing the hydrogen yield and thus in considering this method for commercial hydrogen production.
Experimental methods are time-consuming and expensive and cannot be done if the number of trials is too large. Physical and mathematical methods can instead fulfill the purpose. However, they are sometimes based on assumptions that are not accurate. Due to the difficulties that can be encountered in conducting real-time experiments to collect more data, some modelling techniques can be a part of the solution. However, if the model is not accurate and robust enough, it will not be reliable and can produce faulty results. Accordingly, the choice of the modelling tool plays a vital stage in this process. Recently, artificial intelligence (AI) has been used in this field, and its high efficiency has been proven relative to the other traditional methods, especially for modelling complex and nonlinear systems. There are many AI modelling tools, such as Artificial Neural Networks (ANN), Regression Support Vector Machine (RSVM), Fuzzy Logic (FL), etc. Unfortunately, ANN still suffering from identifying the proper architecture. Despite many research papers trying to propose suitable numbers for the network’s hidden layers and the neurons in every layer, they cannot give a concrete answer. Similarly, RSVM needs fine-tuning to the controlling constants such as the regularization constraint and the slake variable. Yet, FL is still occupying an outstanding position among other modelling techniques. This can be noticed from the increasing number of applications in many disciplines, including engineering fields. The Adaptive Network-based Fuzzy Inference System (ANFIS) model is one of the fuzzy modelling tools. It combines the concepts of both FL and ANN in a single structure. This motivates the authors to apply the ANFIS in constructing the model of the current bio-hydrogen production system.
The major contributions of the current research work can be stated as follows:
  • A consistent ANFIS model was established based on measured data of the photocatalytic methane reforming process for hydrogen production.
  • A new application of the slime mold algorithm was suggested to find the optimum values of irradiation time, metal loading, methane concentration, and steam concentration.
  • Hydrogen production was boosted.

2. Experimental Work

La-TiO2 was prepared using the wet impregnation method [30]. Typically, TiO2 is purified by calcination in an oven for three hours at 300 °C (10 °C/min). The impregnation of the La was performed by thorough mixing of an appropriate amount of La(NO3)3.6H2O dissolved in 45 cm3 of water (deionized) to the calcined TiO2 using a magnetic stirrer for 3 h at room temperature (25 °C). Then, the slurry obtained from the previous step was dried at a temperature of 100 °C for 12 h followed by calcination at 800 °C for 3 h. The setup used for hydrogen production using photocatalytic steam reforming is shown in Figure 1. As can be seen in the figure, the catalyst of La/TiO2 (100 mg of definite composition in each run) was loaded in a quartz tube of an inner diameter of 5 mm and a 67 mm length. The solar effect was obtained by exposing the catalyst in the quartz tube to a UV light source (300 W mercury lamp), and the whole photocatalytic part was covered to avoid an external source of light. The methane (CH4 of 99.999% purity) was flowed after mixing with N2 (99.999) carrier gas and dry steam into the photocatalytic reactor, as shown in Figure 1. The flow-rate of methane and N2 was controlled using a precise mass flow-rate, while the flow-rate of the dry steam was controlled using a microprocessor digital meter. The composition of the produced gas, i.e., unreacted methane, hydrogen, CO, and CO2, were analyzed using gas chromatography [31].
The following parameters were investigated: loading of La on the surface of the TiO2 (1–3%), methane content (10–50%), photo-irradiation time (10–150 min), and dry steam content (0.5–1.5%).

3. Proposed Methodology

In the current research work, the proposed methodology contained two phases: ANFIS-based modelling, and optimization.

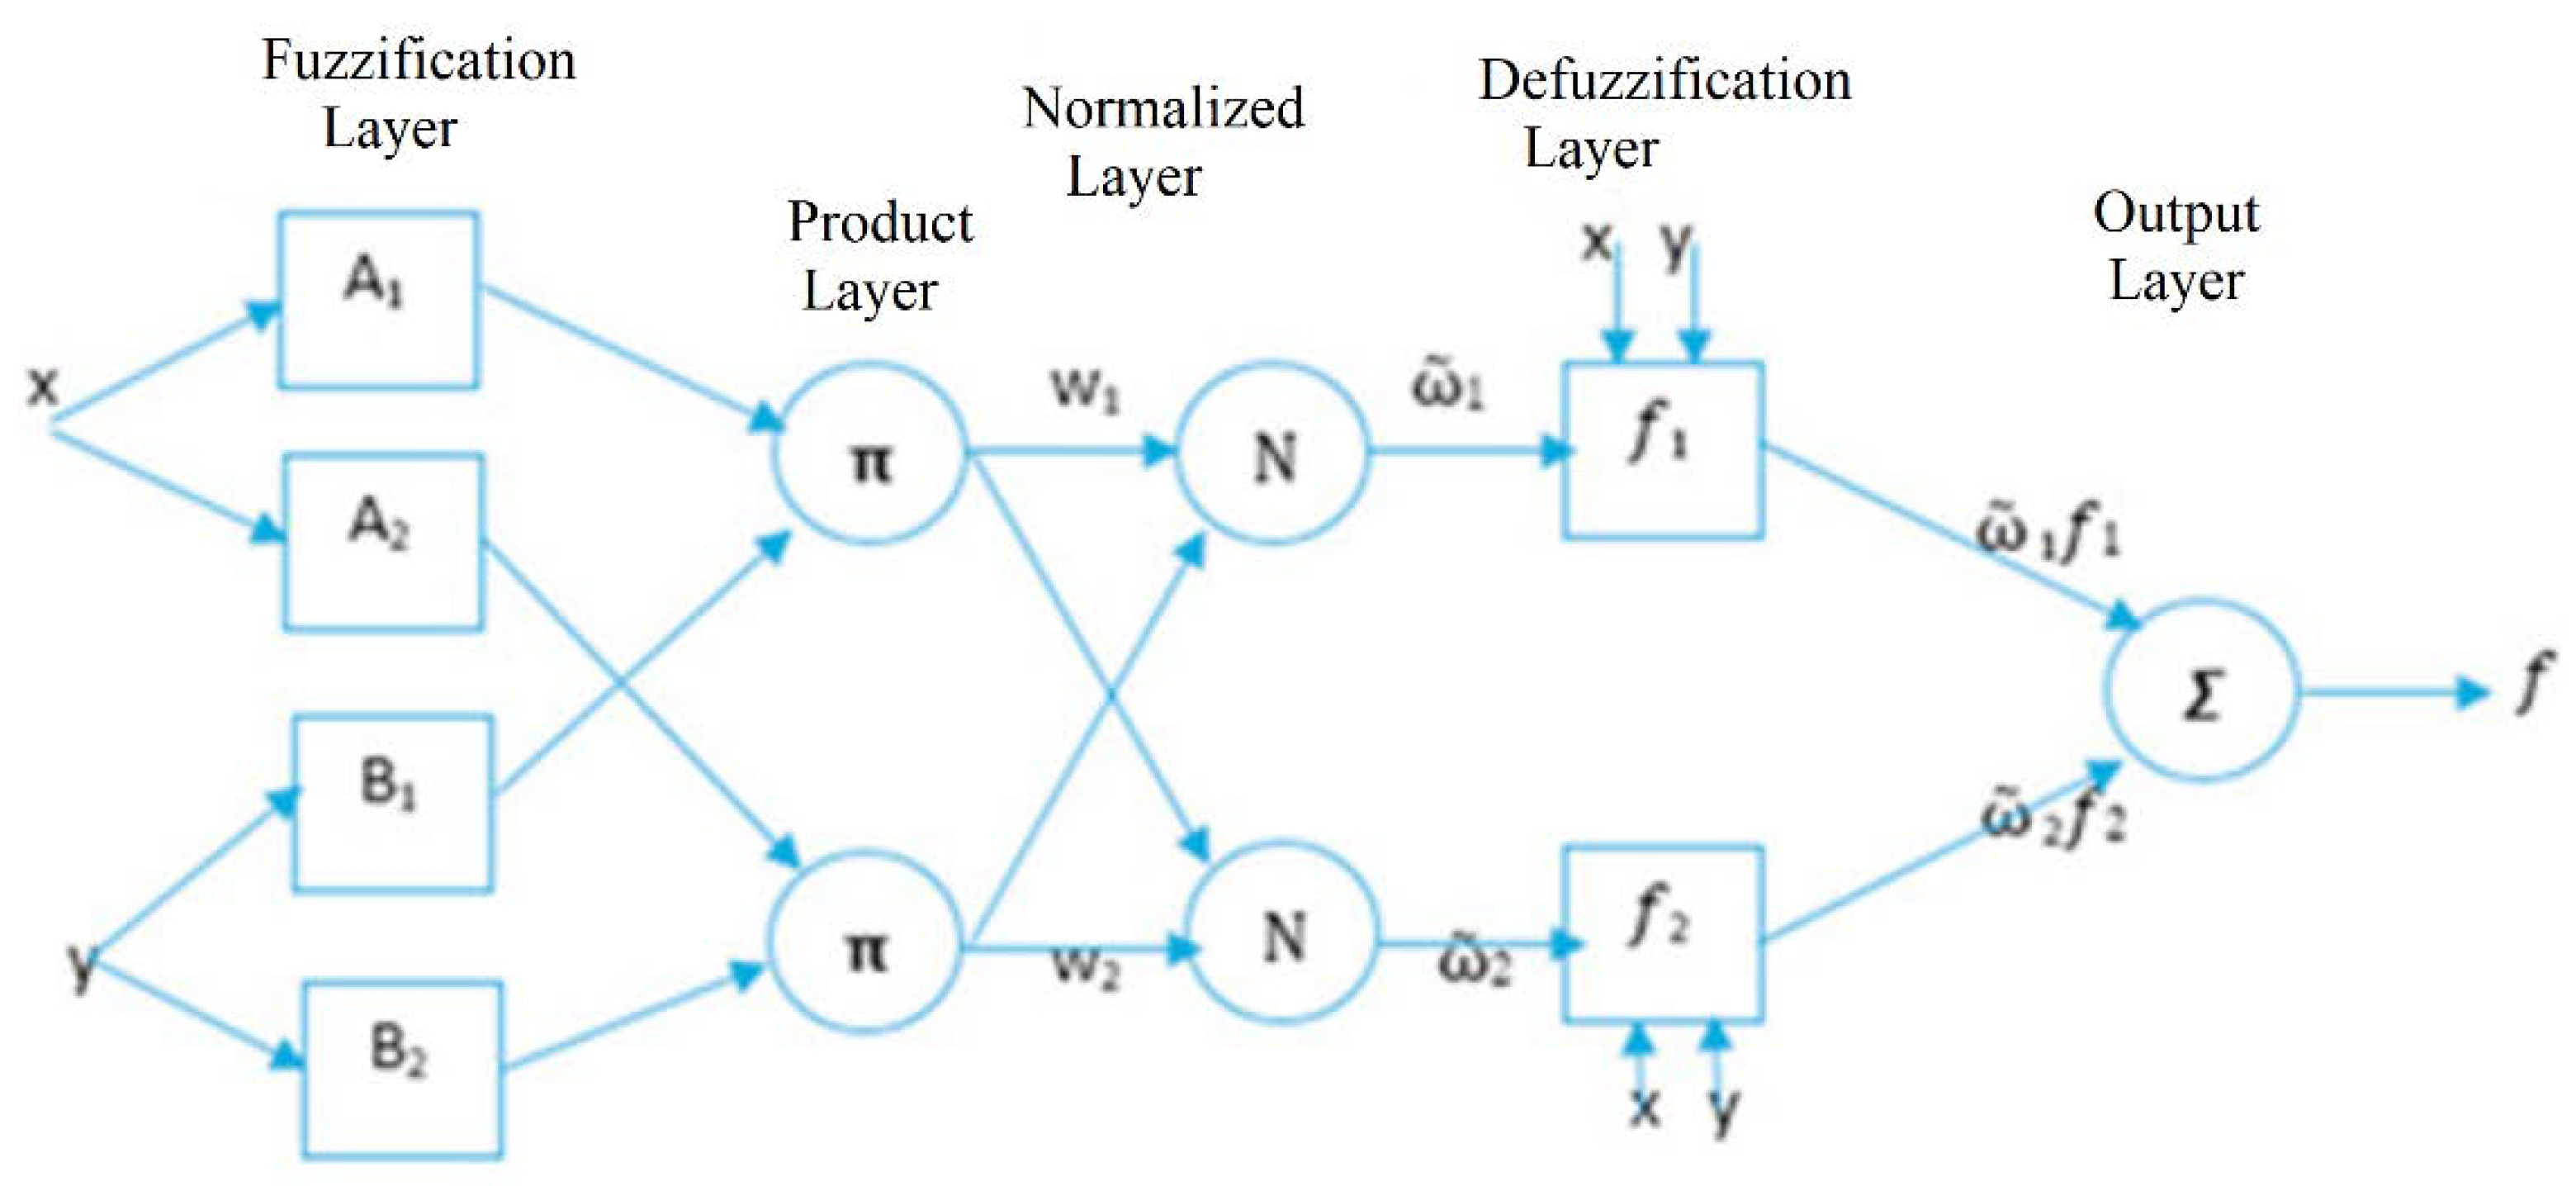
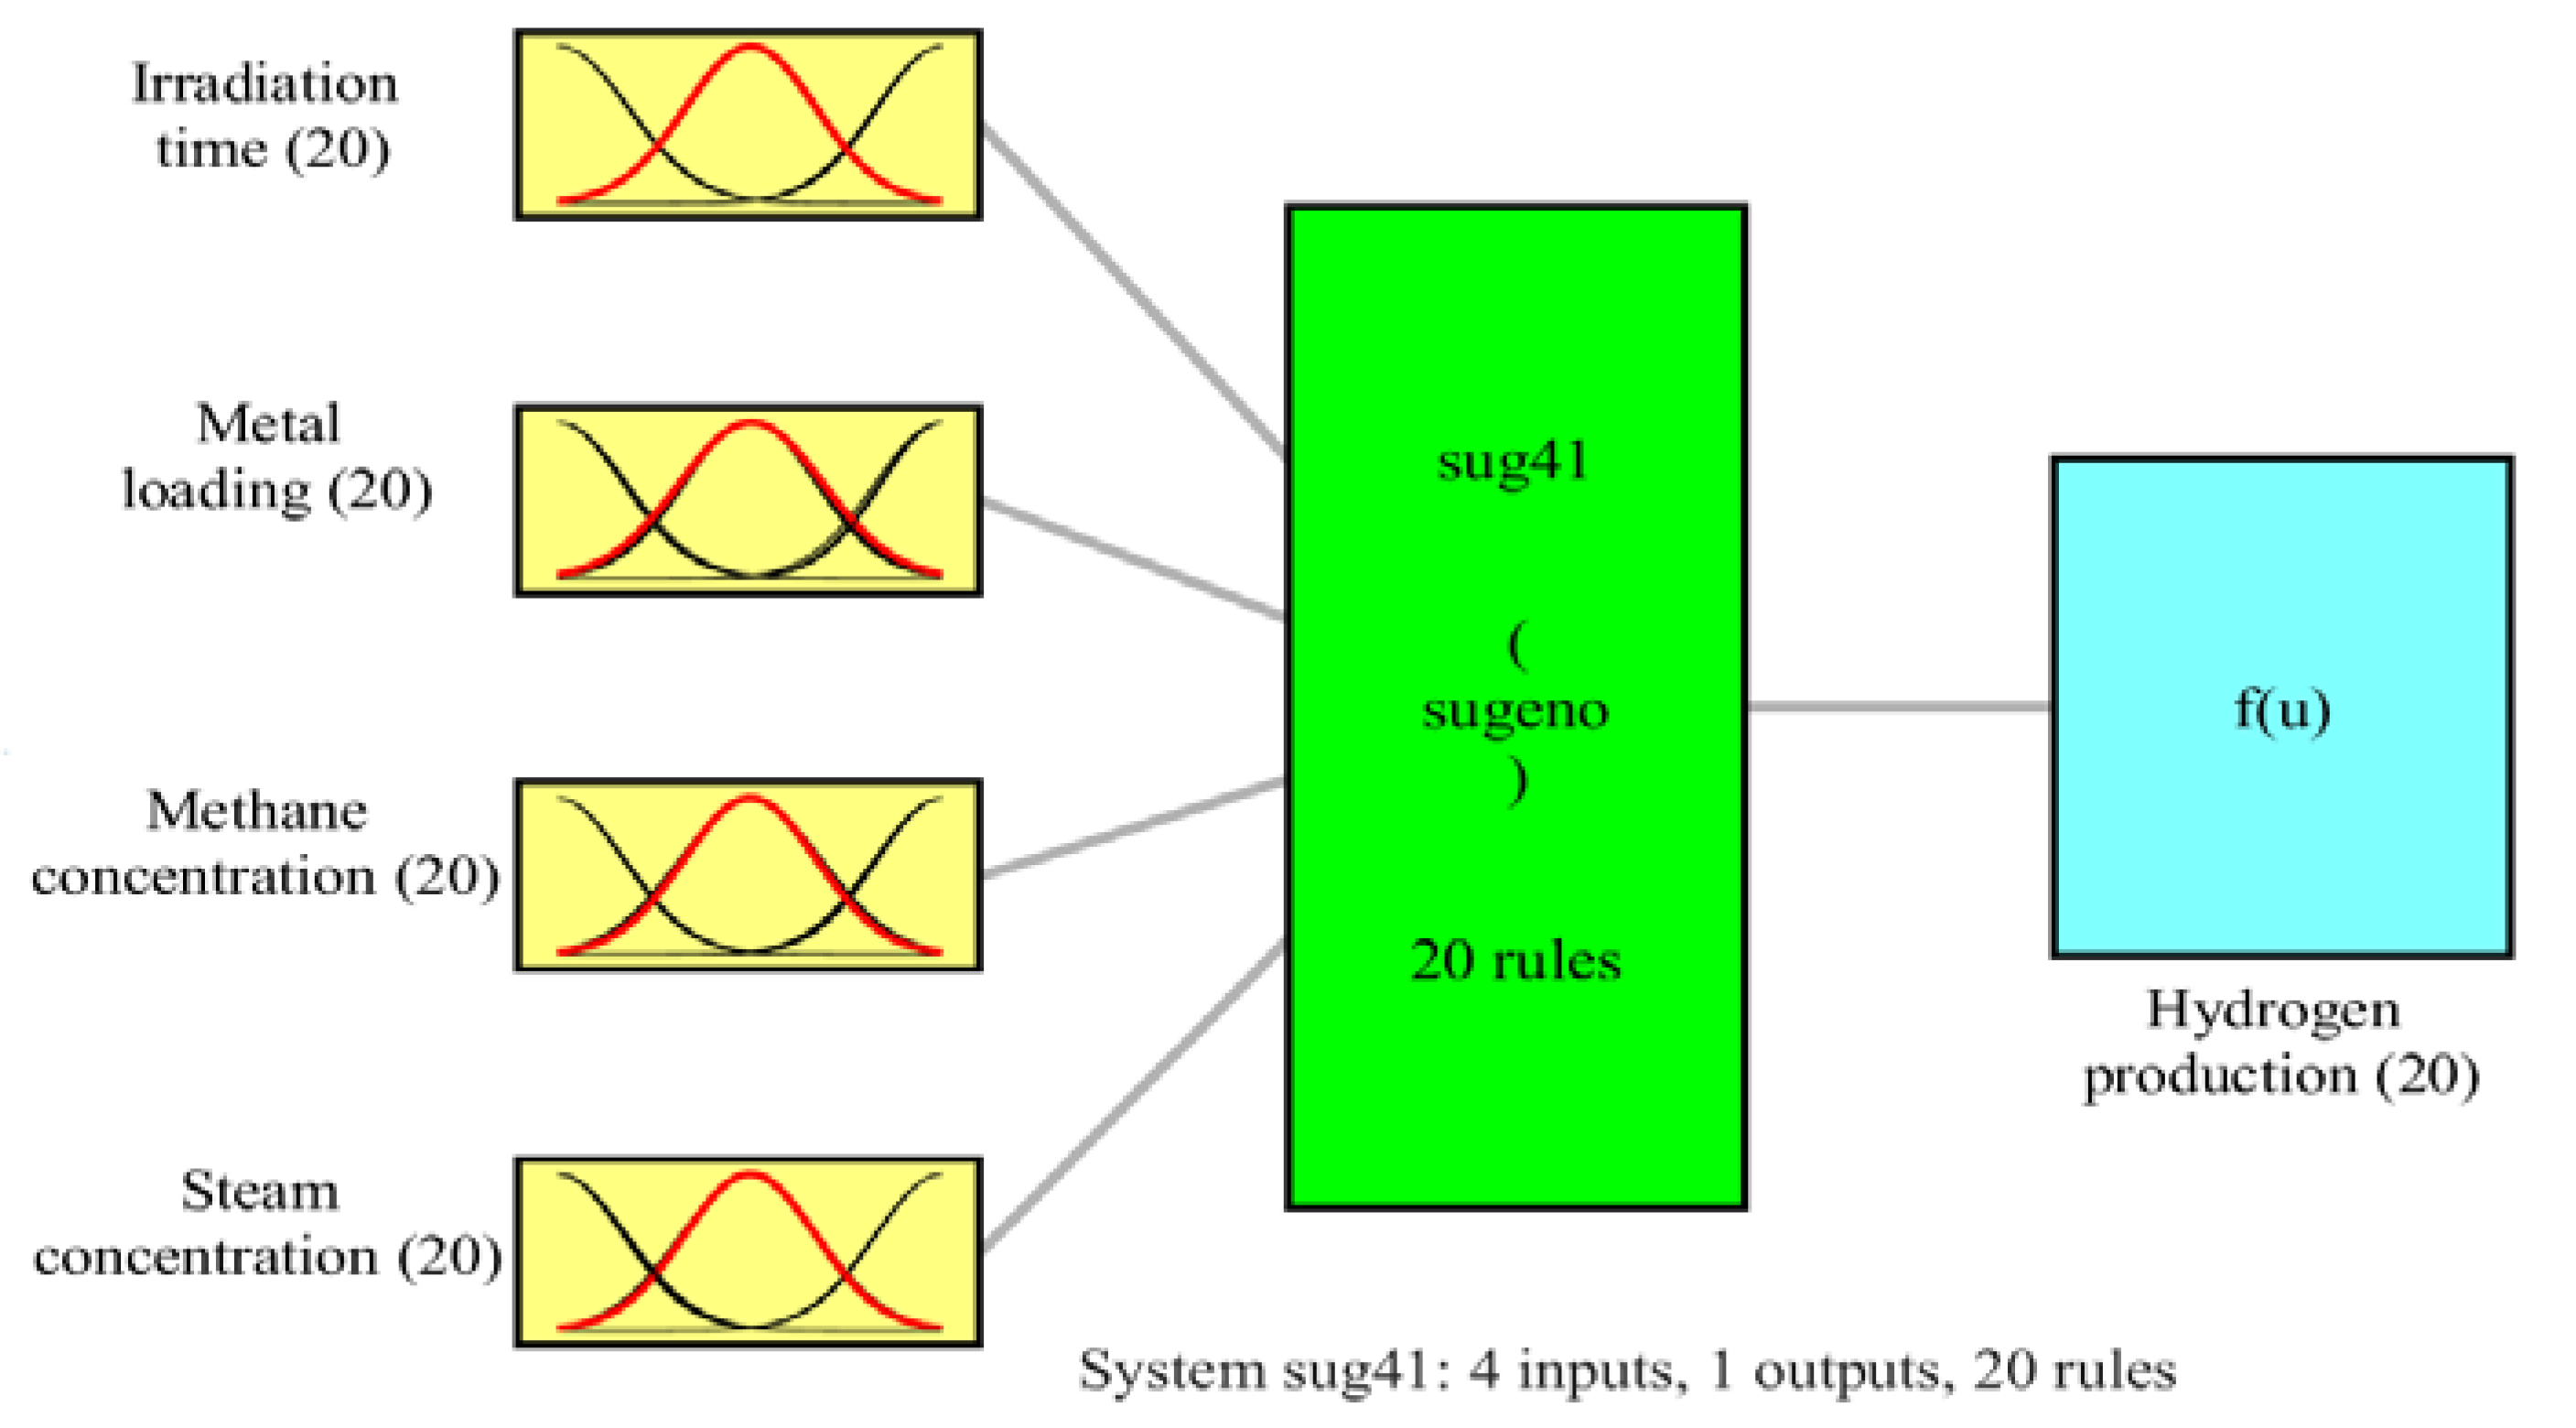
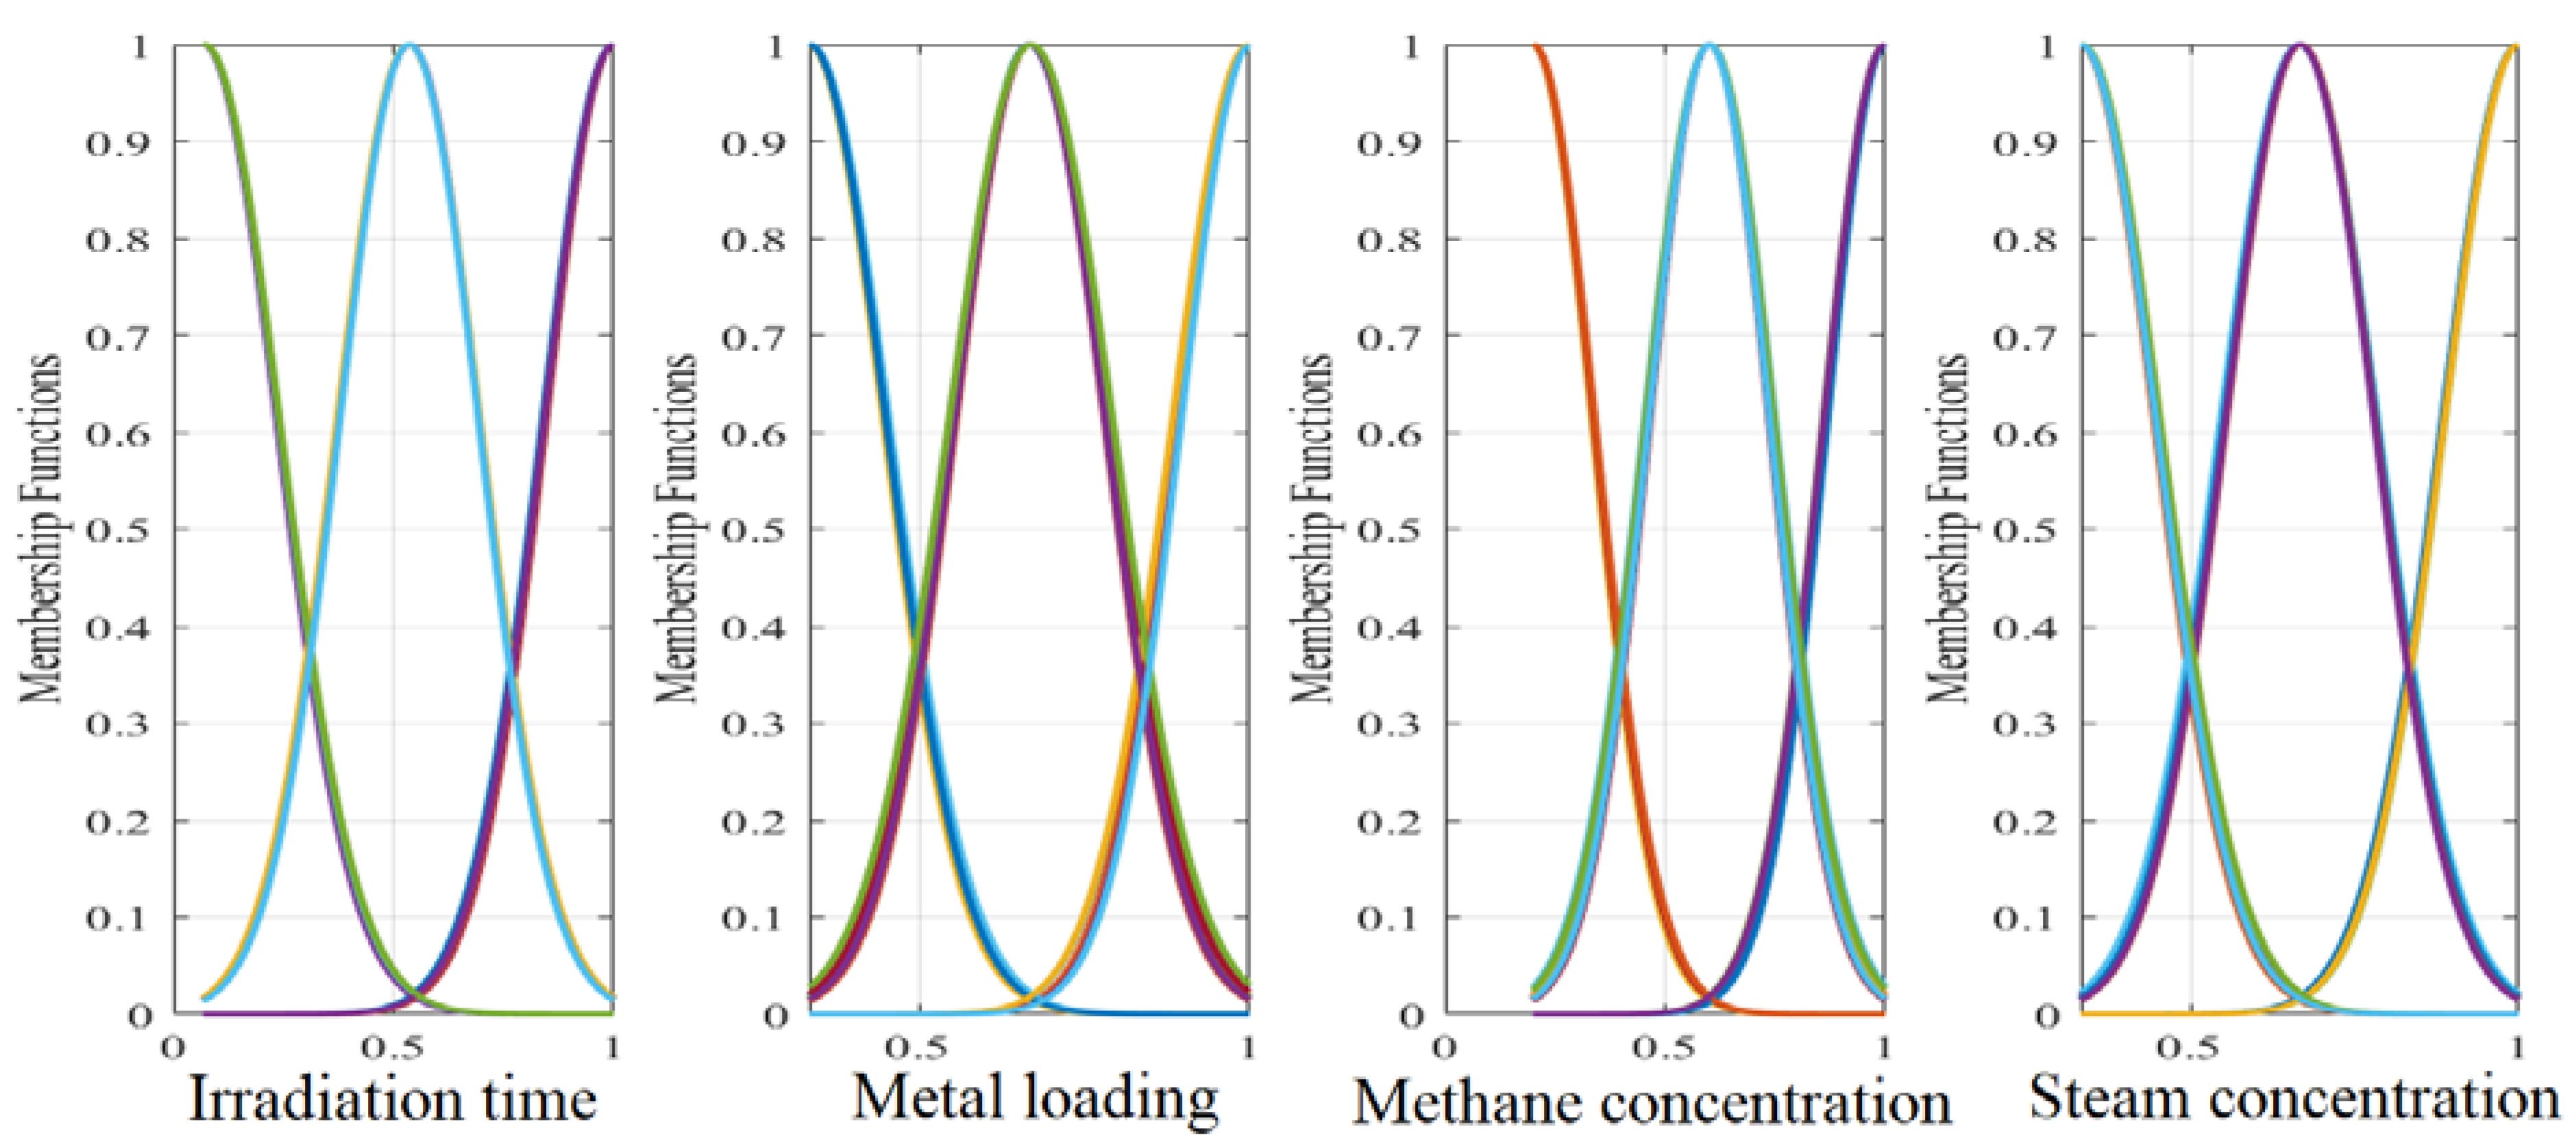
3.1. ANFIS-Modelling

Figure 2 illustrates the structure of two fuzzy rules of a 2-input single-output system. Fuzzification, inference engine, and defuzzification are the main three steps of fuzzy logic modelling. The nonlinear mapping of the inputs is accomplished using membership functions (MFs) in the fuzzification stage, which are represented by the Fuzzification Layer in Figure 1. Generating the fuzzy rules, evaluating the rules’ outputs (Product Layer, π), and aggregating the fired rules (Normalized Layer, N) to obtain the final fuzzy output occur in the inference engine stage. Finally, the output is mapped from the fuzzy form to its crisp value in the last process, which is the defuzzification stage (Defuzzification Layer). ANFIS uses two methods to generate the rules, namely grid portioning (GP), and subtractive clustering (SC). The GP method divides the inputs’ space as a grid and generates the rule that matches the input–output relationship in every grid cell. Unfortunately, this method produces a large number of rules, which slow down the inference process. Additionally, the rule-base might contain redundant rules. However, the SC generates the rules by clustering the data at the minimum number of clusters, which results in a small number of rules. Accordingly, the SC was adopted in this work. Despite there being many MF shapes and defuzzification methods, the Gaussian shape and weight average are the best nominated, respectively. In fuzzy modelling, the input–output mapping is simulated as an IF–THEN rule. Examples of the ANFIS rules are as follows:
IF   x   is   A 1   and   y   is   B 1   THEN   f 1 = g 1 x ,   y
IF   x   is   A 2   and   y   is   B 2   THEN   f 2 = g 2 x ,   y
where the As and Bs are the membership functions of the two inputs x and y, respectively. However, the final output f is calculated based on the two rules’ outputs, f1 and f2, as follows:
f = ω ˜ 1 f 1 + ω ˜ 2 f 2 (Output Layer)
Evaluating   ω ˜ 1 g 1 x , y   a n d   ω ˜ 2 g 2 x , y (Defuzzification Layer)
ω ˜ 1 = ω 1 ω 1 + ω 2 a n d   ω ˜ 2 = ω 2 ω 1 + ω 2 (N Layer)
ω 1 = μ A 1 μ B 1 a n d   ω 2 = μ A 2 μ B 2 (π Layer)
μ A 1 ,   μ A 2 , μ B 1 a n d   μ B 2 are   the   MF   values   of   the   two   inputs   (Fuzzification Layer)

3.2. Optimization Algorithms

In this work, the main goal was to find out the values of the controlling parameters that maximize the hydrogen production. Consequently, four recent as well as efficient optimization algorithms were considered to achieve this goal. The optimizers included the slime mold algorithm (SMA), particle swarm optimization (PSO), EESHHO, and Harris hawks optimization (HHO). However, a brief overview about the SMA algorithm is presented in the following subsections.

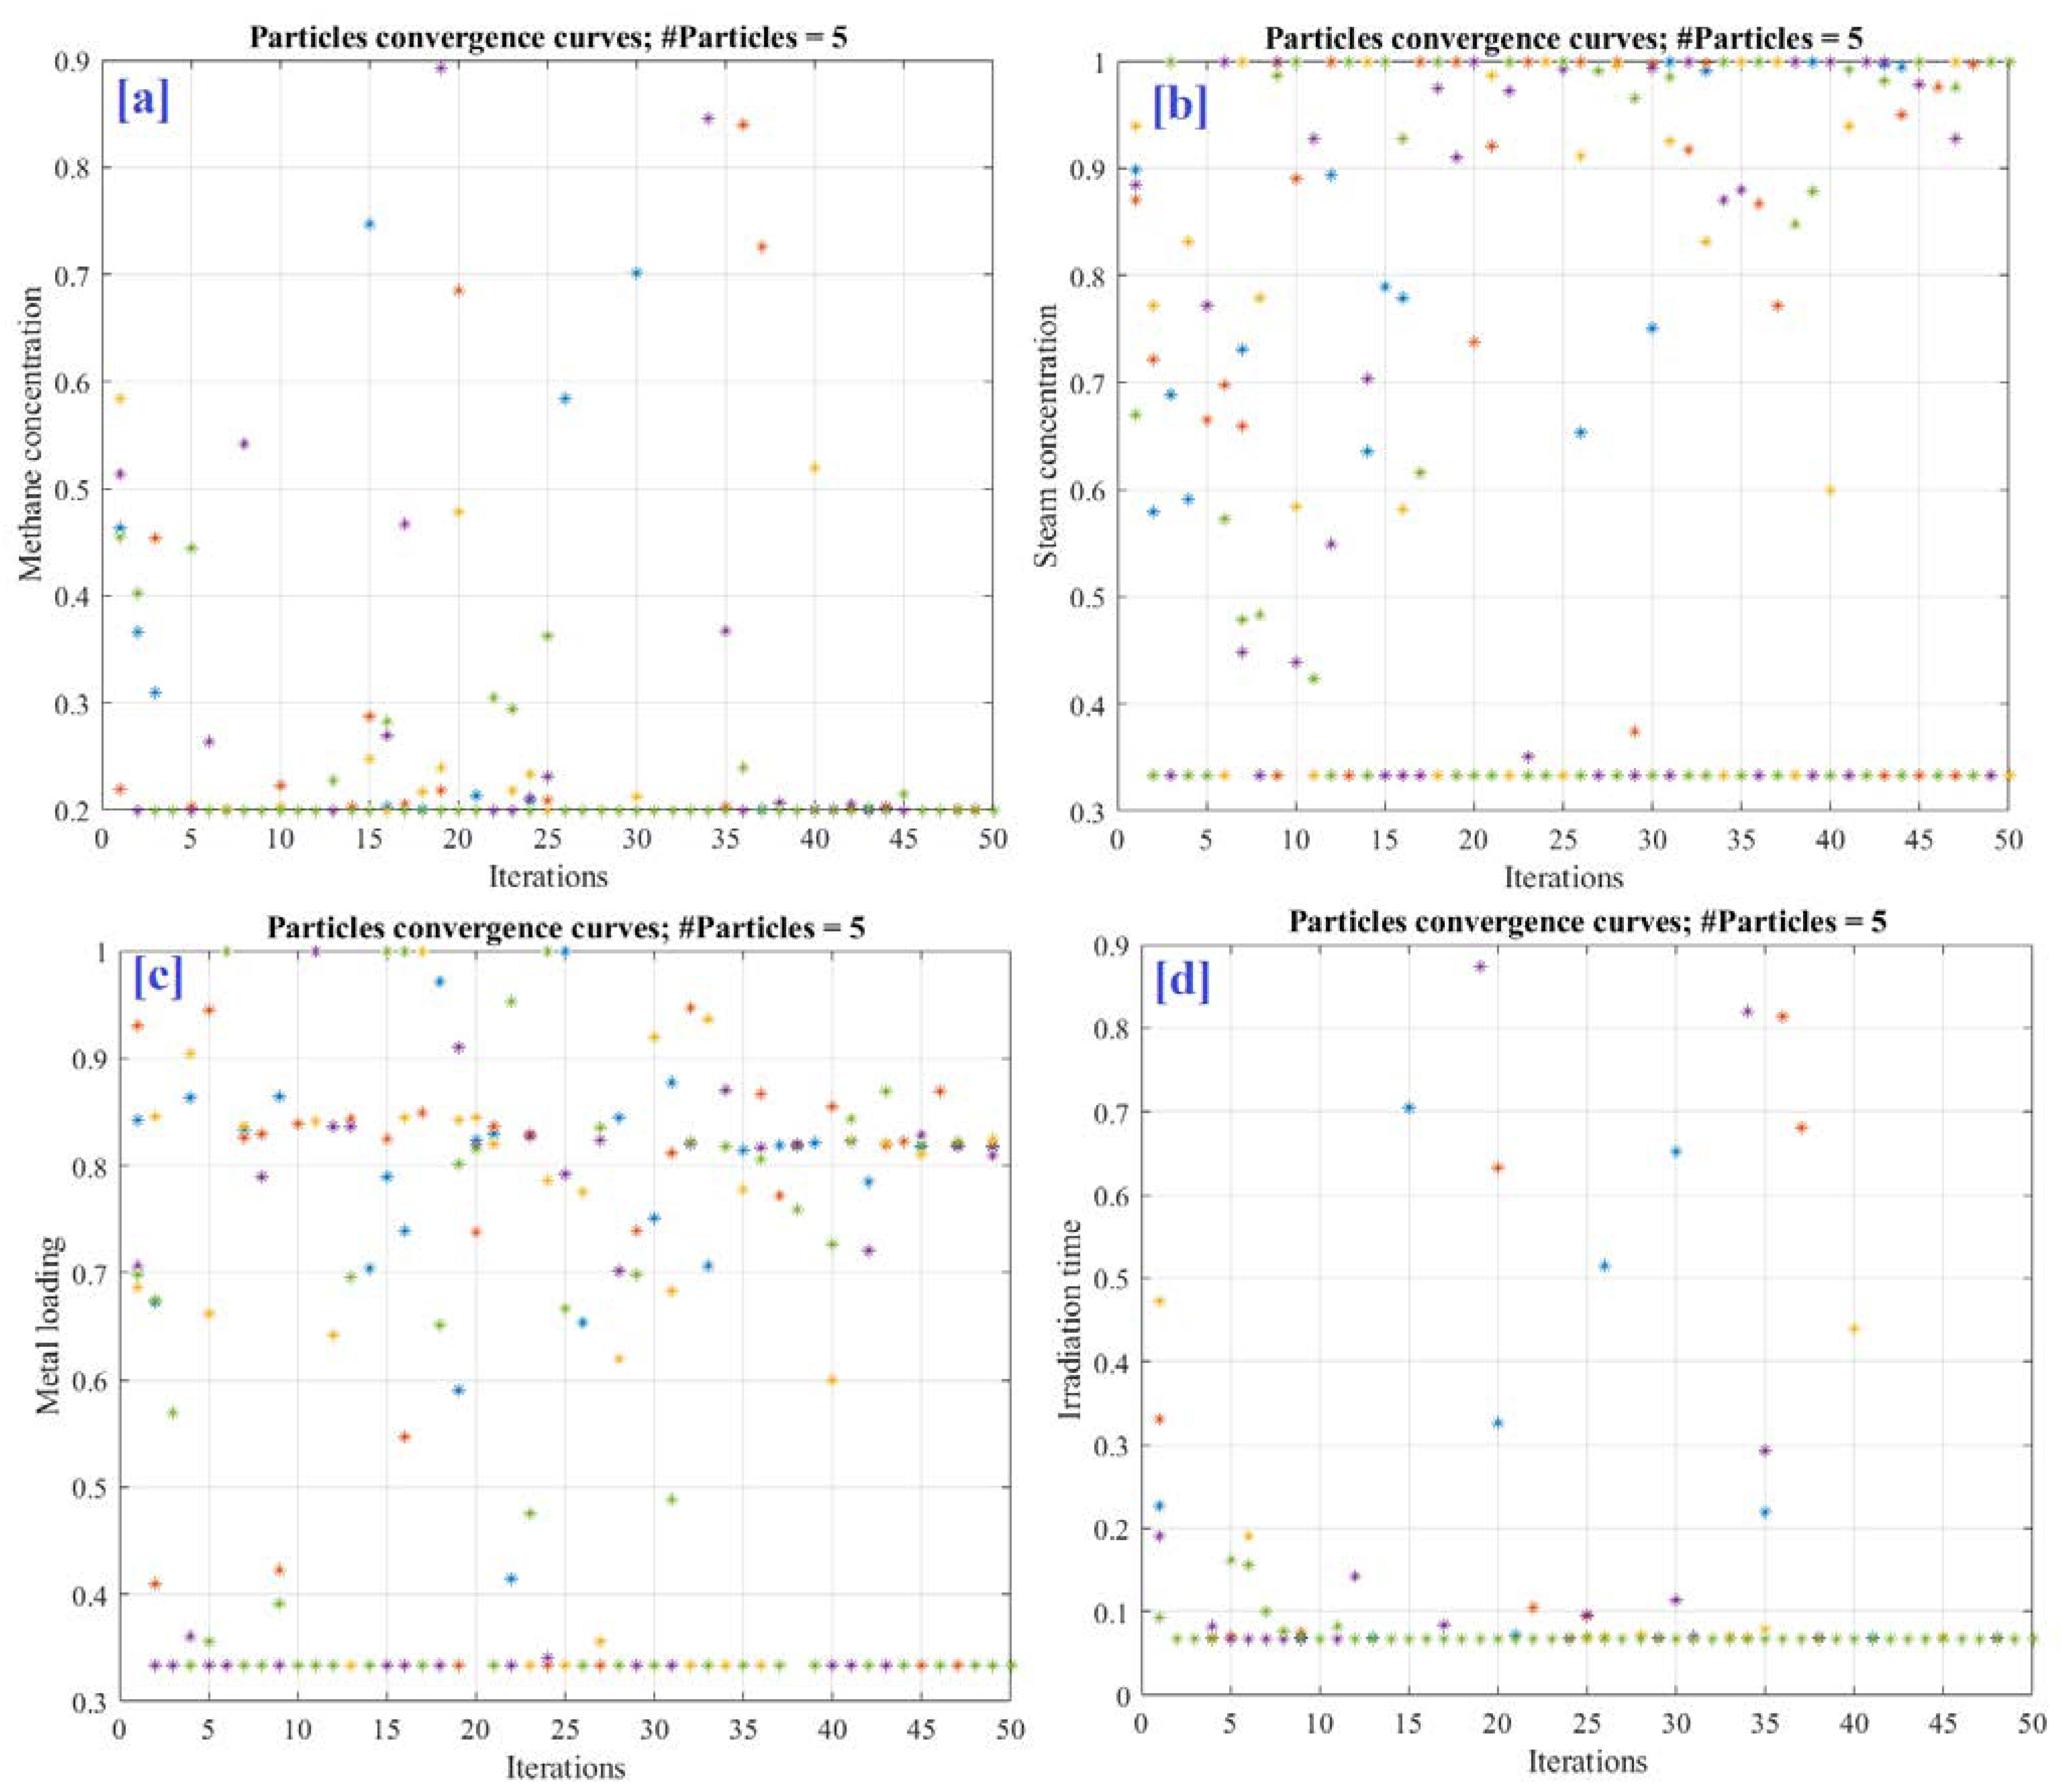
3.2.1. Slime Mold Algorithm

The natural oscillation of the slime mold motivated Li et. al. to propose a recent and simple optimizer, namely the slime mold algorithm (SMA) [32]. SMA can be classified as an SI optimizer in metaheuristic algorithms (MA). Similar to most of the optimizers, SMA starts by proposing an initial set of a predefined number of solutions that represent the swarm population. Then, every solution can be modified iteratively according to the updating formula until reaching the final goal. The balance between the exploration phase, which occurs at the beginning of the search process, and the exploitation phase, which occurs at the end, is a key factor in any optimization process. To produce efficient exploration and exploitation phases, SMA applies the positive and negative bio-oscillation feedbacks to form the optimal path for reaching the food. To simulate this process, adaptive weights are used. The mathematical model of the SMA is based on three mechanisms, namely approach food, wrap food, and oscillation.

Mechanism 1: Approach Food

Foods usually spread odor in the air. Accordingly, the slime mold is stimulated to look for the source of this odor. The mathematical formula that represents this behavior is shown in the following:
x k + 1 = x g k + v b w . x 1 k x 2 k ; r < p v c . x k ; r p
p = tan h f x k f g x g k
v b = a ,   a
a = arctanh k I t m a x + 1
where x and x g are the current and global best foods’ positions; x 1 and x 2 are two randomly selected foods’ positions; v b is a parameter that oscillates in the range a ,   a ; w is emulating the slime mould weight; v c is a linear parameter degraded from 1 to 0; r is a random generator in the range [0 1]; f x k and f g x g k are the cost function values of the current food position and the global best food position, respectively; k is the iteration index; and I t m a x is the maximum number of iterations.

Mechanism 2: Wrap Food

x k + 1 = r . U L + L r < z x g k + v b w . x 1 k x 2 k ; r < p v c . x k r p
w I n d x k = 1 + r . log f b e s t k f x k f b e s t k f w o r s t x k ; f x k f i r s t   h a l f 1 r . log f b e s t k f x k f b e s t k f w o r s t x k ; f x k s e c o n d   h a l f
I n d x = s o r t f x k
where U and L are the highest and lowest values of the inputs’ search space, respectively; f b e s t and f w o r s t   are the best and worst cost function values in the current iteration, respectively; r is a random generator in the range [0 1]; v c is an oscillation parameter in the range [−1 1]; and I n d x is the indices’ vector of cost function values sorted in ascending order. Based on the statistical study, the best value of z is 0.03.

Mechanism 3: Oscillation

To have a better location with respect to the food concentration, the slime oscillates around the nominated place of food. This can be formulated by the oscillatory parameters vb and vc. However, w represents the frequency of this oscillation.

4. Results and Discussion

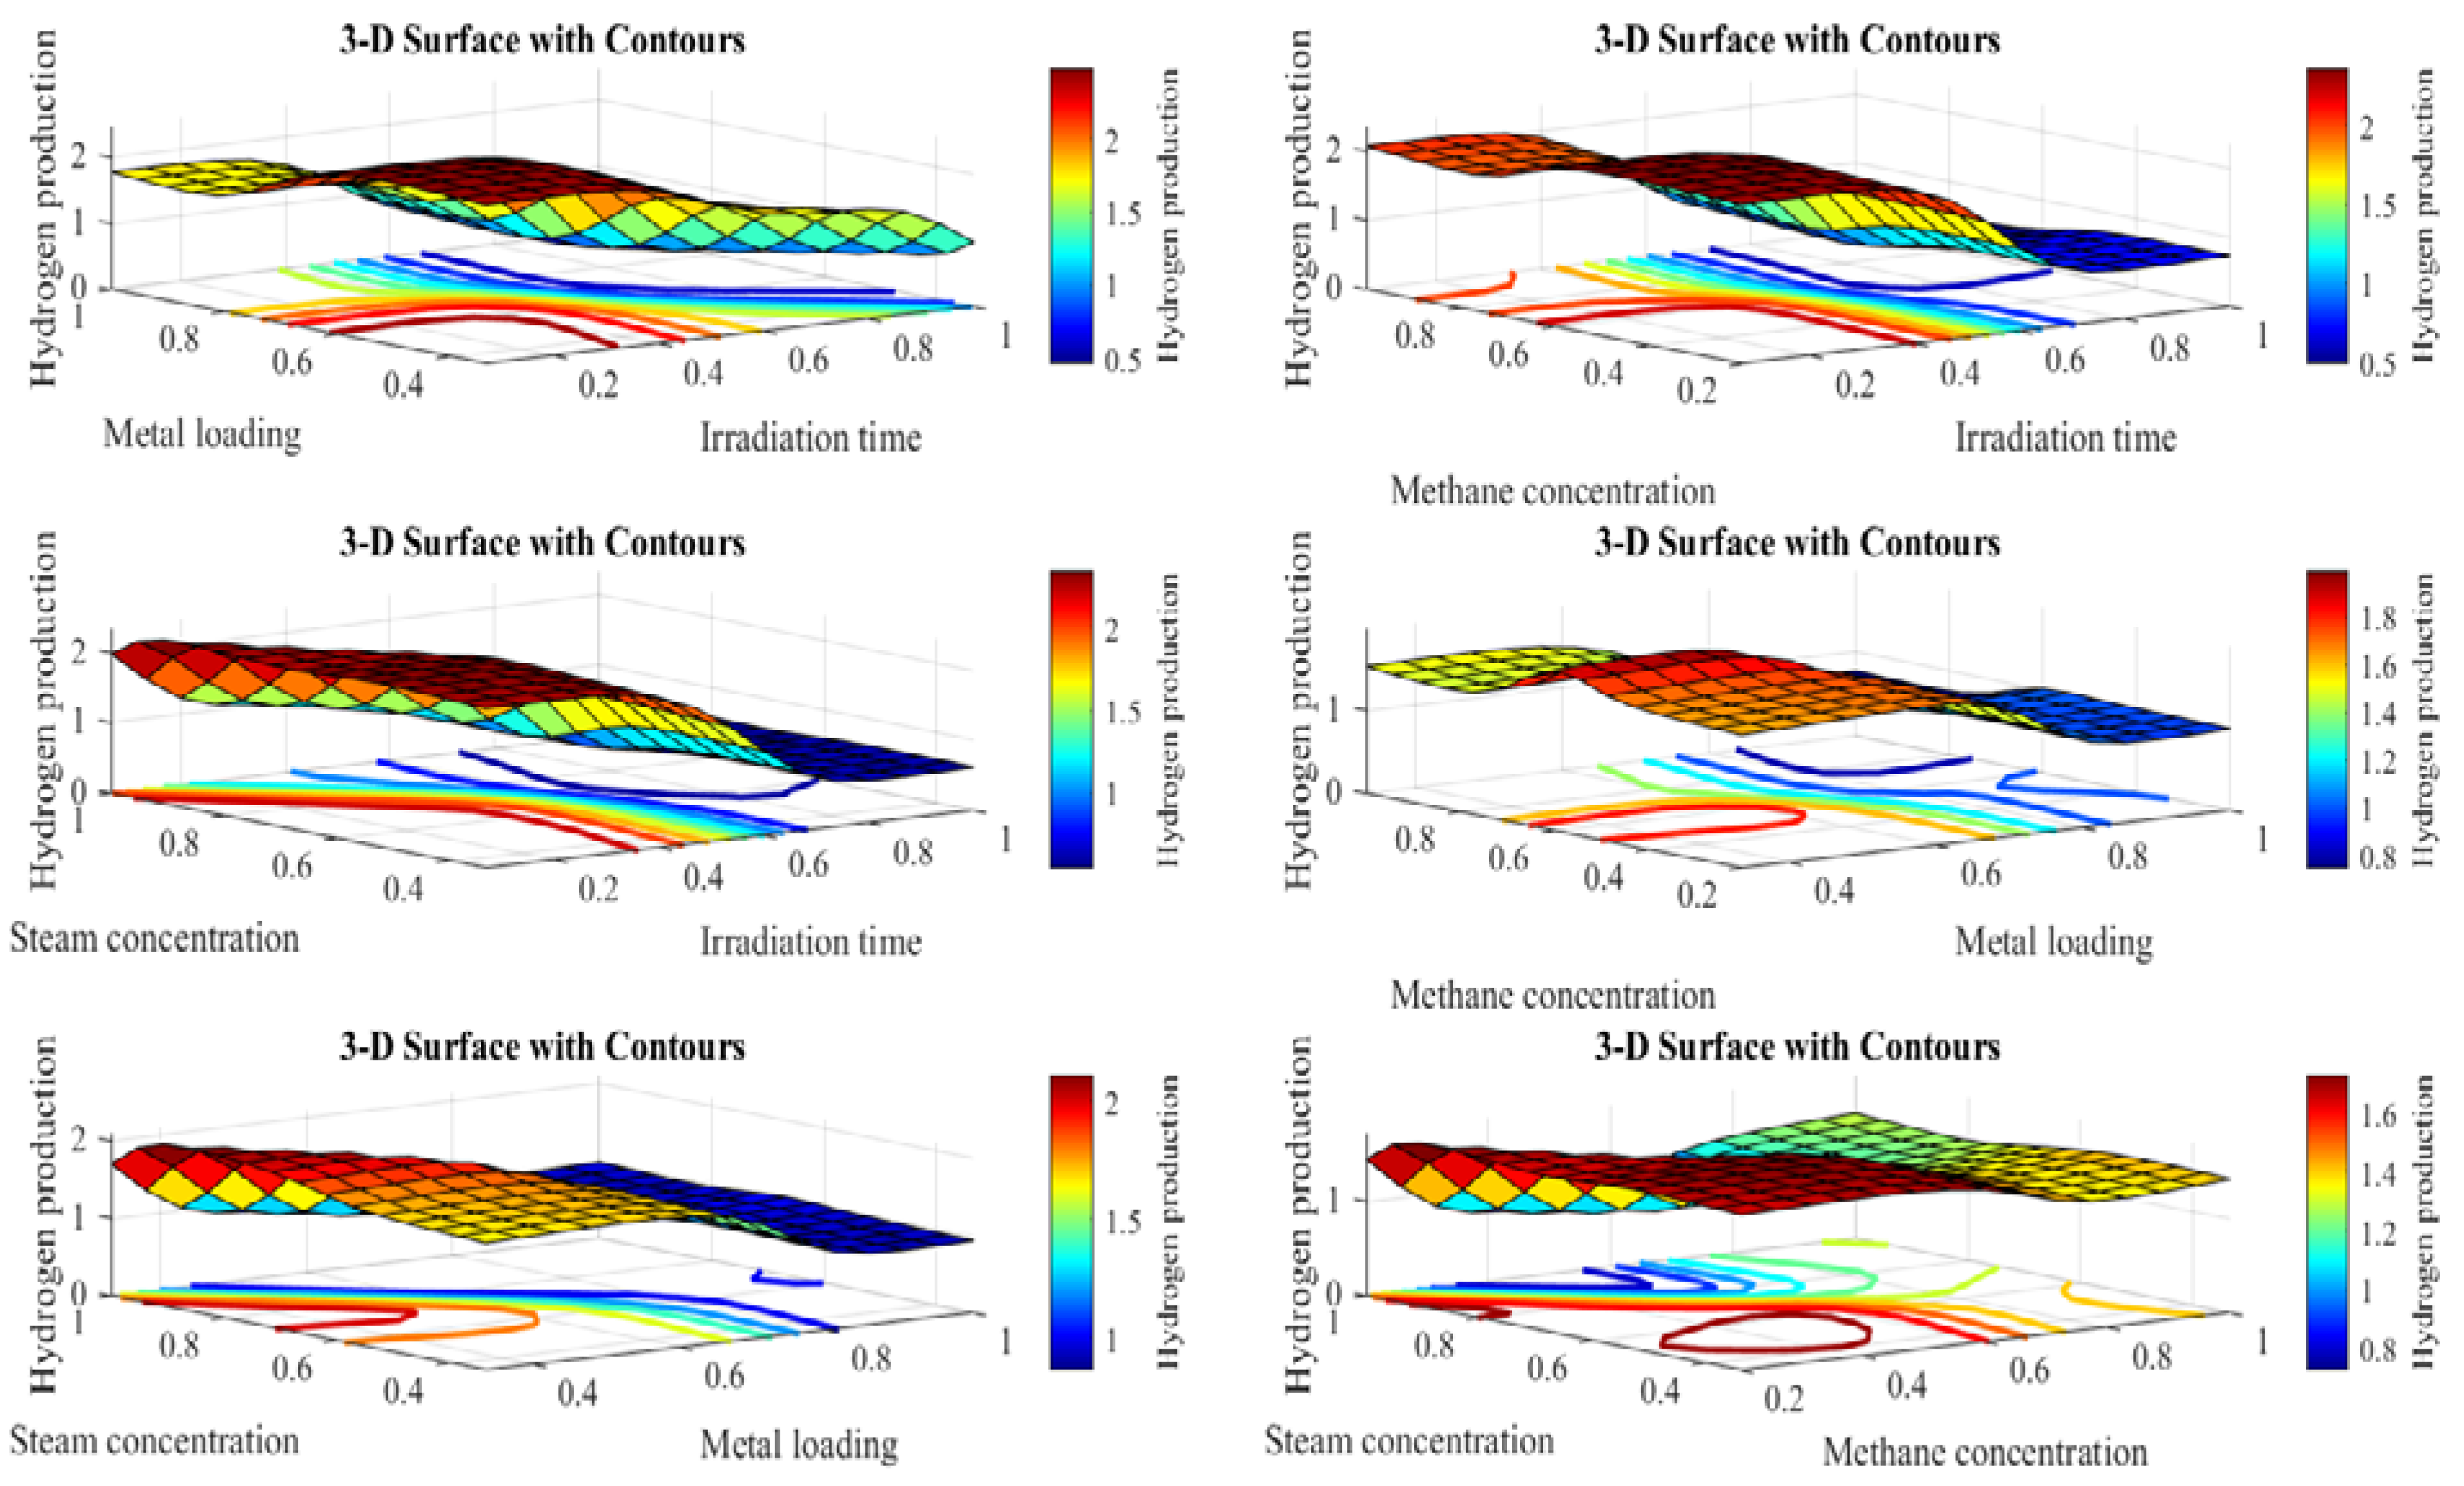
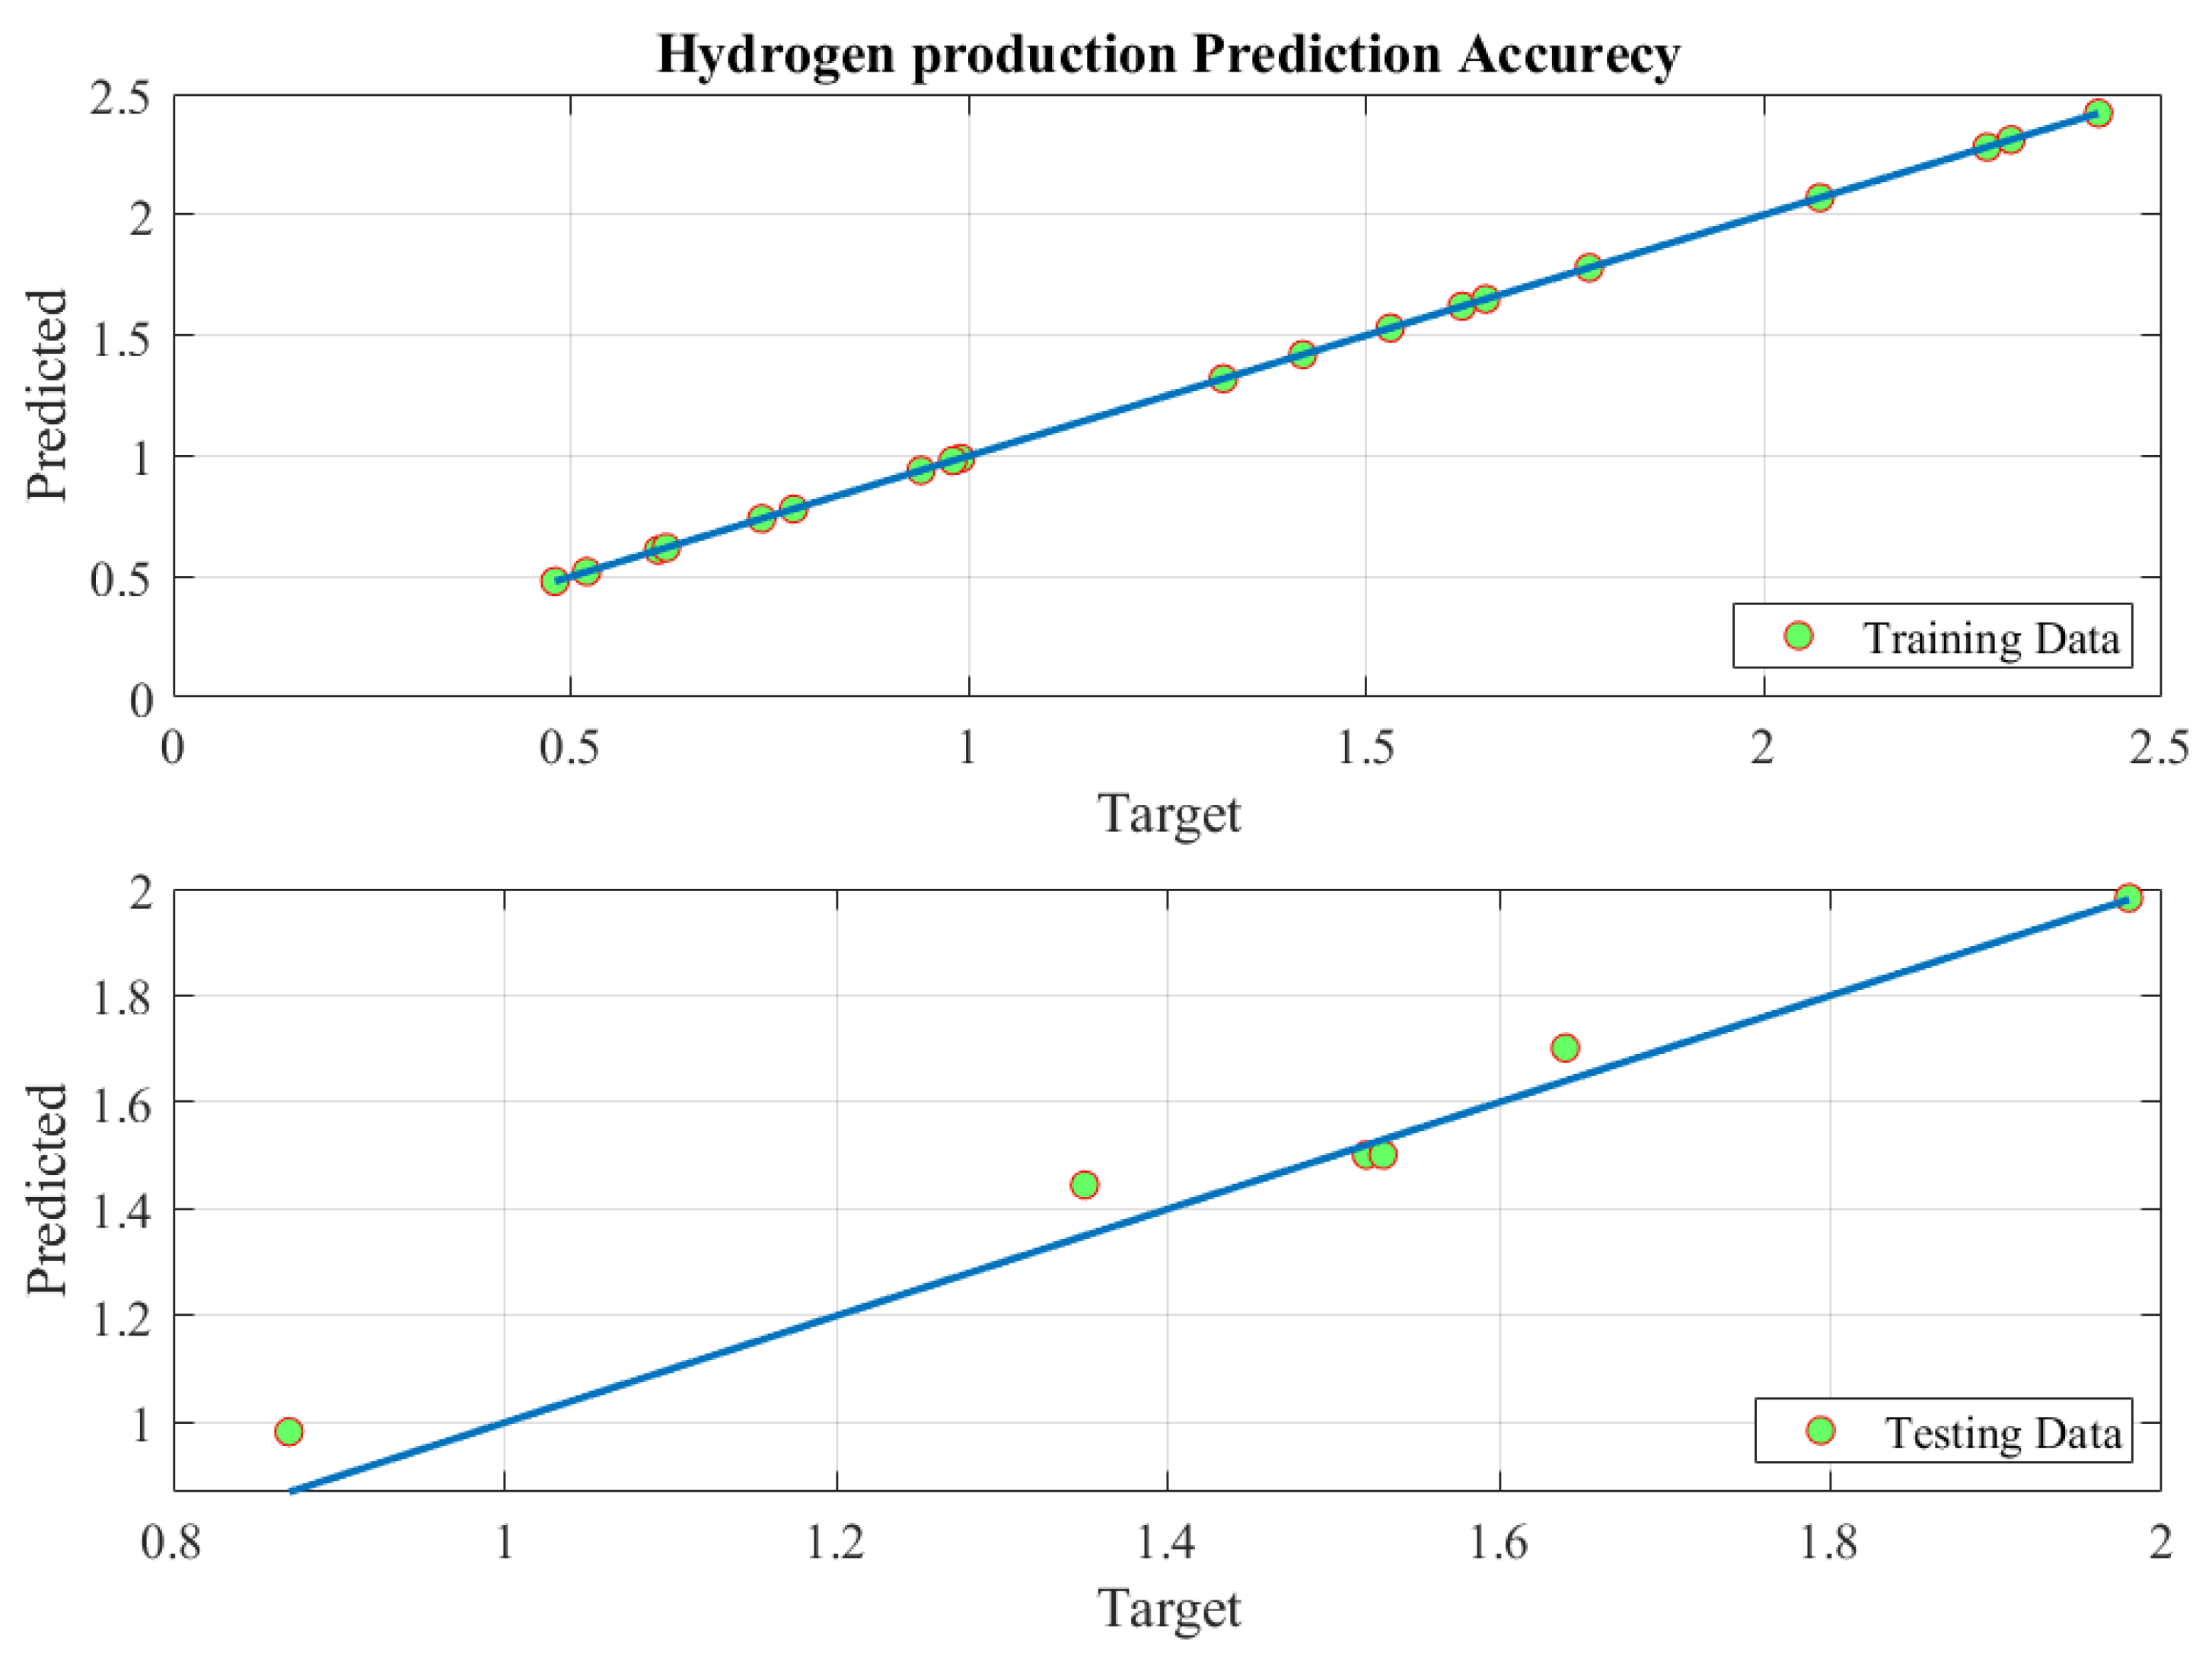
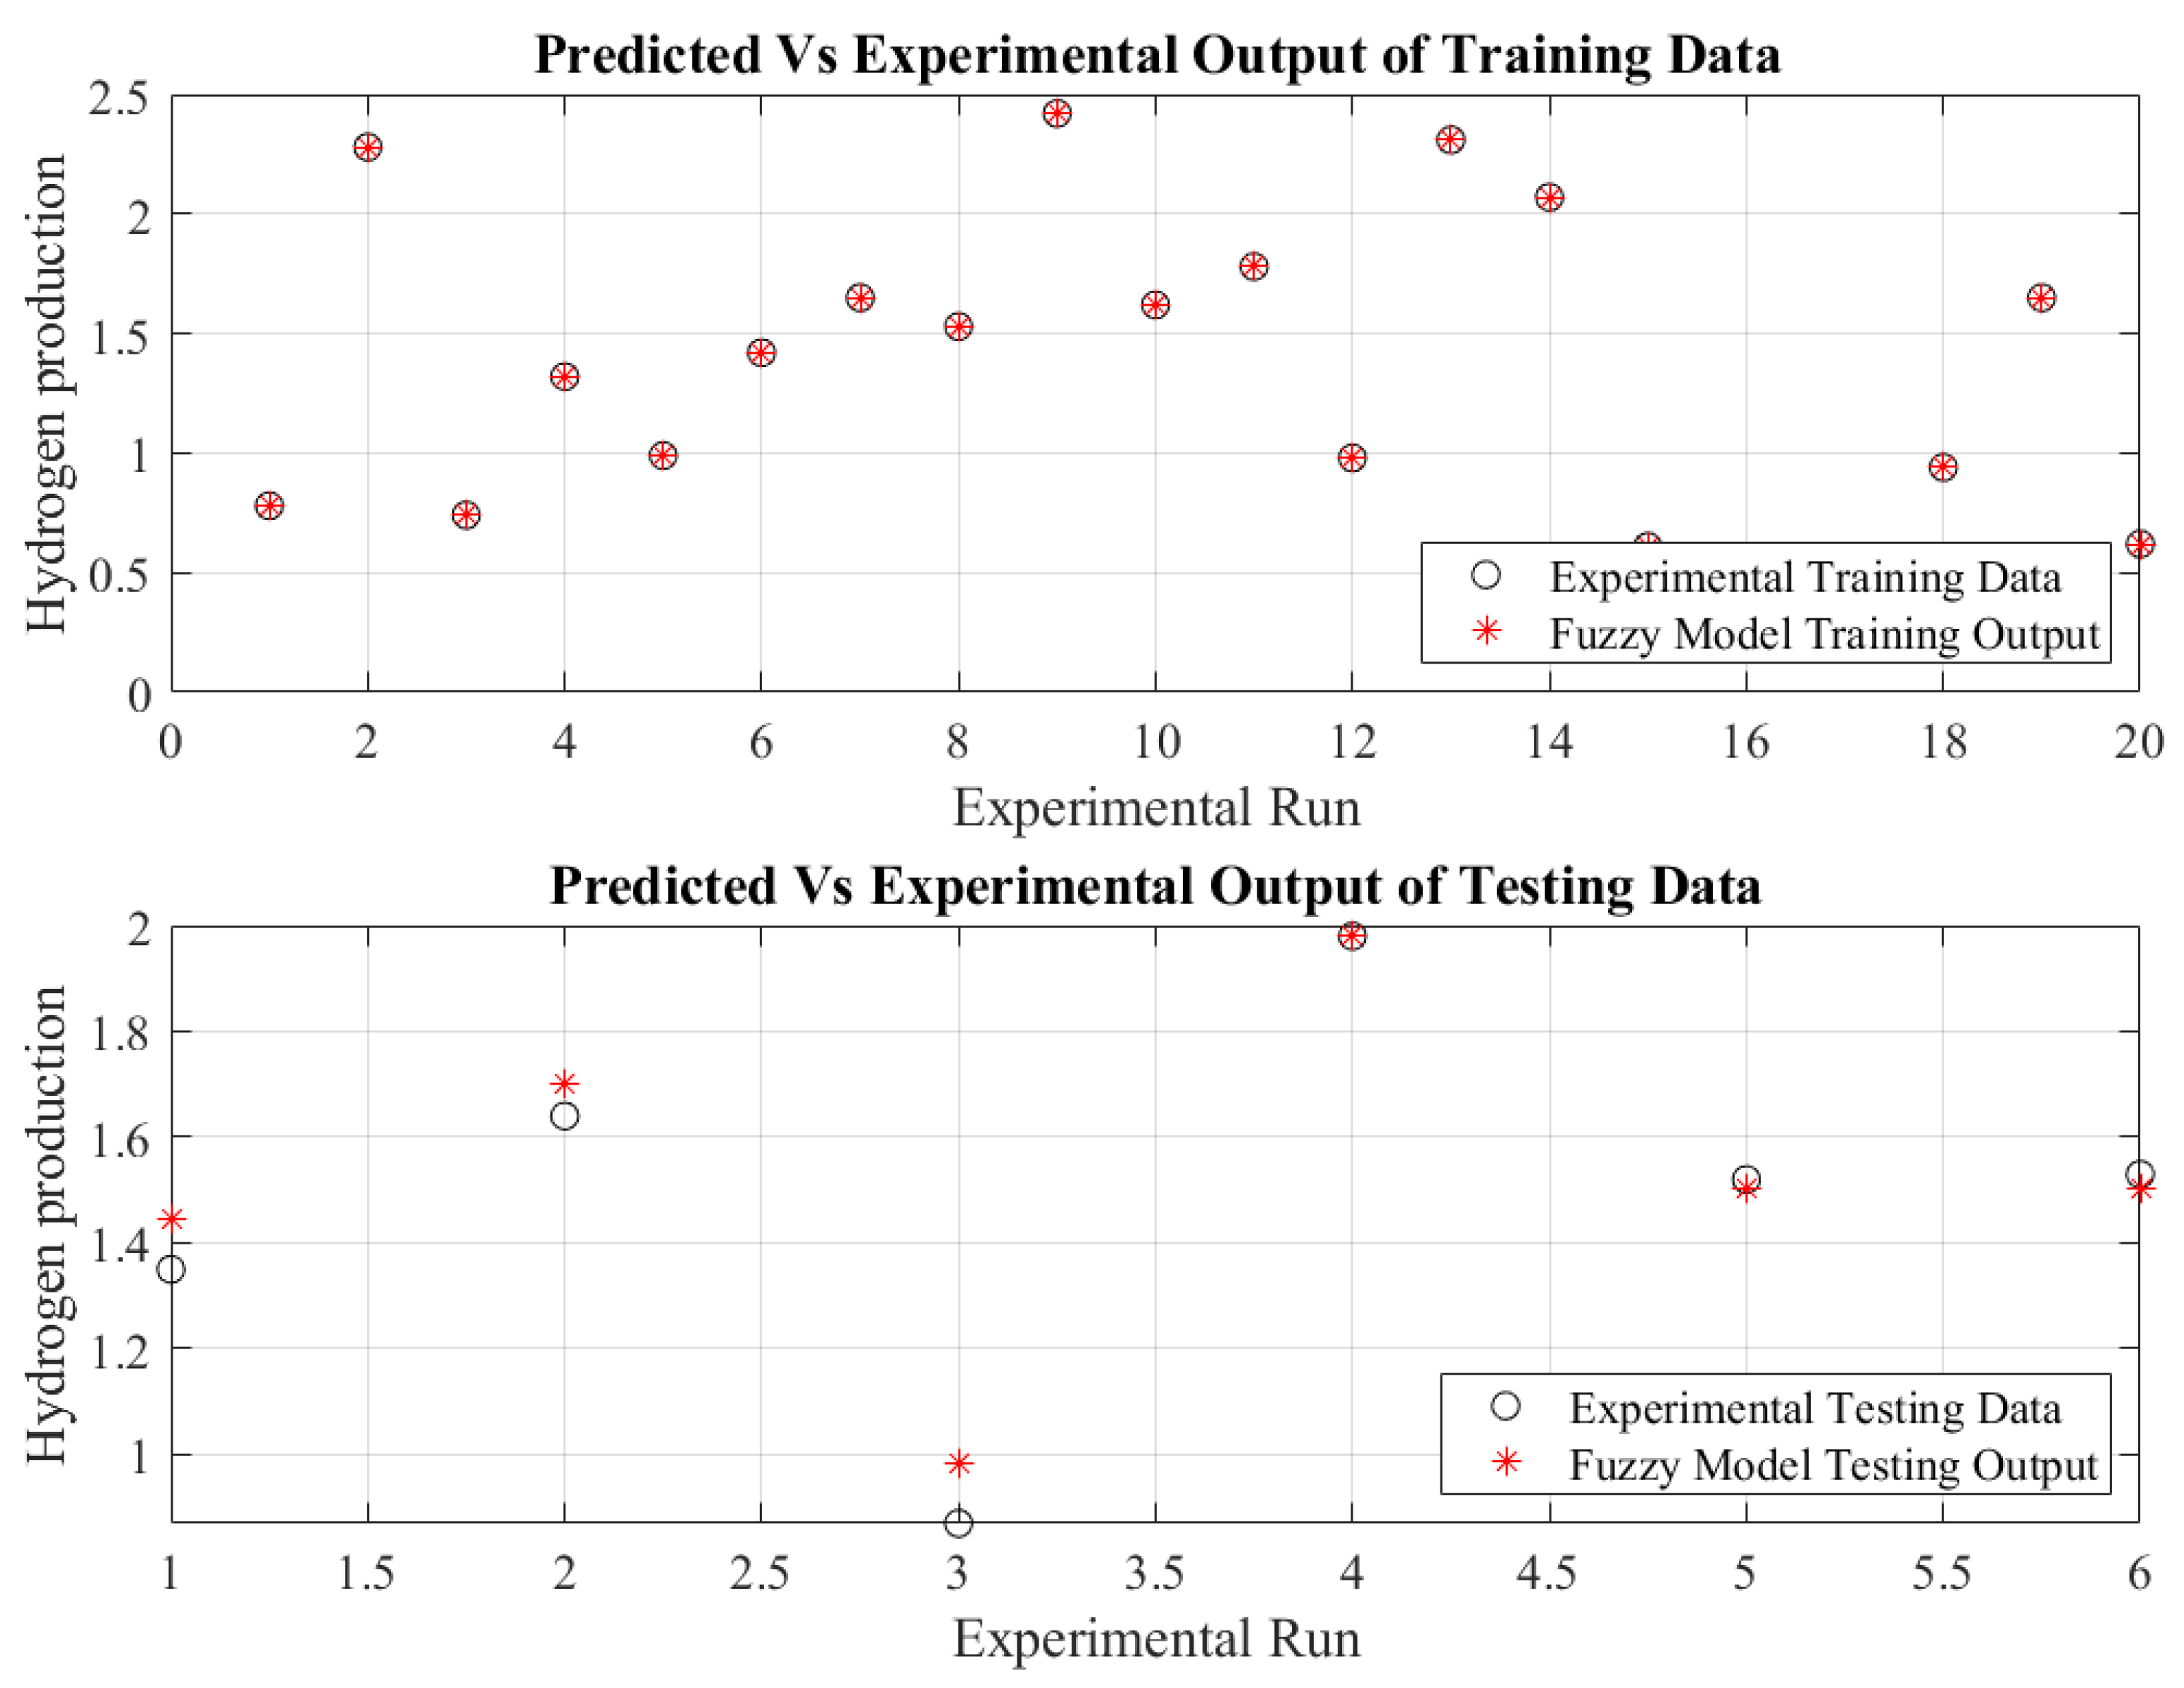
4.1. ANFIS-Based Results

In this work, the MF type, the fuzzy rules generator, and the defuzzification method are, respectively, Gaussian shape, Subtractive Clustering (SC), and Weighted Average (WAvg). The dataset used with permission in this work is composed of 26 data points, which were decomposed for training and testing in a ratio of 80:20, respectively. This implied that there were 21 samples for training, while the remaining 5 samples were reserved for testing. The ANFIS was trained with a hybrid method by using LSE in the forward path and Backpropagation in the backward path. The SC was applied to generate the system’s rules, which were in this case study 20 rules. Then, the model was trained until a lower MSE was encountered. The resulting statistical markers of the training phase are shown in Table 1.
Considering the above table, the RMSE values were 6.64E-07 and 0.0668, respectively, for the training and testing phases. The coefficient-of-determination (R2) values were 1.00 and 0.981, respectively, for training and testing. The small MSE and the high coefficient-of-determination values of the fuzzy model demonstrated a successful modelling phase. This proved the superiority of fuzzy modelling compared with the RSM methodology, where the later produced an RSME value of 0.769 and an R2 value of 0.925. Figure 2 shows the 3-input single-output structure of the ANFIS model. However, the plots of the Gaussian shape membership functions are illustrated in Figure 3.
Figure 4 shows the spatial representation in 3D view with contours of the system’s input–output function with every two inputs at a time. The highest value of the output went towards the dark red, while the lowest value went towards the dark blue. As it can be seen from the figure, the increase in the steam concentration had a positive effect on hydrogen production. This could be due to the role of the steam in the reforming process. Around 20% methane demonstrated the highest hydrogen productivity. This could be related to the possible carbon deposition at higher methane concentrations, and insufficient methane at lower concentrations [33]. Higher loading of the metal, i.e., more than 2 wt% of La over TiO2, had a positive effect on the hydrogen production, which could be related to the better morphology, higher surface area, and higher pore volume of the samples with higher metal loading [31]. It also showed that an intermediate irradiation time of around 60 min was the best in terms of hydrogen production.
Capturing the exact relation between hydrogen production and the four controlling inputs encouraged the ANFIS model to predict the performance correctly. This was clear from the plotting of the fuzzy model’s predicted outputs versus the experimental data in the cases of training and testing phases, as shown in Figure 5. The close matching between the experimental data points and the model’s results could be noticed clearly, especially for the testing dataset. Additionally, the predictions’ plots around the one-hundred percent accuracy line are shown in Figure 6 for both training and testing stages.

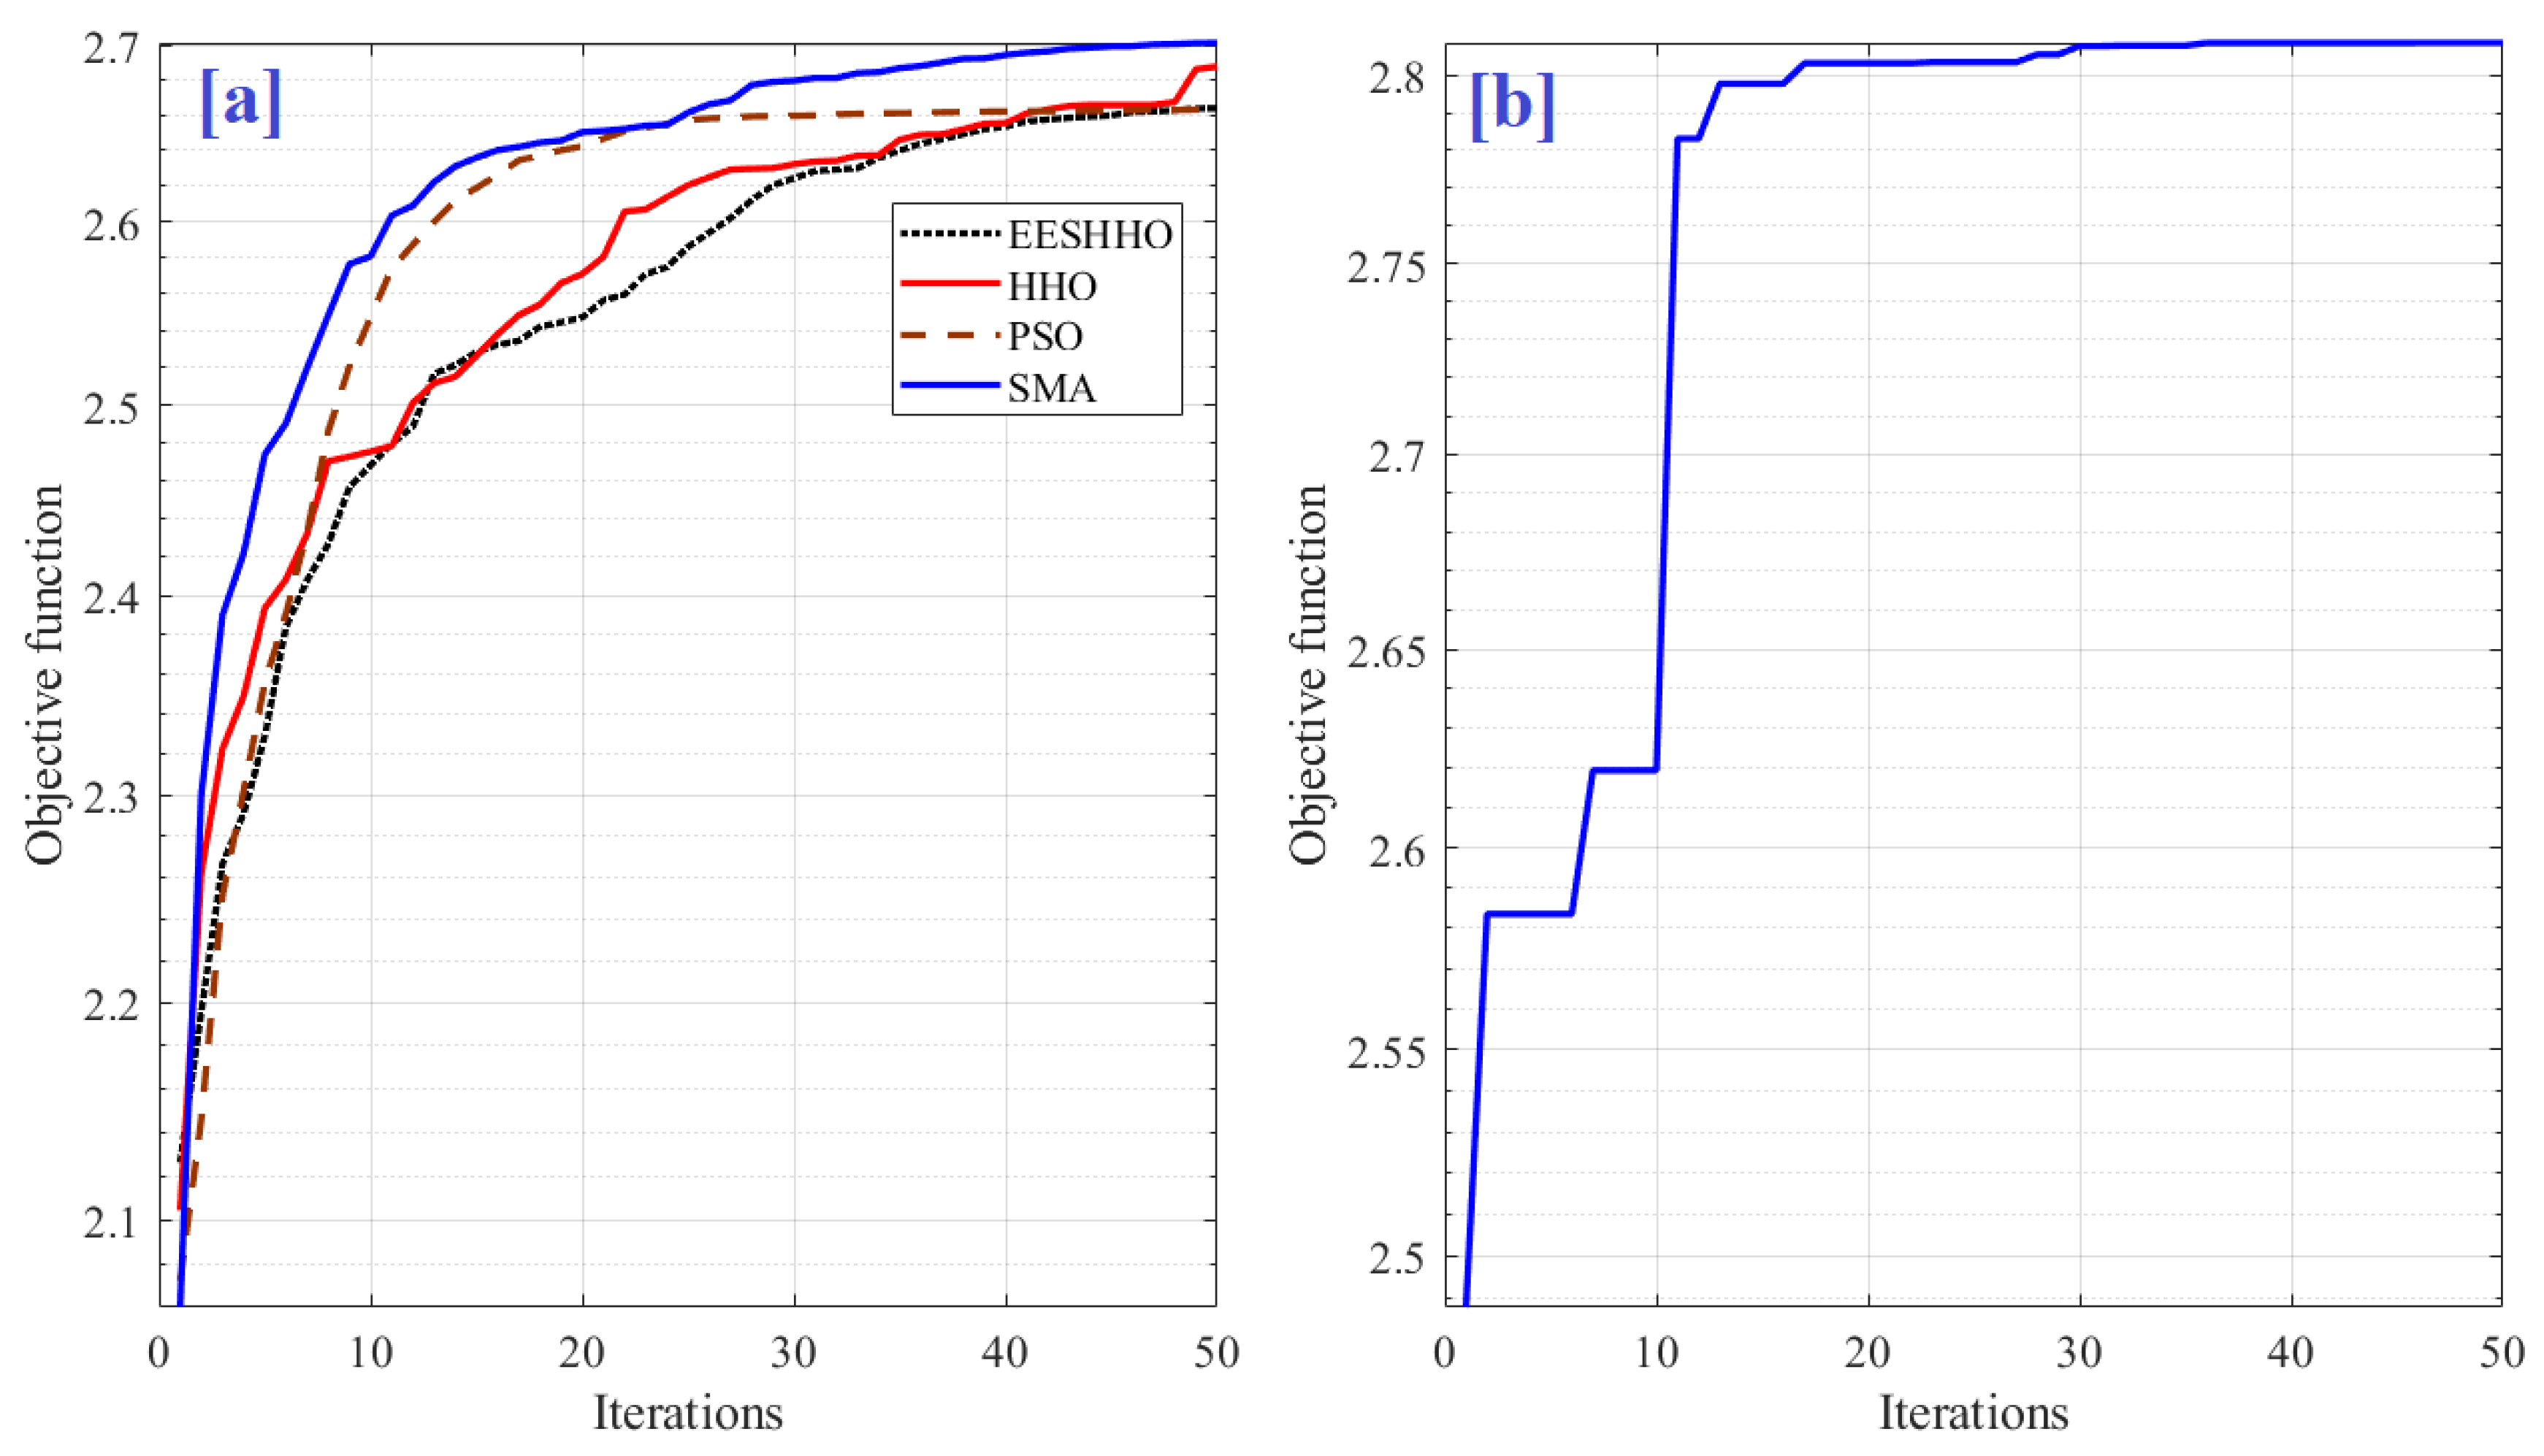
4.2. Optimization-Based RESULTS

In the current study, four recent and competitive optimizers were applied to obtain the optimal set of parameters that maximizes hydrogen production. The study included particle swarm optimization (PSO), Harris hawks optimization (HHO), evolutionary strategy HHO (EESHHO), and the slime mold algorithm (SMA). The parameter settings of each optimizer are shown in Table 2. For a fair comparison, the number of solutions and the maximum number of iterations for all optimizers were set to 5 and 50, respectively. Additionally, every optimizer was evaluated 30 times to assure its stability. Table 3 shows a comparison between the resulting hydrogen production of the four algorithms over the 30 runs. Based on the resulting data in Table 3, the statistical metrics were calculated to differentiate between the addressed optimizers. Table 4 demonstrates that the SMA was more stable than the others. This is clear from the high values of its Mean and Worst values as well as the small values of the Standard Deviation (STD) and Median (in bold at Table 4). Moreover, the average values of the convergence curves of the considered algorithms are shown in Figure 7a. From the figure, the SMA was proved the best, as it gave the highest outputs with fast convergence. However, Figure 7b shows the convergence curve of the maximum value obtained by the SMA.
For more understanding of the behavior of the agents throughout the searching process in the SMA algorithm, Figure 8 shows the distribution of the four components of the proposed five solutions at every iteration. Every component represents one of the unknown variables. Figure 8a illustrates the convergence curve of the output while Figure 8b–d shows the convergence curves of the controlling variables obtained using SMA.
Table 5 tabulates the resulting hydrogen production and their corresponding values of the controlling variables for the different methodologies. The table shows that the proposed strategy provided the maximum value of hydrogen in comparison to the experimental and the RSM methods. It is clear from the table that the proposed strategy increased the hydrogen production by 15.7 μmol/min compared to both the measured and RSM methodologies. Moreover, the values of the controlling variables were more reasonable than those obtained by the RSM.

5. Conclusions

This paper contribution is an efficient and robust methodology to maximize the hydrogen production based on determining the optimal parameters of the methane reforming process. The suggested methodology contains two main parts: ANFIS modelling, and parameter identification. Regarding the accuracy of the model, the RMSE value reached 0.0668, while the R2 value was 0.981. Then, the slime mold algorithm was employed to identify the optimal parameters of the methane reforming process. The maximum hydrogen production by the proposed strategy was 2.8 μmol/min at an irradiation time (min), metal loading, methane concentration, and steam concentration of 10.0%, 0.99%, 39.76%, and 1.5%, respectively. Therefore, by using the SMA, the hydrogen production increased by 15.7% over all the considered methods. Accordingly, the proposed method of collaborating the AI and optimization tools proved its efficiency in obtaining the optimal set of parameters that maximizes the hydrogen production of the methane reforming process.

Author Contributions

A.M.N.: Supervision, Methodology, Conceptualization, Investigation, Software, Formal analysis, Writing—review and editing. A.H.: Conceptualization, Software, Formal analysis, Investigation, Visualization, Writing—review and editing. All authors have read and agreed to the published version of the manuscript.

Funding

This research received no external funding or This research was funded by Prince Sattam Bin Abdulaziz University grant number (IF-PSAU-2021/01/18736).

Institutional Review Board Statement

Not applicable.

Informed Consent Statement

Not applicable.

Data Availability Statement

Not applicable.

Acknowledgments

The authors extend their appreciation to the Deputyship for Research and Innovation, Ministry of Education in Saudi Arabia, for funding this research work through the project number (IF-PSAU-2021/01/18736).

Conflicts of Interest

The authors declare no conflict of interest.

References

  1. Wilberforce, T.; Olabi, A.G.; Sayed, E.T.; Elsaid, K.; Abdelkareem, M.A. Progress in carbon capture technologies. Sci. Total Environ. 2021, 761, 143203. [Google Scholar] [CrossRef] [PubMed]
  2. Olabi, A.G.; Obaideen, K.; Elsaid, K.; Wilberforce, T.; Sayed, E.T.; Maghrabie, H.M.; Abdelkareem, M.A. Assessment of the pre-combustion carbon capture contribution into sustainable development goals SDGs using novel indicators. Renew. Sustain. Energy Rev. 2022, 153, 111710. [Google Scholar] [CrossRef]
  3. Olabi, A.G.; Bahri, A.s.; Abdelghafar, A.A.; Baroutaji, A.; Sayed, E.T.; Alami, A.H.; Rezk, H.; Abdelkareem, M.A. Large-vscale hydrogen production and storage technologies: Current status and future directions. Int. J. Hydrog. Energy 2021, 46, 23498–23528. [Google Scholar] [CrossRef]
  4. Salameh, T.; Abdelkareem, M.A.; Olabi, A.G.; Sayed, E.T.; Al-Chaderchi, M.; Rezk, H. Integrated standalone hybrid solar PV, fuel cell and diesel generator power system for battery or supercapacitor storage systems in Khorfakkan, United Arab Emirates. Int. J. Hydrog. Energy 2021, 46, 6014–6027. [Google Scholar] [CrossRef]
  5. Abdelkareem, M.A.; Elsaid, K.; Wilberforce, T.; Kamil, M.; Sayed, E.T.; Olabi, A. Environmental aspects of fuel cells: A review. Sci. Total Environ. 2021, 752, 141803. [Google Scholar] [CrossRef]
  6. Abdelkareem, M.A.; Lootah, M.A.; Sayed, E.T.; Wilberforce, T.; Alawadhi, H.; Yousef, B.A.A.; Olabi, A.G. Fuel cells for carbon capture applications. Sci. Total Environ. 2021, 769, 144243. [Google Scholar] [CrossRef]
  7. Cano, Z.P.; Banham, D.; Ye, S.; Hintennach, A.; Lu, J.; Fowler, M.; Chen, Z. Batteries and fuel cells for emerging electric vehicle markets. Nat. Energy 2018, 3, 279–289. [Google Scholar] [CrossRef]
  8. Olabi, A.G.; Wilberforce, T.; Abdelkareem, M.A. Fuel cell application in the automotive industry and future perspective. Energy 2021, 214, 118955. [Google Scholar] [CrossRef]
  9. Diaz, E.; Epstein, M.; Romero, M.; González-Aguilar, J. Performance assessment of concentrated solar power plants based on carbon and hydrogen fuel cells. Int. J. Hydrog. Energy 2018, 43, 5852–5862. [Google Scholar] [CrossRef]
  10. Bicer, Y.; Khalid, F. Life cycle environmental impact comparison of solid oxide fuel cells fueled by natural gas, hydrogen, ammonia and methanol for combined heat and power generation. Int. J. Hydrog. Energy 2020, 45, 3670–3685. [Google Scholar] [CrossRef]
  11. Gao, J.; Wang, X.; Song, P.; Tian, G.; Ma, C. Review of the backfire occurrences and control strategies for port hydrogen injection internal combustion engines. Fuel 2022, 307, 121553. [Google Scholar] [CrossRef]
  12. Kim, H.; Song, S. Concept design of a novel reformer producing hydrogen for internal combustion engines using fuel decomposition method: Performance evaluation of coated monolith suitable for on-board applications. Int. J. Hydrog. Energy 2020, 45, 9353–9367. [Google Scholar] [CrossRef]
  13. Salameh, T.; Sayed, E.T.; Abdelkareem, M.A.; Olabi, A.; Rezk, H. Optimal selection and management of hybrid renewable energy System: Neom city as a case study. Energy Convers. Manag. 2021, 244, 114434. [Google Scholar] [CrossRef]
  14. Palhares, D.D.D.F.; Vieira, L.; Damasceno, J.J.R. Hydrogen production by a low-cost electrolyzer developed through the combination of alkaline water electrolysis and solar energy use. Int. J. Hydrogen Energy 2018, 43, 4265–4275. [Google Scholar] [CrossRef]
  15. Mahmoud, M.; Ramadan, M.; Naher, S.; Pullen, K.; Abdelkareem, M.A.; Olabi, A.-G. A review of geothermal energy-driven hydrogen production systems. Therm. Sci. Eng. Prog. 2021, 22, 100854. [Google Scholar] [CrossRef]
  16. Mostafaeipour, A.; Dehshiri, S.J.H. Ranking locations for producing hydrogen using geothermal energy in Afghanistan. Int. J. Hydrogen Energy 2020, 45, 15924–15940. [Google Scholar] [CrossRef]
  17. Boretti, A. Production of hydrogen for export from wind and solar energy, natural gas, and coal in Australia. Int. J. Hydrogen Energy 2020, 45, 3899–3904. [Google Scholar] [CrossRef]
  18. Ayodele, T.; Munda, J. Potential and economic viability of green hydrogen production by water electrolysis using wind energy resources in South Africa. Int. J. Hydrogen Energy 2019, 44, 17669–17687. [Google Scholar] [CrossRef]
  19. Nemmour, A.; Ghenai, C.; Inayat, A. Parametric study and optimization of bio-hydrogen production using steam reforming of glycerol and biodiesel fuel mixtures. Biomass. Convers. Biorefinery 2021, 1–13. [Google Scholar] [CrossRef]
  20. Ewan, B.; Allen, R. A figure of merit assessment of the routes to hydrogen. Int. J. Hydrogen Energy 2005, 30, 809–819. [Google Scholar] [CrossRef]
  21. Chen, S.; Pei, C.; Gong, J. Insights into interface engineering in steam reforming reactions for hydrogen production. Energy Environ. Sci. 2019, 12, 3473–3495. [Google Scholar] [CrossRef]
  22. Bepari, S.; Kuila, D. Steam reforming of methanol, ethanol and glycerol over nickel-based catalysts—A review. Int. J. Hydrogen Energy 2019, 45, 18090–18113. [Google Scholar] [CrossRef]
  23. Shagdar, E.; Lougou, B.G.; Shuai, Y.; Ganbold, E.; Chinonso, O.P.; Tan, H. Process analysis of solar steam reforming of methane for producing low-carbon hydrogen. RSC Adv. 2020, 10, 12582–12597. [Google Scholar] [CrossRef]
  24. Sayed, E.T.; Wilberforce, T.; Elsaid, K.; Rabaia, M.K.H.; Abdelkareem, M.A.; Chae, K.-J.; Olabi, A.G. A critical review on environmental impacts of renewable energy systems and mitigation strategies: Wind, hydro, biomass and geothermal. Sci. Total Environ. 2021, 766, 144505. [Google Scholar] [CrossRef] [PubMed]
  25. Rabaia, M.K.H.; Abdelkareem, M.A.; Sayed, E.T.; Elsaid, K.; Chae, K.-J.; Wilberforce, T.; Olabi, A. Environmental impacts of solar energy systems: A review. Sci. Total Environ. 2021, 754, 141989. [Google Scholar] [CrossRef]
  26. Obaideen, K.; AlMallahi, M.N.; Alami, A.H.; Ramadan, M.; Abdelkareem, M.A.; Shehata, N.; Olabi, A.G. On the contribution of solar energy to sustainable developments goals: Case study on Mohammed bin Rashid Al Maktoum Solar Park. Int. J. Thermoluids 2021, 12, 100123. [Google Scholar] [CrossRef]
  27. López-Martín, A.; Platero, F.; Caballero, A.; Colón, G. Thermo-Photocatalytic Methanol Reforming for Hydrogen Production over a CuPd−TiO 2 Catalyst. ChemPhotoChem 2020, 4, 630–637. [Google Scholar] [CrossRef]
  28. Yoshida, H.; Mizuba, S.; Yamamoto, A. Preparation of sodium hexatitanate photocatalysts by a flux method for photocatalytic steam reforming of methane. Catal. Today 2019, 334, 30–36. [Google Scholar] [CrossRef]
  29. Anzai, A.; Fujiwara, K.; Yamamoto, A.; Yoshida, H. Platinum-loaded lanthanum-doped calcium titanate photocatalysts prepared by a flux method for photocatalytic steam reforming of methane. Catal. Today 2020, 352, 1–9. [Google Scholar] [CrossRef]
  30. Shimura, K.; Yoshida, H. Semiconductor Photocatalysts for Non-oxidative Coupling, Dry Reforming and Steam Reforming of Methane. Catal. Surv. Asia 2014, 18, 24–33. [Google Scholar] [CrossRef] [Green Version]
  31. Ayodele, B.V.; Ghazali, A.A.; Yassin, M.Y.M.; Abdullah, S. Optimization of hydrogen production by photocatalytic steam methane reforming over lanthanum modified Titanium (IV) oxide using response surface methodology. Int. J. Hydrog. Energy 2019, 44, 20700–20710. [Google Scholar] [CrossRef]
  32. Li, S.; Chen, H.; Wang, M.; Heidari, A.A.; Mirjalili, S. Slime mould algorithm: A new method for stochastic optimization. Future Gener. Comput. Syst. 2020, 111, 300–323. [Google Scholar] [CrossRef]
  33. Abdelkareem, M.A.; Tanveer, W.H.; Sayed, E.; Assad, M.E.H.; Allagui, A.; Cha, S. On the technical challenges affecting the performance of direct internal reforming biogas solid oxide fuel cells. Renew. Sustain. Energy Rev. 2019, 101, 361–375. [Google Scholar] [CrossRef]
Figure 1. ANFIS structure of 2-input single-output and 2-rule system.
Sustainability 14 02970 g001
Figure 2. Fuzzy model configuration.
Sustainability 14 02970 g002
Figure 3. ANFIS model inputs’ MFs.
Sustainability 14 02970 g003
Figure 4. Three-dimensional spatial shape that relates the normalized input controlling parameters.
Sustainability 14 02970 g004
Figure 5. ANFIS model’s outputs against the experimental data.
Sustainability 14 02970 g005
Figure 6. ANIFS model prediction accuracy.
Sustainability 14 02970 g006
Figure 7. (a) Cost function evaluation using different optimizers; (b) Convergence curve of the maximum value obtained by the SMA.
Sustainability 14 02970 g007
Figure 8. Agents’ variations for best run using SMA.
Sustainability 14 02970 g008
Table 1. Statistical evaluation of the fuzzy-based models.
MSERMSECoefficient of Determination (R2)
TrainTestAllTrainTestAllTrainTestAll
4.42E-130.00450.0016.64E-070.06680.032110.9810.997
Table 2. Parameter values of the considering optimizers.
AlgorithmParameter Values
SMAz = 0.03
PSOC1 = 1.5; C2 = 2
HHOa1 = 2; a2 = 1; GP = 0.5
EESHHOa1 = 2; a2 = 1; GP = 0.5
Table 3. Comparison between the resulting hydrogen production of the four algorithms over 30 runs.
RunPSOHHOSMAEESHHORunPSOHHOSMAEESHHO
12.80872.80892.80872.5206161.8822.80472.66342.8089
22.80882.45442.80892.664172.80882.65672.48772.8089
32.6642.6752.80892.8082182.80882.80892.80872.8089
42.66392.80892.6642.664192.80882.71872.80882.7418
52.80892.80892.66382.6326202.52082.77112.6642.6606
62.7972.79762.51832.5512212.80812.80392.51912.8089
72.6642.80892.80892.6123222.6642.80892.66392.664
82.51962.80892.52042.664232.80882.39982.80882.5209
92.51872.3892.52062.7394241.8742.6642.6642.5209
102.80882.68922.80892.6136252.80872.77922.80822.6258
112.80852.7272.80882.6115262.80842.41522.80782.7358
122.52072.6882.6642.6444272.80662.80762.80892.5167
132.19362.6182.66392.679282.80822.31312.80872.8089
142.80892.6642.51152.4188292.80662.66342.80892.8088
152.80892.6642.66392.664302.6642.80352.6642.5852
Table 4. Statistical measures of the optimizers’ results.
PSOHHOSMAEESHHO
Best2.808862.808862.808862.80886
Worst1.873992.313142.487652.4188
Mean2.662992.687642.701282.66375
STD0.252460.145710.11390.11597
Variance0.063740.021230.012970.01123
Median2.807352.722832.664042.66404
Table 5. Optimal parameters using different strategies.
StrategyIrradiation Time (min)Metal Loading %Methane Conc.
%
Steam Conc.
%
Hydrogen Prod. μmol/minImprovement
(%)
Measured [31]1013012.42-
RSM [31]146.15 2.9422.831.242.420
Suggested strategy10.0050.999939.761.52.8+15.7
Publisher’s Note: MDPI stays neutral with regard to jurisdictional claims in published maps and institutional affiliations.

