Article

A New Trend Pattern-Matching Method of Interactive Case-Based Reasoning for Stock Price Predictions

1
Department of Business Administration, Seoul National University of Science and Technology, 232 Gongneung-ro, Nowon-gu, Seoul 139-743, Korea
2
Department of Mechanical System Design Engineering, Seoul National University of Science and Technology, 232 Gongneung-ro, Nowon-gu, Seoul 139-743, Korea
*
Author to whom correspondence should be addressed.
Sustainability 2022, 14(3), 1366; https://doi.org/10.3390/su14031366
Submission received: 9 December 2021 / Revised: 21 January 2022 / Accepted: 24 January 2022 / Published: 25 January 2022
(This article belongs to the Special Issue Business Analytics and Data Mining for Business Sustainability)

Abstract

:
In this paper, we suggest a new case-based reasoning method for stock price predictions using the knowledge of traders to select similar past patterns among nearest neighbors obtained from a traditional case-based reasoning machine. Thus, this method overcomes the limitation of conventional case-based reasoning, which does not consider how to retrieve similar neighbors from previous patterns in terms of a graphical pattern. In this paper, we show how the proposed method can be used when traders find similar time series patterns among nearest cases. For this, we suggest an interactive prediction system where traders can select similar patterns with individual knowledge among automatically recommended neighbors by case-based reasoning. In this paper, we demonstrate how traders can use their knowledge to select similar patterns using a graphical interface, serving as an exemplar for the target. These concepts are investigated against the backdrop of a practical application involving the prediction of three individual stock prices, i.e., Zoom, Airbnb, and Twitter, as well as the prediction of the Dow Jones Industrial Average (DJIA). The verification of the prediction results is compared with a random walk model based on the RMSE and Hit ratio. The results show that the proposed technique is more effective than the random walk model but it does not statistically surpass the random walk model.

1. Introduction

A case-based reasoning (CBR) technique is one of the popular methodologies in knowledge-based systems and uses past similar problems to solve current new problems [1,2]. Many data mining methods such as regression, ARIMA (autoregressive integrated moving average), k-NN (K-nearest neighbor), and SVM (support vector machine) have been applied to stock price predictions. Recently, deep learning techniques such as LSTM and RNN have also been extensively applied to the task of predicting financial variables [3,4]. However, there is a paucity of research on stock prediction using k-NN or CBR techniques [2].
In this paper, we suggest a new case-based reasoning method for stock price predictions using the knowledge of traders to select similar past patterns among nearest neighbors from a traditional case-based reasoning machine. Thus, this method overcomes the limitation of a conventional case-based reasoning method, which does not consider how to retrieve similar neighbors from previous patterns in terms of a graphical pattern. In this paper, we show how the proposed method can be used when traders find similar time series patterns among nearest cases. We develop a distance measurement for retrieving neighbors from that of Chun and Ko [2]. For this, we suggest an interactive prediction system where traders can choose specific time series patterns among automatically recommended neighbors by case-based reasoning with their individual knowledge.
In this paper, we present how the knowledge of traders can select similar patterns using a graphical interface, serving as an exemplar for the target. These concepts are investigated against the backdrop of a practical application involving the prediction of three individual stock prices, i.e., Zoom, Airbnb, and Twitter, as well as the Dow Jones Industrial Average (DJIA). The verification of the prediction results is compared with the random walk model based on the RMSE and Hit ratio.
The rest of this paper is organized into four sections. Section 2 reviews CBR as a knowledge discovery technique and Section 3 introduces the proposed technique, which is called interactive CBR. Section 4 presents the case study and discusses the results of the study. Finally, the concluding remarks are presented in Section 5.

2. Case-Based Reasoning and a New Trend Pattern-Matching Method

2.1. Case-Based Reasoning in the Financial Area

Case-based reasoning (CBR) is one of the knowledge-based systems that use past similar problems to solve current new problems. According to Aamodt and Plaza [5], a general CBR cycle is described by the following four processes: it solves a problem by retrieving one or more previous cases, it reuses them to solve the problem, it revises the potential solution based on the previous cases, and it retains the new experience by incorporating it into the existing case base [3]. Figure 1 presents the CBR process using the Euclidean distance method.
CBR has been intensively exploited for financial problem domains such as the prediction of the stock market [6,7,8,9,10,11,12], the prediction of corporate bond rating [13,14,15], business failure predictions [16,17,18,19,20,21], financial distress predictions [22,23], bankruptcy predictions [24,25,26,27], and other areas such as medical areas [28,29,30,31,32,33,34,35,36], recommendation systems [37,38,39], and cybersecurity [40,41].
One of the issues of using conventional CBR is how to find optimal neighbors and how to schedule the size of the target data in a time series. Chun and Park [9] suggested a model to dynamically find the optimal neighbors for each target case. Chun and Ko [2] proposed a new similarity measure, termed a shape distance, which compared how rise and fall signs between a target case and possible neighbors were similar to each other.

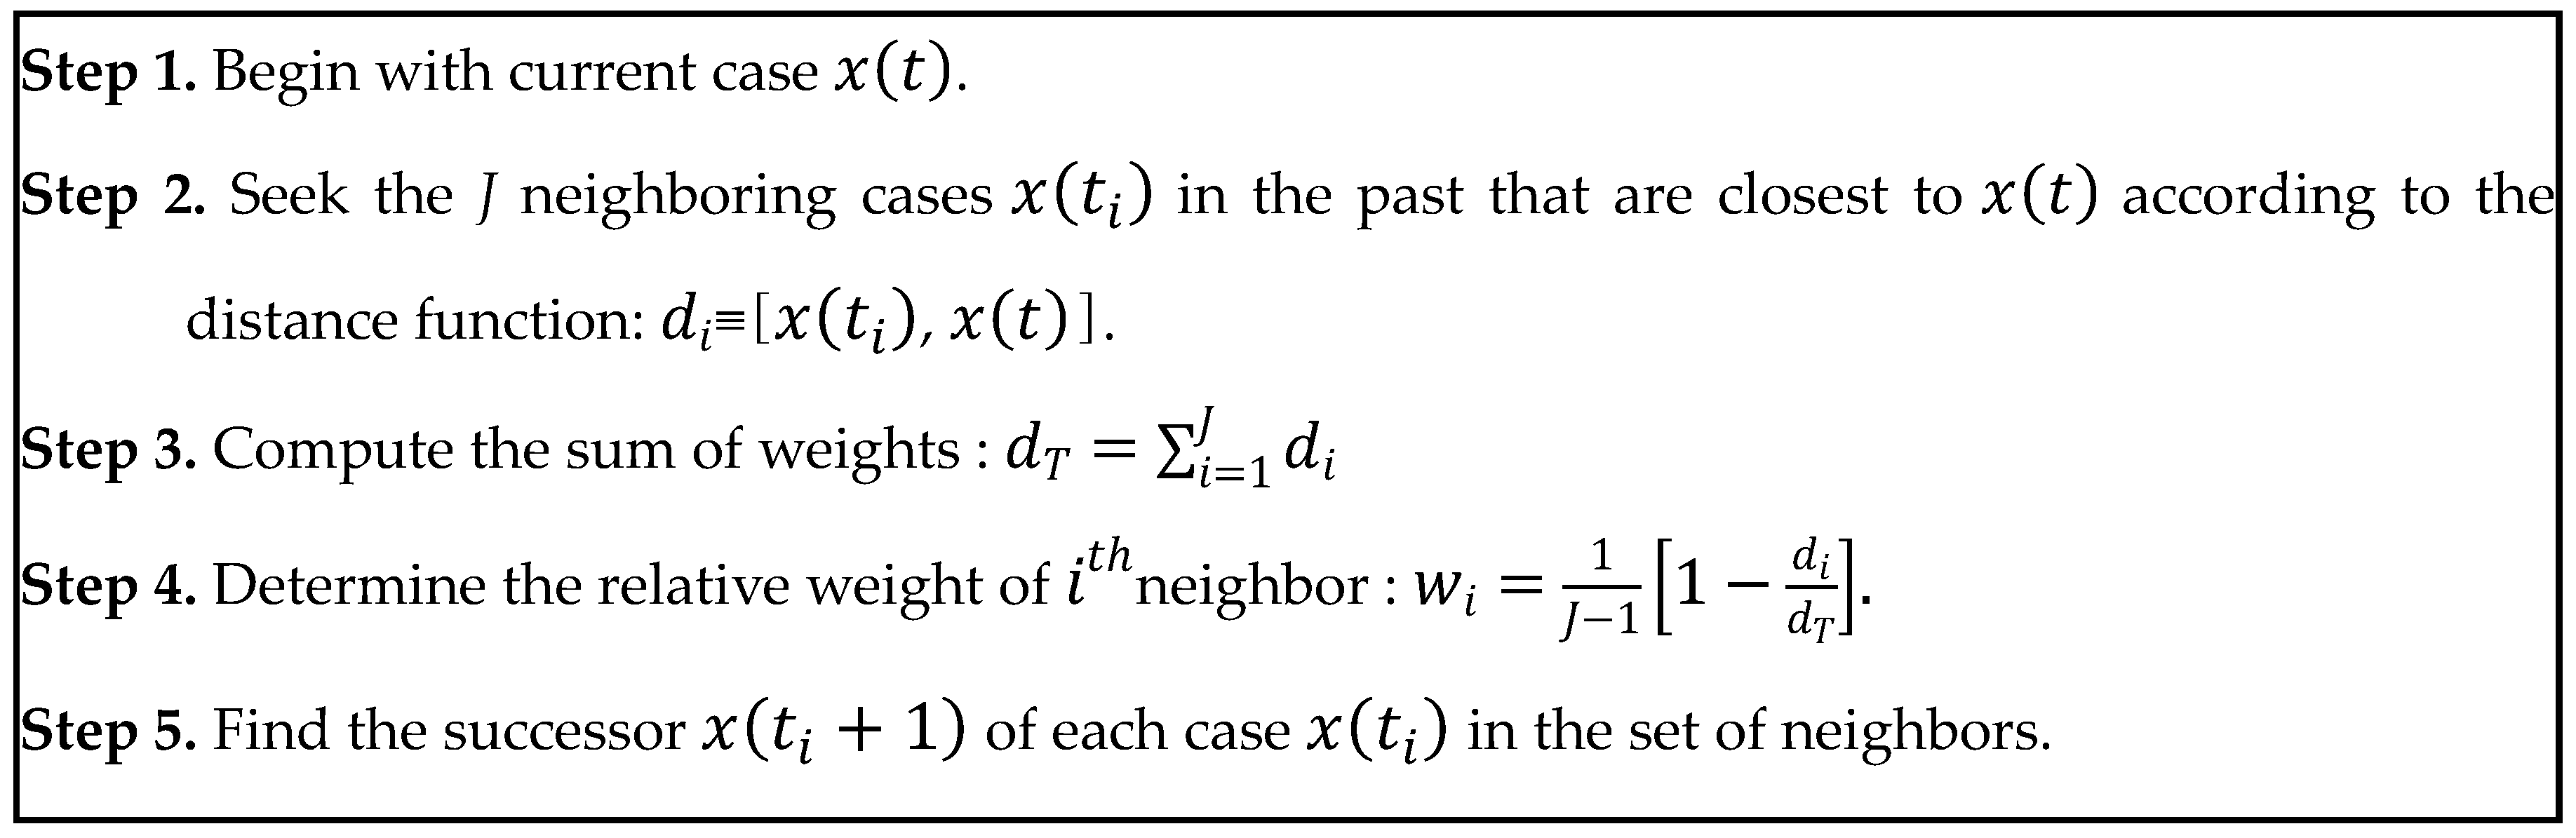
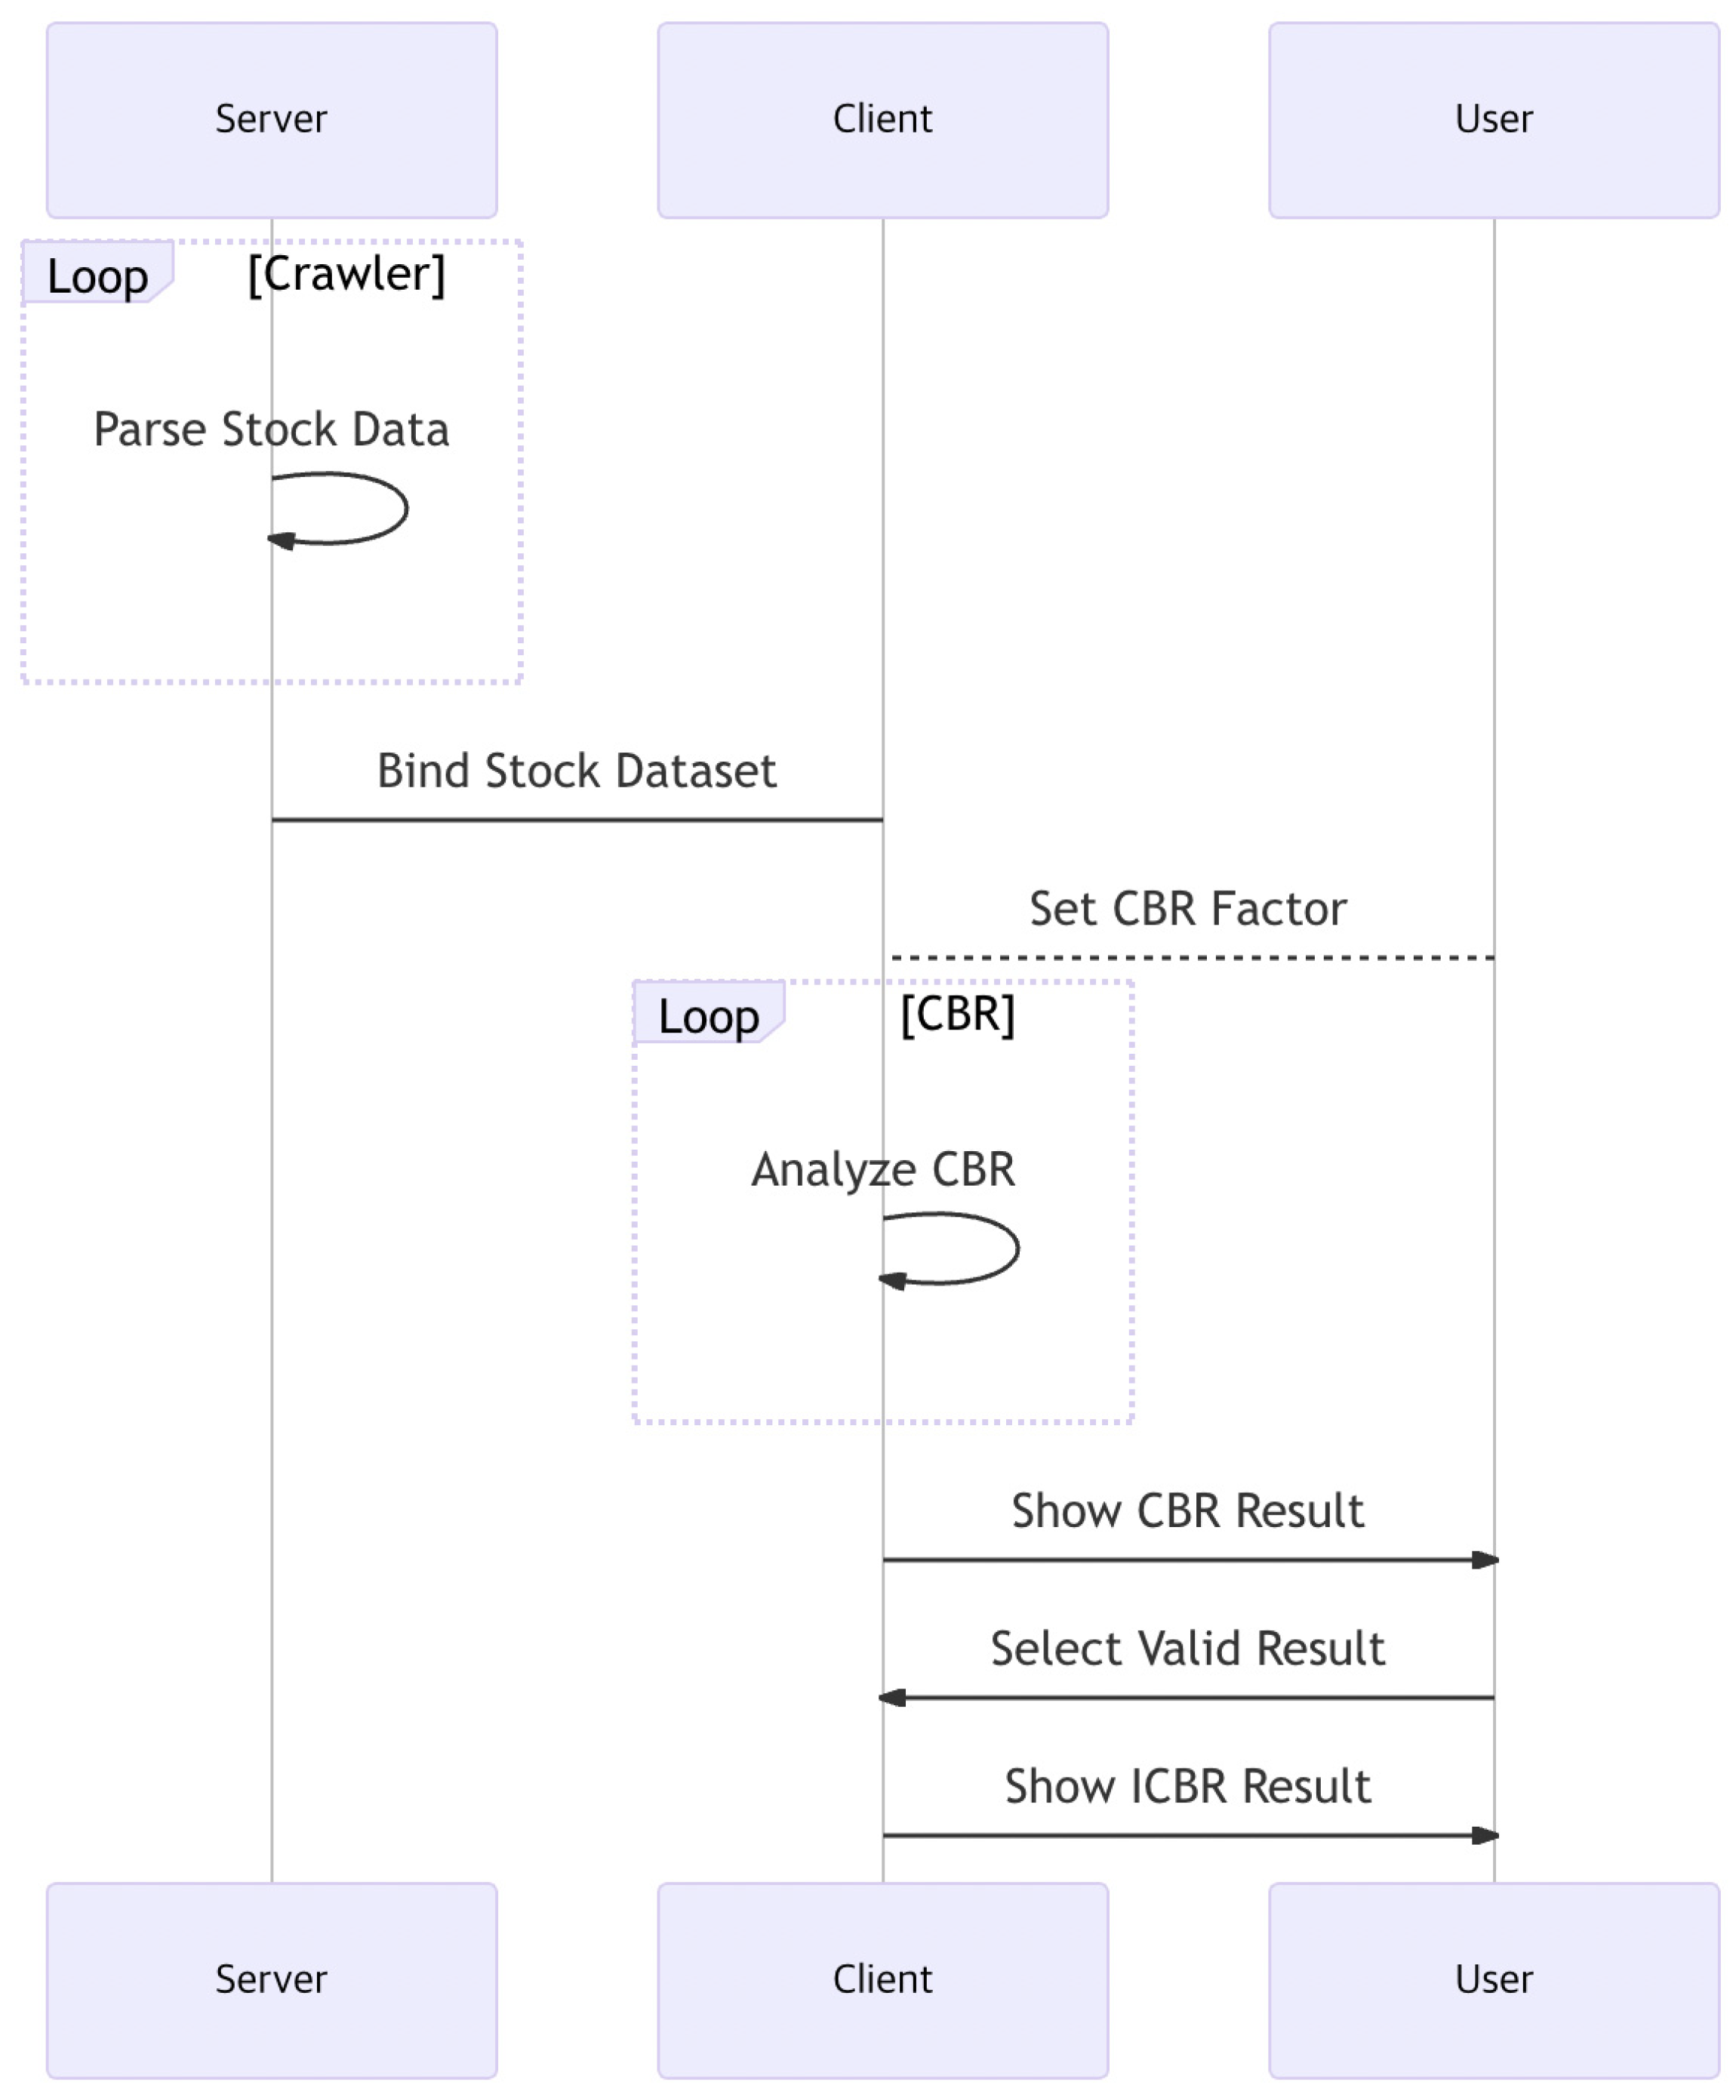
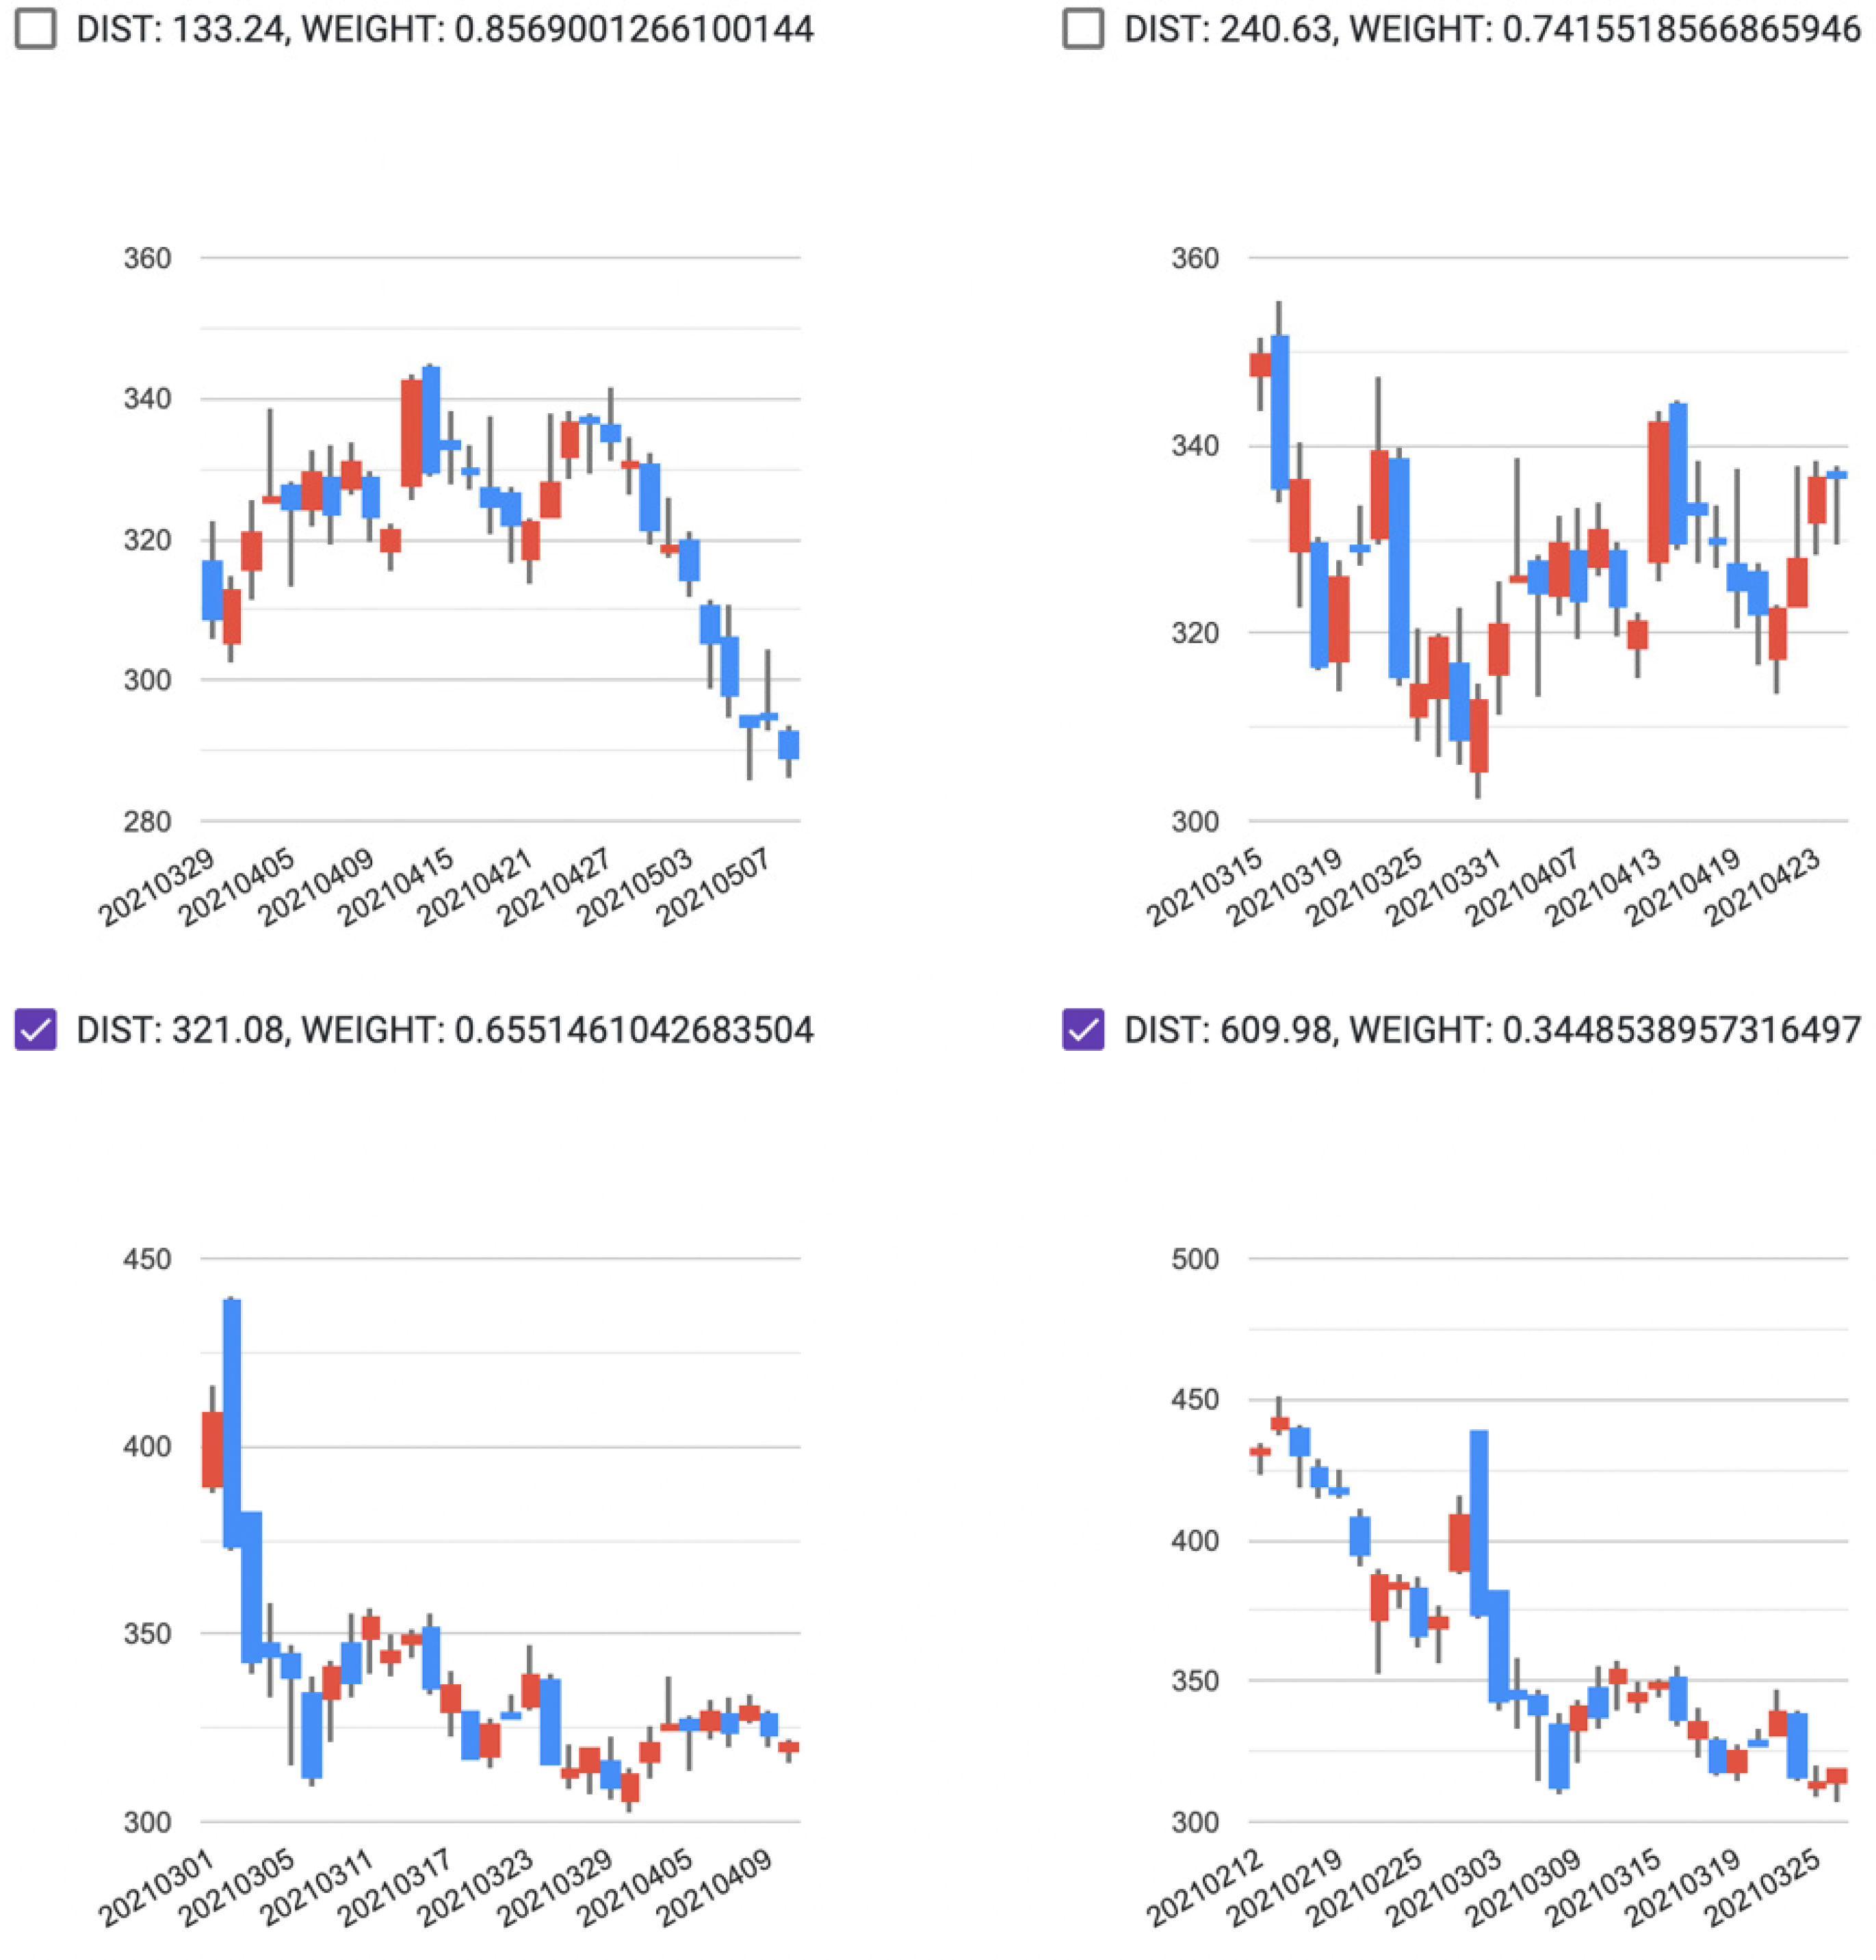
2.2. Interactive Case-Based Reasoning and the Time Series Pattern-Matching Method

In this paper, we propose a user interactive selection method that selects nearest neighbors according to a comparison of graphical patterns with target cases. In financial forecasting problems, the Hit ratio in stock prediction may be an important decision tool to invest money on the stock market. We developed a distance measurement for retrieving neighbors from that of Chun and Ko [2].
Several machine learning algorithms such as deep learning consume too many computing resources to be used at the web front-end. It is also impossible to filter the dataset that the user requires because the results that have been preprocessed at the back-end are fetched. Interactive CBR can select similar graphical patterns among neighbors that a traditional CBR machine recommends. Time series data may be characterized by patterns of behavior in terms of the volatility of rises and falls with trading volumes. Thus, selecting neighbors with similar price trends may be compared to assess the similarity between automatically recommended neighbors and the target case. Figure 2 shows a configuration diagram of the interactive CBR system and presents the procedure of selecting nearest neighbors using interactive CBR. The procedure to reselect the nearest neighbors using traditional CBR is as follows. The server crawls the stock data and collects data from websites such as Yahoo Finance and other financial information intermediaries. When a user accesses the server through the client, the server sends the stock price data that have not been processed separately to the client. To implement a CBR machine, the user sets a few CBR-related options such as the learning period, number of neighbors, and size of the time series (window size). The data are then processed in the client and displayed to the user; the user then reviews the corresponding neighbors that the CBR machine has recommended. The user selects similar patterns compared with the target patterns and obtains the predicted value using the reselected neighbors.
Figure 3 shows how users can reselect similar patterns among neighbors that the CBR machine has recommended. For example, an interactive CBR model with four neighbors and thirty window size retrieves nearest neighbors for the stock price prediction from Zoom technologies.
Figure 3 shows four neighbors that the CBR machine has recommended. The first two neighbors are somewhat different from the target case whereas the last two neighbors look similar to the target case. Thus, interactive CBR finally chooses the last two cases as nearest neighbors for the stock price prediction.
The interactive CBR system has the advantage that many users can retrieve the processing results with only a small amount of server computation required because the actual calculation is performed at the front-end client even if many users access the server. In addition, if the user has sufficient computing power, the CBR machine can send the prediction result within a shorter time than the network communication time. Thus, a user can receive the results of a CBR machine by changing the models.

3. Application to Stock Price Prediction
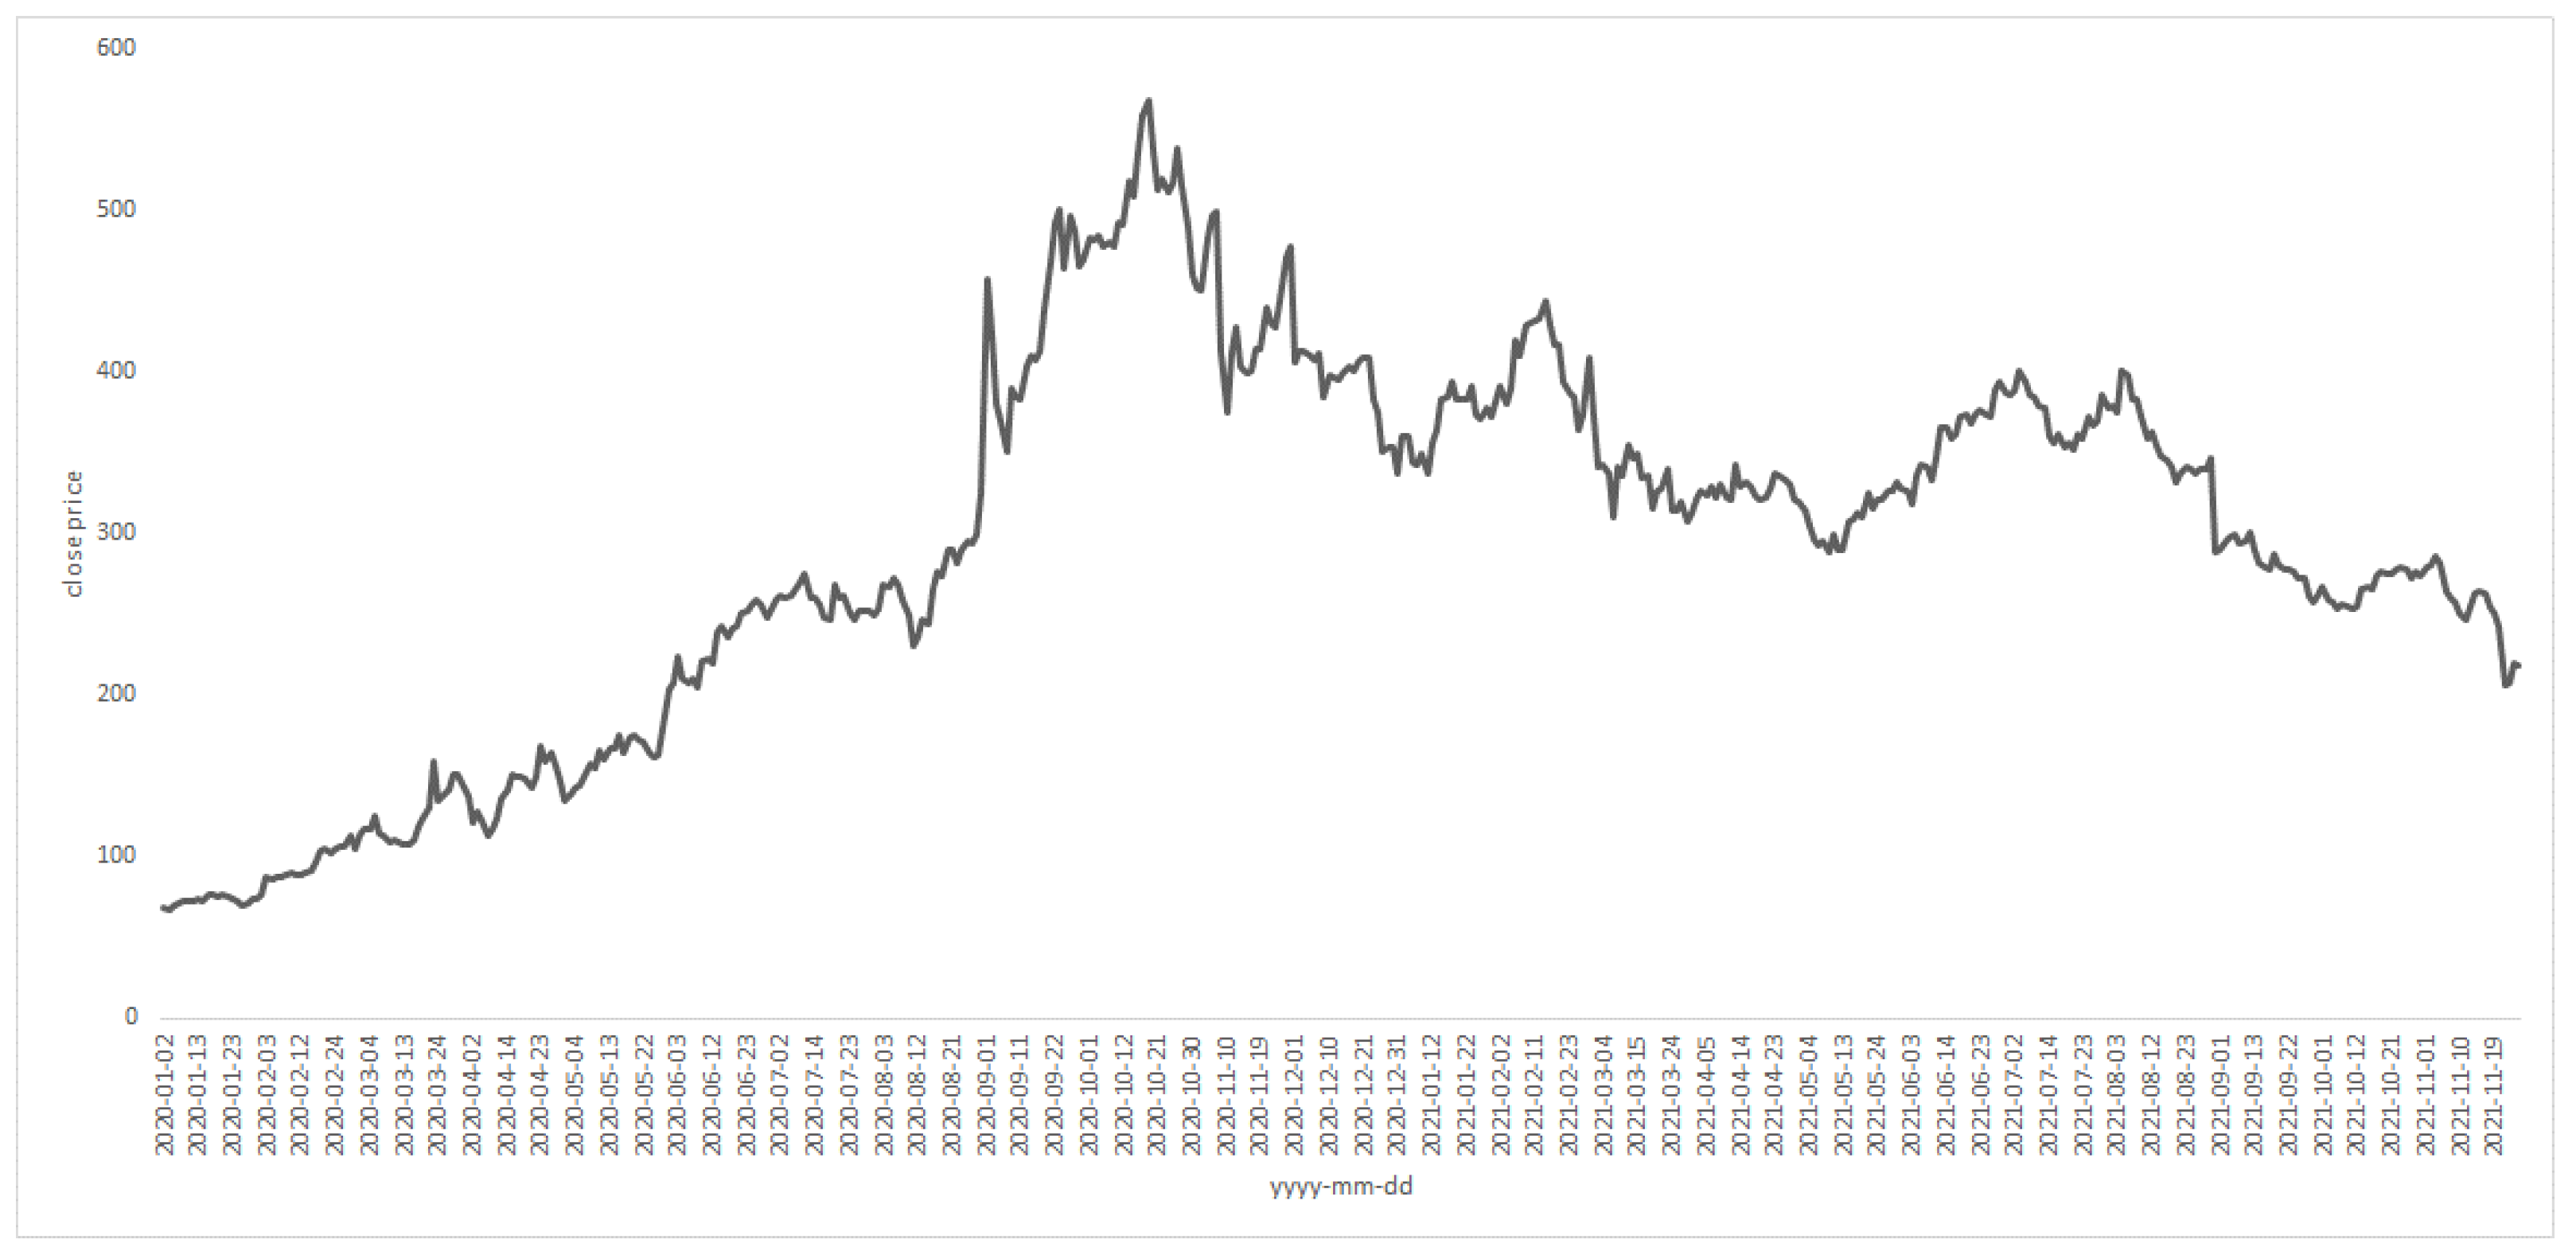
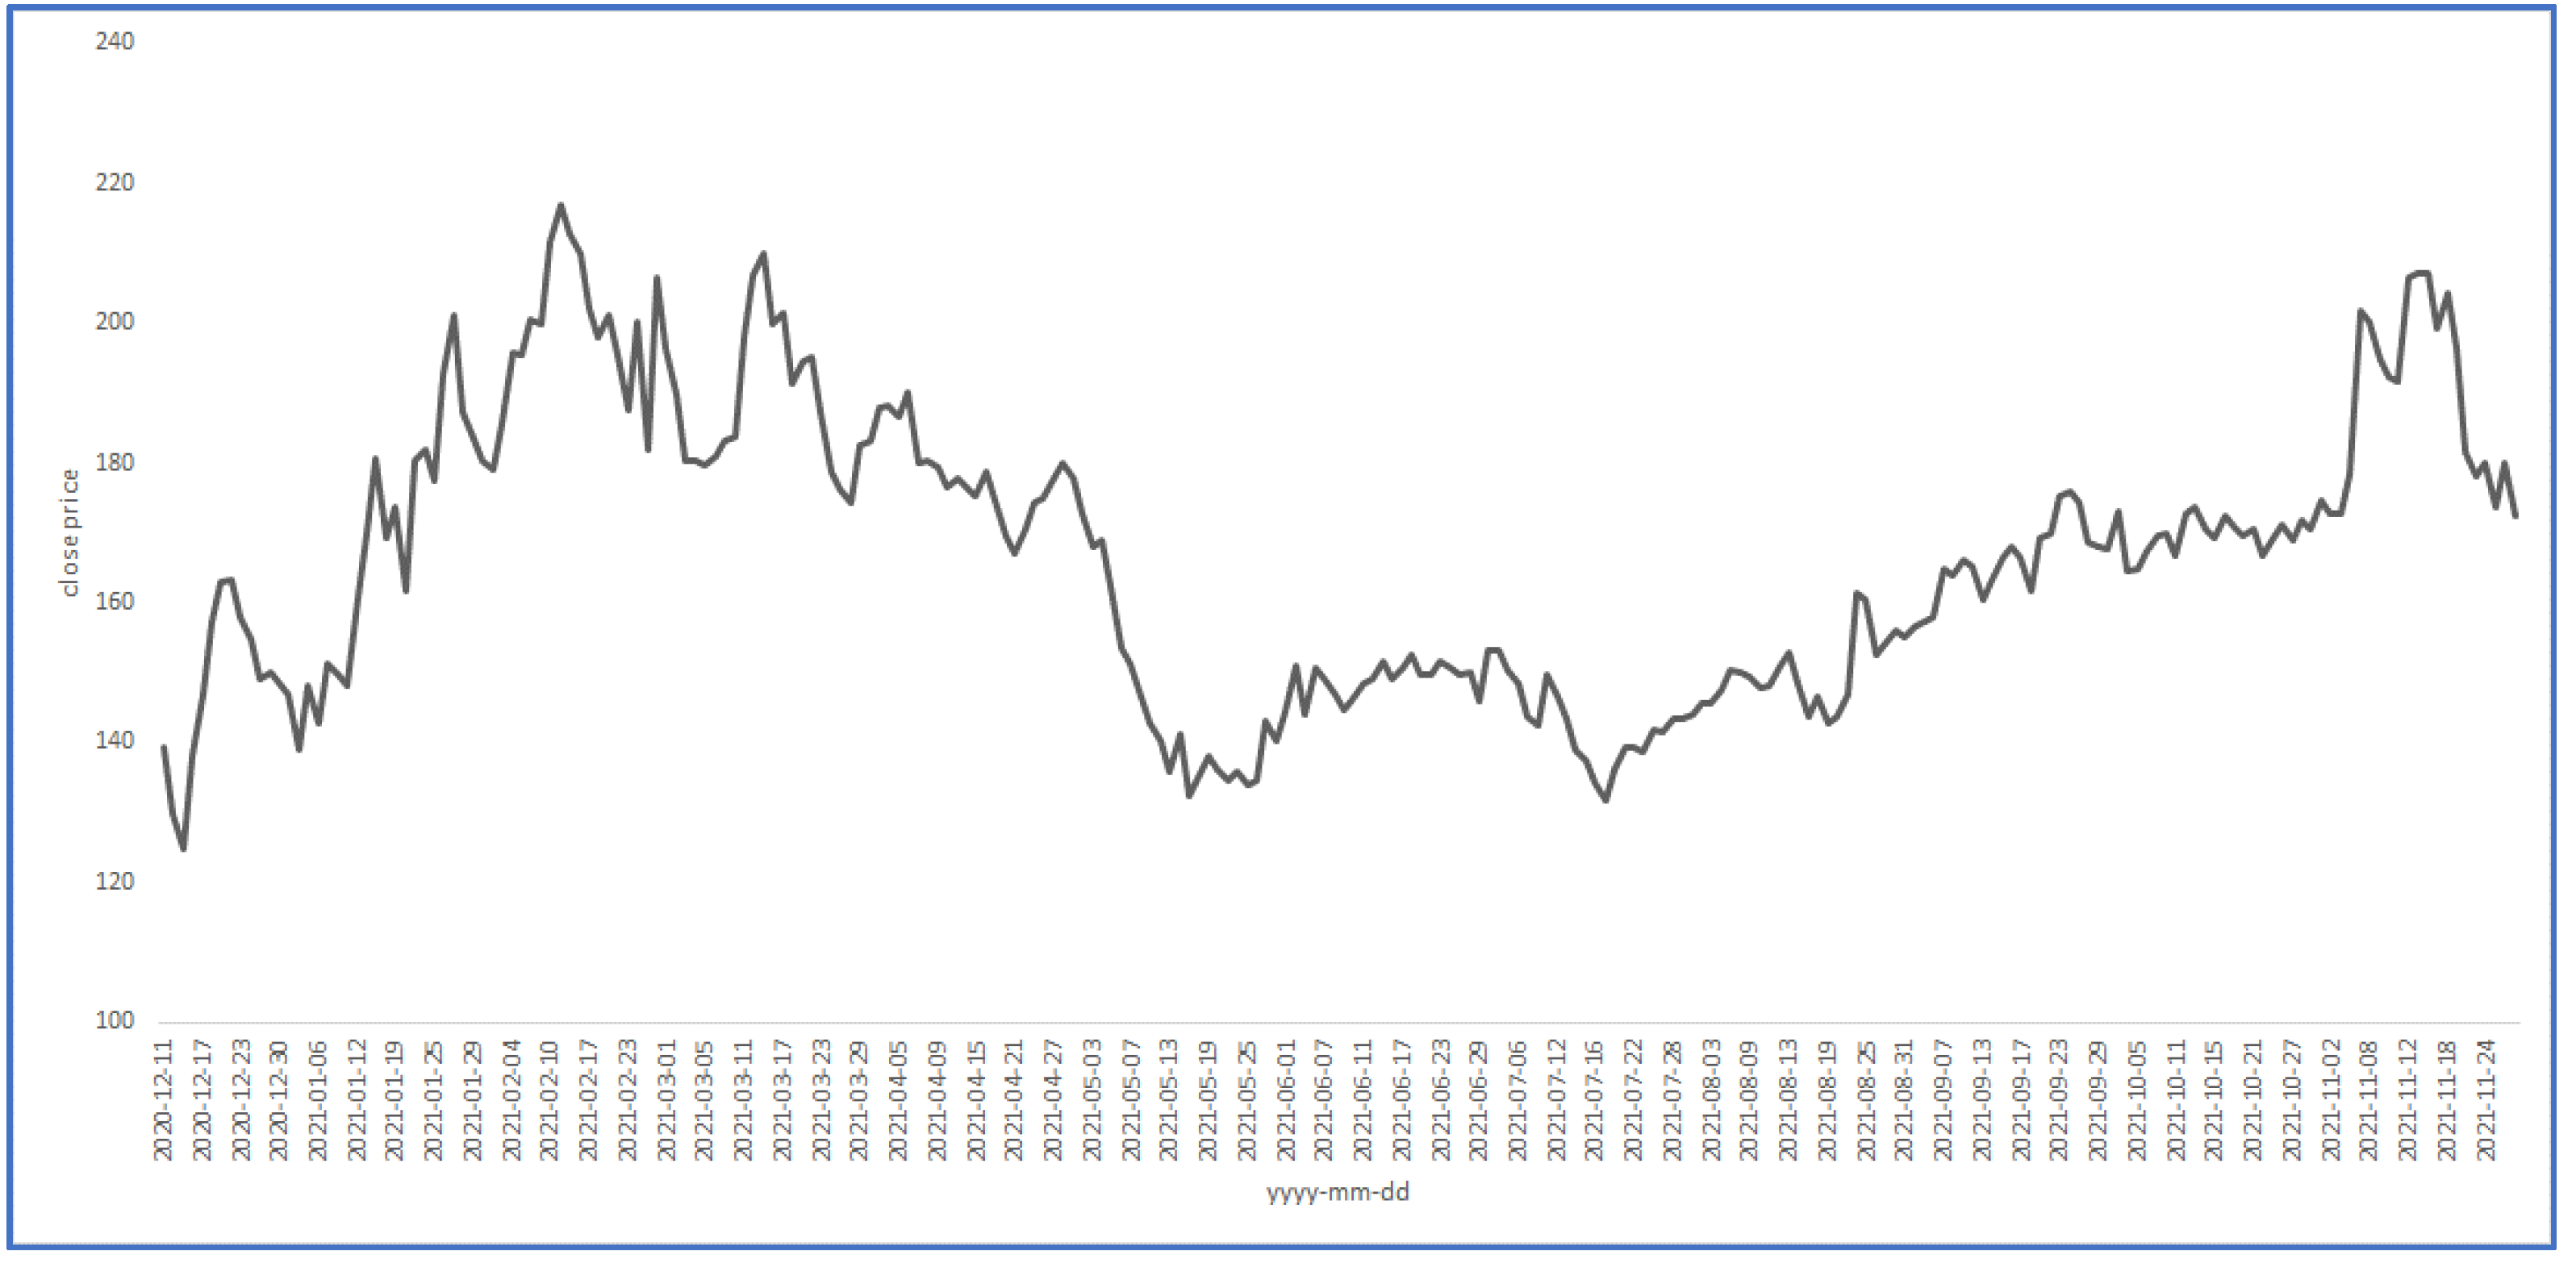
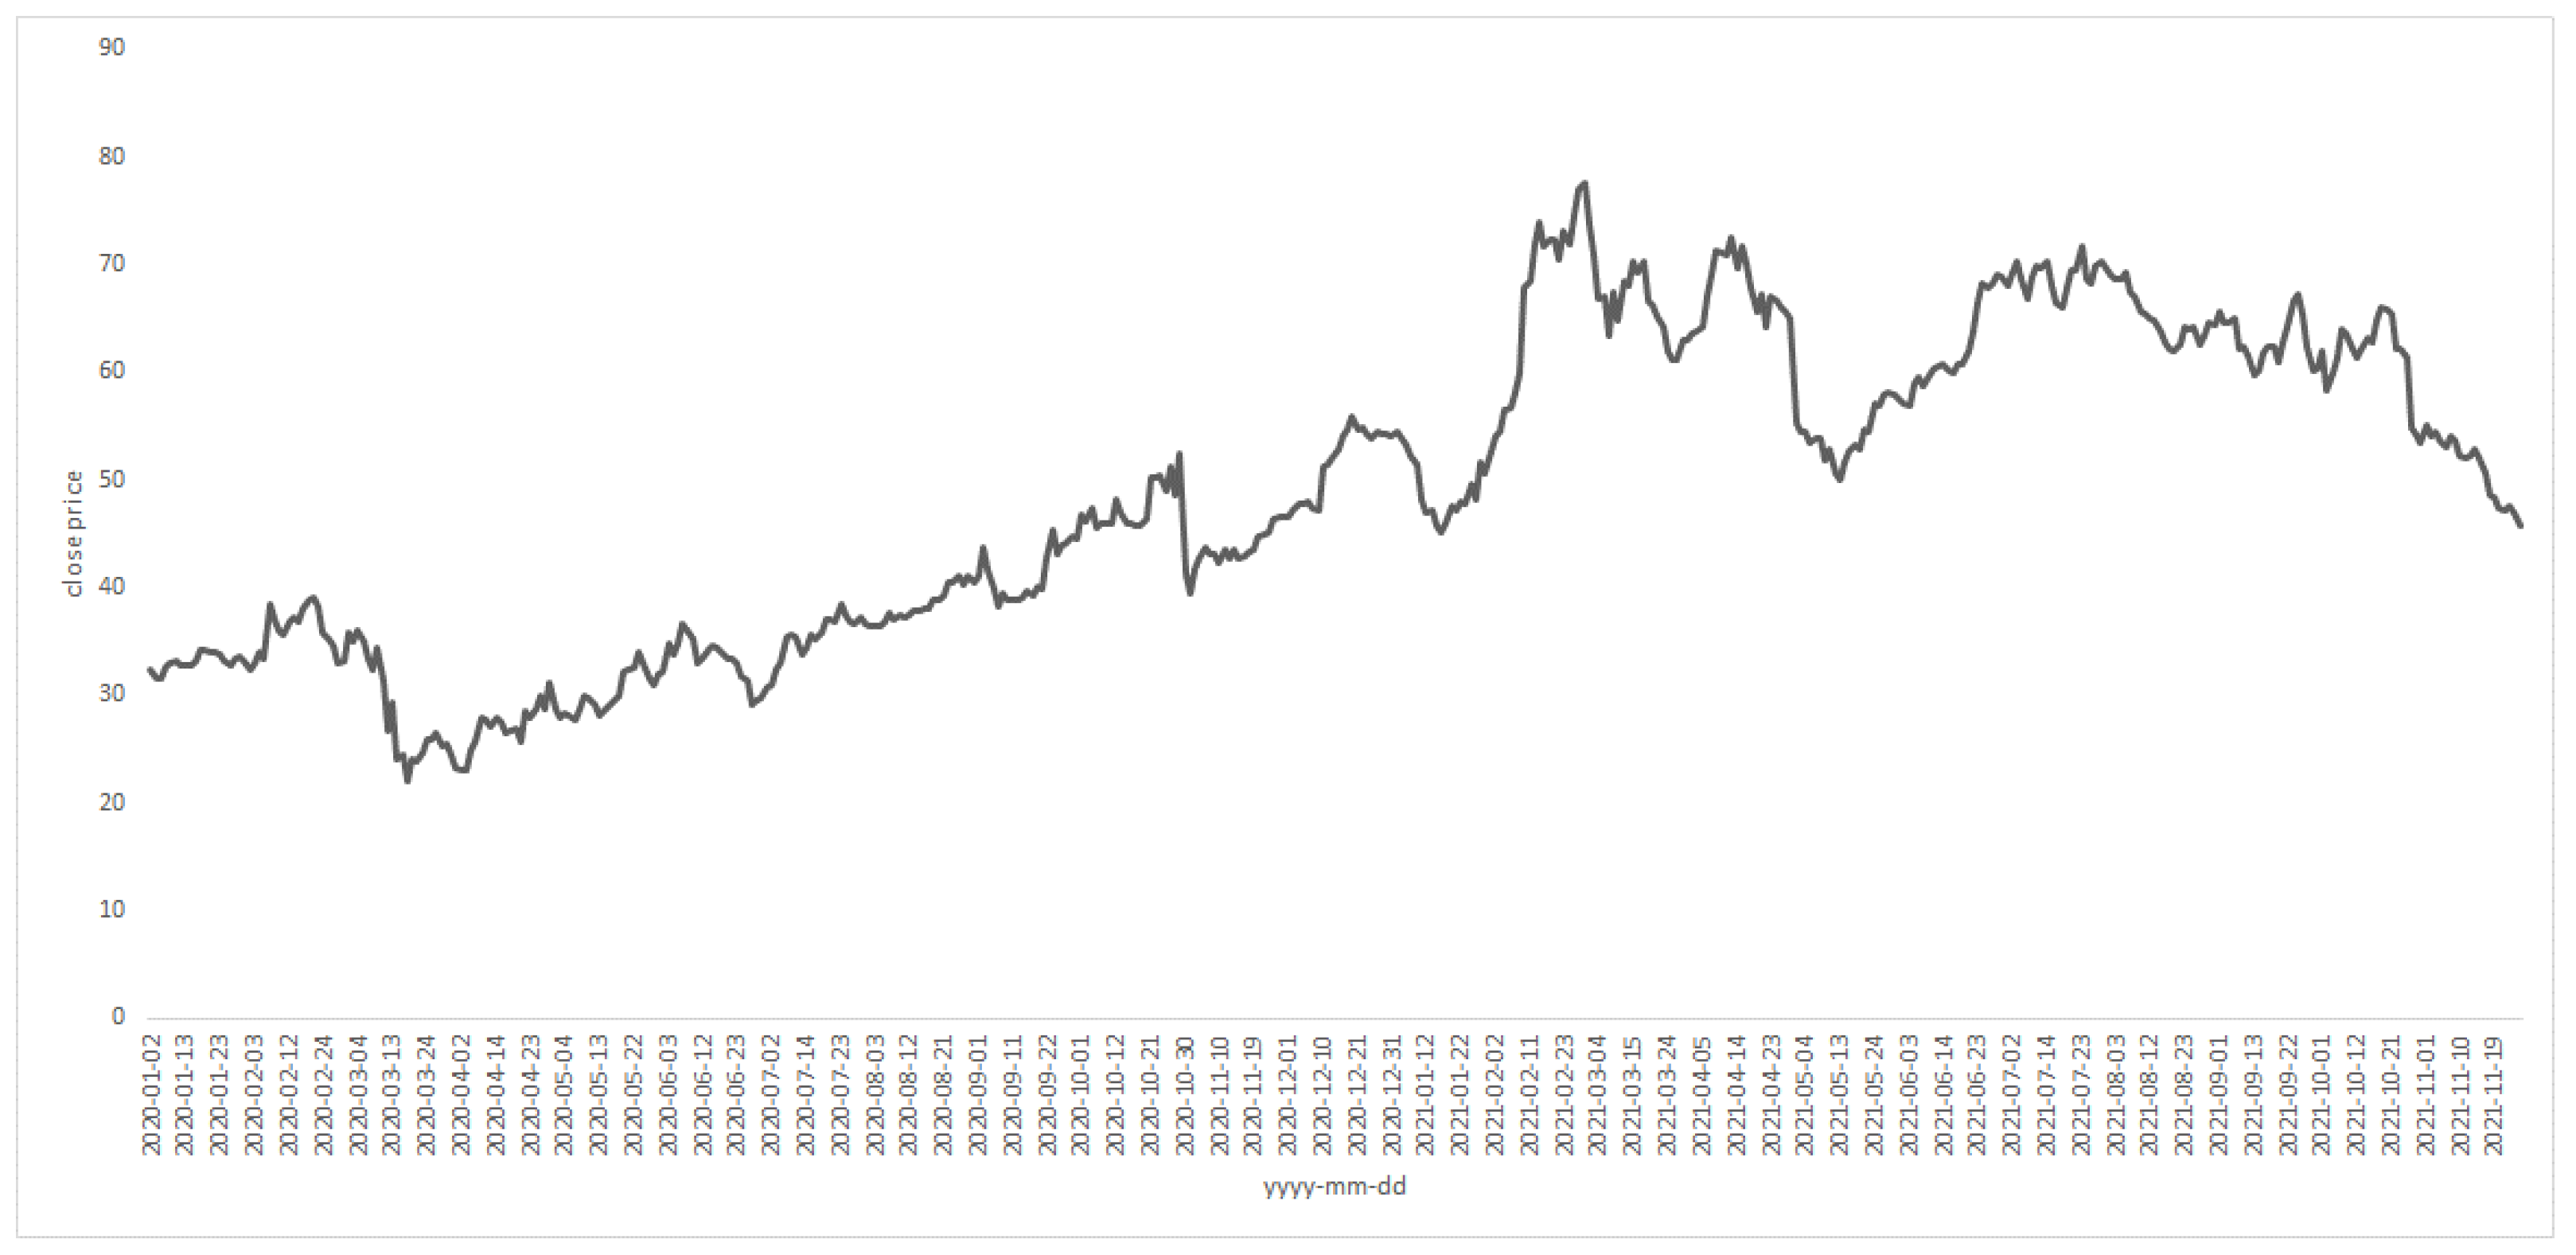
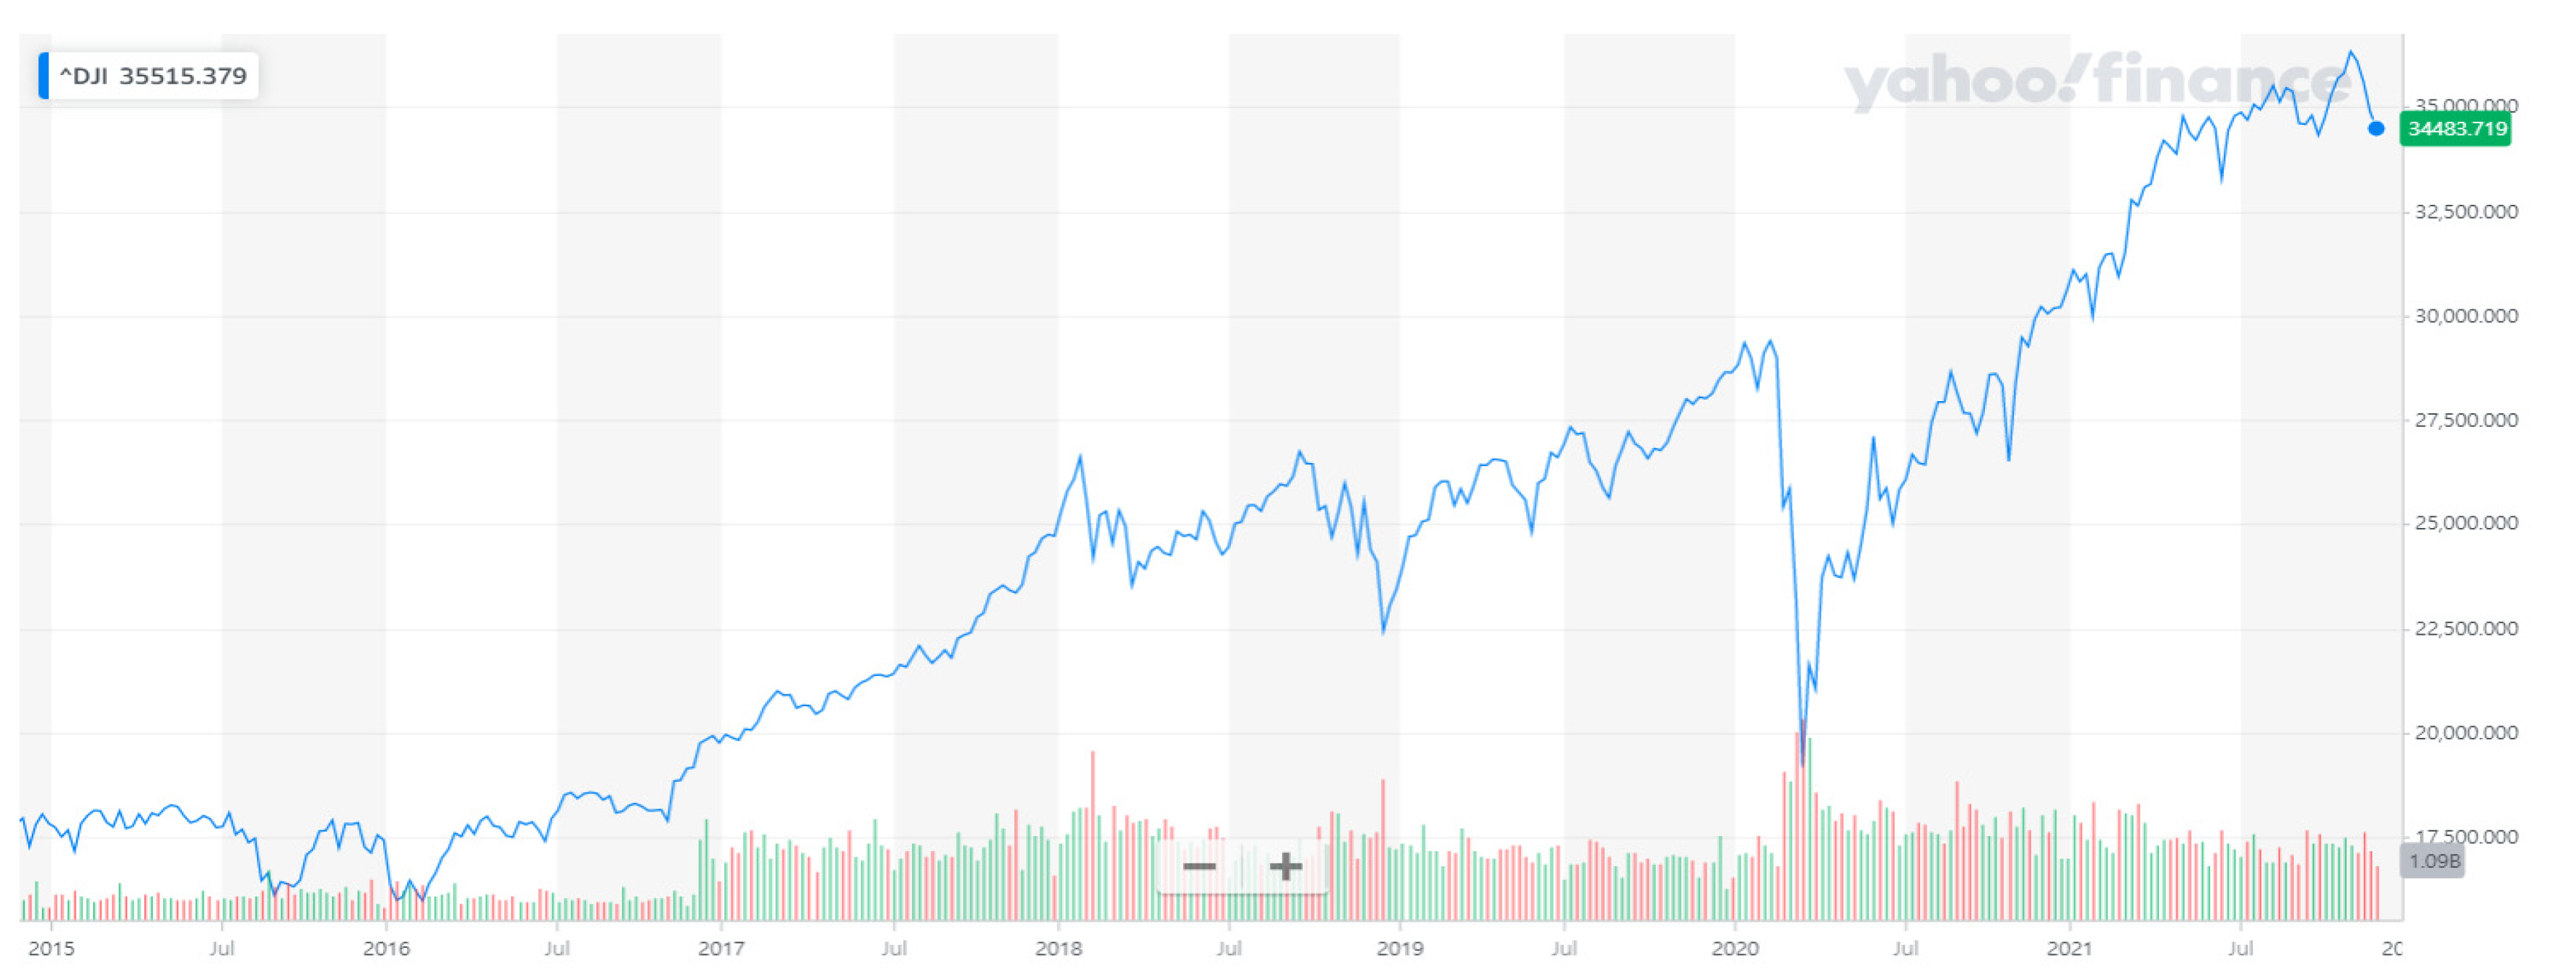
3.1. The Data

This case study intended to investigate the effect of the proposed technique on the predictive performance in forecasting a stock market. The case study involved the prediction of three individual stocks, i.e., Zoom technologies, Airbnb, and Twitter, as well as the Dow Jones Industrial Average (DJIA). For the two individual stock price predictions of Zoom and Twitter, the learning phase consisted of 464 observations from 1 January 2020 to 2 November 2021 and the testing phase consisted of 19 observations from 3 November 2021 to 30 November 2021. For Airbnb, the learning phase consisted of 225 observations from 11 December 2022 to 2 November 2021 and the testing phase consisted of 19 observations from 3 November 2021 to 30 November 2021. For the Dow Jones Industrial Average (DJIA) prediction, the learning phase consisted of 2496 observations from 1 January 2015 to 2 November 2021 and the testing phase consisted of 19 observations from 3 November 2021 to 30 November 2021.
The raw variables for these three stock prices and the DJIA prediction were as follows.
Opening Value (Open): The value of the Zoom, Airbnb, and Twitter stock prices and the DJIA at the beginning of the trading day.
Daily High (High): The highest value of Zoom, Airbnb, Twitter, and DJIA.
Daily Low (Low): The lowest value of Zoom, Airbnb, Twitter, and DJIA.
Daily Close (Close): The closing value of Zoom, Airbnb, Twitter, and DJIA.

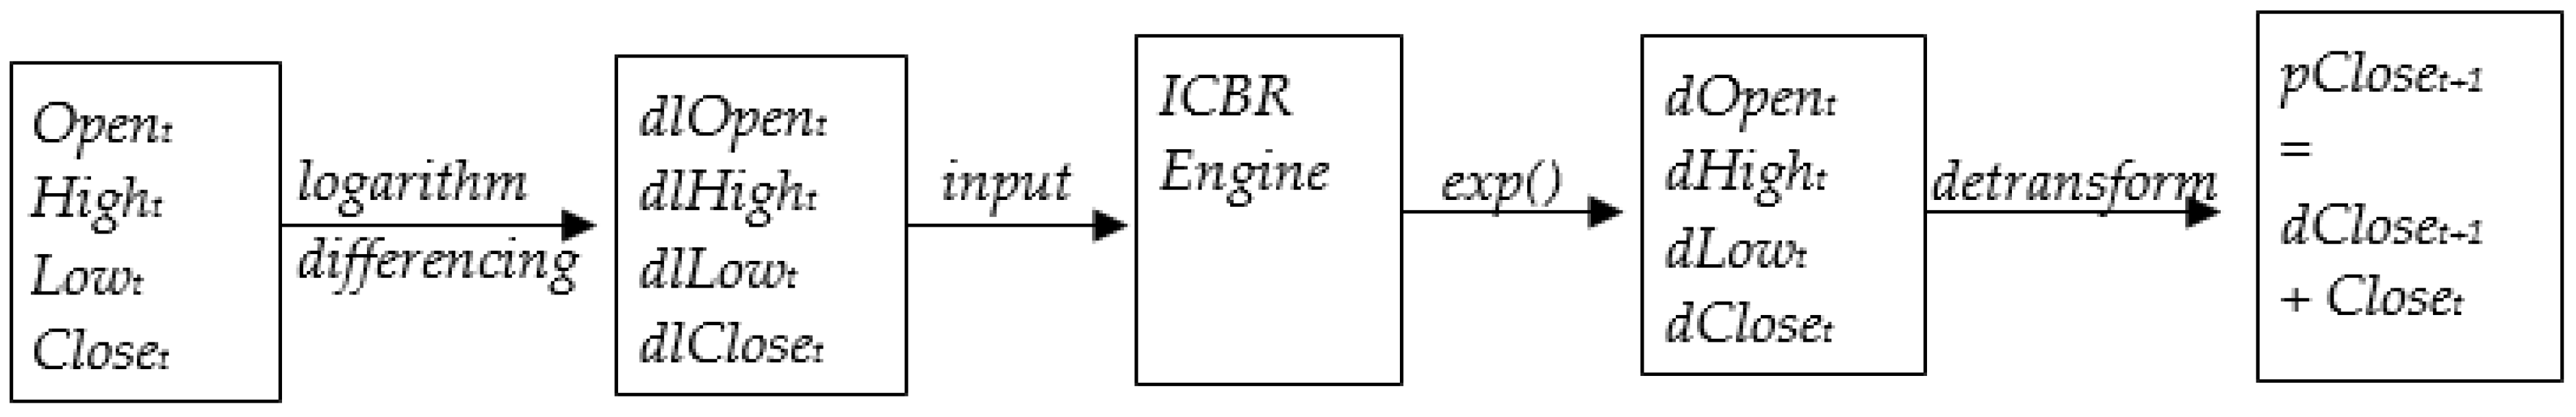
3.2. Model Construction

Exploratory plots for the raw data series of the three individual stock prices and the Dow Jones Industrial Average (DJIA) are shown in Figure 4, Figure 5, Figure 6 and Figure 7.
In constructing the predictive model for the three individual stock prices and the Dow Jones Industrial Average, the input variables were first transformed. For financial variables, stationarity can often be obtained through a logarithmic and differencing operation [10]. Thus, a differencing procedure was performed. For example, the Opening Value at t time (Opent) could be transformed to be dlOpent (lOpentlOpent−1) through a logarithmic and differencing procedure. Other input variables such as Hight, Lowt, and Closet were also transformed to be dlHight, dlLowt, and dlCloset, as shown in Figure 8. These variables could then be used for the prediction engine of interactive CBR to produce a predicted value of dlCloset. Finally, a predicted value of the closing price at t + 1 (pCloset+1) was obtained from a de-transforming procedure by adding the predicted value of dCloset to the previous actual closing price at t (Closet). Figure 8 presents an overview of preprocessing and postprocessing for producing a prediction value by interactive CBR.

4. Results of the Study and Discussion

The performance results among the predictive models (such as the random walk (RW) method (for much of this century, the random walk model of stock prices has served as a pillar of accepted wisdom in financial economics. One implication of the random walk model is that obvious patterns in the economy are already incorporated in the valuation of stock prices and financial markets. This is the rationale behind the technical analysis in forecasting stock prices based solely on variables pertaining to the market itself) and interactive CBR (ICBR)) using a selection method of neighbors are presented in Table 1, Table 2, Table 3 and Table 4. The CBR model performance was evaluated using the RMSE and HR (Hit ratio).
Table 1 summarizes the RMSE result when the data were not preprocessed; therefore, these raw data were used for the CBR prediction. It showed that CBR with raw data did not produce an improved performance compared with the RW in any combination of the models.
Table 2 summarizes the RMSE result after the data were preprocessed. It showed that CBR with preprocessed data had enhanced performance models compared with the RW and the model had the best performance when the number of neighbors was two and window size was sixty.
Figure 9 shows the results using a heat map graph. To compare the difference in predictive power between the preprocessed data and the non-preprocessed data, preprocessing was performed with a log and differencing. In the case of the CBR results of the data without preprocessing, none had a superior predictive power to the RW whereas the results of preprocessing showed enhanced predictive power compared with the RW in a specific section.
Table 3 summarizes the RMSE results for the stock price prediction of Airbnb with the preprocessed data. It showed that CBR with preprocessed data had enhanced performance models compared with the RW and the model had the best performance when the number of neighbors was two and window size was thirty. Figure 10 shows these results using a heat map graph.
Table 4 summarizes the RMSE results for the stock price prediction of Twitter with the preprocessed data. It showed that CBR with the preprocessed data had enhanced performance models compared with the RW, and the model had the best performance when the number of neighbors was twenty and window size was one hundred twenty. Figure 11 shows these results using a heat map graph.
Table 5 summarizes the RMSE results for the Dow Jones Industrial Average (DJIA) prediction with the preprocessed data. It showed that CBR with the preprocessed data had enhanced performance models compared with the RW and the model had the best performance when the number of neighbors was ten and window size was five. Figure 12 shows these results using a heat map graph.
Figure 9, Figure 10, Figure 11 and Figure 12 show several interesting results. In the case of Airbnb and Zoom, the predictive performances were superior to the RW in the small number of neighbors, whereas in the case of Twitter, the predictive power was notable when the number of neighbors was larger. In general, superior models with a low RMSE were seen when the window sizes were 5, 10, 30, 60, and 120. The window size also seemed to be a factor of greater importance than the number of neighbors in the Dow Jones Industrial Average prediction.
Table 6 presents the results of the RMSE and the t-test for the difference in performance of the RW and CBR methods. The CBR models seemed to surpass the RW model. However, the CBR models did not exhibit a statistically significant performance difference in terms of the RMSE.
Figure 13, Figure 14, Figure 15 and Figure 16 show heat maps for the Hit rates, the proportion of correct forecasts for the prediction of the three stock prices and the Dow Jones Industrial Average (DJIA) in the test data. The Hit rates showed how effectively CBR predicted the direction of the price changes for the closing prices of these three stocks and the Dow Jones Industrial Average Index. The areas colored in yellow indicate the models where CBR had a superior performance to the RW. For the Hit ratio prediction, many models showed superior results to the RW model regardless of the window size and number of neighbors. Figure 13, Figure 15 and Figure 16 (Zoom and Twitter stock prices as well as the Dow Jones Industrial Average prediction, respectively) show that the CBR models outperformed the RW but that the RW outperformed the CBR models when compared with the Airbnb model in Figure 15. Compared with the Airbnb models, the predictive performances of the models for Zoom, Twitter, and the Dow Jones Industrial Average prediction outperformed the RW model in many combinations of window size and number of neighbors. The predictive power of the Airbnb model seemed to be relatively low due to the lack of training data, which was due to it being only recently listed on the stock market exchange.
Table 7 summarizes the Hit rates and the proportion of correct forecasts for the best models shown in Table 6. The Hit rates showed how effectively CBR predicted the direction of the price changes for the closing prices. Figure 13, Figure 14, Figure 15 and Figure 16 show that several models had clearly highlighted results. For a consistent comparison, we tested the Hit ratio of the best models in Table 6 that showed the best RMSE performances. Table 7 indicates that CBR seemed to be more effective than the RW model in the Hit ratio. We tested the null hypothesis, Ho; however, the proposed CBR did not produce a statistically improved performance at a level of p < 0.1.
Generally speaking, the performance of CBR was superior to the RW but the difference was not statistically significant. The reason we did not obtain a statistically significant result seemed to be because the period of the training data and the period of the test data were not sufficient due to one company being only recently listed on the stock exchange. For the DJIA prediction, the period of the training data, which started from January 2015, was longer than the data of the other three stock prices but the test period was the same as the data of the other three stock prices. Although the predictive power was greater than that of the RW, the statistically verifiable data size was small and thus did not produce a significant result.

5. Concluding Remarks and Future Work

In this paper, we proposed interactive CBR for selecting similar patterns among neighbors that case-based reasoning recommended. Concepts were investigated against the backdrop of a practical application involving the prediction of the individual stock prices of Zoom, Airbnb, and Twitter as well as the Dow Jones Industrial Average. The results of the case study are summarized as follows:
  • The best model of the proposed technique was more effective than the random walk model.
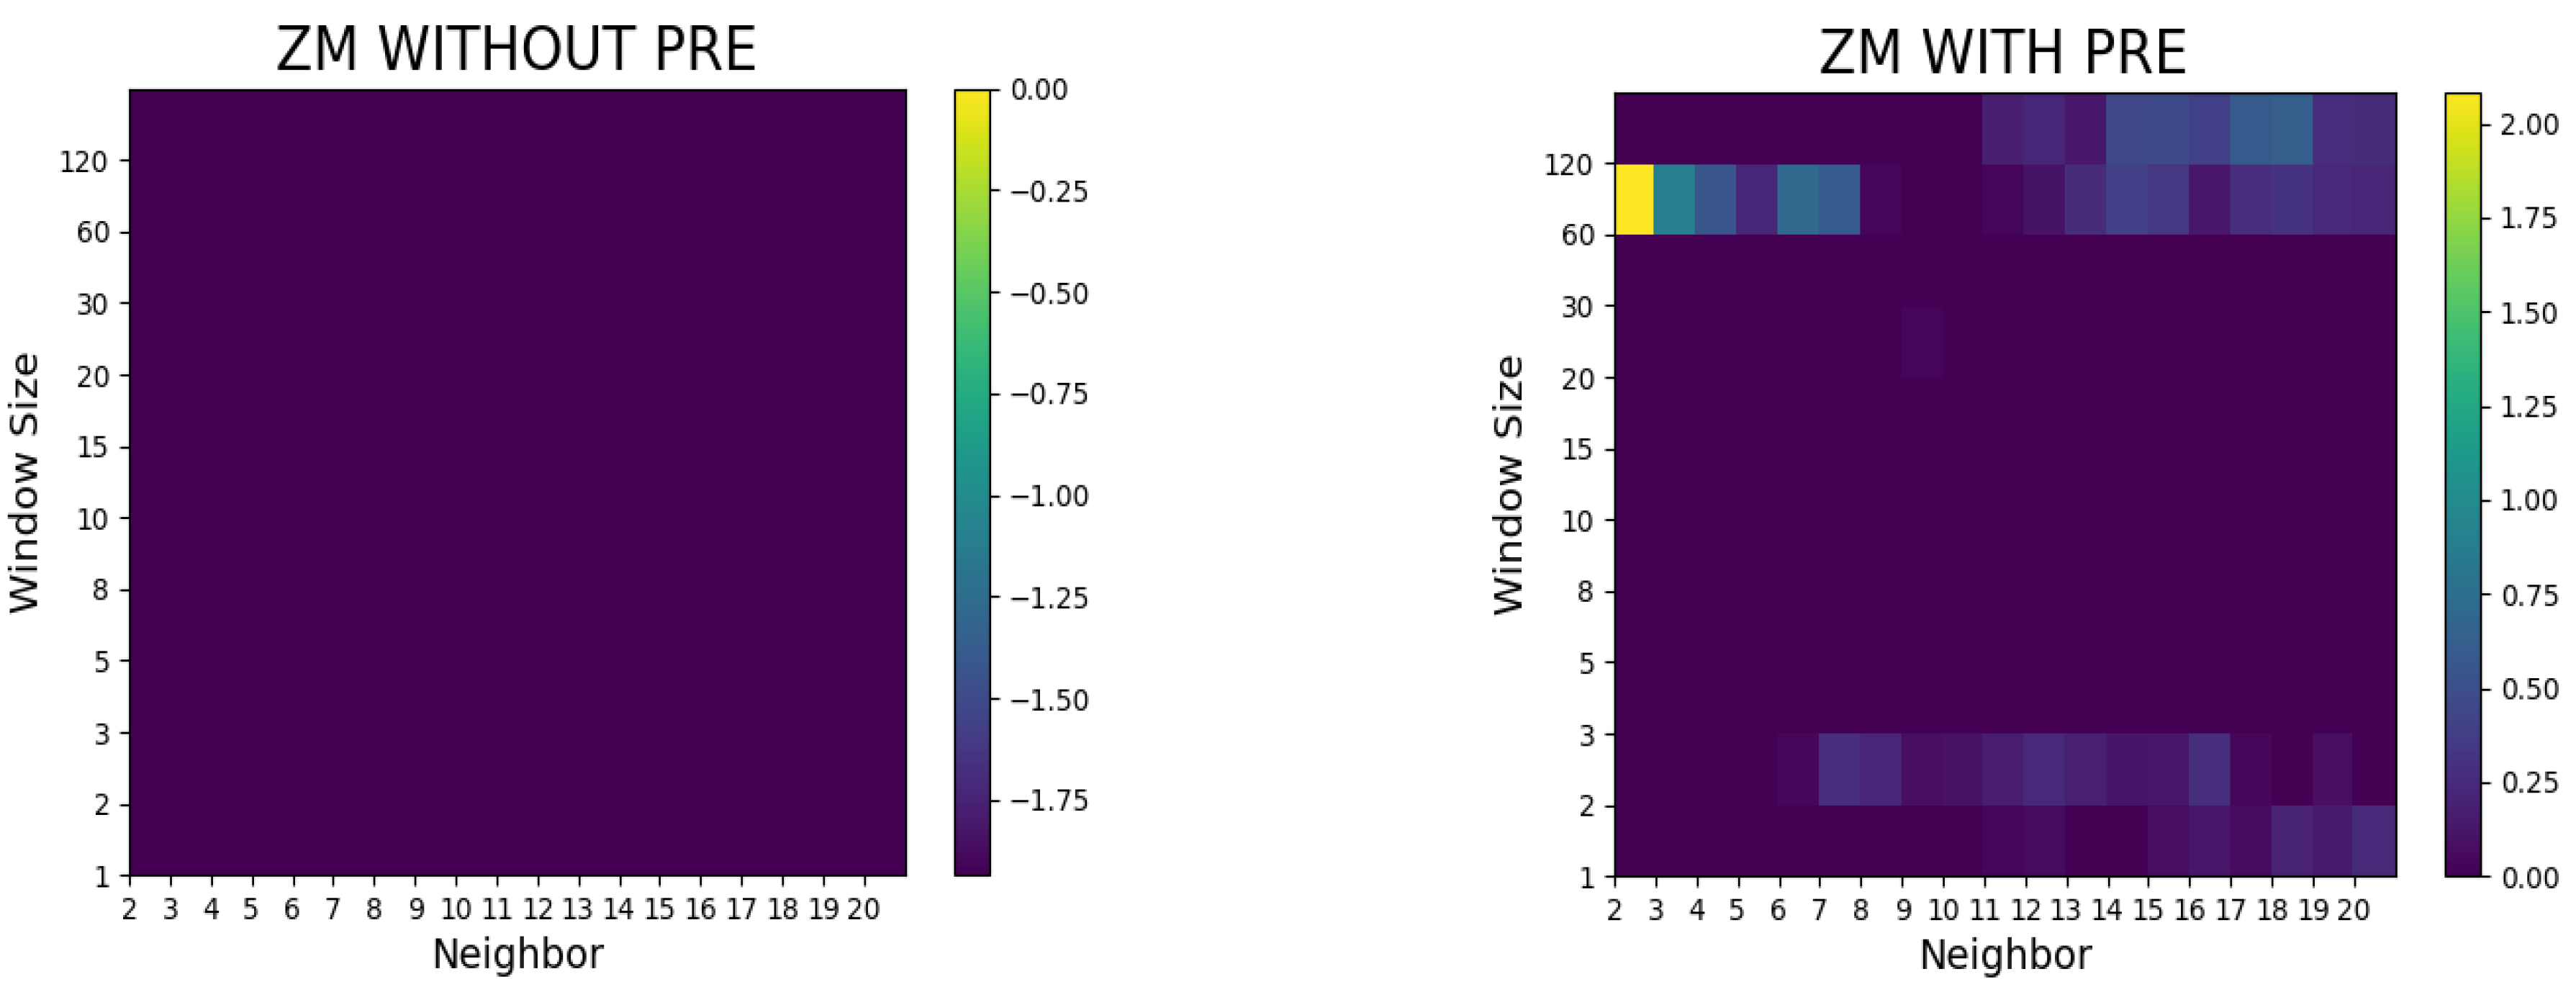
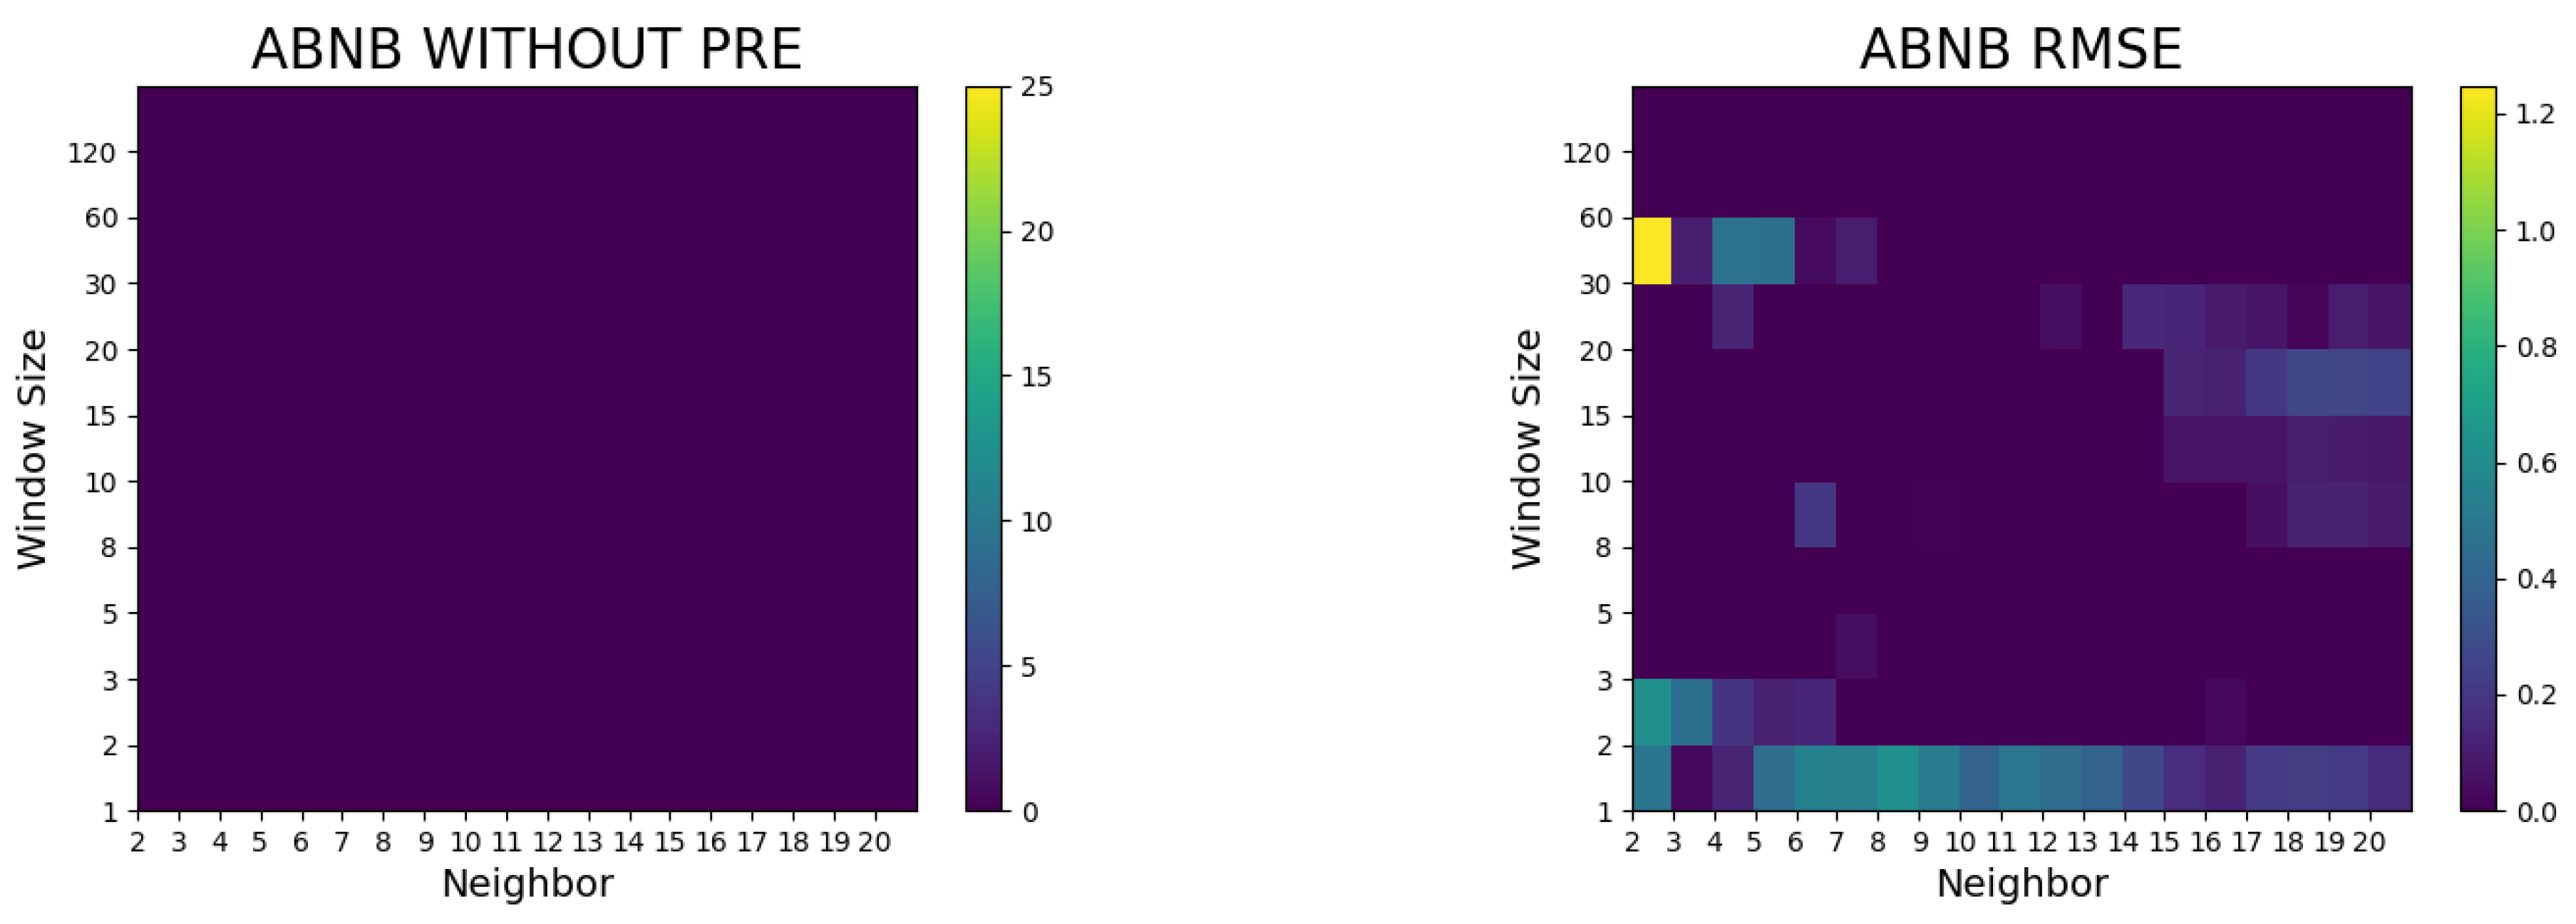
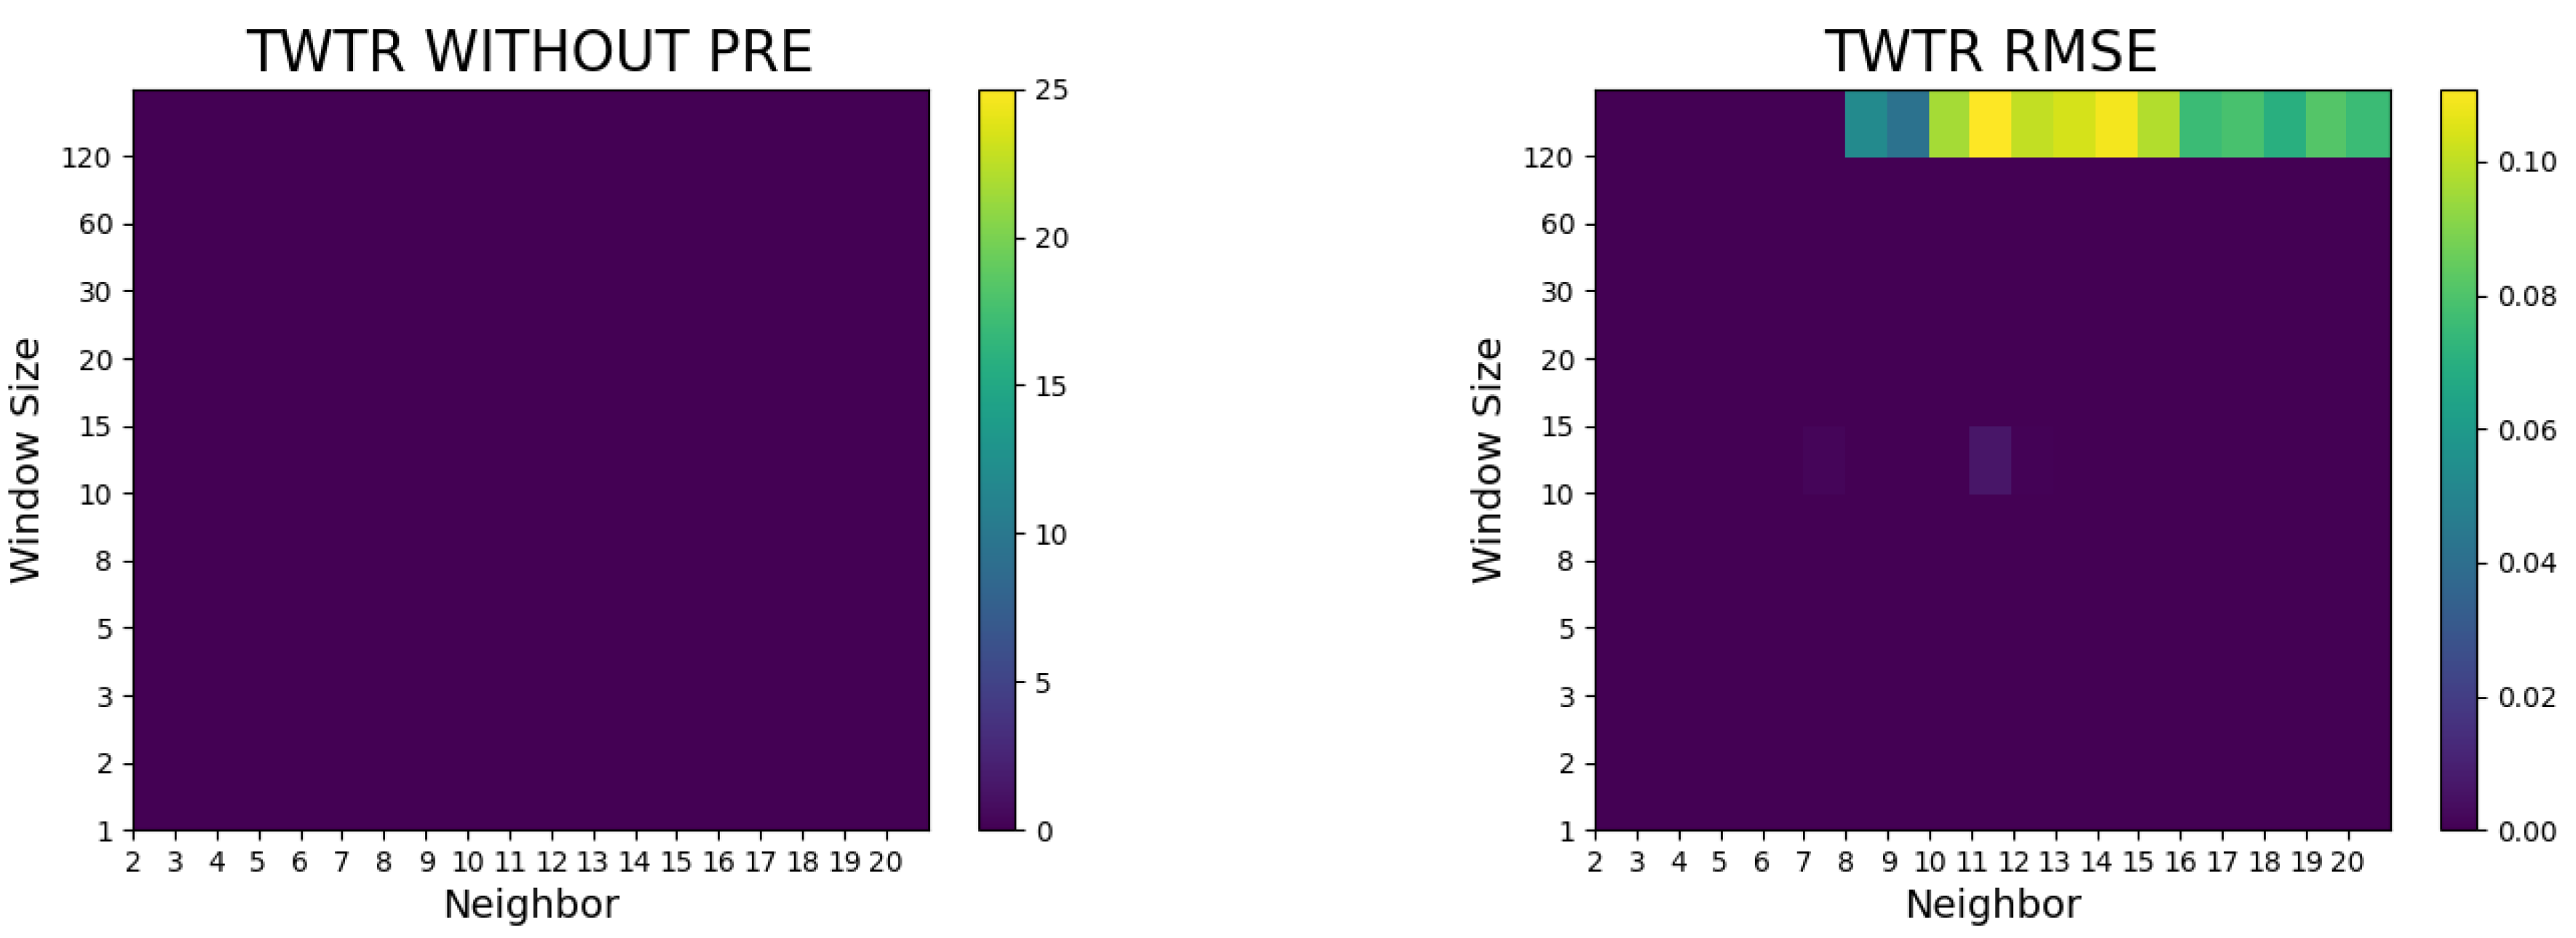
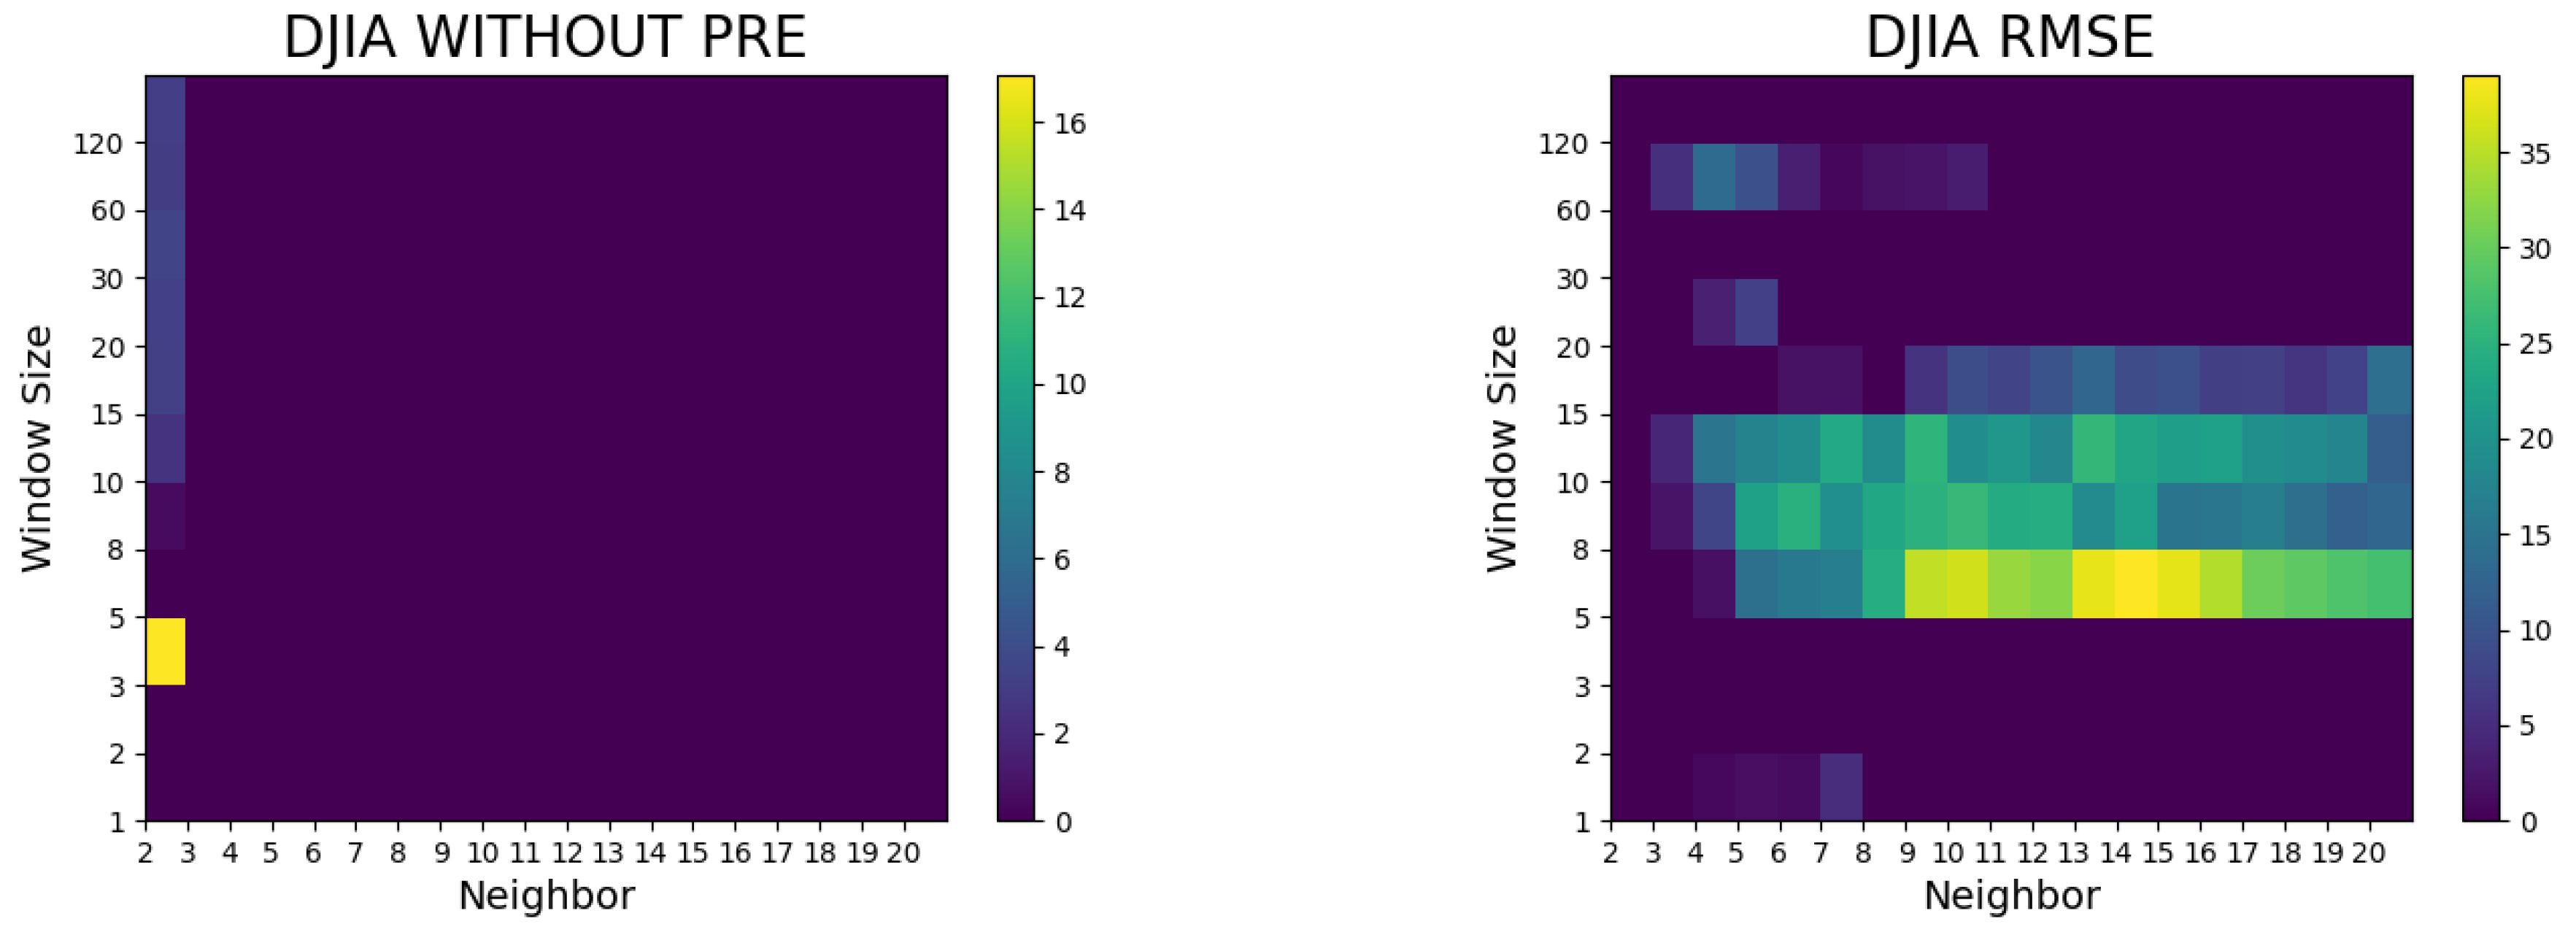
  • The proposed method did not surpass the random walk model without preprocessing, whereas it outperformed the random walk model in terms of the RMSE and Hit ratio after preprocessing (such as logarithms and differencing).
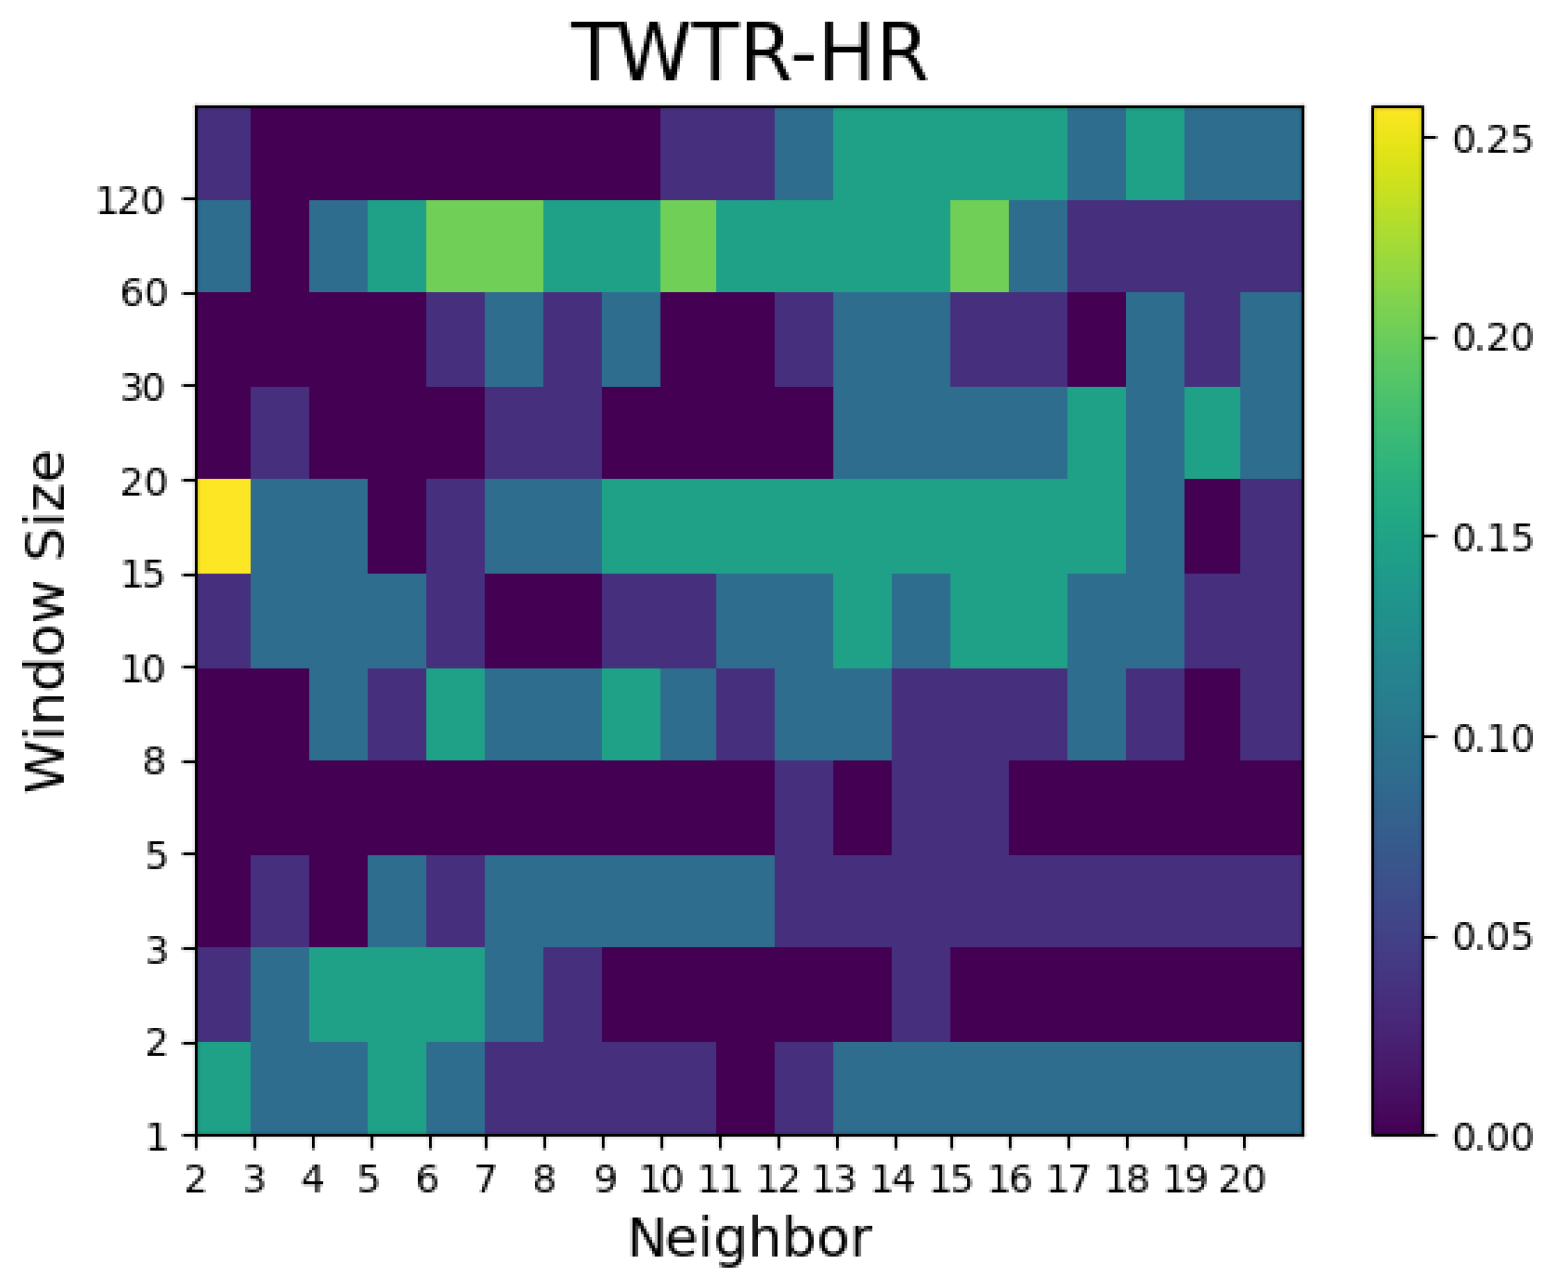
  • In the case of Airbnb and Zoom, the predictive performances were superior to the random walk model with a small number of neighbors, whereas in the case of Twitter, the predictive power was notable when the number of neighbors was large.
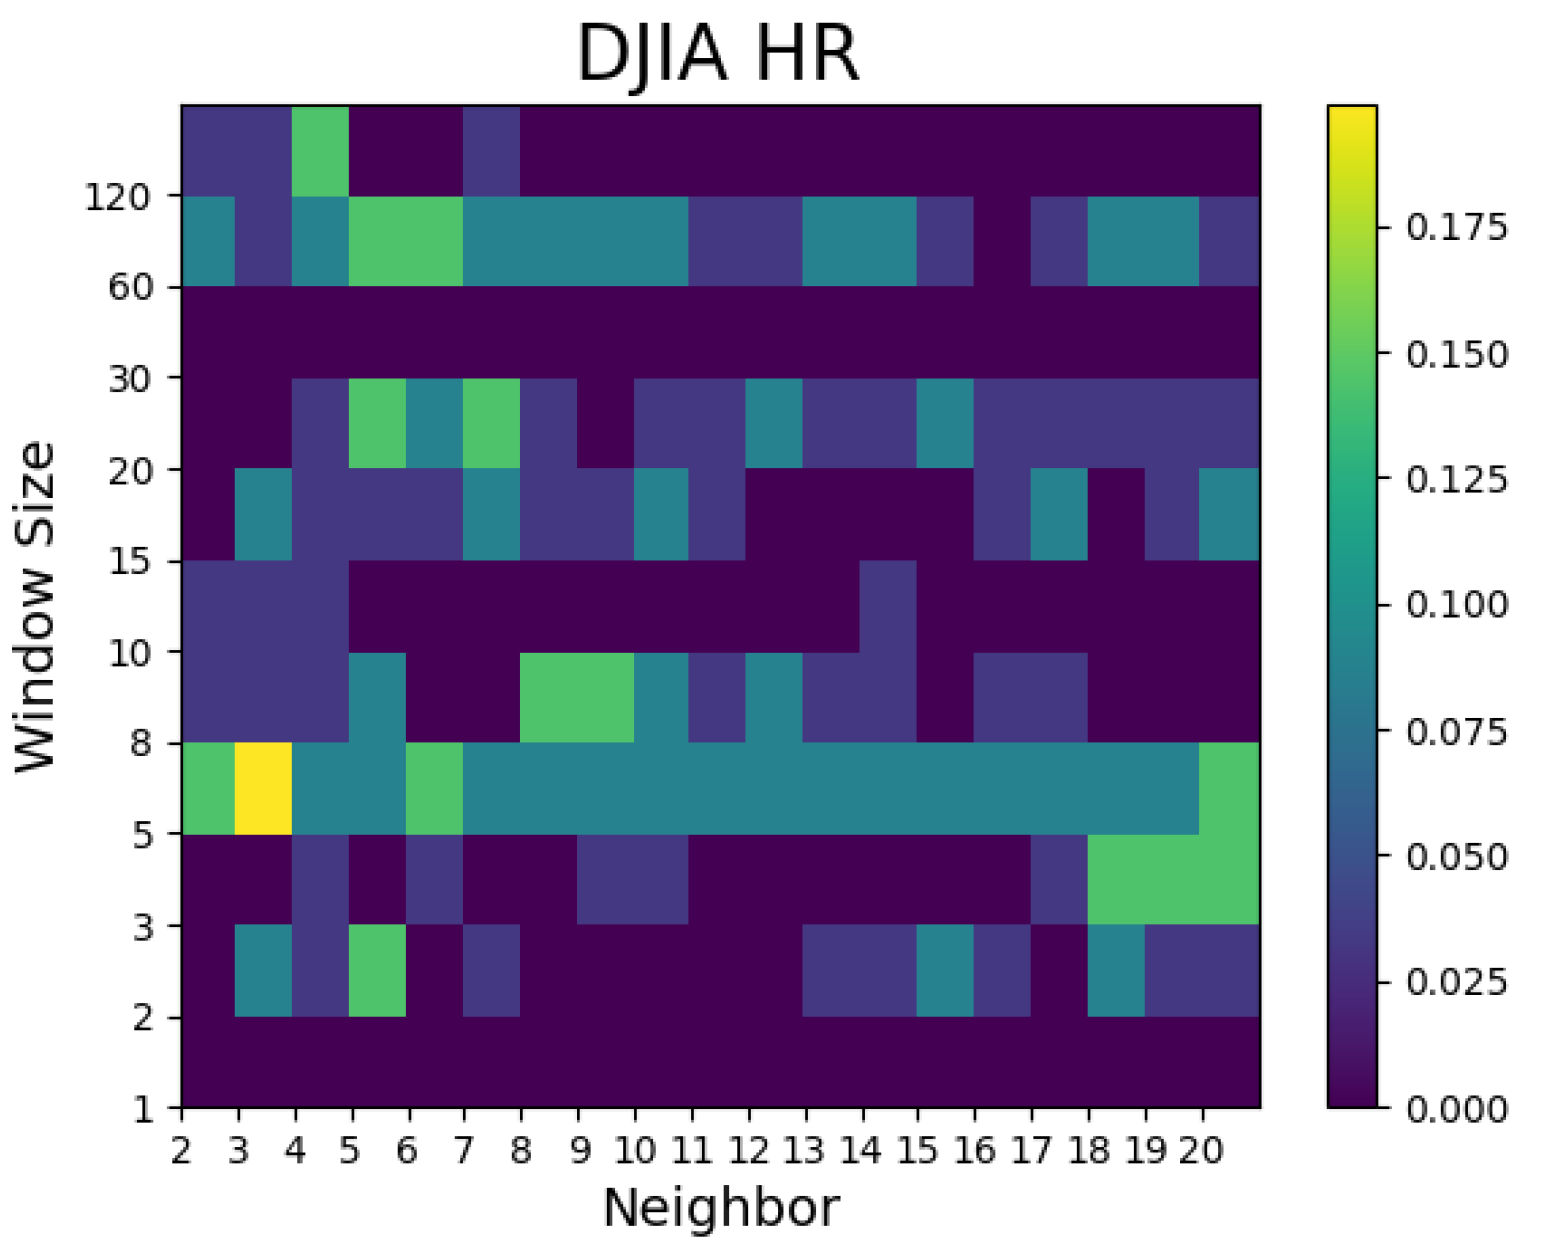
  • In general, superior models with lower RMSEs were seen when the window sizes were 5, 10, 30, 60, and 120. The window size was a factor with a greater importance than the number of neighbors in the Dow Jones Industrial Average prediction.
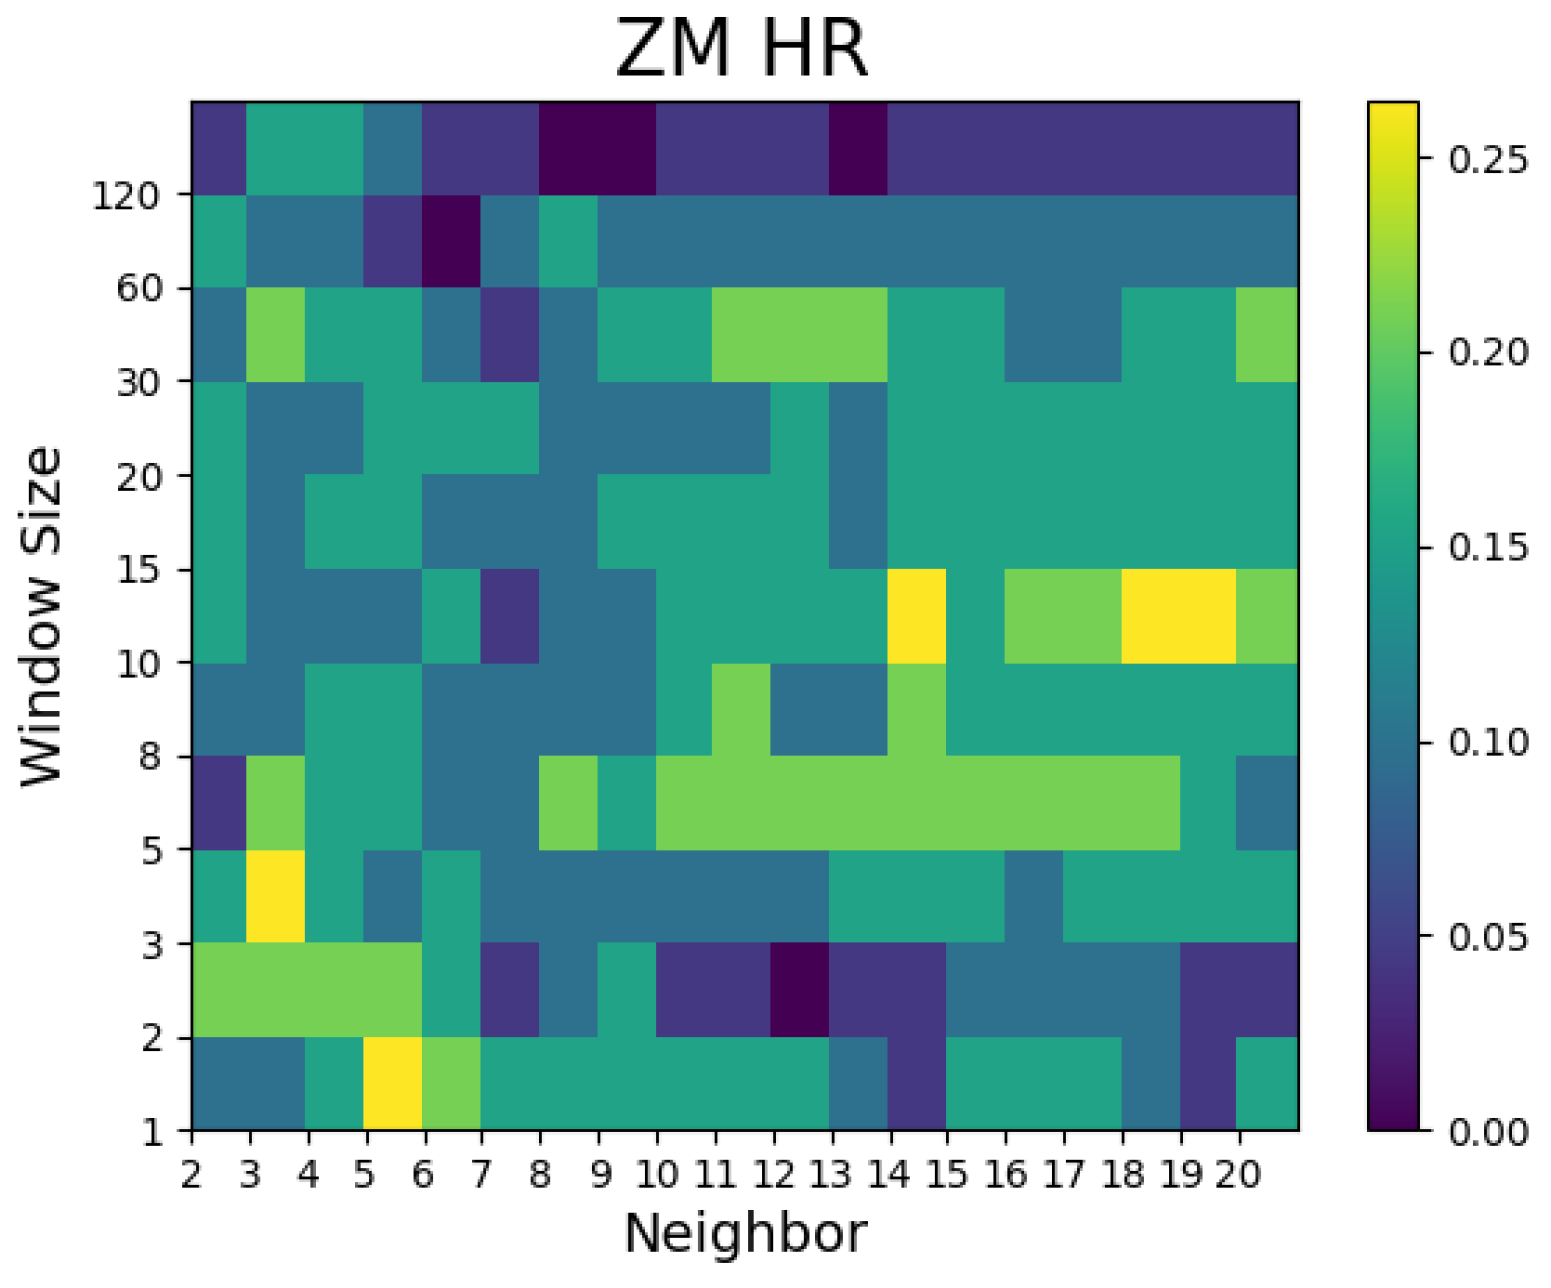
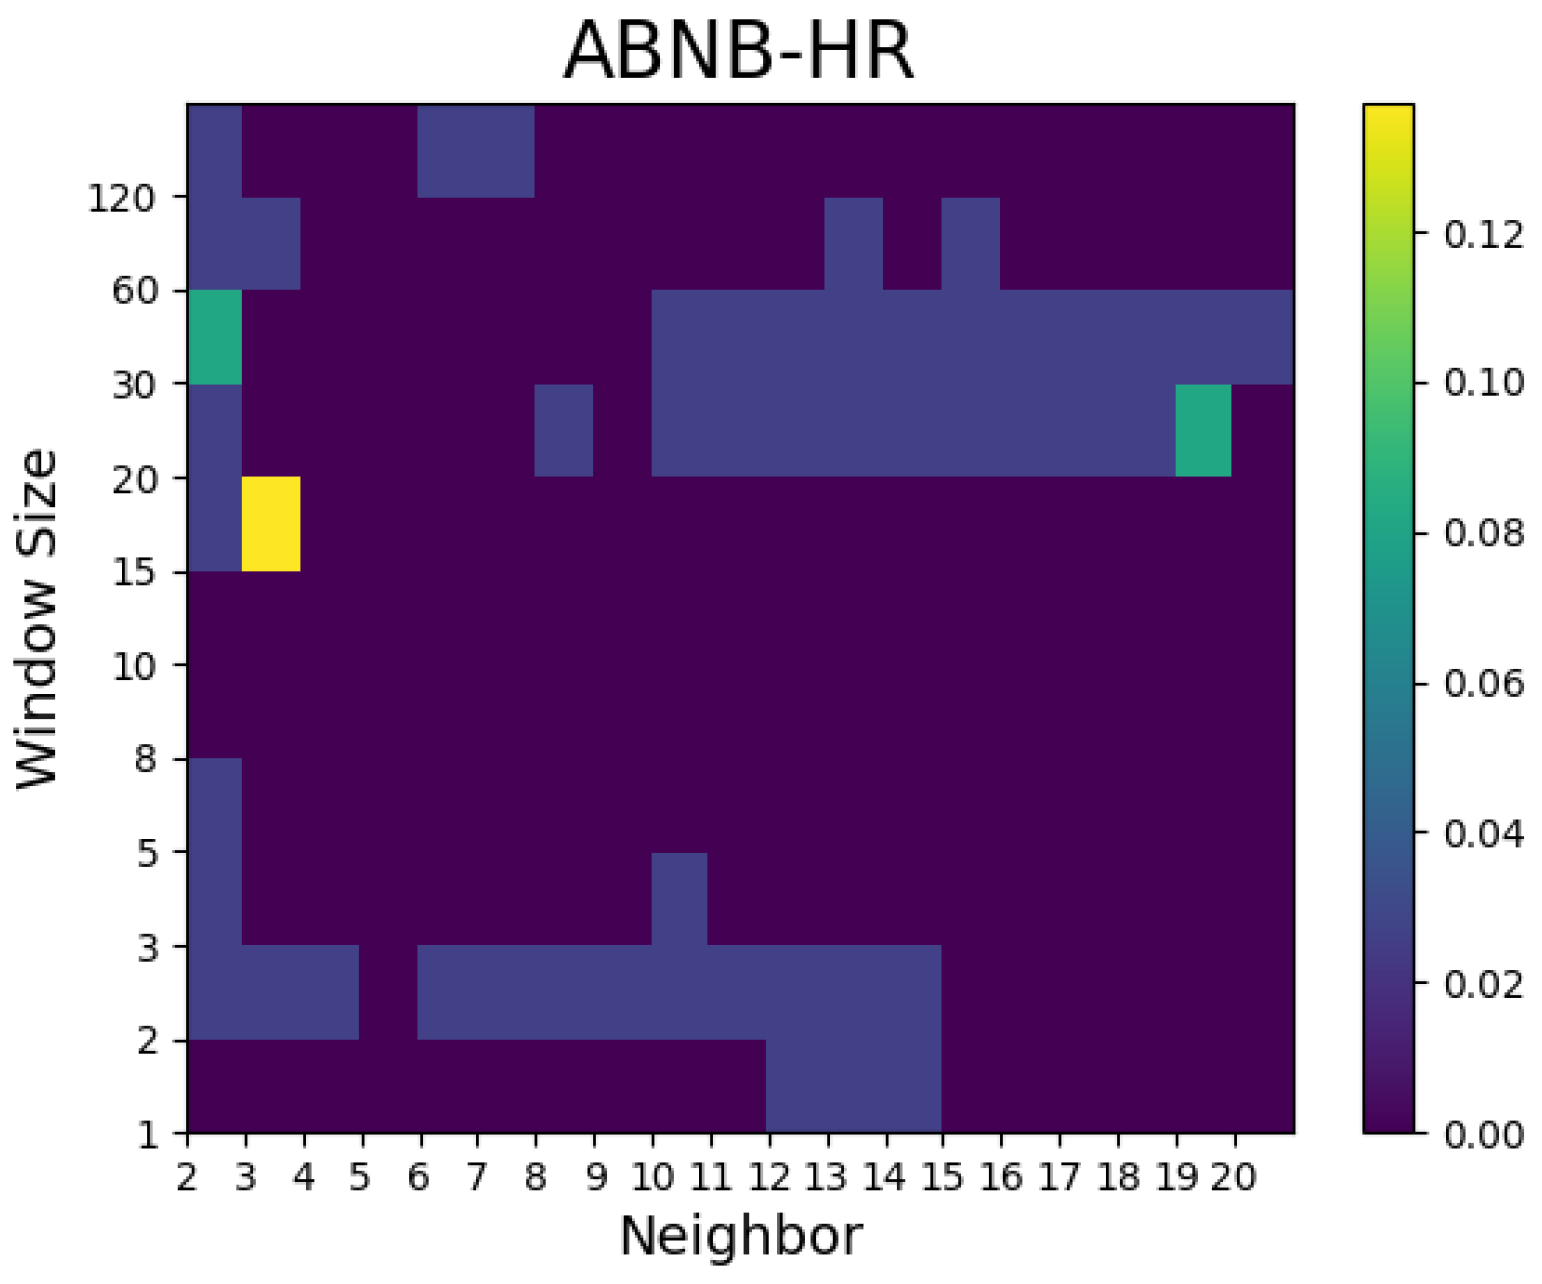
  • For the Hit ratio prediction, many models showed superior results to the random walk model regardless of the window size and number of neighbors. Compared with the Airbnb models, the predictive performances of the models for Zoom and Twitter as well as the Dow Jones Industrial Average prediction outperformed the random walk model in many combinations of window size and number of neighbors.
  • The proposed method was not seen to statistically surpass the random walk model in terms of the RMSE and Hit ratio. The reason seemed to be that the statistically verifiable data size was small due to one of the companies we tested only recently being listed on the stock market exchange.
The proposed method, therefore, had the possibility to enhance predictability. Thus, in future research, we propose the possibility of a two-step filtering method by selecting similar patterns among neighbors that a CBR machine recommends. Interactive CBR can also be implemented by the concept of an automatic filtering method without human expert knowledge using selected similar patterns that would improve the predictability of interactive CBR.

Author Contributions

Conceptualization: S.-H.C.; methodology: S.-H.C.; software: S.-H.C. and J.-W.J.; validation: S.-H.C. and J.-W.J.; formal analysis: S.-H.C. and J.-W.J.; investigation: S.-H.C. and J.-W.J.; data curation: J.-W.J.; visualization: J.-W.J.; funding acquisition: S.-H.C. All authors have read and agreed to the published version of the manuscript.

Funding

This work was supported by the Ministry of Education of the Republic of Korea and the National Research Foundation of Korea (2019S1A5A2A01046398).

Institutional Review Board Statement

Not applicable.

Informed Consent Statement

Not applicable.

Data Availability Statement

Not applicable.

Conflicts of Interest

The authors declare no conflict of interest.

References

  1. Ince, H. Short term stock selection with case-based reasoning technique. Appl. Soft Comput. 2014, 22, 205–212. [Google Scholar] [CrossRef]
  2. Chun, S.-H.; Ko, Y.-W. Geometric Case Based Reasoning for Stock Market Prediction. Sustainability 2020, 12, 7124. [Google Scholar] [CrossRef]
  3. Yoo, S.; Jeon, S.; Jeong, S.; Lee, H.; Ryou, H.; Park, T.; Choi, Y.; Oh, K. Prediction of the Change Points in Stock Markets Using DAE-LSTM. Sustainability 2021, 13, 11822. [Google Scholar] [CrossRef]
  4. Chung, H.; Shin, K.-S. Genetic Algorithm-Optimized Long Short-Term Memory Network for Stock Market Prediction. Sustainability 2018, 10, 3765. [Google Scholar] [CrossRef] [Green Version]
  5. Aamodt, A.; Plaza, E. Case-based reasoning: Foundational issues, methodological variations, and system approaches. AI Commun. Eur. J. Artif. Intell. 1994, 7, 39–59. [Google Scholar] [CrossRef]
  6. Kim, S.H.; Chun, S.H. Graded forecasting using an array of bipolar predictions: Application of probabilistic neural networks to a stock market index. Int. J. Forecast. 1998, 14, 323–337. [Google Scholar] [CrossRef]
  7. Chun, S.-H.; Kim, K.; Kim, S.H. Chaotic analysis of predictability versus knowledge discovery techniques: Case study of the Polish stock market. Expert Syst. 2002, 19, 264–272. [Google Scholar] [CrossRef]
  8. Chun, S.-H.; Kim, K.; Kim, S.H. Impact of momentum bias on forecasting through knowledge discovery techniques in the foreign exchange market. Expert Syst. Appl. 2003, 24, 115–122. [Google Scholar] [CrossRef]
  9. Chun, S.-H.; Kim, K.; Kim, S.H. Data mining for financial prediction and trading: Application to single and multiple markets. Expert Syst. Appl. 2004, 26, 131–139. [Google Scholar] [CrossRef]
  10. Chun, S.-H.; Kim, K.; Kim, S.H. Automated generation of new knowledge to support managerial decision making: Case study in forecasting a stock market. Expert Syst. 2004, 21, 192–207. [Google Scholar] [CrossRef]
  11. Chun, S.-H.; Park, Y.-J. Dynamic adaptive ensemble case-based reasoning: Application to stock market prediction. Expert Syst. Appl. 2005, 28, 435–443. [Google Scholar] [CrossRef]
  12. Chun, S.-H.; Park, Y.-J. A new hybrid data mining technique using a regression case based reasoning: Application to financial forecasting. Expert Syst. Appl. 2006, 31, 329–336. [Google Scholar] [CrossRef]
  13. Dutta, S.; Shekkar, S. Bond rating: A non-conservative application of neural networks. Int. Jt. Conf. Neural Netw. 1988, 2, 443–450. [Google Scholar]
  14. Shin, K.S.; Han, I. A case-based approach using inductive indexing for corporate bond rating. Decis. Support Syst. 2001, 32, 41–52. [Google Scholar] [CrossRef]
  15. Kim, K.-J.; Han, I. Maintaining case-based reasoning systems using a genetic algorithms approach. Expert Syst. Appl. 2001, 21, 139–145. [Google Scholar] [CrossRef]
  16. Li, H.; Sun, J. Gaussian case-based reasoning for business failure prediction with empirical data in China. Inf. Sci. 2009, 179, 89–108. [Google Scholar] [CrossRef]
  17. Li, H.; Huang, H.-B.; Sun, J.; Lin, C. On sensitivity of case-based reasoning to optimal feature subsets in business failure prediction. Expert Syst. Appl. 2010, 37, 4811–4821. [Google Scholar] [CrossRef]
  18. Li, H.; Sun, J. Predicting Business Failure Using an RSF-based Case-Based Reasoning Ensemble Forecasting Method. J. Forecast. 2013, 32, 180–192. [Google Scholar] [CrossRef]
  19. Yip, A.Y.N. Business Failure Prediction: A Case-Based Reasoning Approach. Rev. Pac. Basin Financ. Mark. Policies 2006, 9, 491–508. [Google Scholar] [CrossRef]
  20. Li, H.; Sun, J. On performance of case-based reasoning in Chinese business failure prediction from sensitivity, specificity, positive and negative values. Appl. Soft Comput. 2011, 11, 460–467. [Google Scholar] [CrossRef]
  21. Yip, A.Y.N. Predicting business failure with a case-based reasoning approach. In Proceedings of the Knowledge-Based Intelligent Information and Engineering Systems: 8th International Conference, KES 2004, Wellington, New Zealand, 20–25 September 2004; Proceedings Part III. pp. 20–25. [Google Scholar]
  22. Li, H.; Sun, J. Ranking-order case-based reasoning for financial distress prediction. Knowl.-Based Syst. 2008, 21, 868–878. [Google Scholar] [CrossRef]
  23. Li, H.; Sun, J.; Sun, B.-L. Financial distress prediction based on OR-CBR in the principle of k-nearest neighbors. Expert Syst. Appl. 2009, 36, 643–659. [Google Scholar] [CrossRef]
  24. Bryant, S.M. A case-based reasoning approach to bankruptcy prediction modeling. Intell. Syst. Account. Financ. Manag. 1997, 6, 195–214. [Google Scholar] [CrossRef]
  25. Elhadi, M.T. Bankruptcy support system: Taking advantage of information retrieval and case-based reasoning. Expert Syst. Appl. 2000, 18, 215–219. [Google Scholar] [CrossRef]
  26. Park, C.S.; Han, I. A case-based reasoning with the feature weights derived by analytic hierarchy process for bankruptcy prediction. Expert Syst. Appl. 2002, 23, 255–264. [Google Scholar] [CrossRef]
  27. Ahn, H.; Kim, K.J. Bankruptcy prediction modeling with hybrid case-based reasoning and genetic algorithms approach. Appl. Soft Comput. 2009, 9, 599–607. [Google Scholar] [CrossRef]
  28. Park, Y.-J.; Kim, B.-C.; Chun, S.-H. New knowledge extraction technique using probability for case-based reasoning: Application to medical diagnosis. Expert Syst. 2006, 23, 2–20. [Google Scholar] [CrossRef]
  29. Chun, S.-C.; Kim, J.; Hahm, K.-B.; Park, Y.-J. Data mining technique for medical informatics: Detecting gastric cancer using case-based reasoning and single nucleotide polymorphisms. Expert Syst. 2008, 25, 163–172. [Google Scholar] [CrossRef]
  30. Lei, Z.; Yin, D. Intelligent Generation Technology of Sub-health Diagnosis Case Based on Case Reasoning. In Proceedings of the 2019 IEEE 3rd Advanced Information Management, Communicates, Electronic and Automation Control Conference (IMCEC), Chongqing, China, 11–13 October 2019; pp. 1311–1318. [Google Scholar]
  31. Elisabet, D.; Sensuse, D.I.; Al Hakim, S. Implementation of Case-Method Cycle for Case-Based Reasoning in Human Medical Health: A Systematic Review. In Proceedings of the 2019 3rd International Conference on Informatics and Computational Sciences (ICICoS), Mathura, India, 21–22 November 2019. [Google Scholar]
  32. Chowdhury, A.R.; Banerjee, S. Case Based Reasoning in Retina Abnormalities Detection. In Proceedings of the 2019 4th International Conference on Information Systems and Computer Networks (ISCON), Mathura, India, 21–22 November 2019; pp. 273–278. [Google Scholar]
  33. Lamy, J.-B.; Sekar, B.; Guezennec, G.; Bouaud, J.; Seroussi, B. Hierarchical visual case-based reasoning for supporting breast cancer therapy. In Proceedings of the 2019 Fifth International Conference on Advances in Biomedical Engineering (ICABME), Tripoli, Lebanon, 7–19 October 2019. [Google Scholar]
  34. Bentaiba-Lagrid, M.B.; Bouzar-Benlabiod, L.; Rubin, S.H.; Bouabana-Tebibel, T.; Hanini, M.R. A Case-Based Reasoning System for Supervised Classification Problems in the Medical Field. Expert Syst. Appl. 2020, 150, 113335. [Google Scholar] [CrossRef]
  35. Lamy, J.-B.; Sekar, B.; Guezennec, G.; Bouaud, J.; Séroussi, B. Explainable artificial intelligence for breast cancer: A visual case-based reasoning approach. Artif. Intell. Med. 2019, 94, 42–53. [Google Scholar] [CrossRef]
  36. Silva, G.C.; Carvalho, E.E.; Caminhas, W.M. An artificial immune systems approach to Case-based Reasoning applied to fault detection and diagnosis. Expert Syst. Appl. 2020, 140, 112906. [Google Scholar] [CrossRef]
  37. Sun, J.; Zhai, Y.; Zhao, Y.; Li, J.; Yan, N. Information Acquisition and Analysis Technology of Personalized Recommendation System Based on Case-Based Reasoning for Internet of Things. In Proceedings of the 2018 International Conference on Cyber-Enabled Distributed Computing and Knowledge Discovery (CyberC), Zhengzhou, China, 18–20 October 2018; pp. 107–1073. [Google Scholar]
  38. Supic, H. Case-Based Reasoning Model for Personalized Learning Path Recommendation in Example-Based Learning Activities. In Proceedings of the 2018 IEEE 27th International Conference on Enabling Technologies: Infrastructure for Collaborative Enterprises (WETICE) WETICE Enabling Technologies: Infrastructure for Collaborative Enterprises (WETICE), Paris, France, 27–29 June 2018; pp. 175–178. [Google Scholar]
  39. CamiloCorralesab, D.; Ledezmaa, A.; Corrales, J.C. A case-based reasoning system for recommendation of data cleaning algorithms in classification and regression tasks. Appl. Soft Comput. 2020, 90, 106180. [Google Scholar]
  40. Nunes, R.C.; Colomé, M.; Barcelos, F.A.; Garbin, M.; Paulus, G.B.; Silva, L.A.D.L. A Case-Based Reasoning Approach for the Cybersecurity Incident Recording and Resolution. Int. J. Softw. Eng. Knowl. Eng. 2019, 29, 1607–1627. [Google Scholar] [CrossRef]
  41. Abutair, H.; Belghith, A.; Alahmadi, S. CBR-PDS: A case-based reasoning phishing detection system. J. Ambient. Intell. Humaniz. Comput. 2019, 10, 2593–2606. [Google Scholar] [CrossRef]
Figure 1. CBR process using Euclidean distance method.
Sustainability 14 01366 g001
Figure 2. Procedure of interactive CBR.
Sustainability 14 01366 g002
Figure 3. Interactive CBR: how to select two similar time series trends amongst four neighbors.
Sustainability 14 01366 g003
Figure 4. History of Zoom prices from 3 January 2020 to 30 November 2021.
Sustainability 14 01366 g004
Figure 5. History of Airbnb prices from 11 December 2020 to 30 November 2021.
Sustainability 14 01366 g005
Figure 6. History of Twitter prices from 3 January 2020 to 30 November 2021.
Sustainability 14 01366 g006
Figure 7. History of the weekly Dow Jones Industrial Average (DJIA) from 3 January 2015 to 30 November 2021 (sourced from finance.yahoo.com; accessed on 21 January 2022).
Sustainability 14 01366 g007
Figure 8. Overview of preprocessing and postprocessing for interactive CBR predictions.
Sustainability 14 01366 g008
Figure 9. Heat map comparison of the performances of the models between the raw data and the preprocessed data.
Sustainability 14 01366 g009
Figure 10. Heat map comparison of the performances of the models between the raw data and the preprocessed data for the stock price prediction of Airbnb.
Sustainability 14 01366 g010
Figure 11. Heat map comparison of the performances of the models between the raw data and the preprocessed data for the stock price prediction of Twitter.
Sustainability 14 01366 g011
Figure 12. Heat map comparison of the performances of the models between the raw data and the preprocessed data for the DJIA price prediction.
Sustainability 14 01366 g012
Figure 13. Heat map of the Hit rate among the forecasting models of Zoom technologies for the test phase.
Sustainability 14 01366 g013
Figure 14. Heat map of the Hit rate among the forecasting models of Airbnb for the test phase.
Sustainability 14 01366 g014
Figure 15. Heat map of the Hit rate among the forecasting models of Twitter for the test phase.
Sustainability 14 01366 g015
Figure 16. Heat map of the Hit rate among the forecasting models of the DJIA for the test phase.
Sustainability 14 01366 g016
Table 1. Root mean squared error (RMSE) * of the non-preprocessing data for Zoom (N denotes the number of neighbors and W denotes the time series size of the data). The RMSE of the RW model was 10.777.
N
W
23581020
113.96614.49313.91213.70513.01014.038
215.25614.84013.60313.40513.89215.214
516.67316.16417.02617.97518.43220.264
1016.68518.03318.13019.63420.62022.771
2015.62417.04720.20122.00823.15024.196
3012.73814.38617.51619.49820.86722.968
6012.65014.39517.50820.12121.05234.465
9012.73214.41317.53520.13721.06227.270
12012.71214.41117.53520.12720.05327.433
* The RMSE is a commonly used statistical measure of goodness of fit in quantitative forecasting methods because it produces a measure of relative overall fit. The root mean squared error (RMSE) is calculated by averaging the squared difference between the fitted (forecast) line and the original data. The RMSE is defined as ( y t f t ) 2 n where y represents the original series, f the forecast, and n the number of observations.
Table 2. Root mean squared error (RMSE) * of the models after data preprocessing for the stock price prediction of Zoom technologies. The RMSE of the RW model was 10.777.
N
W
23581020
113.12012.72512.07510.97910.94310.532
211.83112.06111.18210.55710.68410.817
511.83511.43111.85811.80011.94211.654
1011.58011.06010.77611.25411.27011.558
2011.92811.67811.38710.85010.97311.198
3015.87915.68213.18812.43712.28311.052
608.6939.88710.55410.74711.01410.563
9013.62713.53111.81911.30910.94610.281
12013.78612.60411.49611.17910.98910.522
* The RMSE is a commonly used statistical measure of goodness of fit in quantitative forecasting methods because it produces a measure of relative overall fit. The root mean squared error (RMSE) is calculated by averaging the squared difference between the fitted (forecast) line and the original data. The RMSE is defined as ( y t f t ) 2 n where y represents the original series, f the forecast, and n the number of observations.
Table 3. Root mean squared error (RMSE) of the models with preprocessed data for the stock price prediction of Airbnb. The RMSE of the RW model was 8.418.
N
W
23581020
17.9398.3937.9797.7978.0258.271
27.7957.9718.3038.7778.6068.624
58.4918.9898.4408.6738.8548.784
108.4198.7759.2258.6428.6868.336
209.9128.6888.4928.6378.4358.348
307.1698.3117.9628.5498.6438.741
609.1699.3448.4188.5278.7228.514
909.0389.1608.6188.6498.8428.915
1209.3799.46310.1419.2919.3588.782
Table 4. Root mean squared error (RMSE) of the models with the preprocessed data for the stock price prediction of Twitter. The RMSE of the RW model was 0.987.
N
W
23581020
11.3651.2831.3351.1511.2051.104
21.5531.3911.3181.2501.1751.031
51.2501.1891.0891.0421.0541.059
101.2471.1431.0011.0001.0110.994
201.3181.3341.2311.1241.0901.117
301.8081.6581.2001.0620.9981.072
601.3751.3271.0801.0931.0590.907
901.6311.3771.2711.0941.0570.977
1201.7241.2861.2540.9920.9490.878
Table 5. Root mean squared error (RMSE) of the models with the preprocessed data for the Dow Jones Industrial Average Index prediction. The RMSE of the RW model was 295.08.
N
W
23581020
1297.89301.82293.62299.39303.13314.98
2324.27324.40312.63299.96312.45304.34
5348.96309.02280.81270.93258.90267.69
10350.70290.81277.56276.16275.89283.55
20331.45320.51287.70320.23312.07301.83
30348.98344.01331.66316.19305.89295.60
60330.73339.59327.74313.10313.20312.10
120337.48324.87309.41326.41321.95325.69
Table 6. Root mean squared error (RMSE) and pairwise * t-tests for the best models.
Models
Cases
Best Models **RW vs. CBR t-Value * (p-Value)Decision
ZoomW (60) N (2) 10.777 vs. 8.6930.5867 (0.2806)Accept HO
AirbnbW (30) N (2) 8.418 vs. 7.1690.5801 (0.2828)Accept HO
TwitterW (120) N (20) 0.987 vs. 0.8760.7719 (0.2227)Accept HO
DJIW (5) N (10)295 vs. 256 0.3820 (0.3524)Accept HO
* Pairwise t-tests of the predictive models for the test phase. The comparison was based on the root mean squared error (RMSE) of the residuals. ** W denotes the size of the time series period for a neighbor and N denotes the number of neighbors.
Table 7. Hit rate among the best forecasting models for the test phase and pairwise z-tests* for the best model.
Models
Cases
CBR ModelRW vs. CBRz-Value *
(p-Value)
Decision
ZoomW (60) N (2)76.5 vs. 77.8%0.0888Accept HO
AirbnbW (30) N (2)47.1 vs. 61.1%0.8662Accept HO
TwitterW (120) N (20)64.7 vs. 83.3%1.2351Accept HO
DJIW (5) N (10)47.1 vs. 50.0%0.5508Accept HO
* A z-test for the differences in two proportions was used to determine whether there was a difference between two population proportions, which was defined as Z ( p 1 p 2 ) ( π 1 π 2 ) p ¯ ( 1 p ¯ ) ( 1 n 1 + 1 n 2 ) where   p i   are the sample proportions,   π i   are the population proportions, n i are the sample sizes for the groups, and p ¯ is a pooled estimate of the proportion of success in a sample of both groups, p ¯ = ( n 1 p 1 + n 2 p 2 ) / ( n 1 + n 2 ) .
Publisher’s Note: MDPI stays neutral with regard to jurisdictional claims in published maps and institutional affiliations.

