Article

COVID-19 Pandemic’s Impact on Return on Asset and Financing of Islamic Commercial Banks: Evidence from Indonesia

by
Gama Putra Danu Sohibien
1,2,
Lilis Laome
1,3,
Achmad Choiruddin
1,* and
Heri Kuswanto
1
1
Department of Statistics, Institut Teknologi Sepuluh Nopember, Surabaya 60111, Indonesia
2
Department of Applied Statistics, Politeknik Statistika STIS, Jakarta 13330, Indonesia
3
Department of Statistics, Universitas Halu Oleo, Kendari 93132, Indonesia
*
Author to whom correspondence should be addressed.
Sustainability 2022, 14(3), 1128; https://doi.org/10.3390/su14031128
Submission received: 15 December 2021 / Revised: 9 January 2022 / Accepted: 10 January 2022 / Published: 19 January 2022

Abstract

:
The aim of this study is to propose appropriate models to forecast Return on Asset (ROA) and financing of Indonesia Islamic Commercial Banks during COVID-19 pandemic. In particular, we study the models which involve reciprocal relation between ROA and financing and incorporate COVID-19 pandemic’s impact. It is crucial because the government would benefit from forecasting results to formulate the policy for the banks related to ROA and financing. We consider two models: Vector Autoregressive with exogenous variable (VARX) and spline regression, since both models are able to exploit the multivariate structure of ROA and financing and to include COVID-19 impact as predictor. The results show that the VARX outperforms spline regression in terms of RMSE. Using VARX, we deduce that ROA and financing have a positive reciprocal relationship, meaning that when ROA increases, financing would increase, and vice versa. In addition, the pandemic has significant impact on the decline of the ROA. We recommend that banks conduct an in-depth analysis to determine the appropriate form of restructuring for debtors so that it does not have a significant impact on the decrease in ROA.

1. Introduction

Bank as an intermediation institution has a role to provide credit, i.e., collect funds and allocate them as a loan to community or business people to develop their business. Timsina [1], Majeed and Iftikhar [2], and Altar et al. [3] find that bank credit can have a positive impact on the country’s economic growth. However, Indonesia, with a Muslim majority population, tends to avoid credit loans, for the reason that practicing a credit loan with an interest system is an act of usury that is not in accordance with Islamic sharia [4,5]. As an alternative, capital loan can be obtained according to Islamic sharia by financing from Islamic Commercial Bank. Islamic Commercial Bank differs from conventional banks since Islamic Commercial Bank runs their business activities based on Islamic sharia principles using profit-sharing system [2]. This alternative has become a popular option and makes Indonesia a potential market in the development of Islamic finance [6,7], shown by the increasing number of Islamic Commercial Banks (from two units in December 2000 to fifteen units in June 2021) and the increasing amount of finances (60.87 times in June 2021 compared to June 2003), see [8,9].
Since Indonesia Islamic Commercial Bank has strategic roles, the government needs to maintain and predict their condition to adjust the right policy. The tasks become crucial, especially during the COVID-19 pandemic when almost all sectors are impacted, including banking. To quantify the condition of Indonesia Islamic Commercial Bank, we consider Return on Asset (ROA) and financing as both indicators are essential to describe the stability and performance of the banks [10,11,12,13,14].
ROA and financing of Indonesia Islamic Commercial Bank have been studied, e.g., by Widarjono [15], Fathurrahman and Devi [16], and Ichsan et al. [17]. Most of the previous studies consider both indicators as the dependent variable and predict the outcome based on certain predictors such as exchange rate, inflation rate, and assets. Some studies also treat ROA as the dependent variable and financing as the independent variable (or vice versa), see e.g., Afkar [18], Afiyanti et al. [19], and Ichsan et al. [17]. Our study is different as we view both ROA and financing as important indicators to forecast, not as dependent-independent variables. We term this relation as reciprocal influence, where the ROA and financing can both affect each other. In addition, we also accommodate the influence of the COVID-19 pandemic on ROA and financing.
In this study, we aim to predict Indonesia Commercial Bank’s condition by providing appropriate models to forecast their ROA and financing. To propose decent models, we need to incorporate two important aspects: (1) reciprocal relation between ROA and financing and (2) COVID-19 pandemic impact on both ROA and financing. To do so, we propose Vector Autoregressive with exogenous variables (VARX) [20,21,22,23] and spline regression [24,25,26,27]. Both models are popular in time series forecasting, especially when the multivariate structure is dominant such as reciprocal influence, and external factors are included in the model [28]. In particular, the ROA and financing are treated as the endogenous variables to capture reciprocal influence, while the COVID-19 pandemic is employed as the exogenous variable by creating a dummy variable to distinguish whether the ROA and financing occur during the pandemic. We compare the performance of VARX and spline regression in terms of root mean squared error (RMSE) to find a better model to forecast both ROA and financing. This study does not consider Time Series Regression (TSR) or Autoregressive Integrated Moving Average (ARIMA) [28,29] since both models are univariate model which cannot exploit multivariate structure of the variables. The resulting information is expected to help the government to detect the fluctuation of ROA and financing of Indonesia Islamic Commercial Bank early in order to prevent the collapse of the bank, as well as to provide a brief evaluation of current strategy such as the proper determination of Bank Indonesia’s interest rate as the benchmark interest rate and the determination of the percentage of revenue share paid by the debtors to the banks and paid by the banks to the customers.

2. Material and Methods

2.1. Dataset

The data include financing and ROA of Islamic Commercial Banks in Indonesia, recorded monthly from November 2014 to June 2021, and collected from the website of the Financial Services Authority of Indonesia (www.ojk.go.id, accessed on 26 September 2021). We divide the financing and ROA data into two parts: (1) training data which are for model development and (2) testing data for model evaluation. The training data consist of ROA and financing from November 2014 to February 2021 (95 percent), while we employ the rest as the testing data (March 2021–June 2021). The natural logarithms transformation is conducted for both financing and ROA since both indicators have huge different unit and magnitude, called LFIN for log of financing and LROA for log of ROA. To take the COVID-19 impact into account, we create a dummy variable called COV19 consisting of 1 if ROA or financing occurs during the pandemic and 0 if they occur before the pandemic.

2.2. Methodology

2.2.1. VARX

VAR model is a multivariate time series model. In this model, all variables are considered as endogenous variables [30]. VAR model can accommodate the existence of reciprocal relationships between variables. In addition, this model often produces good performance in forecasting [31]. A disadvantage of the VAR model is that it has not been able to accommodate the influence of exogenous variables. Thus, VAR develops into VARX. In this study, VARX model aims to include variables that can distinguish conditions between before and during COVID-19 pandemic.
The general form of VARX model of this study with maximum length of p lag is as follows:
L R O A t = β ^ 10 + β ^ 11 , 1 L R O A t 1 + + β ^ 11 , p L R O A t p + β ^ 12 , 1 L F I N t 1 + + + β ^ 12 , p L F I N t p + γ ^ 1 C O V 19 t + e 1 t
L F I N t = β ^ 20 + β ^ 21 , 1 L R O A t 1 + + β ^ 21 , p L R O A t p + β ^ 22 , 1 L F I N t 1 + + + β ^ 22 , p L F I N t p + γ ^ 2 C O V 19 t + e 2 t
where:
L F I N t k = exogenous variable LFIN in lag k (k = 1, 2, …p)
L R O A t k = exogenous variable LROA in lag k (k = 1, 2, …p)
β ^ i 0 = estimation of intercept parameter in the i equation (i = 1 for L R O A t and i = 2 for L F I N t )
β ^ i 1 , k = parameter estimation of L F I N t k in the i equation (i = 1 for L R O A t and i = 2 for L F I N t )
β ^ i 2 , k = parameter estimation of L R O A t k in the i equation (i = 1 for L R O A t and i = 2 for L F I N t )
γ ^ i = parameter estimation of C O V 19 t in the i equation (i = 1 for L R O A t and i = 2 for L F I N t )
e i t = residual in the in the i equation (i = 1 for L R O A t and i = 2 for L F I N t )
Some VARX modeling steps of this study that are adapted from Tsay [23] are as follows:
1.
To learn pattern characteristic of each variable and relationship between variables by using time series plot and scatter diagram.
2.
To perform data stationary test.
This test is important because endogenous variables used in VAR model must be in stationary conditions [23]. If stationary condition of data cannot be met, the data need to be changed to difference form so that the data becomes stationary [31]. A method that is used for stationary tests is selected based on the structure of the data. If the data pattern contains structural changes then the method used is Philips Perron [32,33,34]. If the data pattern does not contain structural changes, then the method used is used is ADF.
3.
To determine maximum length of lag to be used on VARX model, the methods used are Likelihood Ratio (LR), Final Prediction Error (FPE), Akaike Information Criterion (AIC), Schwarz Criterion (SC)), and Hannan Quinn (HQ) [35].
4.
To estimate parameters of VARX models. Parameter’s estimation is done by Ordinary Least Square (OLS) method [23]. After we estimate the model parameters, we will obtain VARX model with a general form as in Equations (1) and (2).
5.
To measure forecasting performance of VARX models by applying VARX models to testing data and calculating RMSE.
6.
To Choose VARX models that have the best performance to use in forecasting.

2.2.2. Spline Regression

Spline is one of the nonparametric regression models that is a form of polynomial pieces that have continuous segmented properties that effectively explain the local characteristics of data functions [24]. The spline model has high flexibility and has an excellent ability to handle data with changing behaviour at certain sub intervals. One of the advantages of the spline approach is that this model looks for its own estimation by following the movement of the data pattern. This advantage occurs because in the spline there are knot points. The knot point is a joint fusion point where the function changes its pattern on different sub-interval.
Spline regression models can generally be presented as follows:
L R O A t = α ^ 10 + α ^ 11 , 1 L R O A t 1 + + α ^ 11 , p L R O A t p + α ^ 12 , 1 L F I N t 1 + + α ^ 12 , p L F I N t p + + α ^ 13 ( L F I N t 1 K l ) + + γ ^ 1 C O V 19 t + e 1 t
L F I N t = α ^ 20 + α ^ 21 , 1 L R O A t 1 + + α ^ 21 , p L R O A t p + α ^ 22 , 1 L F I N t 1 + + α ^ 22 , p L F I N t p + + α ^ 23 ( L R O A t 1 K l ) + + γ ^ 2 C O V 19 t + e 2 t
where:
α ^ i 0 = estimation of intercept parameter in the i equation (i = 1 for L R O A t and i = 2 for L F I N t )
α ^ i 1 , k = parameter estimation of L R O A t k in the i equation (i = 1 for L R O A t and i = 2 for L F I N t )
α ^ i 2 , k = parameter estimation of L F I N t k in the i equation (i = 1 for L R O A t and i = 2 for L F I N t )
K i = knot points in the i equation (i = 1 for L R O A t and i = 2 for L F I N t )
ε i t = residual in the in the i equation (i = 1 for L R O A t and i = 2 for L F I N t )
γ ^ i = parameter estimation of COVID-19 in the i equation (i = 1 for L R O A t and i = 2 for L F I N t )
Based on spline regression Equations (3) and (4) consist of polynomial function is VAR(p) and truncated function is one knot point using the following equation [24]:
( L F I N t 1 K i ) + m = { ( L F I N t 1 K i ) m , L F I N t 1 K i 0 , L F I N t 1 < K i
To select the optimum knot point in Equations (3) and (4), the GCV method [36] can be used with the formula as:
G C V ( K 1 , K 2 , , K r ) = min K 1 , K 2 , , K r { M S E ( K 1 , K 2 , , K r ) [ n 1 t r a c e ( I A ( K 1 , K 2 , , K r ) ) ] }
where I is identity matrix, matrix A ( K 1 , K 2 , , K r ) is obtained from L F I N t = A ( K 1 , K 2 , , K r ) L F I N , L R O A t = A ( K 1 , K 2 , , K r ) L R O A t , and M S E ( K 1 , K 2 , , K r ) is mean square error for the model with knot point.
If we compare spline regression models (Equations (3) and (4)) with VARX model (Equations (1) and (2)), we can distinguish the spline and VARX regression models used in this study. The difference is that in the spline regression model there is a truncated function that can capture nonlinearity relationship between ROA and financing.
Spline regression modeling steps adapted from Eubank [24] are
1.
Define initial models.
2.
Selecting the optimum knot point for each model is based on the smallest Generalized Cross Validation (GCV) value.
3.
Estimating model parameter with OLS method.
4.
Perform simultaneous and partial tests for each parameter estimate in spline regression,
5.
Choose the best model based on the smallest RMSE value.

2.3. Model Comparison and Forecasting of ROA and Financing

After we form the best VARX model and spline regression for ROA and financing, the next step is to choose the best model between the VARX model and spline regression for use in forecasting. Model selection is done by looking at the resulting RMSE value on VARX and spline regression. We do the forecast using models formed from all training and testing data. We forecast data for July 2021–July 2022. In general, the research steps can be written as shown in Figure 1.

3. Results and Discussion

3.1. Trend and Structural Change of ROA and Financing

To understand the behavior of both financing and ROA, we first studied their trend and possible structural change especially due to the COVID-19 pandemic. Note that we worked on the log-scale of financing and ROA, respectively named LFIN and LROA (See also Section 2.1). Figure 2 shows that LROA and LFIN have a clear increasing trend, which indicates that Indonesia Islamic Commercial Bank would handle their role as an intermediation institution properly over a long-term period. However, according to the fluctuations, both variables have a pattern that undergoes structural changes. Structural change of LFIN seems to only occur in September 2016 mainly due to the increasing of community savings and deposits which triggers the banks to improve the distribution of financing to the community [37]. We observe that the pattern of LFIN does not show an obvious change during the pandemic, which might indicate that the amount of financing is still under control during the pandemic. At least two reasons could explain this finding: (1) Some debtors received financing during the pandemic but were approved before the pandemic, and (2) Islamic Commercial Banks continue distributing financing during the pandemic, but consider applying stricter rules and are more selective in terms of grant debtors and sectors [37]. Meanwhile, structural changes of LROA have occurred in many periods, especially during the pandemic when LROA dropped from March 2020 to November 2020 (Figure 2b). This could be due to the financing restructuring policies during the pandemic such as delays in payment installments and margin payment waivers for debtors or companies that are affected by the pandemic [37]. Thus, the profit of Islamic Commercial Banks reduces, leading to the decreasing of ROA.

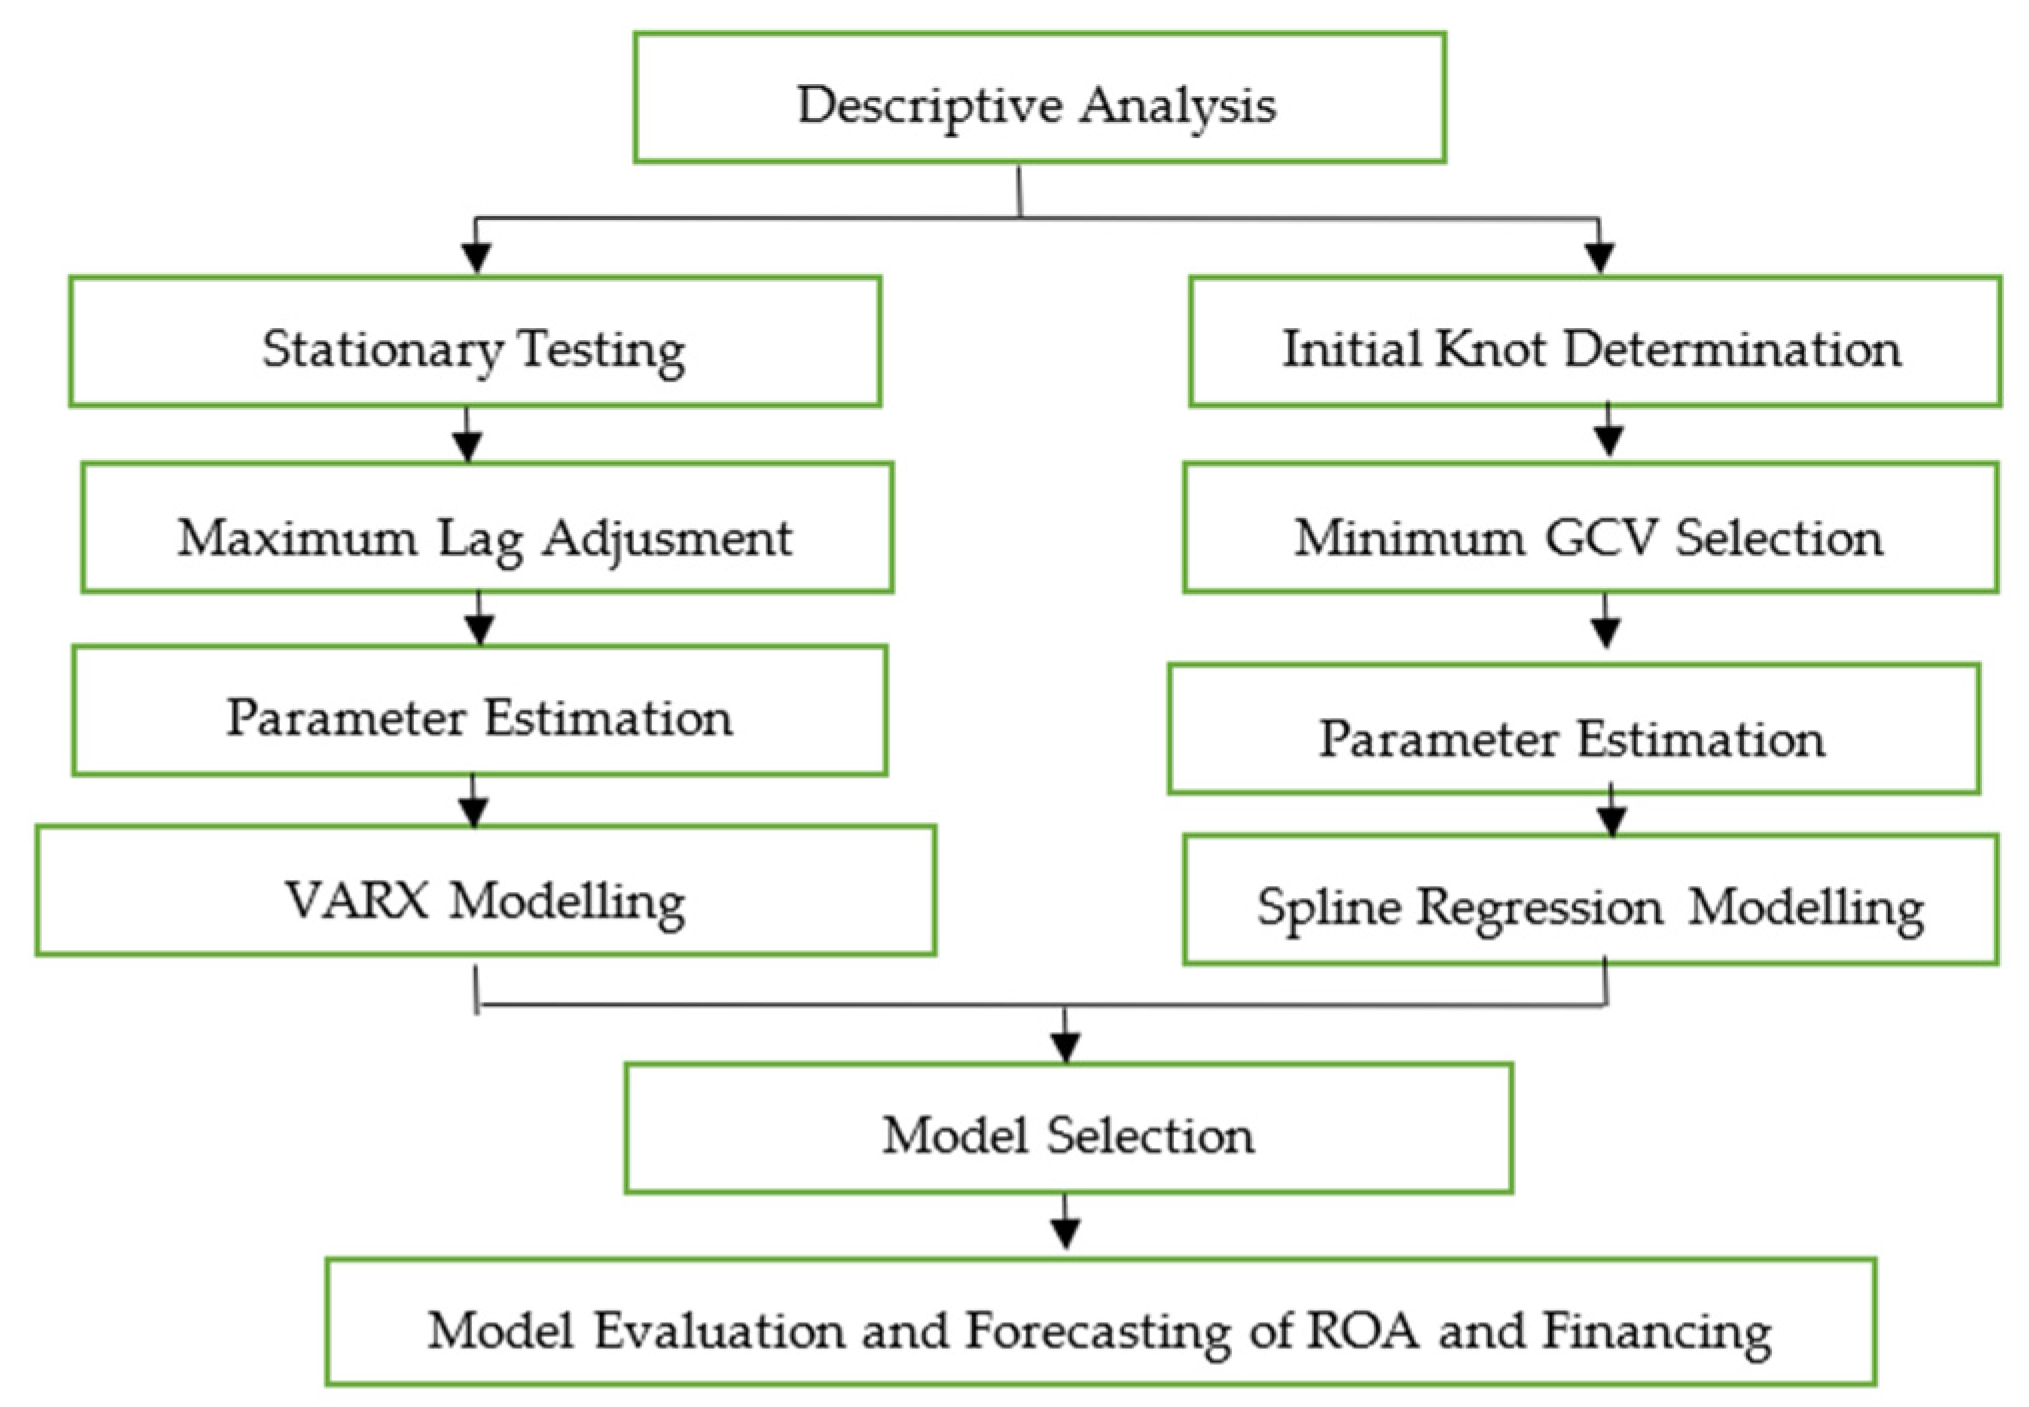
3.2. Model Development Using VARX and Spline Regression

To model LFIN and LROA using VARX model (see Equations (1) and (2)), we first conducted a stationarity test using the Philips Perron test and second determined the number of maximum lag (p) using five criteria: LR, FPE, AIC, SC, and HQ (see Section 2.2.1 step 3 and [35]). Table 1 concludes that LROA and LFIN are stationary at level (p-value < 0.05), suggesting the employment of both variables for modeling without further treatment. Regarding the lag selection, the results are different depending on the criteria: SC selects 1, LR and HQ prefer 5, while FPE and AIC consider 7 lags (Table 2). We embraced all options, i.e., VARX with lag 1, VARX with lag 5, and VARX with lag 7, and then compared them to determine the best one.
Using three VARX models, the resulting estimators and the R-adjusted are depicted in Table 3. The VARX (7) model performs best with the R-adjusted values more than 99 percent for LFIN, meaning that the VARX model perfectly fits the real LFIN case. Although models for LROA perform slightly worse with R-adjusted values around 75%, the more complex structure of LROA could explain this result (see Figure 2b).
Regarding the COV19, we find that the COVID-19 pandemic has significantly impacted the decline of LROA, around 0.26 (equivalent to the decline of ROA around 1.30 percent) compared to the one before the pandemic. When the government had to issue a policy of Financial Services Authority Regulation No. 11/POJK.03/2020 for banking industry to restructure financing, the profit of Islamic Commercial Banks dropped significantly, followed by a declining of the ROA. On the other hand, the pandemic does not show a significant effect on financing, showing that Islamic Commercial Bank might have anticipated the impact of the pandemic. The strategy is to continue distributing the finance but with more selective debtors [38]. The bank also maintains collecting funds by developing digital banking services, so the customers can get excellent services easily.
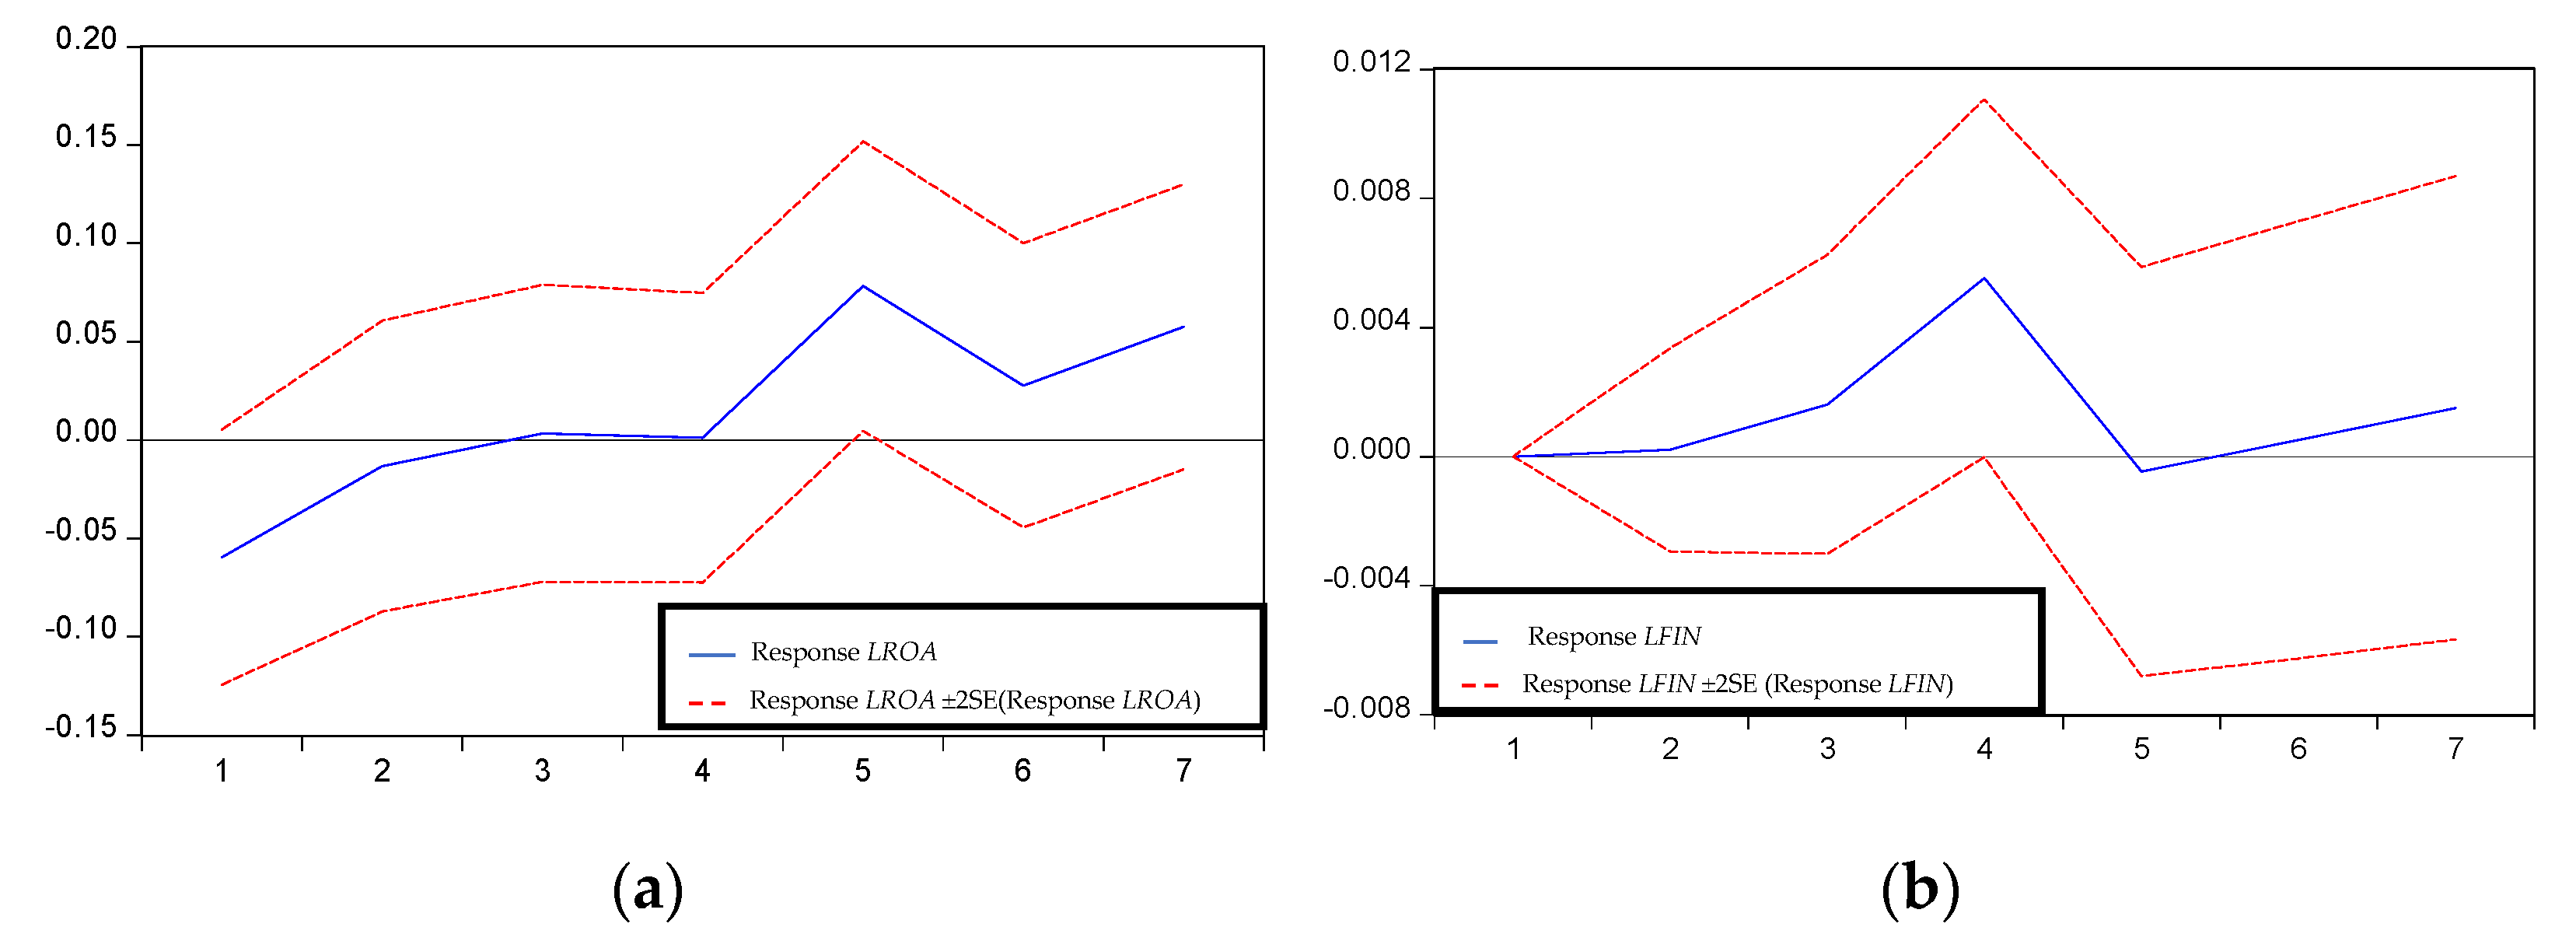
The reciprocal influence between LFIN and LROA is conducted using impulse response presented in Figure 3. First, LFIN shock in a month will be responded to positively by LROA 5 months later (Figure 3a), meaning that the profit of financing will impact on ROA at least 5 months after the financing is granted. Second, LROA shock in a month will be responded to positively by LFIN in 2 months until 4 months later, indicating the profit earned by Islamic Commercial Banks in a month can be optimized to increase financing at least two months after the banks obtain profit. An increase in ROA shows that there has been an increase in the profit of the banks by assuming assets of the banks are fixed. With good profitability, the bank will have more liberty to provide financing to debtors because the bank has good liquidity. Our findings are in line with the previous studies [15,17,18,19], but this reciprocal influence between ROA and finance of Indonesia Islamic Commercial Bank could be the first one available in the literature.
To evaluate the forecasting performance, we calculate the RMSE using the testing data, compare again all the VARX models, and select the model with the smallest RMSE. The VARX (7) is the best one for financing while the VARX (5) is best for ROA (Table 4).
After obtaining two VARX model candidates, the next step is to make spline regression. In this study, we form three spline regression models with lag lengths of exogenous variables based on the previous selection criteria, namely 1, 5, and 7. The estimated results of spline regression model can be seen in Table 5. The entire spline regression model in this study yields adjusted R Square above 69 percent. It means that all of the spline regression models made are good enough to explain the variation of LFIN and LROA because more than 69 percent of variation of LROA and LFIN can be explained by the spline regression models formed. Based on the results of significance test in Table 5, LFIN in a month is significantly affected by LFIN in the previous month and LROA in a month is significantly affected by LROA in the previous month. We will now focus on the impact of the pandemic on LROA and LFIN based on the results of spline regression. All spline regression models formed give the result that the pandemic is insignificant to financing. In addition, only the spline regression model with a maximum exogenous variable lag of 7 provides results that the pandemic is significant to LROA. This contrasts with the results obtained in VARX models that all show significant results of the effect of the pandemic on LROA. It can be caused by only a small available observation used in the pandemic periods so spline regression models cannot capture the impact of the pandemic on LROA and LFIN.
The next step is to compare forecasting performance between VARX and spline regression model. We compare forecasting performance between VARX and spline regression model by looking at RMSE that is generated when applying the model in data testing. From Table 6, the smallest RMSE value for ROA forecasting in data testing period is obtained from VARX model with lag 5 while the smallest RMSE value for financing forecasting in data testing period is obtained from VARX model with lag 7. Therefore, empirically, financing and ROA forecasting of Islamic Commercial Banks in Indonesia is better using VARX model than spline regression model.
Based on Table 6, we will forecast ROA of Islamic Commercial Banks by using VARX with maximum lag of 5 (VARX (5)) while we will forecast financing of Islamic Commercial Banks by using VARX with maximum lag of 7 (VARX (7)). The next step is to form VARX (5) and VARX (7) by using all training and testing data. The VARX (5) and VARX (7) models obtained from training and testing data are written as follows.
VARX (5)
L R O A t = 25.28613 0.500152 L F I N t 1 + 1.788185 L F I N t 2 + 0.660675 L F I N t 3 + 2.933684 L F I N t 4 2.796253 L F I N t 5 + 0.282143 L R O A t 1 + 0.137131 L R O A t 2 + 0.121606 L R O A t 3 0.238820 L R O A t 4 + 0.029916 L R O A t 5 0.226493 C O V 19 t + e 2 t
L F I N t = 0.036738 + 1.062961 L F I N t 1 0.252623 L F I N t 2 + 0.357836 L F I N t 3 0.417104 L F I N t 4 + 0.246609 L F I N t 5 0.003665 L R O A t 1 + 0.007986 L R O A t 2 + 0.008373 L R O A t 3 0.025263 L R O A t 4 + 0.013582 L R O A t 5 + 0.000538 C O V 19 t + e 1 t
VARX (7)
L R O A t = 32.60182 + 0.921153 L F I N t 1 0.075911 L F I N t 2 + 0.089616 L F I N t 3 + 4.735478 L F I N t 4 4.937431 L F I N t 5 + 3.532398 L F I N t 6 1.576824 L F I N t 7 + 0.321173 L R O A t 1 + 0.059340 L R O A t 2 + 0.074357 L R O A t 3 0.253940 L R O A t 4 + 0.206932 L R O A t 5 0.178421 L R O A t 6 0.094278 L R O A t 7 0.269664 C O V 19 t + e 2 t
L F I N t = 0.487768 + 1.073947 L F I N t 1 0.224942 L F I N t 2 + 0.293725 L F I N t 3 0.382317 L F I N t 4 + 0.151085 L F I N t 5 + 0.293300 L F I N t 6 0.244417 L F I N t 7 + 0.001455 L R O A t 1 + 0.005280 L R O A t 2 + 0.012446 L R O A t 3 0.028887 L R O A t 4 + 0.014463 L R O A t 5 0.001798 L R O A t 6 + 0.009843 L R O A t 7 + 0.002930 C O V 19 t + e 1 t
The ROA forecasting of Islamic Commercial Banks is done by using VARX (5) model in the Equations (6) and (7). Meanwhile, the financing forecasting of Islamic Commercial Banks is done by using VARX (7) model in the Equations (8) and (9). The forecasting result can be seen in Table 7.
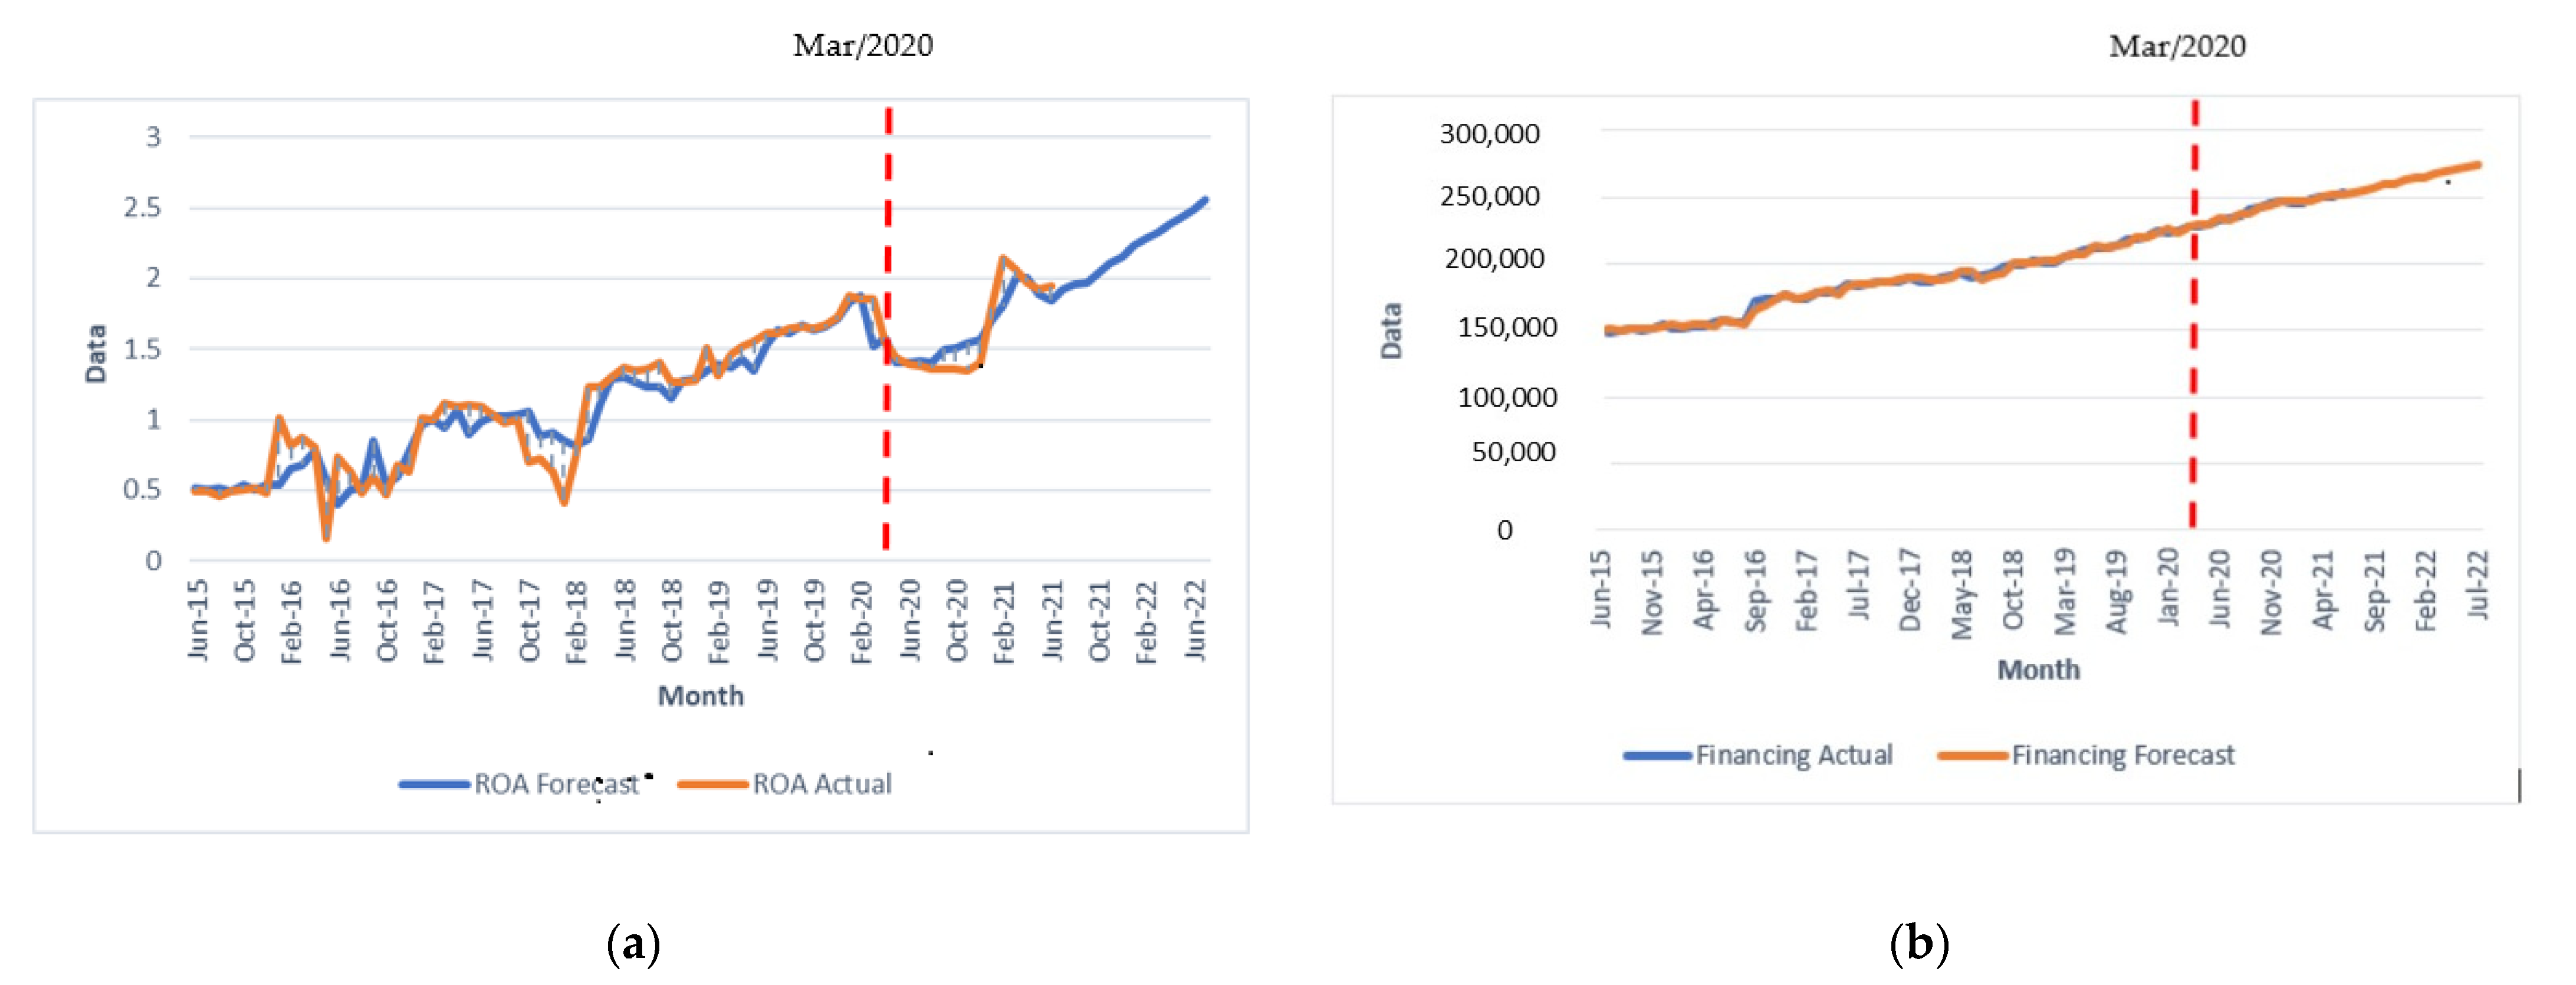
To see the difference between actual and forecast ROA and finance, we also compare them in Figure 4. In general, the actual and forecast data are quite similar. The forecast of financing is even very close to the reality. Although ROA is more difficult to predict, our model could detect the impact of the COVID-19 pandemic, showing that the ROA dropped from March 2020 (pandemic begins in Indonesia) to November 2020.
Our results could supplement previous studies, especially the one conducted by Nugroho et al. [39] which used three kinds of scenarios to predict the performance of Islamic Commercial Banks. In a scenario where economic growth conditions decrease from 5.3 percent to 4.6 percent and the rupiah exchange rate against the dollar amounted to Rp16.500, Islamic Commercial Banks can still run their business well. In addition, Nugroho et al. [39] suggested the steps taken by the government to strengthen Islamic Commercial Banks in Indonesia, including strengthening liquidation, implementing financing restructuration rules, and merging Islamic Commercial Banks.
Related to the explanation of previous paragraph, the determination of state revenue and spending budget draft in 2022 uses the assumption of economic growth of 5.2 to 5.5 percent and the rupiah against dollar exchange rate is Rp. 14,350. On 1 February 2021, three Indonesia Islamic Commercial Banks, namely BRI Syariah, Bank Syariah Mandiri, and BNI Syariah, officially merged into Bank Syariah Indonesia [40]. In addition, the government, through the regulation of the financial services authority number 11/POJK.03/2020, has implemented a policy on credit restructuring and financing for debtors who are experiencing difficulty to fulfill obligations to the banks due to debtors or businesses debtors affected by the spread of COVID-19. Considering the conditions and efforts that have been made, ROA and financing could be getting better in 2022, as obtained by our results (Figure 4). In Figure 4a, we can see that the graph of the ROA forecasting line (blue line) is similar to the graph of the actual data line (orange line). In March 2020, when the pandemic was first detected in Indonesia, ROA estimation shows a similar pattern of decline with actual data. From July 2021 until July 2022, the ROA of Islamic Commercial Banks is predicted to continue to increase. Meanwhile, in Figure 4b, the financing forecasting graph (blue line) has an increasing pattern similar to the graph of actual data (orange line).

4. Conclusions

In this study, we proposed VARX and spline regression to forecast the ROA and financing of Indonesia Islamic Commercial Bank. We found that VARX outperforms spline regression by producing a smaller RMSE. The COVID-19 pandemic has significantly impacted the ROA by 0.26 (equivalent to the decline of ROA around 1.30 percent). LFIN shock in a month will be responded to positively by LROA 5 months later, while LROA shock in a month will be responded to positively by LFIN in 2 months until 4 months later. The forecasting results using VARX are quite similar to the real case and could detect the impact of the COVID-19 pandemic.
The maximum lag selection for spline regression is based on the results obtained from VARX using five criteria: LR, FPE, AIC, SC, and HQ. It might be optimal for VARX but arguably also for spline regression. The standard method to determine the lag for spline regression is unfortunately very limited, so we followed the same procedure as in the VARX. It would be interesting to investigate this issue for future study. To extend our study, one may also consider including more predictors such as exchange rate, non-performing financing, and lock down effect [15,16]. In addition, when spatial effect is involved in the analysis of ROA and financing, a spatial or spatio-temporal based method would be an idea for further investigation [41,42,43].

Author Contributions

Conceptualization: G.P.D.S., L.L., A.C. and H.K.; methodology, G.P.D.S. and L.L.; software, G.P.D.S. and L.L.; writing—original draft preparation, G.P.D.S.; writing—review, A.C. and H.K.; writing—editing, G.P.D.S. and A.C.; visualization, G.P.D.S.; supervision, A.C. and H.K. All authors have read and agreed to the published version of the manuscript.

Funding

The authors gratefully acknowledge financial support from the Institut Teknologi Sepuluh Nopember for this work, under project scheme of the Publication Writing and IPR Incentive Program (PPHKI).

Institutional Review Board Statement

Not applicable.

Informed Consent Statement

Not applicable.

Data Availability Statement

Publicly available datasets were analyzed in this study. This data can be found here: www.ojk.go.id (accessed on 26 September 2021).

Conflicts of Interest

The authors declare no conflict of interest.

References

  1. Timsina, N. Impact of Bank Credit on Economic Growth in Nepal. 2014. Available online: https://ideas.repec.org/p/nrb/wpaper/v22y2014p1-23.html (accessed on 28 September 2021).
  2. Majeed, S.; Iftikhar, S.F. Modeling the relationship between banking sector credit and economic growth: A sectoral analysis for Pakistan. J. Econ. Coop. Dev. 2020, 41, 145–178. [Google Scholar]
  3. Altăr, A.; Kubinschi, M.; Zaharia, A. Uncovering the Dynamic Relationship between Credit and Sustainable Economic Growth in Selected CEE Countries. Sustainability 2021, 13, 6349. [Google Scholar] [CrossRef]
  4. Kafabih, A.; Manzilati, A. A Hadith about Riba and the Relationship with Occupation: Which One is Preferable between the Merchant and Islamic Bank Clerk? J. Islam. Econ. Lariba 2018, 4, 37–45. Available online: https://journal.uii.ac.id/JIELariba/article/view/7646 (accessed on 28 September 2021).
  5. Farooq, M. Forecasts of Future Profitability based on Disaggregated Earnings: A Comparative Analysis of Islamic and Conventional Banks. J. Manag. Sci. 2015, VII, 256–272. [Google Scholar]
  6. Purnamasari, D.M. Wapres Pastikan Pemerintah Terus Dorong Pengembangan Ekonomi Syariah. 2021. Available online: https://nasional.kompas.com/read/2021/10/27/12573881/wapres-pastikan-pemerintah-terus-dorong-pengembangan-ekonomi-syariah (accessed on 30 October 2021).
  7. Insani, D.S.; Muflih, M. Determinants of Islamic Bank Performance: Evidence from Indonesian Islamic Banking Industry. IOP Conf. Ser. Mater. Sci. Eng. 2019, 662, 072001. [Google Scholar] [CrossRef] [Green Version]
  8. Financial Service Authority. Statistik Perbankan Syariah. Jakarta. 2021. Available online: https://www.ojk.go.id/id/kanal/syariah/data-dan-statistik/statistik-perbankan-syariah/Pages/Statistik-Perbankan-Syariah---Juni-2021.aspx (accessed on 26 September 2021).
  9. Financial Service Authority. Statistik Perbankan Syariah. Jakarta. 2003. Available online: https://www.ojk.go.id/id/kanal/syariah/data-dan-statistik/statistik-perbankan-syariah/Documents/DES17062004_1390365169.pdf (accessed on 26 September 2021).
  10. Kadioglu, E.; Telceken, N.; Ocal, N. Effect of the Asset Quality on the Bank Profitability. Int. J. Econ. Financ. 2017, 9, 60. [Google Scholar] [CrossRef]
  11. Nessibi, O. The Determinants of Bank Profitability. Int. J. Financ. Bank. Stud. 2016, 5, 39–50. [Google Scholar] [CrossRef]
  12. Hachicha, N.; Ben Amar, A. Does Islamic bank financing contribute to economic growth? The Malaysian case. Int. J. Islam. Middle East. Financ. Manag. 2015, 8, 349–368. [Google Scholar] [CrossRef]
  13. Tag-El-Din, S. Income Ratio, Risk-Sharing, and the Optimality of Mudarabah. J. King Abdulaziz Univ. Econ. 2008, 21, 37–59. [Google Scholar] [CrossRef] [Green Version]
  14. Hasan, M.; Dridi, J. The effects of the global crisis on islamic and conventional banks: A comparative study. J. Int. Commer. Econ. Policy 2011, 2, 163–200. [Google Scholar] [CrossRef]
  15. Widarjono, A. Estimating Profitability of Islamic Banking in Indonesia. J. Keuang. Perbank. 2018, 22, 568–579. [Google Scholar] [CrossRef]
  16. Fathurrahman, A.; Devi, A.S. The Determinants of Musharaka Financing in Indonesia. J. Ѐkon. Studi Pembang. 2021, 22, 37–47. [Google Scholar] [CrossRef]
  17. Ichsan, R.N.; Suparmin, S.; Yusuf, M.; Ismal, R.; Sitompul, S. Determinant of Sharia Bank‘s Financial Performance during the COVID-19 Pandemic. Bp. Int. Res. Critics Inst. (BIRCI-J.) Humanit. Soc. Sci. 2021, 4, 298–309. [Google Scholar] [CrossRef]
  18. Afkar, T. Influence Analysis of Mudharabah Financing and Qardh Financing to The Profitability of Islamic Banking in Indonesia. AJIE–Asian J. Innov. Entrep. 2017, 2, 340–351. [Google Scholar]
  19. Afiyanti, A.; Hardiyanti, W.; Program, A.S.; Economics, F.O. Impact Analysis of Capital Adequacy Ratio (Car) and Return on Asset (Roa) on Financing of Murabaha on Sharia Bank in Indonesia Period Year 2014–2018. J. EMBA J. Ris. Ekon. Manaj. Bisnis Akunt. 2020, 8, 323–334. [Google Scholar] [CrossRef]
  20. Suharsono, A.; Guritno, S.; Subanar, A. Vector Autoregressive Modeling for Inflation Data in Indonesia. J. Basic Appl. Sci. Res. 2012, 2, 1–4. [Google Scholar]
  21. Apriliadara, M.; Suhartono; Prastyo, D.D. VARI-X model for currency inflow and outflow forecasting with Eid Fitr effect in Indonesia. In AIP Conference Proceedings; AIP Publishing LLC: Melville, NY, USA, 2016; Volume 1746. [Google Scholar] [CrossRef]
  22. Ulyah, M.; Susilaningrum, D.; Suhartono, A. Peramalan Volume Penjualan Total Sepeda Motor. J. Sains Seni POMITS 2014, 3, D230–D235. [Google Scholar]
  23. Tsay, R.S. Multivariate Time Series Analysis with R and Financial Applications; Wiley: Chicago, IL, USA, 2014. [Google Scholar]
  24. Eubank, R.L. Nonparametric Regression and Spline Smoothing; CRC Press: Boca Raton, FL, USA, 1999. [Google Scholar]
  25. Huang, J.Z.; Shen, H. Functional Coefficient Regression Models for Non-linear Time Series: A Polynomial Spline Approach. Scand. J. Stat. 2004, 31, 515–534. [Google Scholar] [CrossRef] [Green Version]
  26. Ramli, M.; Ratnasari, V.; Budiantara, I.N. Estimation of Matrix Variance-Covariance on Nonparametric Regression Spline Truncated for Longitudinal Data. J. Phys. Conf. Ser. 2020, 1562, 012014. [Google Scholar] [CrossRef]
  27. Wening, A.W.; Budiantara, I.N.; Zain, I. Semiparametric regression curve estimation for longitudinal data using mixed spline truncated and fourier series estimator. J. Phys. Conf. Ser. 2020, 1538, 012061. [Google Scholar] [CrossRef]
  28. Suhartono; Choiruddin, A.; Prabowo, H.; Lee, M.H. Hybrid Machine Learning for Forecasting and Monitoring Air Pollution in Surabaya. Commun. Comput. Inf. Sci. 2021, 1489, 366–380. [Google Scholar] [CrossRef]
  29. Sohibien, G.P.D. Analysis of the effect of fuel price policy on Jakarta inflation by using multi-input intervention model. AIP Conf. Proc. 2018, 2014, 020125. [Google Scholar] [CrossRef]
  30. Yuhan, R.J.; Sohibien, G.P.D. Relationship between inflation, exchange rate and money supply in Indonesia using threshold vector autoregressive (TVAR). AIP Conf. Proc. 2018, 2014, 020128. [Google Scholar] [CrossRef]
  31. Gujarati, D. Basic Economitrics; Mc.Graw-Hill: New York, NY, USA, 2003. [Google Scholar]
  32. Ahad, M. Nexus between income inequality, crime, inflation and poverty: New evidence from structural breaks for Pakistan. Publ. Int. J. Econ. Empir. Res. 2016, 4, 133–145. Available online: https://mpra.ub.uni-muenchen.de/72429 (accessed on 17 November 2021).
  33. Perron, P. The Great Crash, the Oil Price Shock, and the Unit Root Hypothesis. Econometrica 1989, 57, 1361. [Google Scholar] [CrossRef]
  34. Phillips, P.C.B.; Perron, P. Biometrika Trust Testing for a Unit Root in Time Series Regression Testing for a unit root in time series regression. Biometrika 1988, 75, 335–381. [Google Scholar] [CrossRef]
  35. Liew, V.K.-S. Which Lag Length Criteria Should We Employ? Econ. Bull. 2004, 3, 1–9. [Google Scholar]
  36. Budiantara, I.N. Regresi Nonparametrik Spline Truncated; ITS Press: Surabaya, Indonesia, 2019. [Google Scholar]
  37. Fadila, I. September 2016, Pangsa Pasar Bank Syariah Tembus 5.3%. Jakarta. 2016. Available online: https://finansial.bisnis.com/read/20160927/90/587449/september-2016-pangsa-pasar-bank-syariah-tembus-53 (accessed on 30 October 2021).
  38. Wiratmini, N.P.E. Tersengat Pandemi, Pembiayaan Bank Syariah Tetap Tumbuh Kendati Lambat. Jakarta. 2020. Available online: Finansial.bisnis.com (accessed on 19 August 2021).
  39. Nugroho, L.; Utami, W.; Doktoralina, C.M. I J E B a COVID-19 and the Potency of Disruption on the Islamic Banking Performance (Indonesia Cases). Int. J. Econ. Bus. Appl. 2020, 1, 11–25. Available online: http://ijeba.makarioz.org/ (accessed on 19 August 2021).
  40. Aida, N.R. Jadwal dan Cara Migrasi Rekening BRI Syariah dan BNI Syariah ke BSI. Jakarta. 3 May 2021. Available online: kompas.com (accessed on 27 October 2021).
  41. Suhartono; Hikmawati, F.; Setyowati, E.; Salehah, N.A.; Choiruddin, A. A MGSTAR: An Extension of The Generalized Space-Time Autoregressive Model. J. Phys. Conf. Ser. 2021, 1752, 012015. [Google Scholar] [CrossRef]
  42. Suhartono; Hikmawati, F.; Setyowati, E.; Salehah, N.A.; Choiruddin, A. A Novel Hybrid GSTARX-RNN Model for Forecasting Space-Time Data with Calendar Variation Effect. J. Phys. Conf. Ser. 2020, 1463, 012037. [Google Scholar] [CrossRef]
  43. Choiruddin, A.; Aisah; Trisnisa, F.; Iriawan, N. Quantifying the Effect of Geological Factors on Distribution of Earthquake Occurrences by Inhomogeneous Cox Processes. Pure Appl. Geophys. 2021, 178, 1579–1592. [Google Scholar] [CrossRef]
Figure 1. Research Flow Chart.
Sustainability 14 01128 g001
Figure 2. Fluctuation of (a) LFIN and (b) LROA of Islamic Commercial Banks in Indonesia, November 2014–June 2021.
Sustainability 14 01128 g002
Figure 3. Response of (a) LROA to LFIN and (b) LFIN to LROA.
Sustainability 14 01128 g003
Figure 4. Time series plot of actual data and forecast value of (a) ROA and (b) financing of Islamic Commercial Banks in Indonesia.
Sustainability 14 01128 g004
Table 1. LROA and LFIN Stationary Test Results with Philips Perron Test.
Variablep-Value
LROA0.0001
LFIN0.0373
Table 2. Lag Selection Results of VARX model.
LagLRFPEAICSCHQ
0NA0.001170−1.075080−0.944520−1.023348
1271.17741.90 × 10−5−5.194579 −4.933460 *−5.091116
25.4421931.96 × 10−5−5.164709−4.773031−5.009514
35.9877762.00 × 10−5−5.146858−4.624621−4.939932
420.431861.58 × 10−5−5.381485−4.728688−5.122827
5 9.987149 *1.50 × 10−5−5.442180−4.658824 −5.131790 *
65.2566781.53 × 10−5−5.421878−4.507964−5.059757
78.395355 1.48 × 10⁻⁵ * −5.465681 *−4.421206−5.051828
82.4004101.60 × 10−5−5.396042−4.221008−4.930457
Note: * lag selection for each criterion.
Table 3. Estimated Parameters of VARX (1), VARX (5), and VARX (7).
VariableVARX (1)VARX (5)VARX (7)
LFINLROALFINLROALFINLROA
LFIN(-1)1.004305 *1.847757 *1.064785 *1.0647851.079324 *0.868357
LFIN(-2) −0.2545791.731576−0.226609−0.085951
LFIN(-3)0.353641 *0.6603680.2882740.011706
LFIN(-4)−0.416737 *2.937194−0.379333 *4.833932
LFIN(-5)0.251441 *−2.8253450.153858−4.919644
LFIN(-6) 0.2945673.586449
LFIN(-7)−0.251059 *−1.561536
LROA(-1)−0.0013400.361617 *−0.0037430.282253 *0.0014990.321621 *
LROA(-2) 0.0081490.1373200.0053030.061422
LROA(-3)0.0085480.1208910.012547 *0.072456
LROA(-4)−0.025470 *−0.240902 *−0.029206 *−0.256283 *
LROA(-5)0.013314 *0.0337620.014451 *0.203855
LROA(-6) −0.001512−0.180227
LROA(-7)0.009977−0.100781
COV190.000646−0.201702 *0.000720−0.231799 *0.002769−0.262696 *
C−0.045652−22.38927 *0.026188−25.17062 *0.504115−33.14283 *
Adj. R-squared0.9918360.6988770.9937420.7148070.9940120.75642
Note: * significant at 5 percent significance level.
Table 4. RMSE of financing and ROA forecasting using VARX (1), VARX (5), and VARX (7).
ModelROAFinancing
VARX (1)0.1265452030.581
VARX (5)0.08737541205.9954
VARX (7)0.13613912627.565189
Table 5. Parameter Estimates of Spline Regression.
VariableSpline Regression with Maximum Lag of 1 on Exogenous VariablesSpline Regression with Maximum Lag of 5 on Exogenous VariablesSpline Regression with Maximum Lag of 7 on Exogenous Variables
LROALFINLROALFINLROALFIN
c−7.80.030−20.50.027−22.10.499
LFINt-10.620.9979 *−0.781.064 *0.181.081 *
LFINt-2 1.77−0.254−0.16−0.227
LFINt-3 0.670.354 *−0.140.288
LFINt-4 2.91−0.417 *5.05−0.380
LFINt-5 −2.890.251 *−4.830.154
LFINt-6 3.63−0.00154
LFINt-7 −0.1210.01003
LFINt-1-k21.72 0.55 1.30
LROAt-10.334 *−0.003490.279 *−0.003800.314 *0.00185
LROAt-2 0.1340.008120.0530.00547 *
LROAt-3 0.1190.008540.0690.01263
LROAt-4 −0.243−0.02547 *−0.257−0.02923 *
LROAt-5 0.0280.01329 *0.2020.01456
LROAt-6 −0.185−0.00154
LROAt-7 −0.1210.01003
LROAt-1-k1 0.0085 * 0.0003 −0.0016
COVID-19−0.2820.00098−0.2550.00072−0.312 *0.00274
Adj. R-squared69.85%99.17%71.02%99.36%71.17%99.39%
K1 = −0.1 (turning point of spline regression with exogenous LROA variable of endogenous variable). K2 = 12 (turning point of spline regression with exogenous lag LROA variable of lag endogenous variable) * significant at 5 percent significance level.
Table 6. Comparison of RMSE of VARX model and Spline Regression.
ModelRMSE
FinancingROA
VARX with lag 51205.99540.0873754
VARX with lag 7627.5651890.13613912
Spline Regression with lag 52727.8120.461847
Spline Regression with lag 789,012.14191.975684
Table 7. Results of financing and ROA forecasting of Islamic Commercial Banks in Indonesia, July 2021–July 2022.
YearMonthROAFinancing
2021July1.92254,200
2021August1.96254,855
2021September1.97257,621
2021October2.04259,756
2021November2.11260,674
2021December2.15262,960
2022January2.24264,741
2022February2.28265,560
2022March2.32267,913
2022April2.39269,637
2022May2.44270,628
2022June2.50272,801
2022July2.56274,471
Publisher’s Note: MDPI stays neutral with regard to jurisdictional claims in published maps and institutional affiliations.

