Article

A Spatial Analysis of Smart Meter Adoptions: Empirical Evidence from the U.S. Data

1
School of Management, Clark University, Worcester, MA 01610, USA
2
Department of Economics, Clark University, Worcester, MA 01610, USA
*
Author to whom correspondence should be addressed.
Sustainability 2022, 14(3), 1126; https://doi.org/10.3390/su14031126
Submission received: 2 December 2021 / Revised: 6 January 2022 / Accepted: 13 January 2022 / Published: 19 January 2022

Abstract

:
With the increasing demand on grid modernization for improving environmental sustainability and grid security, the topic of smart meter adoption has attracted much attention, especially with regard to the roles of public policies. However, there is a lack of research investigating the association between the multi-layered government policies and smart meter adoption from a spatial perspective to explain the variant adoption rates across the United States. This study constructs a panel of 48 contiguous U.S. states and the District of Columbia over the period 2007–2019. Using this unique dataset and spatial econometric models, we investigate the impacts of federal and state policies as well as spatial spillover effects of smart meter adoption in the residential sector. Results indicate the following: (1) Smart meter adoption has spatial spillover effects between the adjacent states in a sense that the rate of adoption in one state is positively associated with adoption rates in the neighboring states; (2) federal funding and state-level legislative actions on advanced metering and smart grid have positive impacts on smart meter adoption. These findings provide important implications for the formulation and implementation of public policies for the adoption of a modern electric grid in the U.S.

1. Introduction

The integration of smart-grid technologies has important contributions to sustainable development. It enhances the utilization efficiencies of the power system, improves the integration of intermittent renewable and clean energy, and increases energy savings [1]. As the world is facing the challenge of energy and climate crisis, many countries have been promoting smart grids as a way to reduce energy waste and air pollution [2,3,4,5,6]. For example, European Union (EU) member states approved a proposal to invest USD 1.147 billion in energy infrastructure projects in 2020, 84% of which would be allocated to electricity and smart-grid projects [7]. Similarly, the China Electricity Council reports that the smart grid accumulated investment of around USD 0.63 trillion by 2020 [8]. As in other countries in the world, the U.S. electric power industry is also facing the challenges of increased utility price, peak load fluctuations, and the need to reduce carbon dioxide emission [9].
Smart meters are important components of a smart grid. They measure and store hourly electricity usage, and allow two-way communication that transmits pricing and energy information between the utility companies and the consumers. Smart meters, along with communication systems and meter data management systems, constitute advanced metering infrastructure (AMI) [10]. With the real-time information from AMIs, the utilities can utilize dynamic pricing, such as charging differently for different types of customers, different locations of the customer, different times of day, and different seasons, to balance the utility usage so that they can lower the risk of a power outage [11,12]. With the feedback information, customers have better knowledge about their spending patterns of using electric devices, and consequently are able to make behavioral adjustments to lower their electric bill and drive the reduction of electricity consumption [13,14,15]. In addition, the deployment of smart meters has the potential to reduce the need to build additional power plants that are used only for fluctuating peak load demand, which in turn will reduce greenhouse gases and pollutants emissions [13,16].
To accelerate the adoption of smart meters, governments have made important investments and developed various policies to promote grid modernization [17,18]. The Smart Grid Investment Grant (SGIG) Program aimed at accelerating the development of smart meters in the United States [19]. The American Recovery and Reinvestment Act of 2009 (ARRA), for example, provided for a total budget of about USD 8 billion in the development of a smart grid. About USD 2 billion from the budget was invested in AMIs [19]. According to the U.S. Energy Information Administration (EIA)’s report, by the year 2020 about 102.9 million AMIs were installed in the U.S., and about 88% of them are in the residential sector [20]. A total of 115 million smart meters were projected to be installed by the end of 2021 [21].
The electric utility sector in the U.S. is composed of a large arrays of stakeholders for electricity generation, transmission, distribution, and commercialization. According to the U.S. EIA’s data [22], almost 3000 electric utilities were operating in the U.S. in 2017. Of all utilities, 1958 were publicly owned (including federal-, state-, and municipal-run utilities), 812 were rural electric cooperatives, and 168 were investor owned. In particular, 72% of U.S. electricity customers were served by investor-owned utilities in 2017 [23]. Additionally, the U.S. electricity sector is governed by different public institutions, with each having independent yet overlapping functions. The federal government sets general policies through the Department of Energy (DOE), environmental regulations via the Environmental Protection Agency, and consumer protection policy through the Federal Trade Commission [24]. The Nuclear Regulatory Commission is in charge of the safety of nuclear power plants. States are responsible for economic regulation of the electric power distribution segment, usually through the Public Utilities Commissions (PUC), while the interstate transmission segment is governed by the Federal Energy Regulatory Commission [24,25]. For instance, the California PUC approved the Pacific Gas and Electric Company’s application for the deployment of ten million smart meters in 2005 [26,27]. Colorado legislature passed data privacy and security policies in 2012 to address customers’ concerns [26]. Due to health and privacy concerns, some states mandated through PUC that utilities offer opt-out options for their customers at some cost [26]. In most cases, customers who choose to opt out are charged to do so, except for two states, New Hampshire and Vermont, where customers can decline smart meter installations with no cost [28,29].
According to U.S. EIA [20], approximately 102.9 million smart meters had been installed in 2020, about 88% of which were in the residential sector. This covers approximately 75% of U.S. households [21]. In Figure 1, the U.S. EIA’s report shows a dramatic growth in the number of smart meters during the years 2007–2020. Installations of smart meters in 2020 have grown to be more than four times greater than in 2010 in the residential sector [30].
Existing studies have proved the importance of federal funding [31,32]. However, the AMI adoption rates across regions vary drastically [32,33]. West coast states, west south-central states, and New England are clearly leading the country with much higher penetration rates, which is shown in our results. It is possible that different states also introduced various regulatory interventions that may have facilitated or impeded the development of the smart grid [32,34]. Therefore, it is important to explore the confluence of multi-layered government interventions. Moreover, literature in innovation adoption often pointed to the existence of technology spillover effects, in a sense that the diffusion of an advanced technology often transcends state boundaries and becomes a regional characteristic [35,36,37]. The spatial spillover effects are often used to explain the imbalanced adoption of new technologies in different regions [38]. This study builds on our previous effort of studying the impacts of federal government policies, and attempts to identify how state policies along with regional spillover effects lead to different levels of adoption in smart meter deployment [31]. For this purpose, we constructed a dataset that uses the data from the SGIG program released by the U.S. DOE, EIA, and some other sources to investigate the spatial effect of technology spillover in the state-level development of smart meter adoption. Our study made important contributions to the theories and practices that promote sustainable technology adoption in regions.
The rest of the paper is arranged as follows. Section 2 introduces the existing literature in this field. Section 3 describes the methods. Section 4 presents the results. In Section 5, we discuss our findings and their implications.

2. Literature Review

Given the important roles that AMI plays, previous studies have examined the factors that may affect new technology adoption. An important factor is government interventions [31,32,34,39,40] since they help to overcome obstacles such as information deficiencies, financial shortcomings, and heterogeneity among populations [41]. The government interventions that affect technology adoption decisions include financial incentives, regulations, and standards [42,43]. First, the government often provides grant incentives (or tax benefits) to promote early adopters [44]. Second, information policies, such as demonstration projects and advertising campaigns, may on average give rise to earlier diffusion assuming that potential adopters are risk-averse [45,46]. Third, governments reduce uncertainty by imposing technical standards on the market [45,47,48].
The adoption of technologies has been found to be affected by federal and state policies and regulations in the oil, healthcare, and telecommunication industries [49,50,51]. More specifically, multiple studies have explored the impacts of government interventions on smart meter adoptions. Zhou and Matisoff [32] identified significant impacts of federal and state polices efforts on smart meter deployment. Strong [34] used duration models and fractional response models to examine the determinants of the early diffusion of smart meters in the U.S. and found that policy and regulatory support lead to a higher level of smart meter adoption. Similarly, a case study focusing on the adoption and diffusion of smart meters in Washington State was conducted by Kallman and Frickel [52]. Their results suggest that the relationships across different institutional processes and different organizational forms promote the implementation of smart meters by authorizing organizational behavior such as collaboration among private utility companies.
However, the existing studies have several limitations. Zhou and Matisoff [32] used a panel dataset encompassing the years 2007–2012. They missed the data between 2013 and 2016, when the implementation of the ARRA act actually took place. Strong’s [34] analysis failed to quantitatively test the marginal effects of federal policies and state policies, as they omitted the federal policy factors and measured the state-level AMI support with a binary variable (coded as one if the utility is subject to state support for AMI adoption). The understanding of the varied levels of the state support is missing. Additionally, Kallman and Frickel’s [52] results, based on a case study of Washington State, provide a limited basis for generalization to other states.
Moreover, no existing studies have taken the spatial spillover effect of smart meter adoption into consideration. Technology adoption was proven to have significant spatial autocorrelations in the literature. In particular, Snape [53] found that areas of similar installed Photovoltaic (PV) capacity were clustered when testing the spatial and temporal patterns of PV adoption in the U.K. Dharshing [38] also found significant spatial spillover effects of PV adoption between neighboring counties in Germany. In addition, Noonan, et al. [54], based on data from the Greater Chicago area from 1992 to 2004, demonstrated that spatial dependence exists for the adoption of energy-efficient HVACs across neighborhoods. In the agricultural field, spatial spillover effects were found in the adoption of sustainable technologies employing a sample of Irish dairy farms [55]. Similar evidence was also found in the adoption of hybrid rice in Bangladesh [56] and shuttle train elevators in the U.S. [57].
Many studies have shown that technological knowledge spillovers are local rather than global [35,58]. The reasons behind the spatial spillover effect of adopting solar thermal systems in Germany are the larger pool of skilled workers, solar initiatives, supplier activities, and advertising campaigns in the region [59]. Similarly, it was found that the adoption of new technologies by big firms could influence other firms in the local market because it makes it easier for other firms in the local market to get access to the suppliers of the new technology; small firms would imitate the big firms after seeing the benefit of new technologies, and a larger pool of human resources is available in the local market [60]. New technology adoption requires obtaining knowledge that frequently comes from human interactions between neighboring agents [61,62].
Nevertheless, no study to our knowledge has investigated the spatial patterns of smart meter adoptions, which can result in estimation bias. Including spatial spillover effects not only addresses this issue, but also demonstrates the effect of smart meter adoption on neighborhood areas, providing insights for policymaking and interstate cooperation supporting grid modernization. Therefore, this paper applies a spatial panel model to investigate whether the smart meter adoption in one state is affected by the adoption in neighboring states.

3. Materials and Methods

3.1. Panel Data Model

Various econometric models are used in this paper. First, we employ fixed-effect models that allow the intercept to vary for different states and in different years. Hence, we include state fixed effects to control for the observable and unobservable factors that vary across states, such as ideology and new technology acceptance level [63]. Besides, year fixed effects are also controlled for factors such as policy changes and technology shocks that are common to all the states in any given year.
In our research, the general empirical specification of the fixed effect model is as follows:
A d o p t i o n i , t = α + β 1 F u n d i n g i , t + β 2 S t a t e _ A c t i , t + γ C i , t + μ t + τ i + ϵ i , t
where the dependent variable A d o p t i o n i , t is the smart meter adoption rate in the state i , in year t . F u n d i n g i , t is the federal funding from the Smart Grid Investment Grant. S t a t e _ A c t i , t stands for the total number of actions concerning smart meter in state i as of year t . C i , t consists of 2 control variables that vary across states and years, including the percentage of the population that has at least completed four years of college and total energy consumed per dollar of real GDP. μ t is the year fixed effect that captures the time-specific events, which could affect the willingness of each state to adopt the smart meter. τ i is the state fixed effect, controlling for the average differences across states.   ϵ i , t is an idiosyncratic error term.

3.2. Spatial Panel Model

One problem may occur when panel data incorporate geographic information, because spatial dependence may exist between the neighboring areas and parameters may not be homogeneous across different areas [59,64]. Elhorst [64] solved this problem by introducing the fixed-effects spatial autocorrelation model (FE-SAR) and the fixed-effects spatial error model (FE-SEM).
We use a FE-SAR model and a FE-SEM model in this paper. The FE-SAR model assumes that smart meter adoption in one state is not only affected by the exogenous variables of the state but also smart meter adoption in adjacent states. The general form of the FE-SAR models is as follows:
A d o p t i o n i , t = α + ρ W A d o p t i o n j , t + β 1 F u n d i n g i , t + β 2 S t a t e _ A c t i , t + γ C i , t + μ t + τ i + ϵ i , t
where ρ in the FE-SAR model is the spatial autoregressive parameter, which reflects the strength of the spatial dependency. W is an n × n spatial weight matrix that takes the form:
W = [ w 1 , 1 w 2 , 1 w 1 , 2 w 2 , 2 w 1 , n w 2 , n w n , 1 w n , 2 w n , n ]
In this paper, we constructed an inverse distance spatial weight matrix for the main results, where:
w i , j = { 1 d i , j   i f   i j 0               i f   i = j
d i , j is the distance between the geographic center of state i and the geographic center of state j . We also constructed a contiguity spatial weight matrix for the robustness test, where:
w i , j = { 1 i f   s t a t e   i   i s   a   n e i g h b o r   o f   s t a t e   j                 0 i f   s t a t e   i   i s   n o t   a   n e i g h b o r   o f   s t a t e   j
Unlike the FE-SAR model, the FE-SEM model assumes that the spatial dependencies exist only in the error term but not in the dependent variables or the independent variables. The general form of the spatial error models is as follows:
A d o p t i o n i , t = α + β 1 F u n d i n g i , t + β 2 S t a t e _ A c t i , t + γ C i , t + μ t + τ i + λ W ϵ j , t + φ i , t
where λ in the FE-SEM is the autoregressive parameter for the error term which measures the effect of spatial dependency in some unobserved variables. φ i , t is an idiosyncratic error term. The subscripts and other variables are the same as those in Equation (2).

3.3. Data Source

This study uses a balanced panel dataset of the 48 contiguous states and the District of Columbia from 2007 to 2019, which yields 637 observations, to investigate the spillover effect from the smart meter adoption and the impacts of government policies on smart meter (AMI) adoption rate. Alaska and Hawaii are excluded as they do not border any other U.S. state. Compared to cross-sectional data or time-series data only, the panel data include more information and variation across time and so they could give more efficient estimates [64]. Moreover, with panel data it is easier to control for variables that are difficult to measure, such as cultural factors. To identify the spillover effects, we constructed two types of spatial weight matrices based on inverse distance and contiguity using the geographic data from the U.S. Census Bureau [65].

3.3.1. Explained Variable: SmartMeter Adoption Rate

Form EIA-861 (Annual Electric Power Industry Report) by the U.S. Energy Information Administration collected data from utilities across the country. In 2019, the Report included data from about 1700 utilities. The dataset contains the utilities’ information about their business and location. Data of advanced meters were first collected in 2007. They include the number of meters from AMR and AMI [30]. In this study, we aggregated the number of meters from AMI and the number of total customers at the state level based on utility location and generated the smart meter adoption rate as the ratio of the number of AMI meters to the number of total customers.

3.3.2. Explanatory Variables: ARRA SGIG and State Policy

To accelerate the modernization of the electric power grid, the Recovery Act appropriated about 3.4 billion to fund the 99 Smart Grid Investment Grant (SGIG) projects across the nation. In this paper, we collected the ARRA funding data from Smartgrid.gov maintained by DOE [19,66]. To obtain the annual ARRA award amount for each project, following Zhou and Matisoff [32], we divided the total project award amount by project time span based on the assumption that money was spent uniformly across the project timeline. Then we aggregated the ARRA federal funding at the state level and generated the ARRA SGIG federal funding per capita in each state.
We also considered state energy actions as an important factor in the smart meter adoption decisions. We used the summary of state smart metering policies between 2007 and 2012 collected by Zhou and Matisoff [32]. In addition, we added the state policies from 2010 to 2019 based on the AMI report from smartgrid.gov [26]. We measured the state government intervention using the total number of state actions in a year.

3.3.3. Control Variables

Smart meters can provide customers with information on their energy usage and enable them to take advantage of a more flexible rate. Well-educated customers are more likely to utilize this information to reduce their bills. Following the existing literature [32,34], this study selected educational attainment and energy intensity as control variables [67,68]. We expected the adoption rate to be higher in states with more college graduates. Thus, we expected the coefficient on the percentage of college-educated population to be positive. In addition, we collected data on the total energy consumption per dollar of real GDP measured as 1000 British Thermal Units (BTU) per chained 2012 dollar from the U.S. EIA [68].
We merged those variables with the state-level data (State Act, College Educated, and Energy Intensity) and constructed a strongly balanced panel of 48 contiguous U.S. states and the District of Columbia. The descriptive statistics of variables are given in Table 1.

4. Results

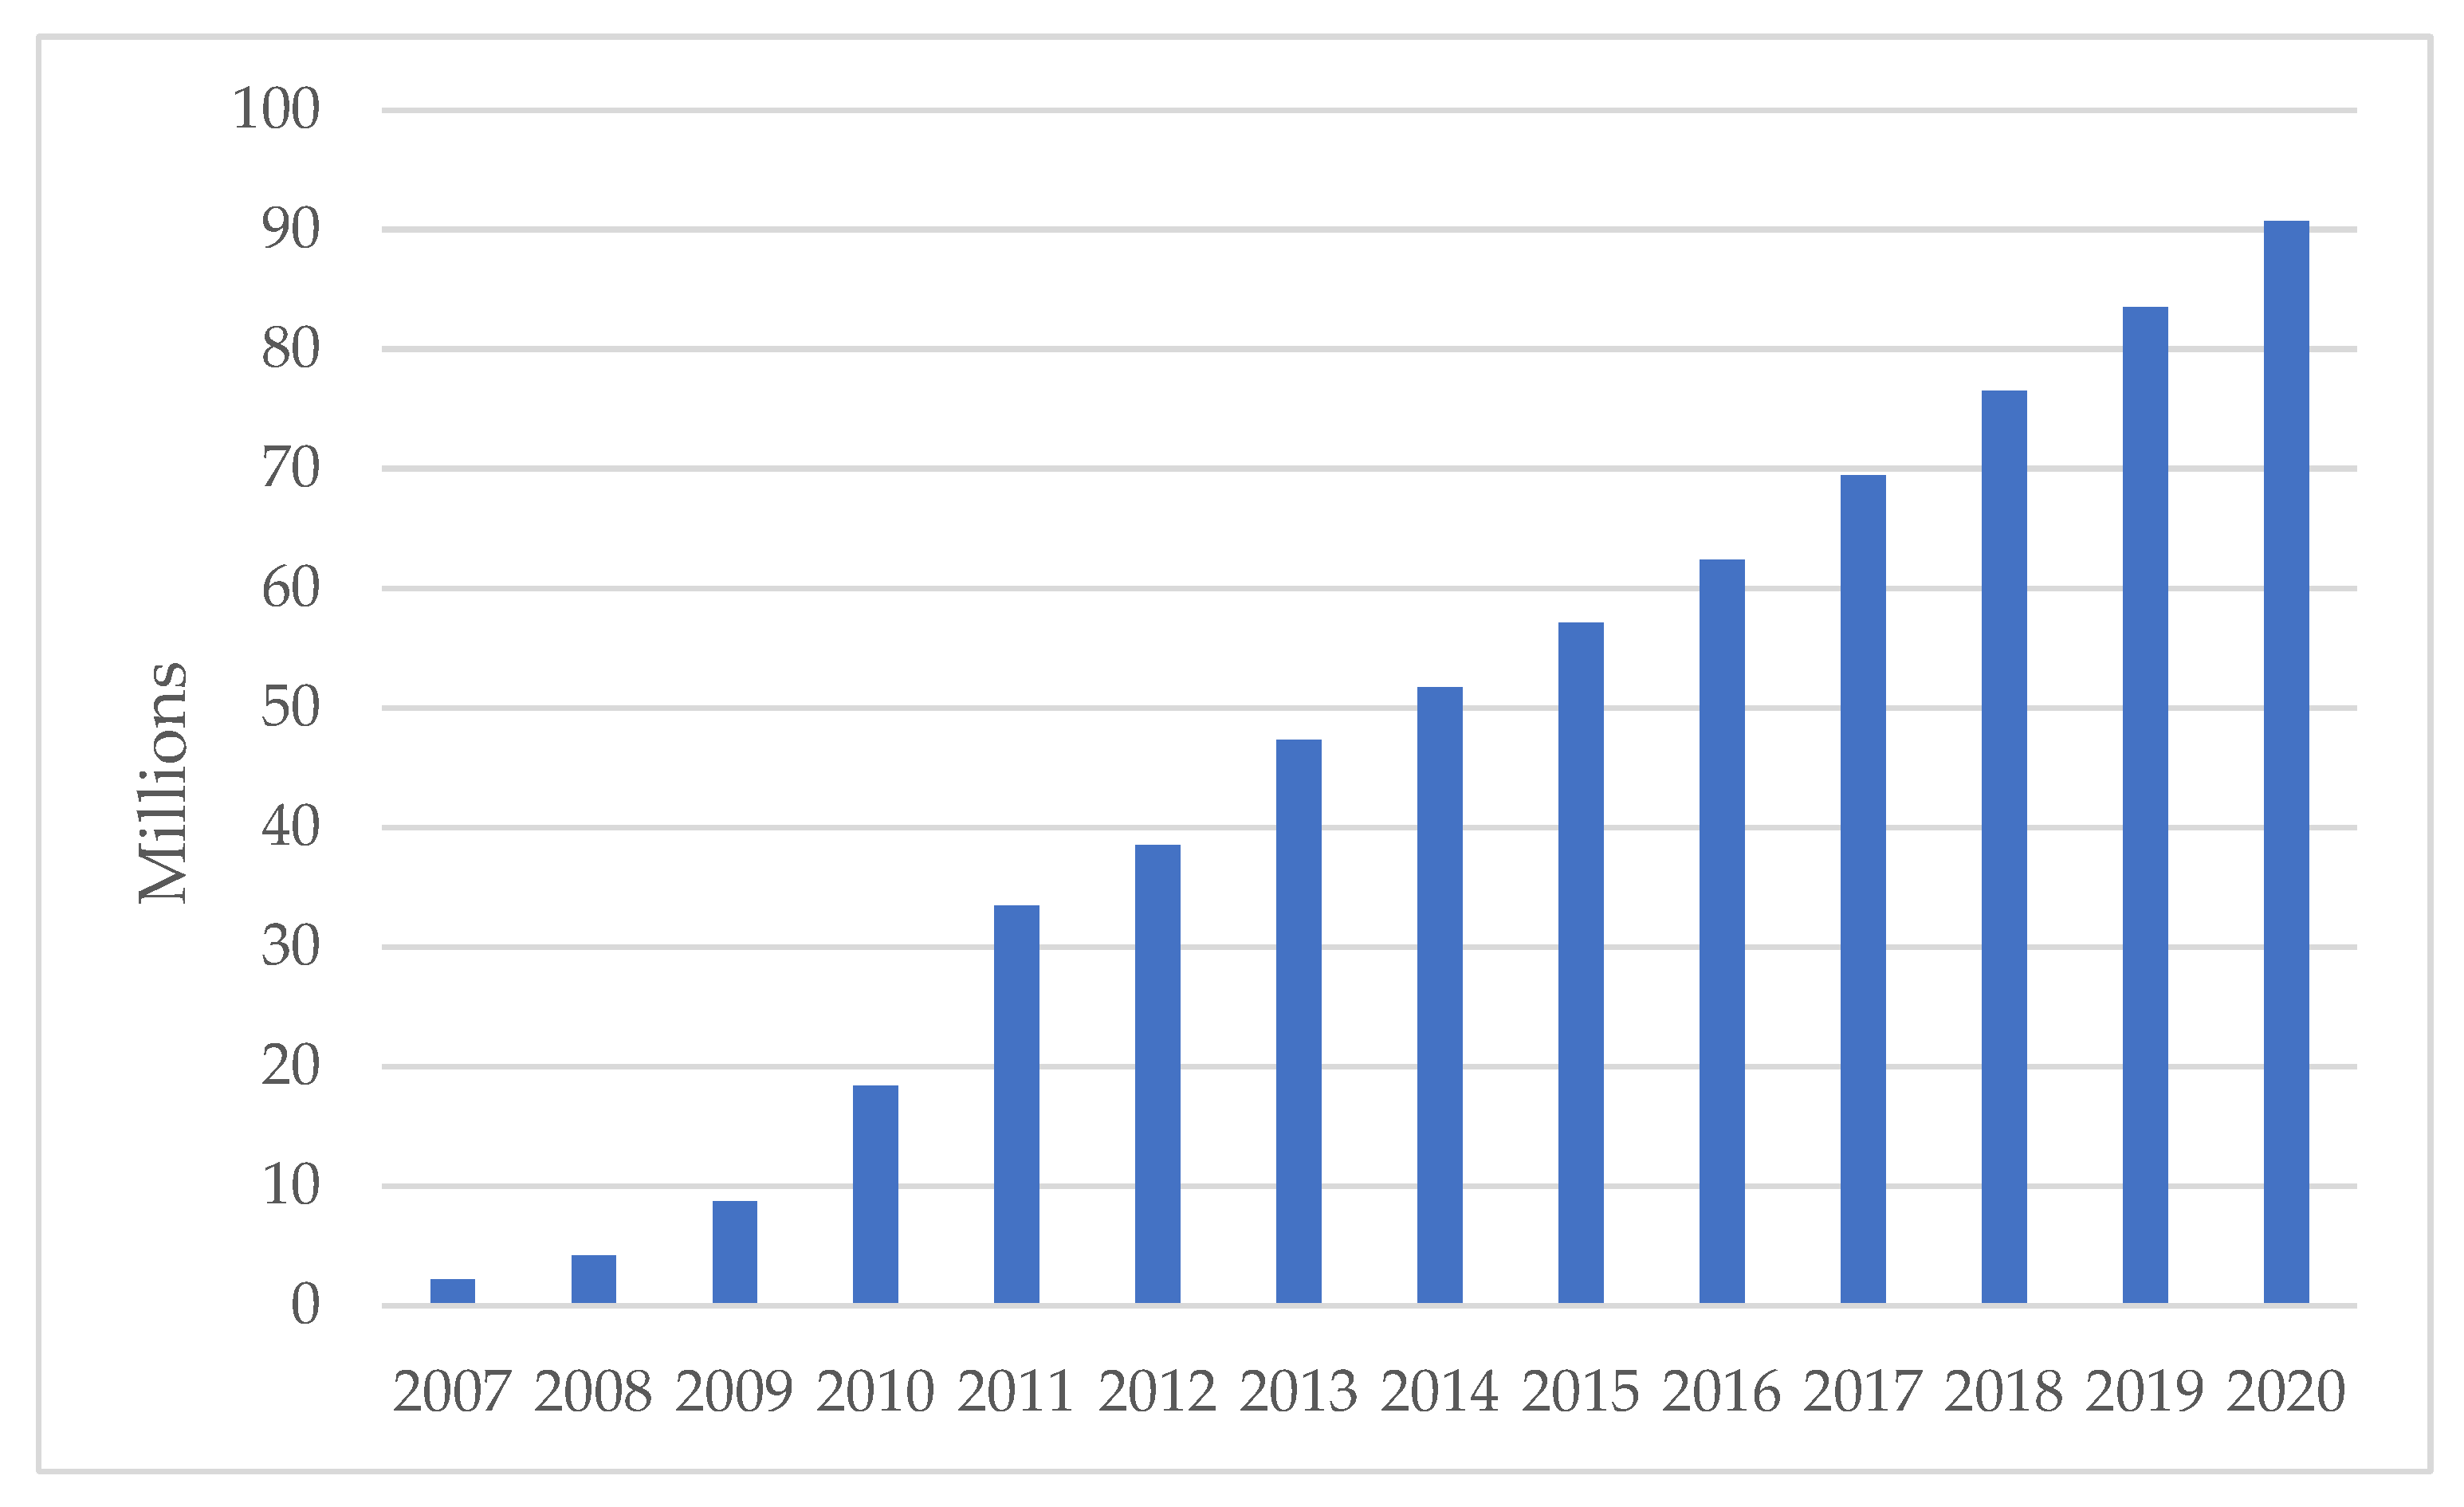
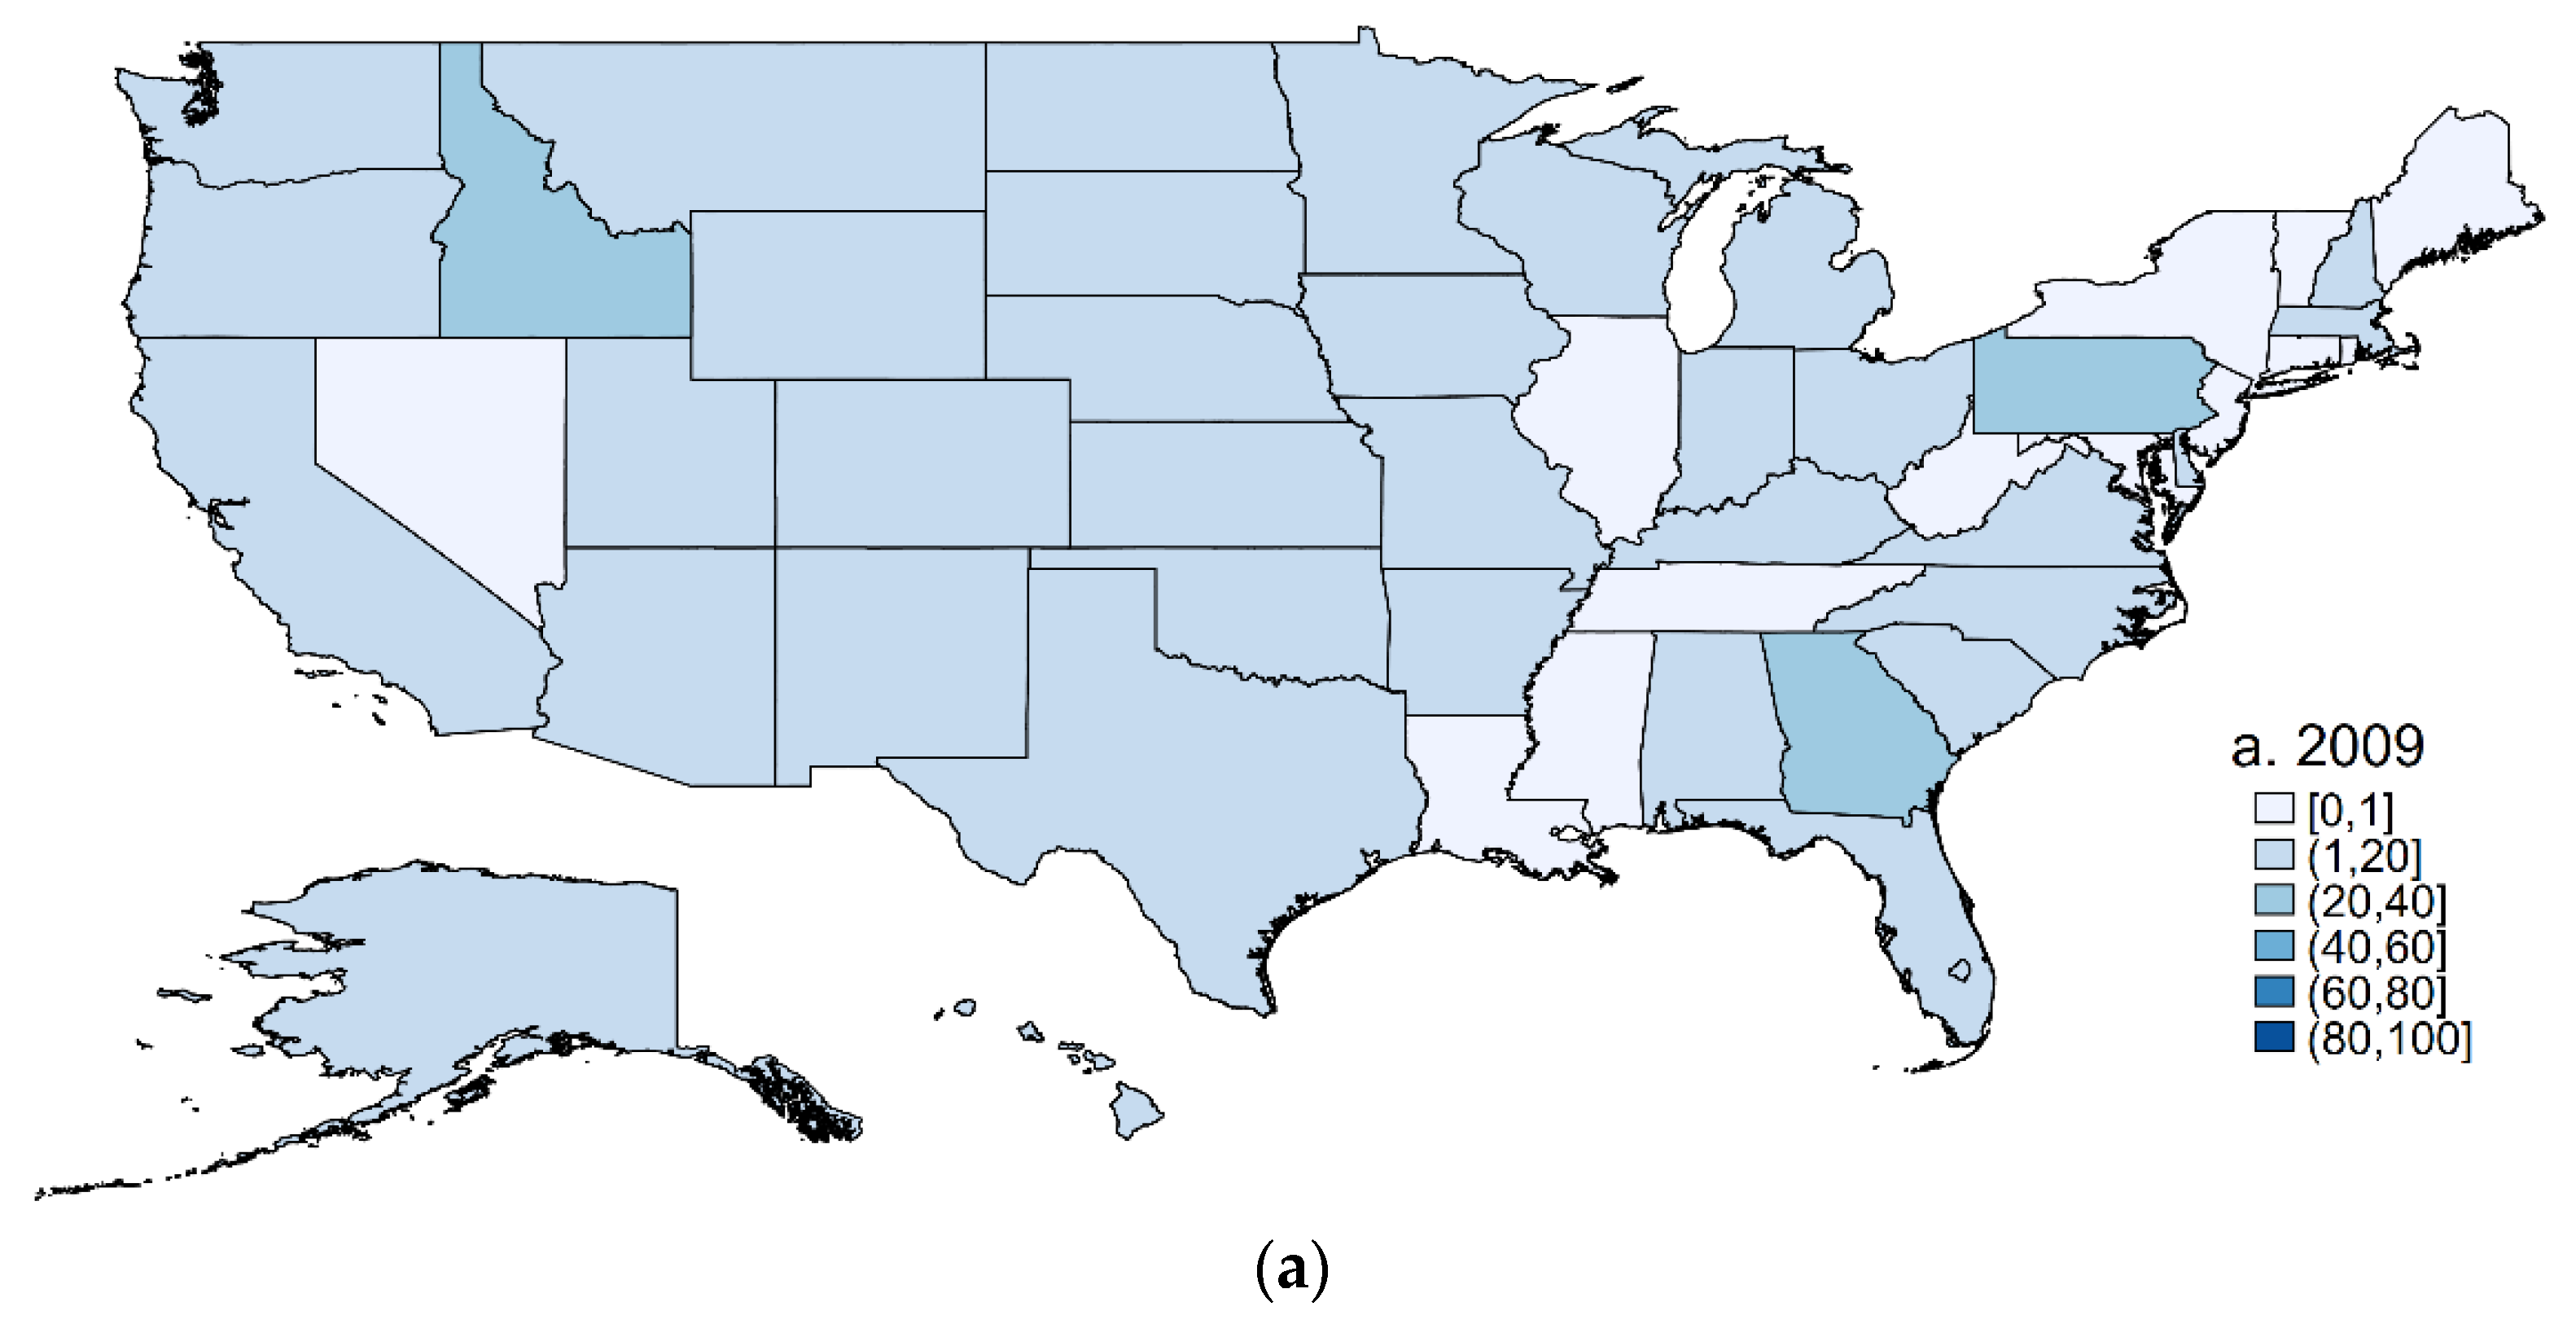
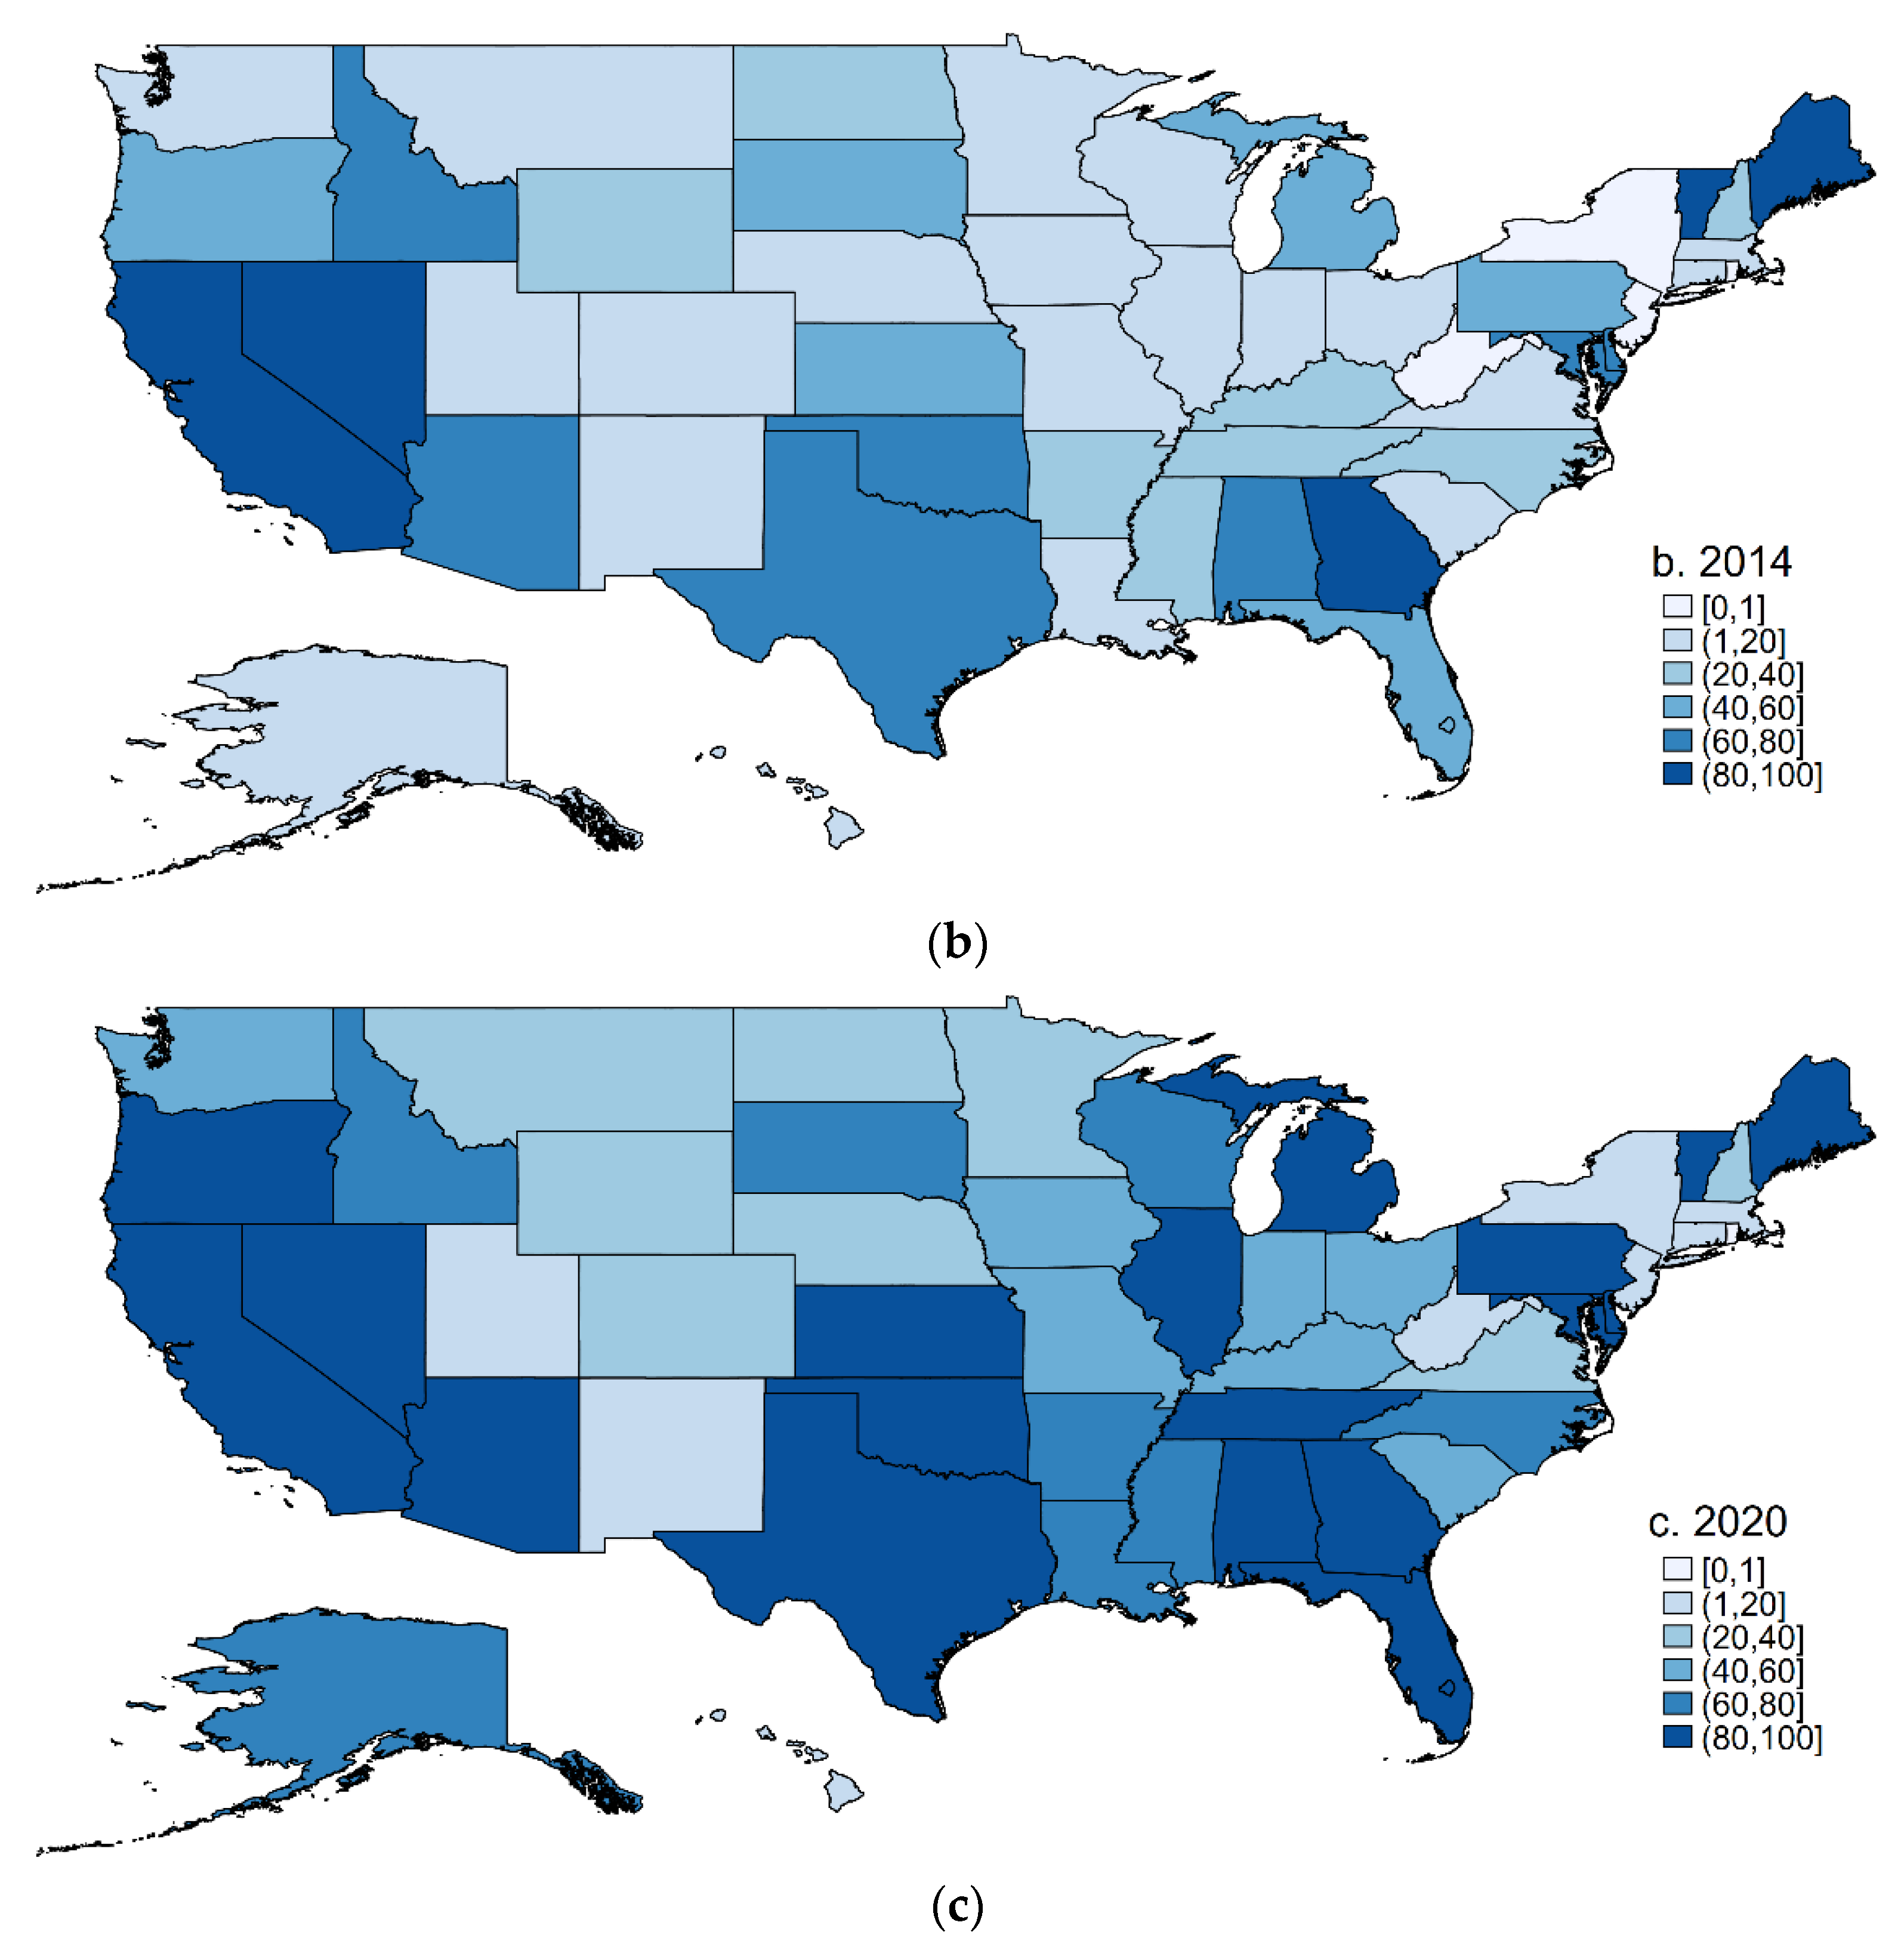
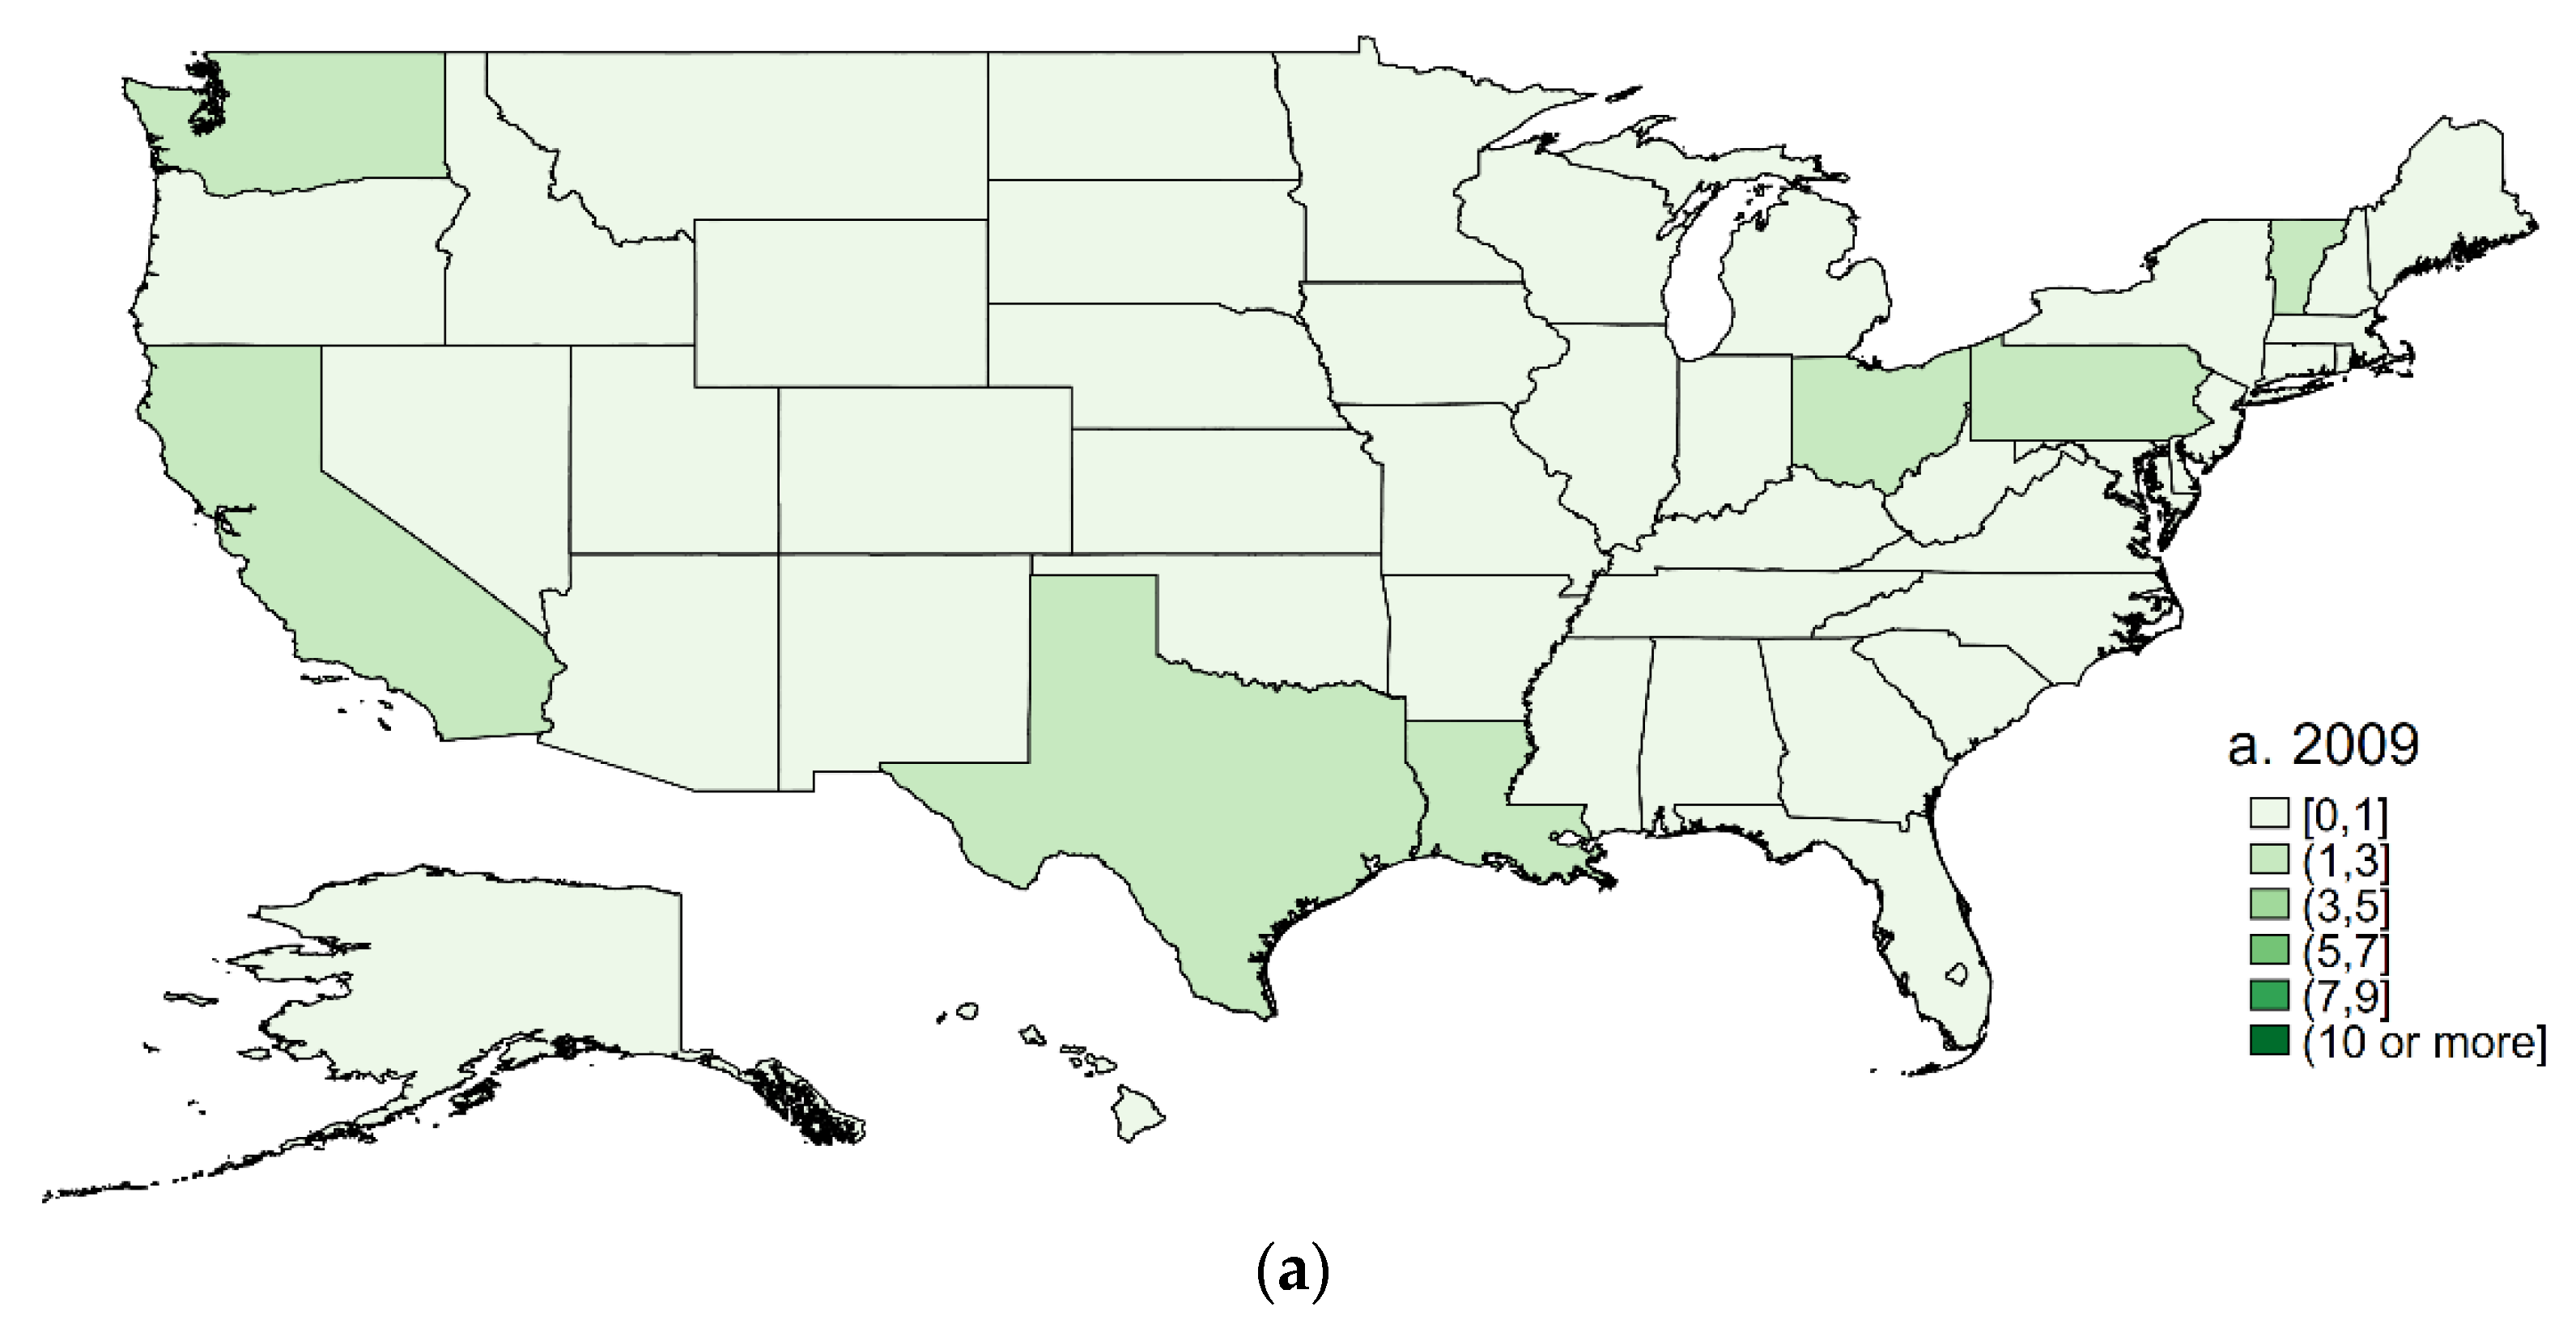
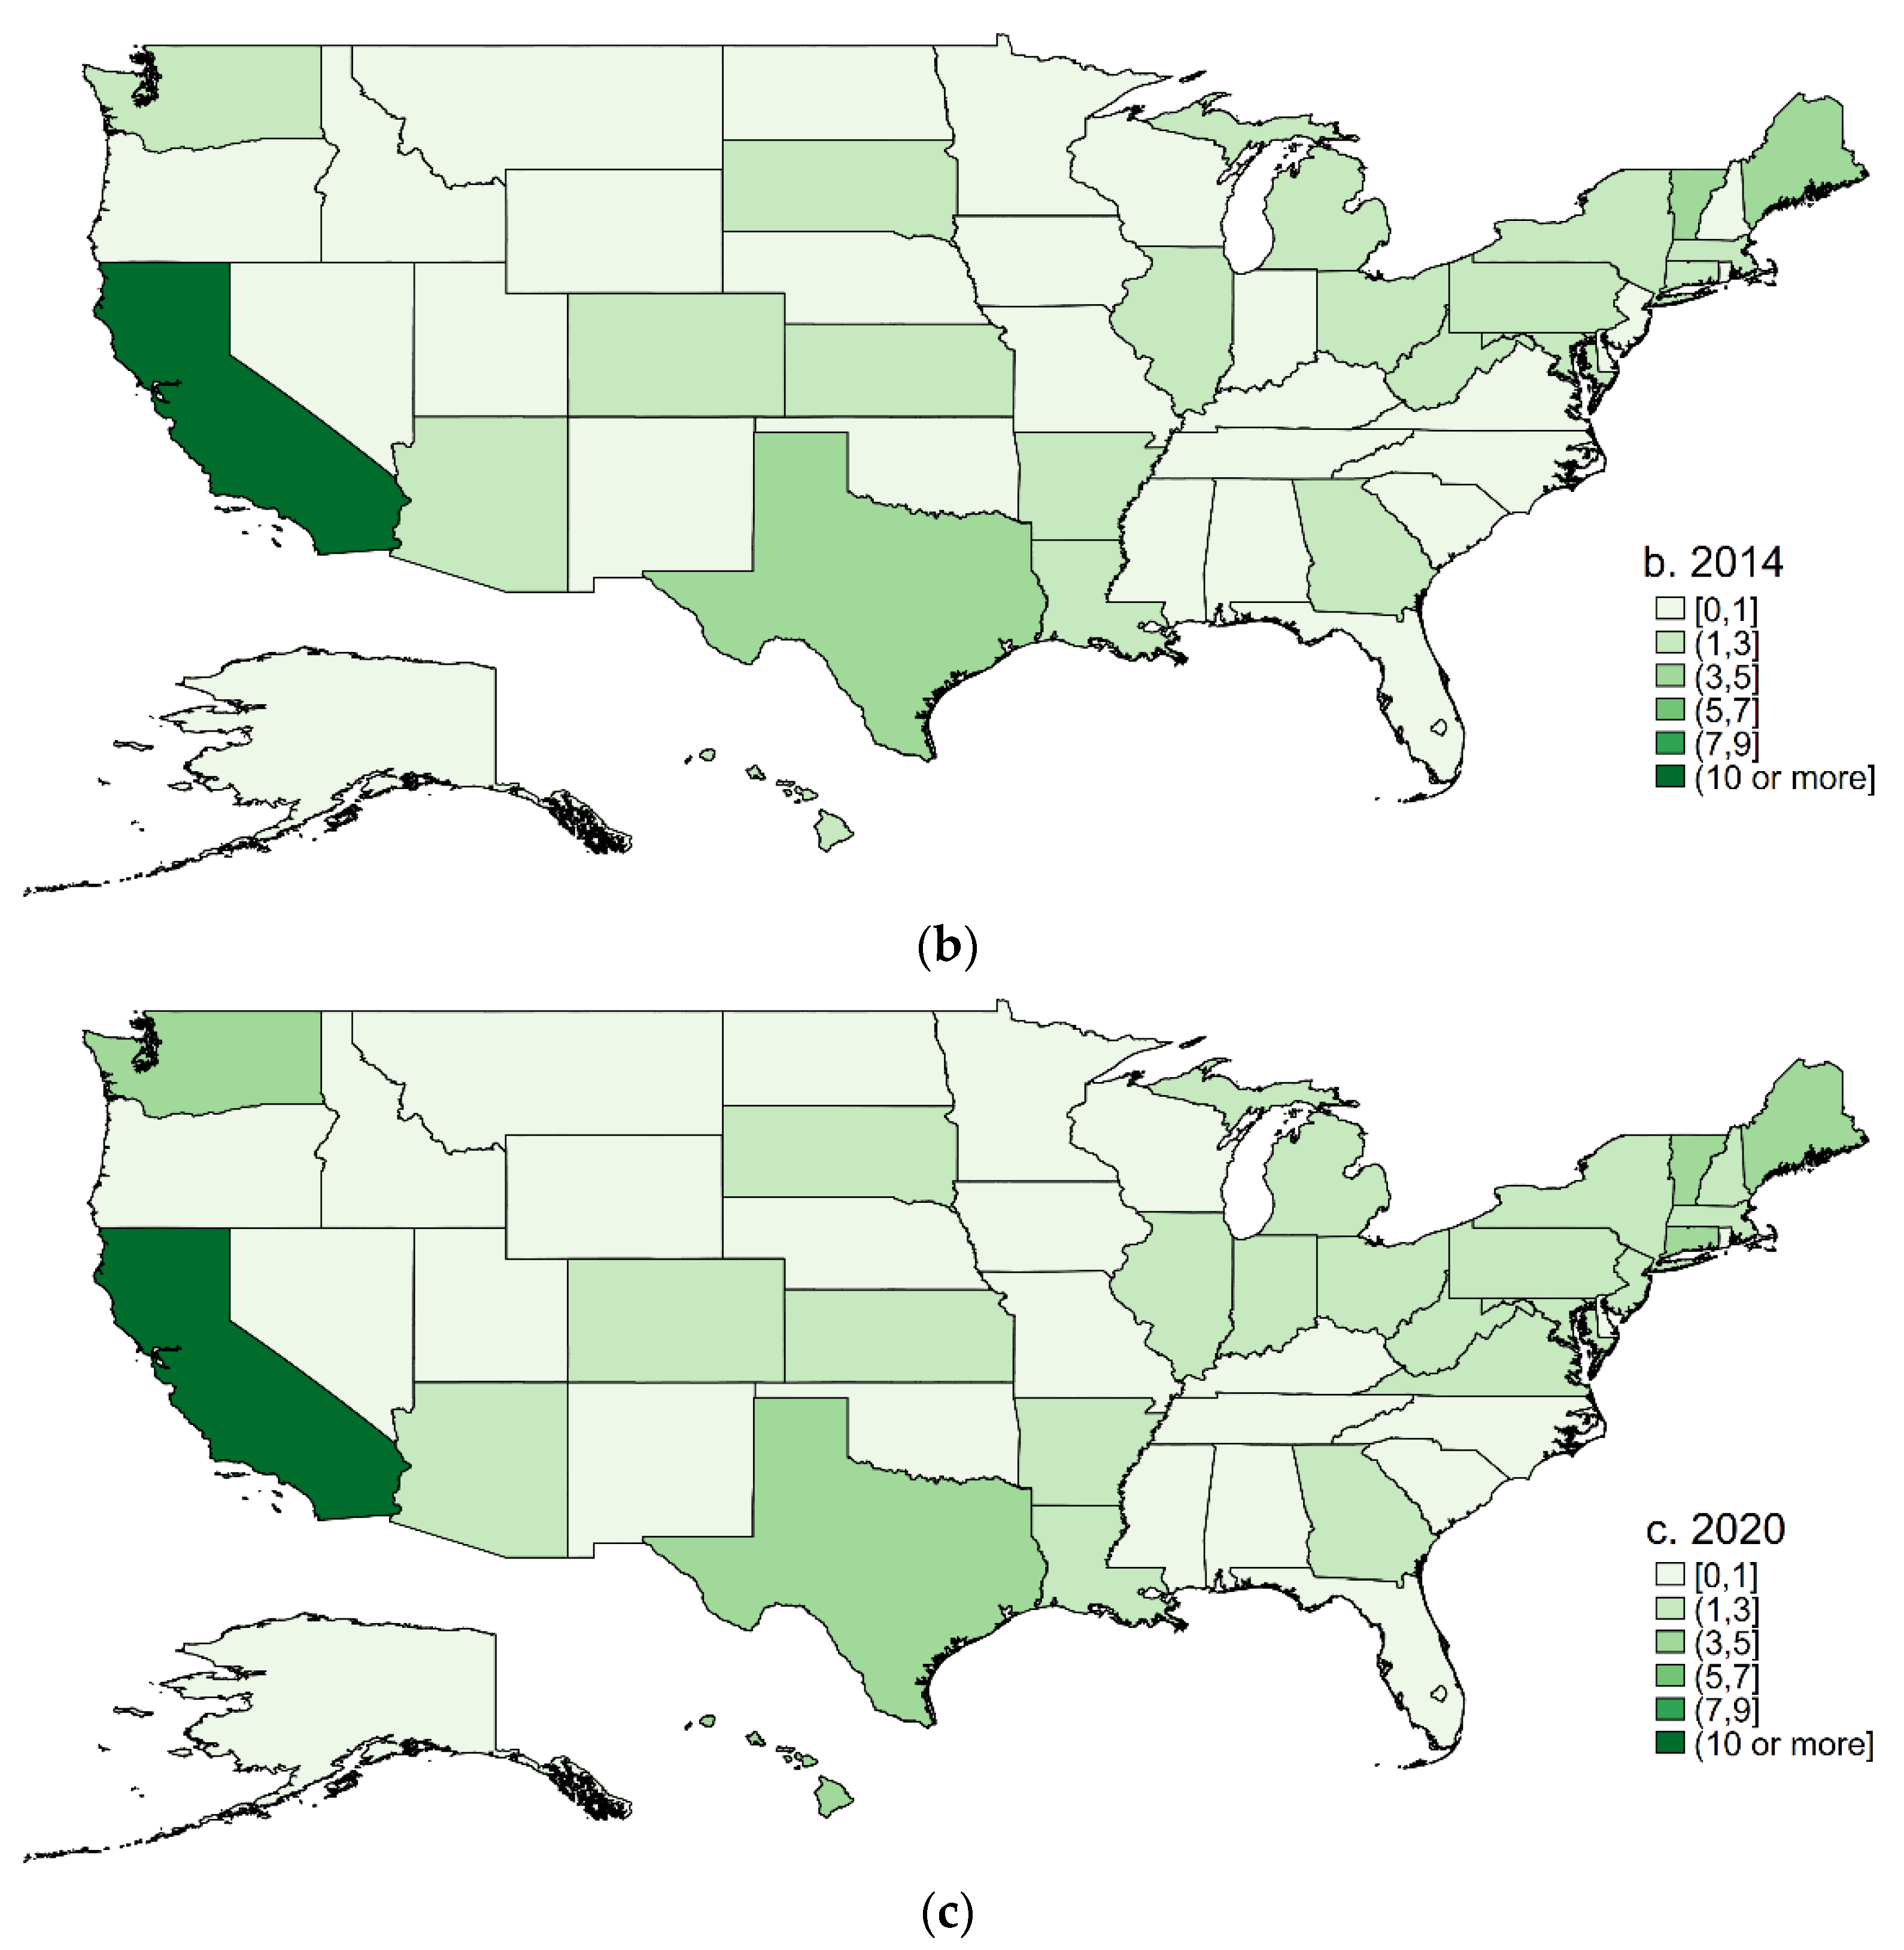
4.1. Spatial Pattern of the Smart Meter Adoption in the Unites States

We selected three cross-sections of time in 2009, 2014, and 2020, and displayed the smart meter adoption rates on maps with STATA 16. As illustrated in Figure 2a–c, the nation showed an overall increase over the 12 years. Maximum smart meter penetration by state was found in Washington, D.C., Pennsylvania, Nevada, Michigan, Kansas, and Maine, among others, in 2020. The low adoption rates were mainly clustered in the Rocky Mountain region and the Midwestern United States. Figure 3a–c depicts the state-level spatial patterns of the number of state policies in the United States as of 2009, 2014, and 2020. Similar to Figure 2a–c, the development is imbalanced across the country. There are more state actions in the west coast states, west south-central states, and New England.

4.2. Spatial Autocorrelation Analysis

We used cross-sectional data on the smart meter adoption rates from 2007 to 2019 to calculate the global Moran’s I to accurately understand the smart meter technology diffusion at the state level. Table 2 presents the results. The smart meter adoption rate has had a significant positive Moran’s I since 2010, except for the year 2012. According to EIA, the installations of smart meters has increased dramatically after 2010 [69]. Therefore, the distribution of the smart meter adoption demonstrated significant spatial autocorrelation after 2010. The adoption rates of smart meters are similar in adjacent states.

4.3. Spatial Panel Model Analysis

This section presents the estimation results of Equations (1)–(3). In Model (1) of Table 3, we run a fixed effects model without spatial factors. In Model (2) and Model (3), we conduct the fixed effects SAR and the fixed effects SEM using an inverse distance weight matrix. A contiguity weight matrix was used in Model (4) and Model (5). In the FE-SAR estimations (Model (2) and Model (4)), the estimated values of ρ are 0.257 and 0.141, respectively, and significant at the 1% level. It indicates that adjacent states have a significant positive spatial spillover effect on smart meter adoption rates; an increase of 1% in smart meter penetration rate in the surrounding states leads to an increase of approximately 0.2% in the penetration rate in the focal state. In the FE-SEM models, the λ value was positive and significant at the 1% level. This implies that smart meter adoption is affected not only by observable factors such as government interventions but also by unobservable factors in adjacent areas, such as energy consumers’ ideology and new technology acceptance.
First, we concentrate on the impact and magnitude of federal funding on smart meter adoption. The panel FE, FE-SAR, and FE-SEM models demonstrate that the coefficients of ARRA funding are all positive and pass the significance test with a 90% confidence level in Model (2) and Model (4). It indicates that federal funding is positively correlated with the diffusion of the smart meter and is an important incentive to promote its penetration. Second, with regard to state-level legislative actions, the cumulative number of policy efforts at the state level is significantly positive at 1%. One piece of additional legislative action concerning smart meter deployment at the state level increases the adoption rate by approximately 5%. Third, the educational attainment in the FE-SAR and FE-SEM models is significantly positive at the 1% level. A greater proportion of college-educated residents leads to greater adoption of the smart meter as human capital has positive effects on technological diffusion. Finally, the coefficients for energy intensity are negative and statistically significant at the 10% level in both FE-SAR and FE-SEM models.
Furthermore, we conducted two F-tests for each model to enhance the credibility of our model. The first F-test was to determine whether coefficients of ARRA funding and state actions are jointly statistically different from zero. As shown in Table 3, the p-values for the F-tests of the joint significance of ARRA funding and state actions were less than 0.05 in Model (1) and less than 0.01 in other models. This suggests that our regression models fit the data better than the models without those two independent variables. Second, we also performed the overall regression F-statistic tests that determine whether all the slope coefficients are zero. The tests yielded p-values that were less than 0.01 in all five models. The results indicate that the regression models provide better fits to the data than a model that contains the intercept only. Thus, as expected, smart meter adoption is fairly strongly related to ARRA funding and state actions.

5. Discussion and Policy Implications

The findings of the study are as follows. First, the distribution of smart meter adoption presents significant spatial autocorrelation after 2010. A higher penetration rate of the smart meter in the focal state is associated with higher smart meter diffusion rates in the neighboring states. It is affected not only by observable factors but also unobservable factors in the surrounding states. Second, government interventions have positive associations with smart meter adoption. The ARRA funding is positively correlated with smart meter adoptions, particularly at the federal level. In addition, state legislative actions have a significant and positive impact on smart meter adoptions. The possible reasons for this are (1) some states mandate that regulators approve utilities’ cost recovery frameworks for metering projects, which sets motivation for smart meter adoption in those states [33]; (2) the related data security and privacy legislation that was enacted by states reduce the policy uncertainty for the electric power sector and ensure the protection of energy consumer’s data. In addition, the role of higher education can effectively promote the diffusion of smart meters, which is consistent with Akhvlediani and Cieślik [70] using European evidence. Energy intensity has a negative association with the adoption due to the competition between different clean energy technologies. Utility companies may have distributed their resources to different clean energy technology such as solar photovoltaic technology, and/or may have traded their smart meter deployment with renewable energy investments when the energy consumption grows [71]. Finally, the above conclusions are still valid in the tests using the contiguity weight matrix.
Our results are consistent with the existing literature in sustainable technology adoption. More importantly, this study extends the existing literature in a number of ways. First, the way that we constructed the data has a few innovations. We integrated datasets from various sources including U.S. EIA, smartgrid.gov, U.S. Census Bureau, etc. We collected and coded state policies using the number of existing legislative actions in a given year, and we made it possible to conduct spatial analysis. Secondly, in terms of results, we added a state dimension to the existing literature, especially with regard to the state policy and spillover effect. This is the first study, to our knowledge, that explored spatial spillover on smart meter penetration.
These findings have several policy implications. At the federal level, major policies promoting smart meters adoption have been absent since the Recovery Act of 2009. As President Biden presented the USD 2 trillion plan to improve the nation’s infrastructure and clean energy technologies, this study provides evidence for government investment in smart meters and smart grids around the nation to build a more resilient and sustainable economy. Second, the role of the state and local governments is just as important. State and local policymakers and regulatory agencies, working with utility companies, are instrumental in establishing a framework for cost recovery mechanisms for smart meter investment. In addition, smart-grid adoption can also benefit from actions taken by the states and electric utilities to protect the privacy and security of consumers’ data and clarify the disclosure rules.
Although this study bridges some of the research gaps on the impacts of government interventions on smart meter adoption and provides an empirical reference for the spillover effects of clean energy diffusion, there are a few limitations. First, this analysis is conducted at the state level and the sample size is limited. In the future, it can be performed at a more micro level, such as at the utility level. Second, the diffusion of smart meters varies across sectors (residential, commercial, industrial, and transportation) and each sector has its unique characteristics. This should be further explored by future studies. Third, it will be very productive to examine the impacts of smart meter adoptions, especially with regard to environmental concerns such as energy efficiency and carbon reductions. Researchers should look closely at the evidence for energy savings and carbon reductions. This focus will extend our understanding of the relationships between government policies, grid modernization, and ultimately, sustainable development in the energy sector.

6. Conclusions

In summary, this study constructs unique spatial panel data at the state level to investigate the spatial patterns of smart meter adoption in the U.S and the impacts of federal and state policies. We calculated the adoption rate of the smart meter in each state from 2007 to 2019, and tested the spatial spillover effects of smart meter adoption using the global spatial correlation. Additionally, fixed effects regression, SAR, and SEM models were employed to examine the impacts of federal and state government interventions on smart meter adoption. We found positive associations between government policies and adoption and identified significant positive spillover effects among U.S. states. These results extend the existing literature on smart meter adoption by highlighting the importance of the regional effect of smart meter adoption and the impacts of the multi-layered government policies. Discussions of these findings provide important implications for the formulation and implementation of public policies for the modernization of the U.S. electric grid. These findings provide empirical evidence that supports the government actions for clean energy technologies adoption, which includes the initiatives of the federal government in seeding the investment and establishing incentive programs, and the active roles of the states in establishing policy frameworks for cost recovery and security and privacy protections.

Author Contributions

Conceptualization, Y.G., C.F. and J.Z.; methodology, C.F. and Y.G.; software, Y.G.; validation, C.F.; formal analysis, Y.G.; investigation, Y.G.; resources, Y.G.; data curation, Y.G.; writing—original draft preparation, Y.G., C.F. and J.Z.; writing—review and editing, J.Z. and Y.G.; visualization, Y.G.; supervision, J.Z.; project administration, Y.G. All authors have read and agreed to the published version of the manuscript.

Funding

This research was partially supported by the funding from School of Management at Clark University.

Institutional Review Board Statement

Not applicable.

Informed Consent Statement

Not applicable.

Data Availability Statement

Not applicable.

Conflicts of Interest

The authors declare no conflict of interest.

References

  1. Hu, Z.; Li, C.; Cao, Y.; Fang, B.; He, L.; Zhang, M. How smart grid contributes to energy sustainability. Energy Procedia 2014, 61, 858–861. [Google Scholar] [CrossRef] [Green Version]
  2. Hledik, R. How green is the smart grid? Electr. J. 2009, 22, 29–41. [Google Scholar] [CrossRef]
  3. Mohsenian-Rad, A.-H.; Wong, V.W.; Jatskevich, J.; Schober, R.; Leon-Garcia, A. Autonomous demand-side management based on game-theoretic energy consumption scheduling for the future smart grid. IEEE Trans. Smart Grid 2010, 1, 320–331. [Google Scholar] [CrossRef] [Green Version]
  4. Clastres, C. Smart grids: Another step towards competition, energy security and climate change objectives. Energy Policy 2011, 39, 5399–5408. [Google Scholar] [CrossRef] [Green Version]
  5. Olmos, L.; Ruester, S.; Liong, S.-J.; Glachant, J.-M. Energy efficiency actions related to the rollout of smart meters for small consumers, application to the Austrian system. Energy 2011, 36, 4396–4409. [Google Scholar] [CrossRef] [Green Version]
  6. Corbett, J.M. A Socio-Technical Investigation of the Smart Grid: Implications for Demand-Side Activities of Electricity Service Providers; Queen’s University: Kingston, ON, Canada, 2013. [Google Scholar]
  7. Power Technology, EU States Approve $1.17bn Investment in Energy Infrastructure. Available online: https://www.power-technology.com/news/european-union-eu-approves-energy-infrastructure-investment-connecting-europe-facility/ (accessed on 20 December 2021).
  8. China Smart Grid Network Market-Growth, Trends, and Forecasts (2020–2025). 2020. Available online: Reportlinker.com (accessed on 19 November 2021).
  9. EIA (U.S. Energy Information Administration). U.S. Energy-Related Carbon Dioxide Emissions; EIA: Washington, DC, USA, 2020. [Google Scholar]
  10. DOE (U.S. Department of Energy). Advanced Metering Infrastructure and Customer Systems; 2016. Available online: https://www.energy.gov/sites/prod/files/2016/12/f34/AMI%20Summary%20Report_09-26-16.pdf (accessed on 24 November 2021).
  11. Hussain, M.M.; Akram, R.; Memon, Z.A.; Nazir, M.H.; Javed, W.; Siddique, M. Demand Side Management Techniques for Home Energy Management Systems for Smart Cities. Sustainability 2021, 13, 11740. [Google Scholar] [CrossRef]
  12. Mansouri, M.R.; Simab, M.; Bahmani Firouzi, B. Impact of Demand Response on Reliability Enhancement in Distribution Networks. Sustainability 2021, 13, 13201. [Google Scholar] [CrossRef]
  13. California Public Utilities Commission. The Benefits of Smart Meters. Available online: https://www.cpuc.ca.gov/industries-and-topics/electrical-energy/infrastructure/the-benefits-of-smart-meters (accessed on 20 November 2021).
  14. Cortés-Cediel, M.E.; Cantador, I.; Bolívar, M.P.R. Analyzing citizen participation and engagement in european smart cities. Soc. Sci. Comput. Rev. 2021, 39, 592–626. [Google Scholar] [CrossRef]
  15. Bolívar, M.P.R.; Muñoz, C.A.; Muñoz, L.A. Identifying Strategic Planning Patterns of Smart Initiatives. An Empirical Research in Spanish Smart Cities. In Proceedings of the International Conference on Electronic Government. Granada, Spain, 7–9 September 2020; pp. 374–386. [Google Scholar]
  16. Gil-Garcia, J.R.; Zhang, J.; Puron-Cid, G. Conceptualizing smartness in government: An integrative and multi-dimensional view. Gov. Inf. Q. 2016, 33, 524–534. [Google Scholar] [CrossRef]
  17. National Conference of State Legislatures. Modernizing the Electric Grid: State Role and Policy Options. 2019. Available online: https://www.ncsl.org/Portals/1/Documents/energy/Modernizing-the-Electri-Grid_112519_34226.pdf (accessed on 10 November 2021).
  18. Zhang, J.; Luna-Reyes, L.F.; Pardo, T.A. Information, policy, and sustainability: The role of information technology in the age of big data and open government. In Information, Models, and Sustainability; Springer: Berlin/Heidelberg, Germany, 2016; pp. 1–19. [Google Scholar]
  19. DOE (U.S. Department of Energy). Recovery Act: Smart Grid Investment Grant Program. Available online: https://www.energy.gov/oe/recovery-act-smart-grid-investment-grant-sgig-program (accessed on 1 November 2021).
  20. EIA (U.S. Energy Information Administration). How Many Smart Meters Are Installed in the United States, and Who Has Them? Available online: https://www.eia.gov/tools/faqs/faq.php?id=108&t=1 (accessed on 3 January 2022).
  21. Cooper, A.; Shuster, M. Electric Company Smart Meter Deployments: Foundation for a Smart Grid (2021 Update); Institue for Electric Innovation: Washington, DC, USA, 2021. [Google Scholar]
  22. EIA (U.S. Energy Information Administration). Annual Electric Power Industry Report, Form EIA-861 Detailed Data Files; EIA: Washington, DC, USA, 2007–2019. [Google Scholar]
  23. EIA (U.S. Energy Information Administration). Investor-Owned Utilities Served 72% of U.S. Electricity Customers in 2017. Available online: https://www.eia.gov/todayinenergy/detail.php?id=40913 (accessed on 20 December 2021).
  24. Energy Policies of IEA Countries: United States 2007; Energy Policy Review; The International Energy Agency (IEA): Paris, France, 2008.
  25. What FERC Does. Available online: https://www.ferc.gov/about/what-ferc/what-ferc-does (accessed on 20 December 2021).
  26. E9 Insight and Plugged in Strategies. AMI In Review; DOE: Washington, DC, USA, 2020. Available online: https://www.smartgrid.gov/files/documents/AMI_Report_7_8_20_final_compressed.pdf (accessed on 24 November 2021).
  27. Structure Consulting Group, LLC. PG&E Advanced Metering Assessment Report. 2010. Available online: https://www.pge.com/includes/docs/pdfs/myhome/customerservice/meter/smartmeter/StructureReport.pdf (accessed on 26 November 2021).
  28. Shea, D.; Bell, K. Smart Meter Opt-Out Policies. Available online: https://www.ncsl.org/research/energy/smart-meter-opt-out-policies.aspx (accessed on 20 December 2021).
  29. SAIC. Smart Grid Legislative and Regulatory Proceedings; EIA: Washington, DC, USA, 2011. [Google Scholar]
  30. EIA (U.S. Energy Information Administration). Electric Power Sales, Revenue, and Energy Efficiency: Form EIA-861 Detailed Data Files; EIA: Washington, DC, USA, 2019. [Google Scholar]
  31. Gao, Y.; Zhang, J. Studying the Impacts of Federal Funding on Residential Smart Meter Adoption and Utilities’ Performance in the US: A Simultaneous Equation Approach. In Proceedings of the DG. O2021: The 22nd Annual International Conference on Digital Government Research, Omaha, NE, USA, 9–11 June 2021; pp. 416–423. [Google Scholar]
  32. Zhou, S.; Matisoff, D.C. Advanced metering infrastructure deployment in the United States: The impact of polycentric governance and contextual changes. Rev. Policy Res. 2016, 33, 646–665. [Google Scholar] [CrossRef]
  33. EIA (U.S. Energy Information Administration). Nearly Half of All U.S. Electricity Customers Have Smart Meters. Available online: https://www.eia.gov/todayinenergy/detail.php?id=34012 (accessed on 1 December 2021).
  34. Strong, D.R. Impacts of diffusion policy: Determinants of early smart meter diffusion in the US electric power industry. Ind. Corp. Change 2019, 28, 1343–1363. [Google Scholar] [CrossRef]
  35. Keller, W. Geographic localization of international technology diffusion. Am. Econ. Rev. 2002, 92, 120–142. [Google Scholar] [CrossRef] [Green Version]
  36. Peres, R.; Muller, E.; Mahajan, V. Innovation diffusion and new product growth models: A critical review and research directions. Int. J. Res. Mark. 2010, 27, 91–106. [Google Scholar] [CrossRef]
  37. Liu, C.; Guo, Q. Technology spillover effect in China: The spatiotemporal evolution and its drivers. Sustainability 2019, 11, 1694. [Google Scholar] [CrossRef] [Green Version]
  38. Dharshing, S. Household dynamics of technology adoption: A spatial econometric analysis of residential solar photovoltaic (PV) systems in Germany. Energy Res. Soc. Sci. 2017, 23, 113–124. [Google Scholar] [CrossRef]
  39. Jaffe, A.B.; Newell, R.G.; Stavins, R.N. A tale of two market failures: Technology and environmental policy. Ecol. Econ. 2005, 54, 164–174. [Google Scholar] [CrossRef] [Green Version]
  40. Zhou, S.; Brown, M.A. Smart meter deployment in Europe: A comparative case study on the impacts of national policy schemes. J. Clean. Prod. 2017, 144, 22–32. [Google Scholar] [CrossRef]
  41. Jaffe, A.B.; Stavins, R.N. The energy paradox and the diffusion of conservation technology. Resour. Energy Econ. 1994, 16, 91–122. [Google Scholar] [CrossRef]
  42. Yeh, S. An empirical analysis on the adoption of alternative fuel vehicles: The case of natural gas vehicles. Energy Policy 2007, 35, 5865–5875. [Google Scholar] [CrossRef] [Green Version]
  43. Jaffe, A.B.; Stavins, R.N. Dynamic incentives of environmental regulations: The effects of alternative policy instruments on technology diffusion. J. Environ. Econ. Manag. 1995, 29, S43–S63. [Google Scholar] [CrossRef]
  44. Veugelers, R. Which policy instruments to induce clean innovating? Res. Policy 2012, 41, 1770–1778. [Google Scholar] [CrossRef]
  45. Stoneman, P.; Diederen, P. Technology diffusion and public policy. Econ. J. 1994, 104, 918–930. [Google Scholar] [CrossRef]
  46. Goulder, L.H.; Parry, I.W. Instrument choice in environmental policy. Rev. Environ. Econ. Policy 2020. [Google Scholar]
  47. Chang, H.J.; Andreoni, A. Industrial policy in the 21st century. Dev. Change 2020, 51, 324–351. [Google Scholar] [CrossRef]
  48. Scharpf, F.W. Community and autonomy: Multi-level policy-making in the European Union. J. Eur. Public Policy 1994, 1, 219–242. [Google Scholar] [CrossRef]
  49. Stoneman, P.; Battisti, G. The role of regulation, fiscal incentives and changes in tastes in the diffusion of unleaded petrol. Oxf. Econ. Pap. 2000, 52, 326–356. [Google Scholar] [CrossRef]
  50. Acemoglu, D.; Finkelstein, A. Input and technology choices in regulated industries: Evidence from the health care sector. J. Polit. Econ. 2008, 116, 837–880. [Google Scholar] [CrossRef] [Green Version]
  51. Gruber, H.; Koutroumpis, P. Competition enhancing regulation and diffusion of innovation: The case of broadband networks. J. Regul. Econ. 2013, 43, 168–195. [Google Scholar] [CrossRef]
  52. Kallman, M.E.; Frickel, S. Nested logics and smart meter adoption: Institutional processes and organizational change in the diffusion of smart meters in the United States. Energy Res. Soc. Sci. 2019, 57, 101249. [Google Scholar] [CrossRef]
  53. Snape, J.R. Spatial and temporal characteristics of PV adoption in the UK and their implications for the smart grid. Energies 2016, 9, 210. [Google Scholar] [CrossRef] [Green Version]
  54. Noonan, D.S.; Hsieh, L.-H.C.; Matisoff, D. Spatial effects in energy-efficient residential HVAC technology adoption. Environ. Behav. 2013, 45, 476–503. [Google Scholar] [CrossRef] [Green Version]
  55. Läpple, D.; Holloway, G.; Lacombe, D.J.; O’Donoghue, C. Sustainable technology adoption: A spatial analysis of the Irish Dairy Sector. Eur. Rev. Agric. Econ. 2017, 44, 810–835. [Google Scholar] [CrossRef]
  56. Ward, P.S.; Pede, V.O. Capturing social network effects in technology adoption: The spatial diffusion of hybrid rice in Bangladesh. Aust. J. Agric. Resour. Econ. 2015, 59, 225–241. [Google Scholar] [CrossRef]
  57. Sarmiento, C.; Wilson, W.W. Spatial modeling in technology adoption decisions: The case of shuttle train elevators. Am. J. Agric. Econ. 2005, 87, 1034–1045. [Google Scholar] [CrossRef]
  58. Liu, X.; Wright, M.; Filatotchev, I.; Dai, O.; Lu, J. Human mobility and international knowledge spillovers: Evidence from high-tech small and medium enterprises in an emerging market. Strateg. Entrep. J. 2010, 4, 340–355. [Google Scholar] [CrossRef] [Green Version]
  59. Baginski, J.P. Spatio-temporal diffusion of solar thermal systems in Germany: A spatial panel data analysis. HEMF Working Paper. 2019. Available online: https://doi.org/10.2139/ssrn.3365475 (accessed on 22 April 2019).
  60. Capello, R. Spatial spillovers and regional growth: A cognitive approach. Eur. Plan. Stud. 2009, 17, 639–658. [Google Scholar] [CrossRef]
  61. Comin, D.A.; Dmitriev, M.; Rossi-Hansberg, E. The Spatial Diffusion of Technology; National Bureau of Economic Research: Cambridge, MA, USA, 2012. [Google Scholar]
  62. Kumar, G.; Engle, C.; Tucker, C. Factors driving aquaculture technology adoption. J. World Aquac. Soc. 2018, 49, 447–476. [Google Scholar] [CrossRef]
  63. Wooldridge, J.M. Econometric Analysis of Cross Section and Panel Data; MIT Press: Cambridge, MA, USA, 2010. [Google Scholar]
  64. Elhorst, J.P. Specification and estimation of spatial panel data models. Int. Reg. Sci. Rev. 2003, 26, 244–268. [Google Scholar] [CrossRef]
  65. U.S. Census. TIGER/Line Shapefiles (Machinereadable Data Files); U.S. Census: Washington, DC, USA, 2019. [Google Scholar]
  66. DOE (U.S. Department of Energy). Smart Grid Website Data Summary 2015. Available online: https://www.smartgrid.gov/files/documents/smartgridwebsitedatasummary20150501.xlsx (accessed on 26 November 2021).
  67. U.S. Census. Educational Attainment in the United States; U.S. Census: Washington, DC, USA, 2007–2019. [Google Scholar]
  68. EIA (U.S. Energy Information Administration). U.S. State Energy Data System (SEDS); EIA: Washington, DC, USA, 2019. [Google Scholar]
  69. EIA (U.S. Energy Information Administration). U.S. State Policies Drive Growth in Smart Meter Use. Available online: https://www.eia.gov/electricity/monthly/update/archive/december2011/ (accessed on 1 December 2021).
  70. Akhvlediani, T.; Cieślik, A. Human capital, technological progress and technology diffusion across Europe: Education matters. Empirica 2020, 47, 475–493. [Google Scholar] [CrossRef]
  71. Smith, A.; Stirling, A.; Berkhout, F. The governance of sustainable socio-technical transitions. Res. Policy 2005, 34, 1491–1510. [Google Scholar] [CrossRef]
Figure 1. Smart meter count in the U.S. residential sector, 2007–2020.
Sustainability 14 01126 g001
Figure 2. Spatial pattern of the United States’ residential smart meter adoption rate (ac) in 2009, 2014, and 2020. Note: this figure is based on data from EIA [22].
Sustainability 14 01126 g002aSustainability 14 01126 g002b
Figure 3. Spatial pattern of the total number of state legislative actions (ac) in 2009, 2014, and 2020. Note: this figure is based on data from [26,32].
Sustainability 14 01126 g003aSustainability 14 01126 g003b
Table 1. Data description.
VariableMeanS.D.DefinitionSource
Adoption0.310.33Adoption rate of AMI metersU.S. EIA
Funding0.0010.003ARRA SGIG Federal Funding ($1000) per capitaSmartGrid.gov
State Act1.221.55Total number of state actions as of each yearZhou (2016)
SmarGrid.gov
College Educated29.516.38Percentage of the population that completed four years of college or more (%)U.S. Census
Energy
Intensity
7.013.05Total energy consumed per dollar of real GDP (1000 BTU per (2012) dollar)U.S. EIA
Table 2. Moran’s I and significant level of smart meter adoption rates, 2007–2019.
YearMoran’s I
2007−0.034
2008−0.04
2009−0.043
20100.029 *
20110.039 **
20120.028
20130.054 **
20140.063 ***
20150.063 ***
20160.048 **
20170.041 **
20180.035 *
20190.041 **
*** p < 0.01, ** p < 0.05, * p < 0.1.
Table 3. Regression results for different models.
Variables(1) FE(2) FE-SAR(3) FE-SEM(4) FE-SAR(5) FE-SEM
Inverse Distance Weight MatrixContiguity Weight Matrix
Funding0.6713.972 *2.5604.107 *3.622
(3.984)(2.285)(2.435)(2.271)(2.391)
State Act0.0466 ***0.0519 ***0.0517 ***0.0549 ***0.0533 ***
(0.0171)(0.00944)(0.00902)(0.00918)(0.00902)
College Educated0.04060.0605 ***0.0727 ***0.0622 ***0.0735 ***
(0.0301)(0.00640)(0.00562)(0.00575)(0.00523)
Energy Intensity−0.0185−0.0343 *−0.0360 *−0.0372 *−0.0407 **
(0.0331)(0.0193)(0.0193)(0.0192)(0.0191)
ρ 0.257 *** 0.141 ***
(0.0974)(0.0463)
λ 0.556 *** 0.173 ***
(0.158)(0.0577)
Constant−0.9340.163 ***0.162 ***0.162 ***0.162 ***
(0.904)(0.00475)(0.00474)(0.00474)(0.00475)
Observations637637637637637
Year FEYYYYY
State FEYYYYY
R-squared0.6060.0830.0600.0640.060
(1) F-Tests
( β 1 = β 2 = 0 )
4.67 **17.74 ***17.30 ***21.15 ***19.33 ***
(2) F-Tests
( a l l   β s = 0 )
15.56 ***167.38 ***105.06 ***169.08 ***156.88 ***
Number of groups4949494949
Standard errors in parenthesis, *** p < 0.01, ** p < 0.05, * p < 0.1. Pseudo R-squares are reported for model (2)–(5).
Publisher’s Note: MDPI stays neutral with regard to jurisdictional claims in published maps and institutional affiliations.

