


Design and Optimization of a Backup Renewable Energy Station for Photovoltaic Hybrid System in the New Jeddah Industrial City
Abstract
:1. Introduction
2. Methodology
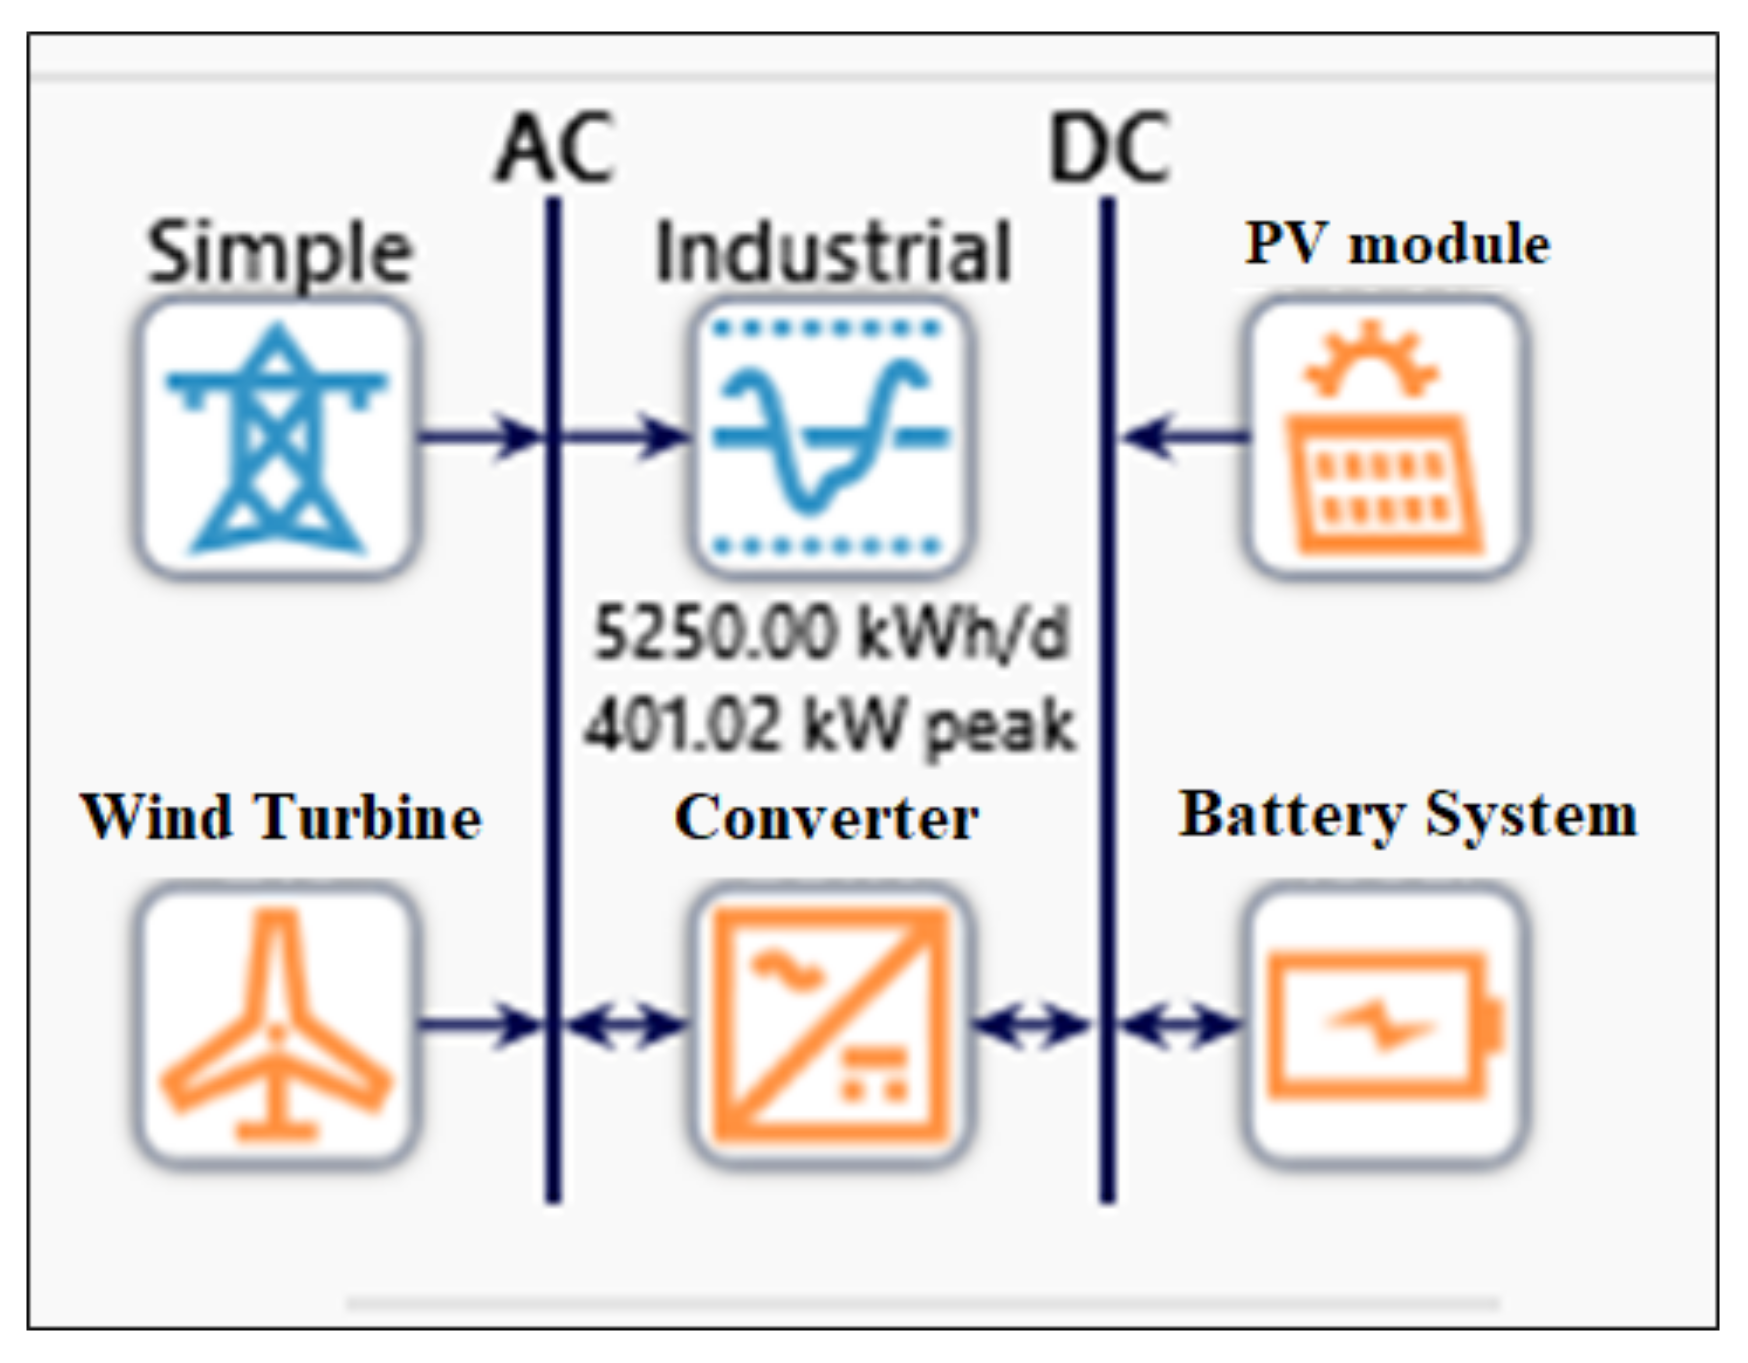
2.1. Hybrid System
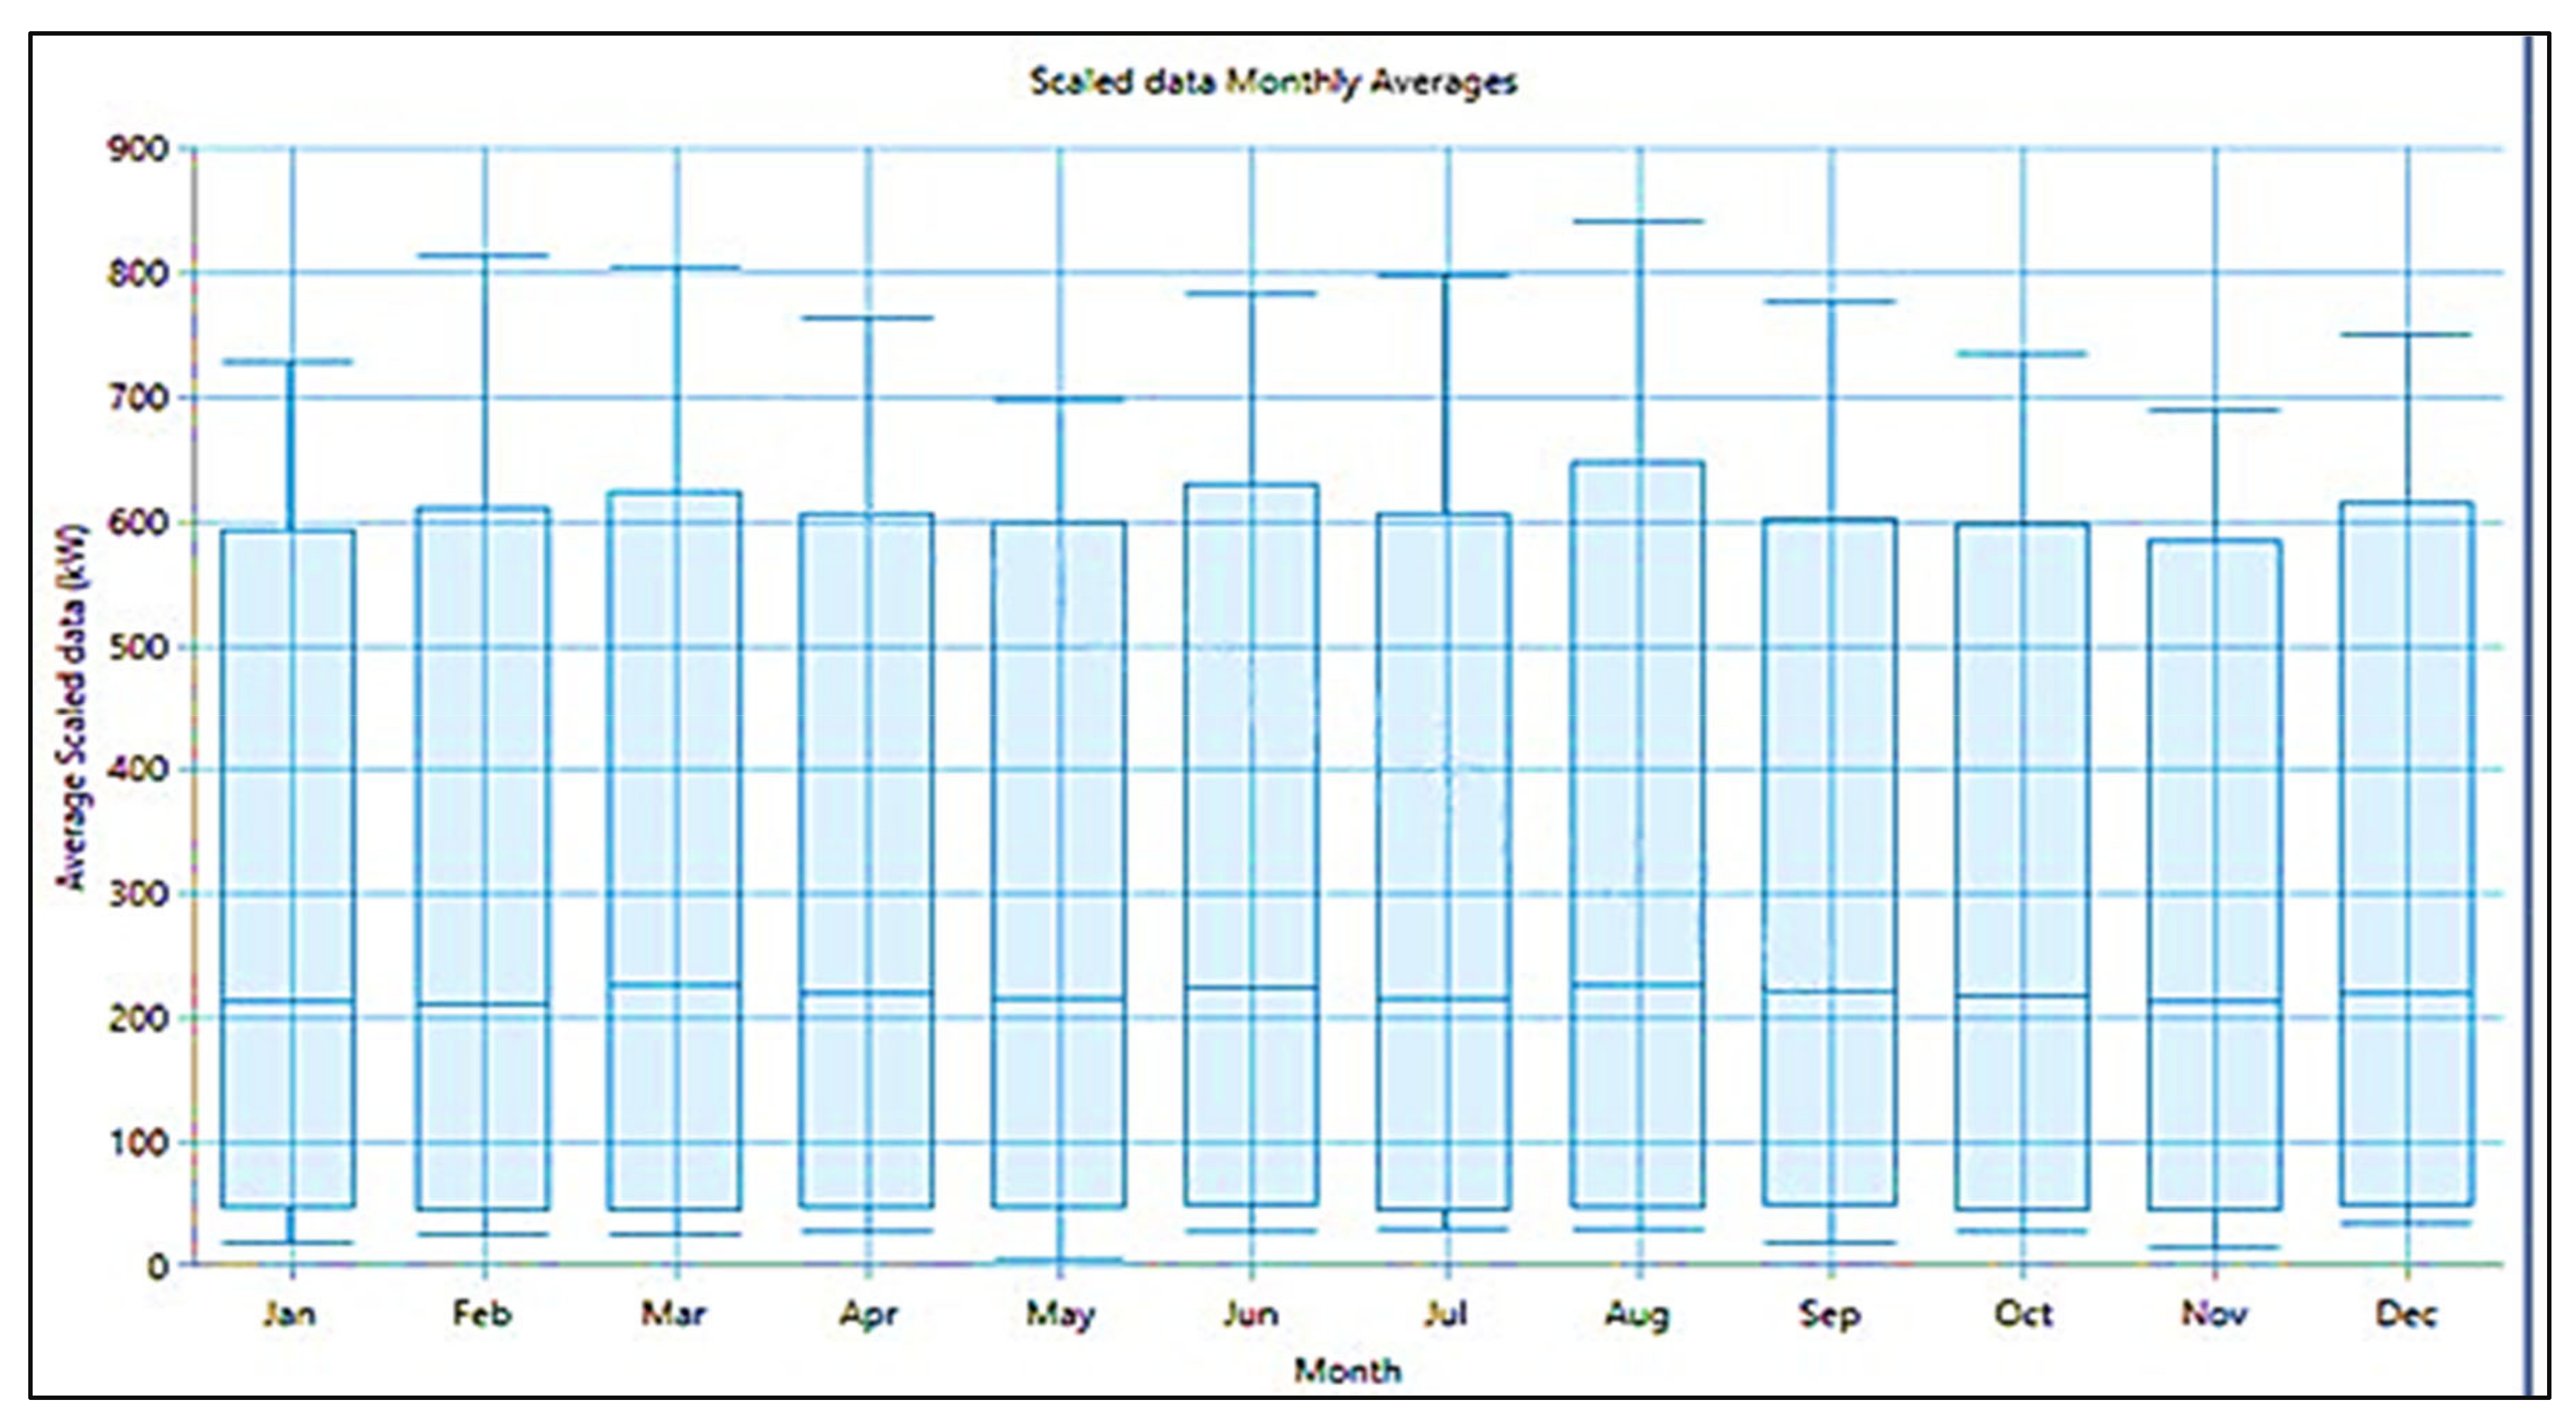
2.2. Data and Analysis of Solar and Wind Potential
2.2.1. Solar PV Modules
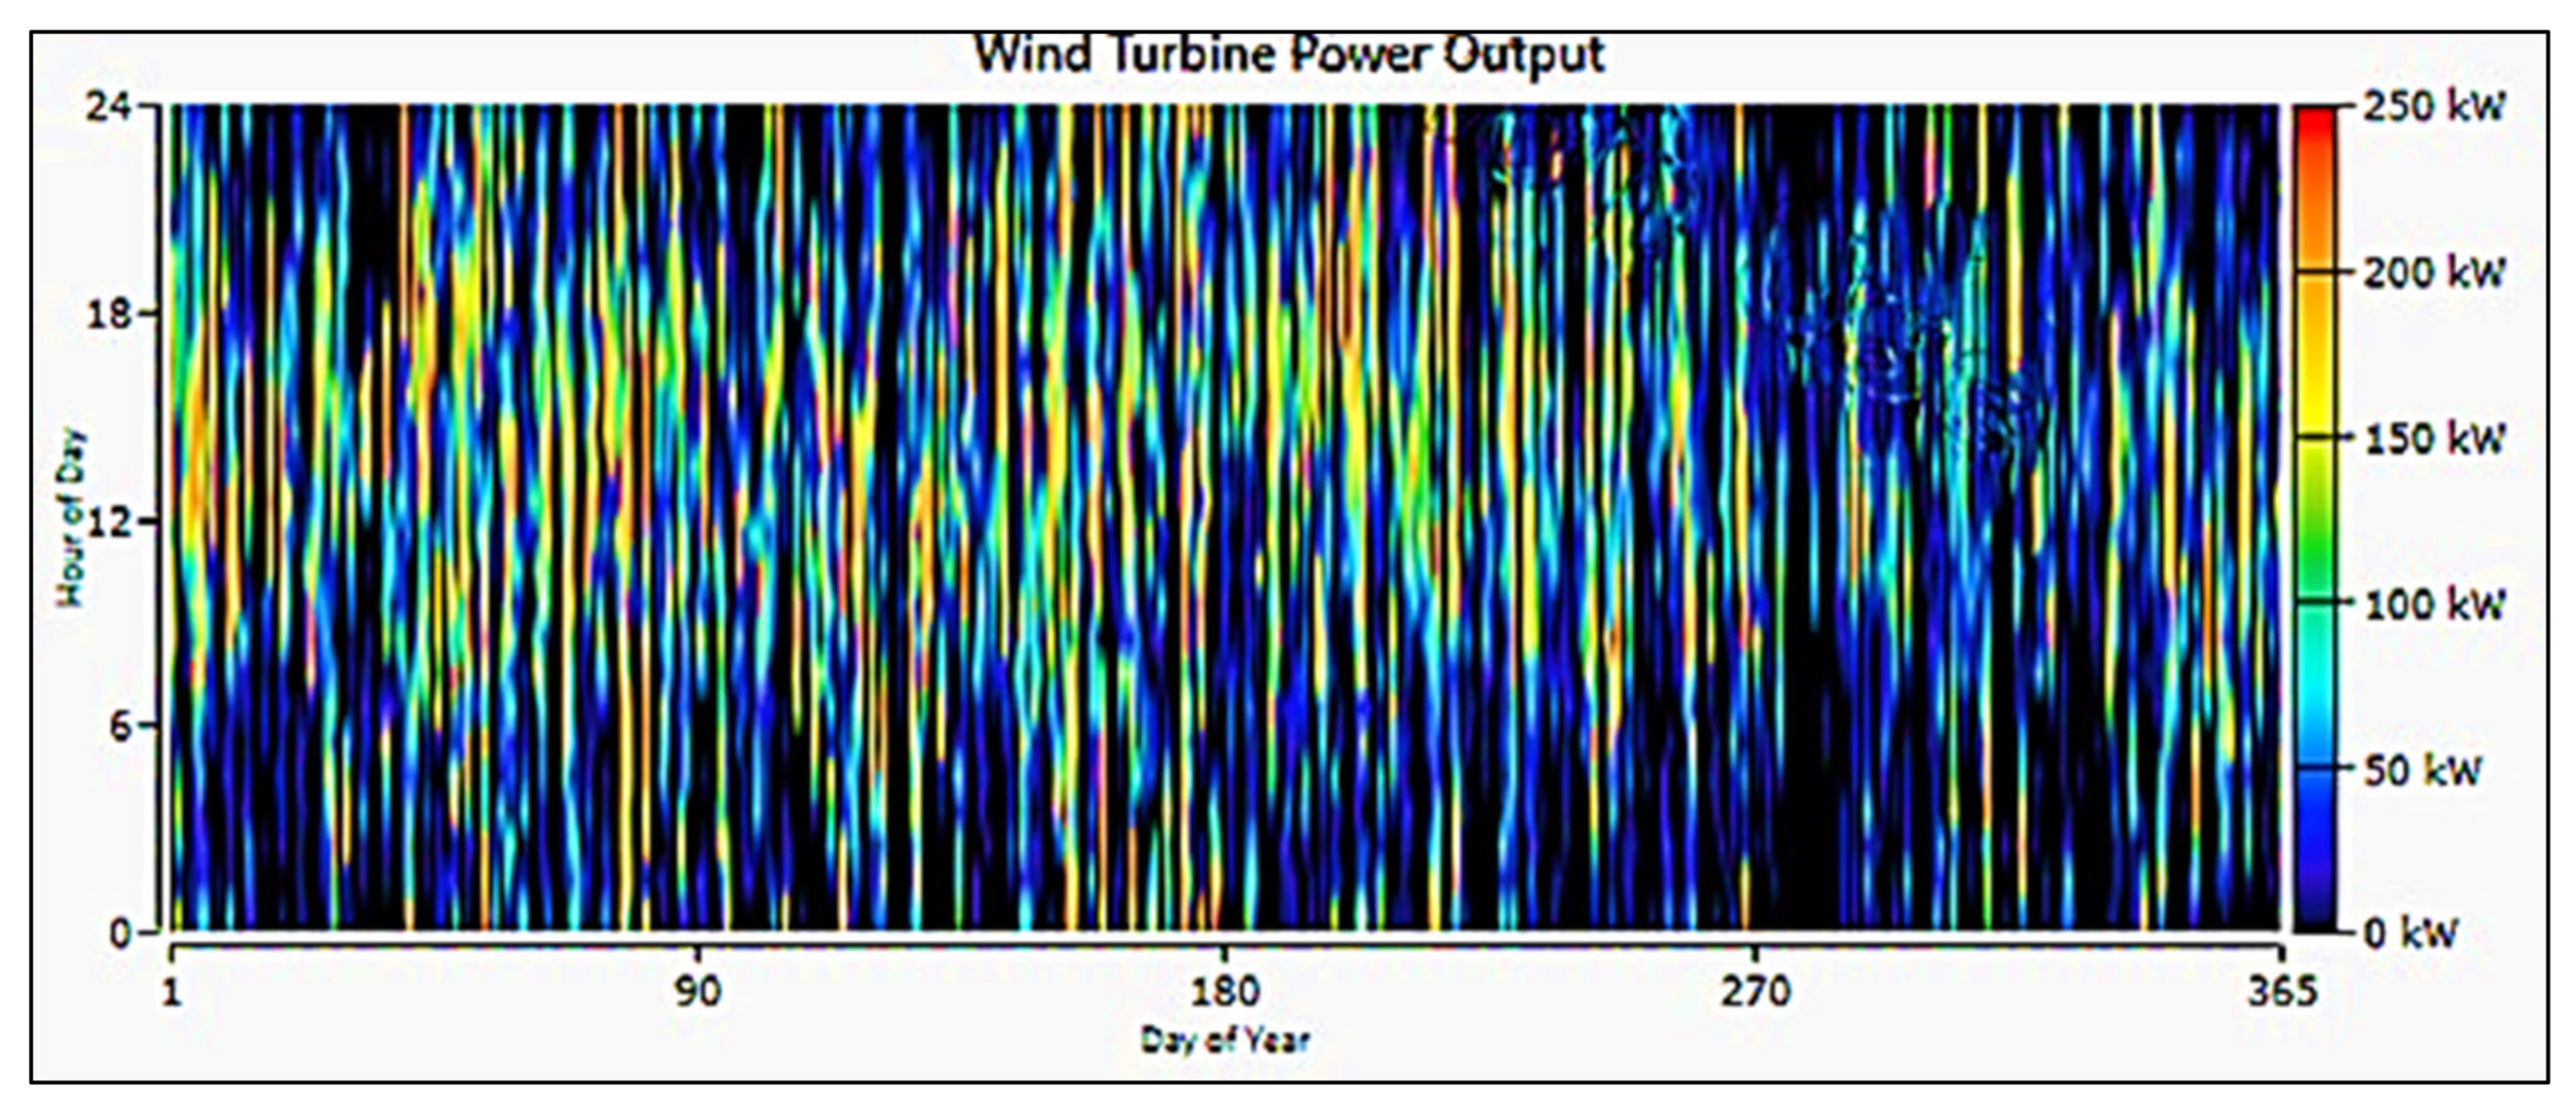
2.2.2. Wind Turbines
2.2.3. Battery System
2.2.4. Converter
2.3. HOMER Cost Calculation Technique
2.3.1. Present Net Cost
2.3.2. Total Annualized Cost
2.3.3. Capital Recovery Factor
2.3.4. Annual Real Interest Rate
2.3.5. Cost of Energy
2.3.6. Internal Rate of Return
3. Results and Discussion
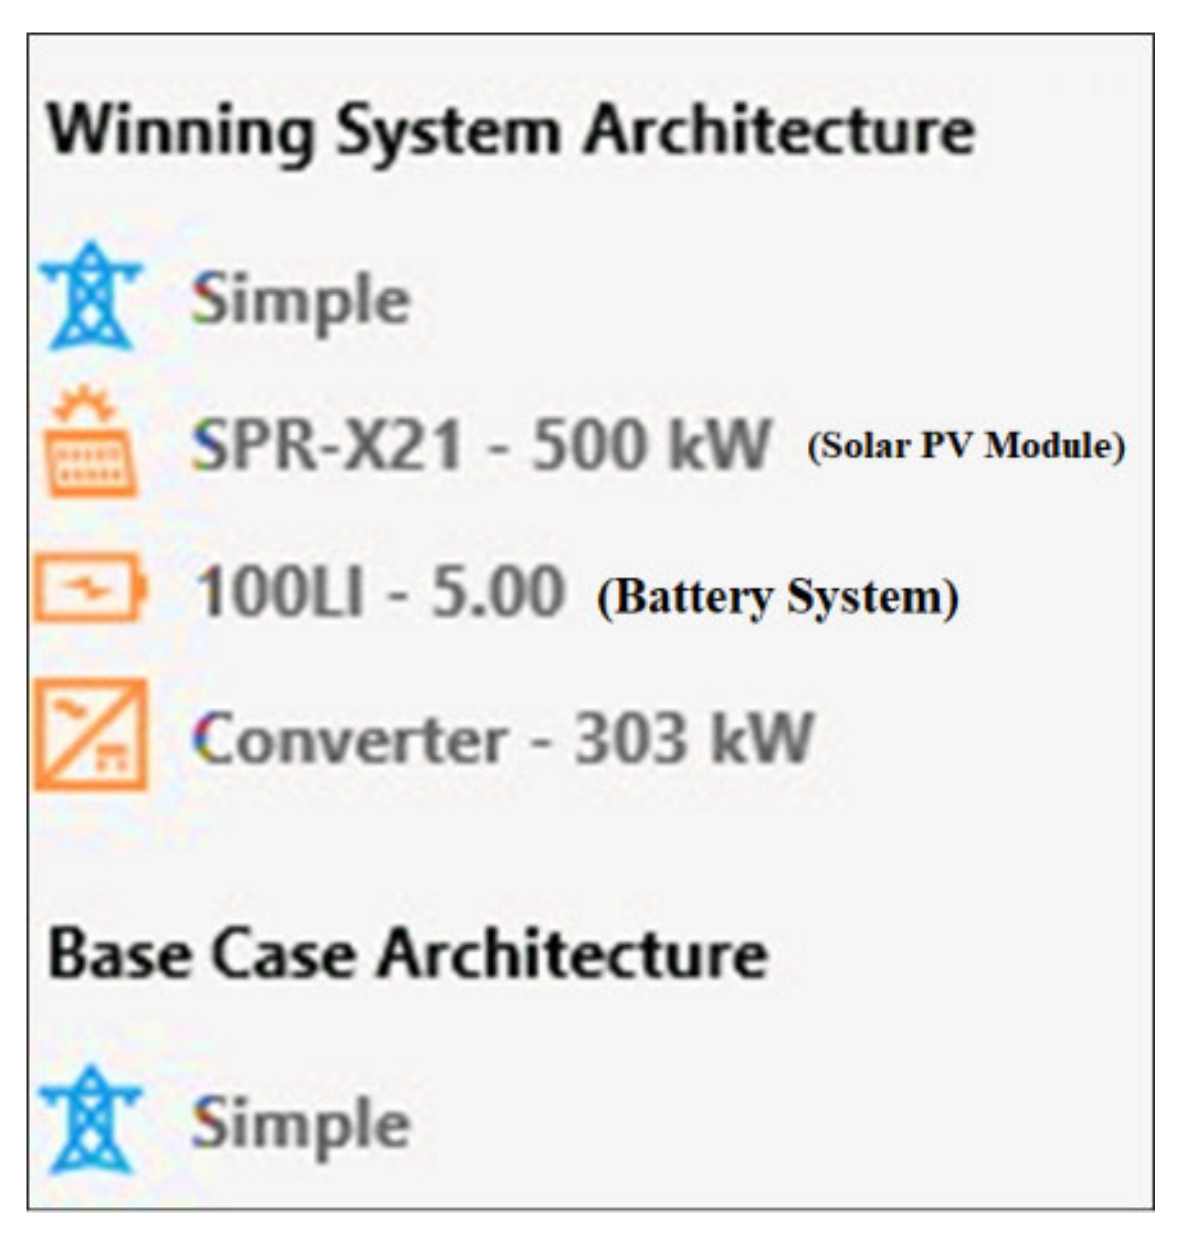
3.1. Hybrid Energy System Configuration
3.2. Simulation Results
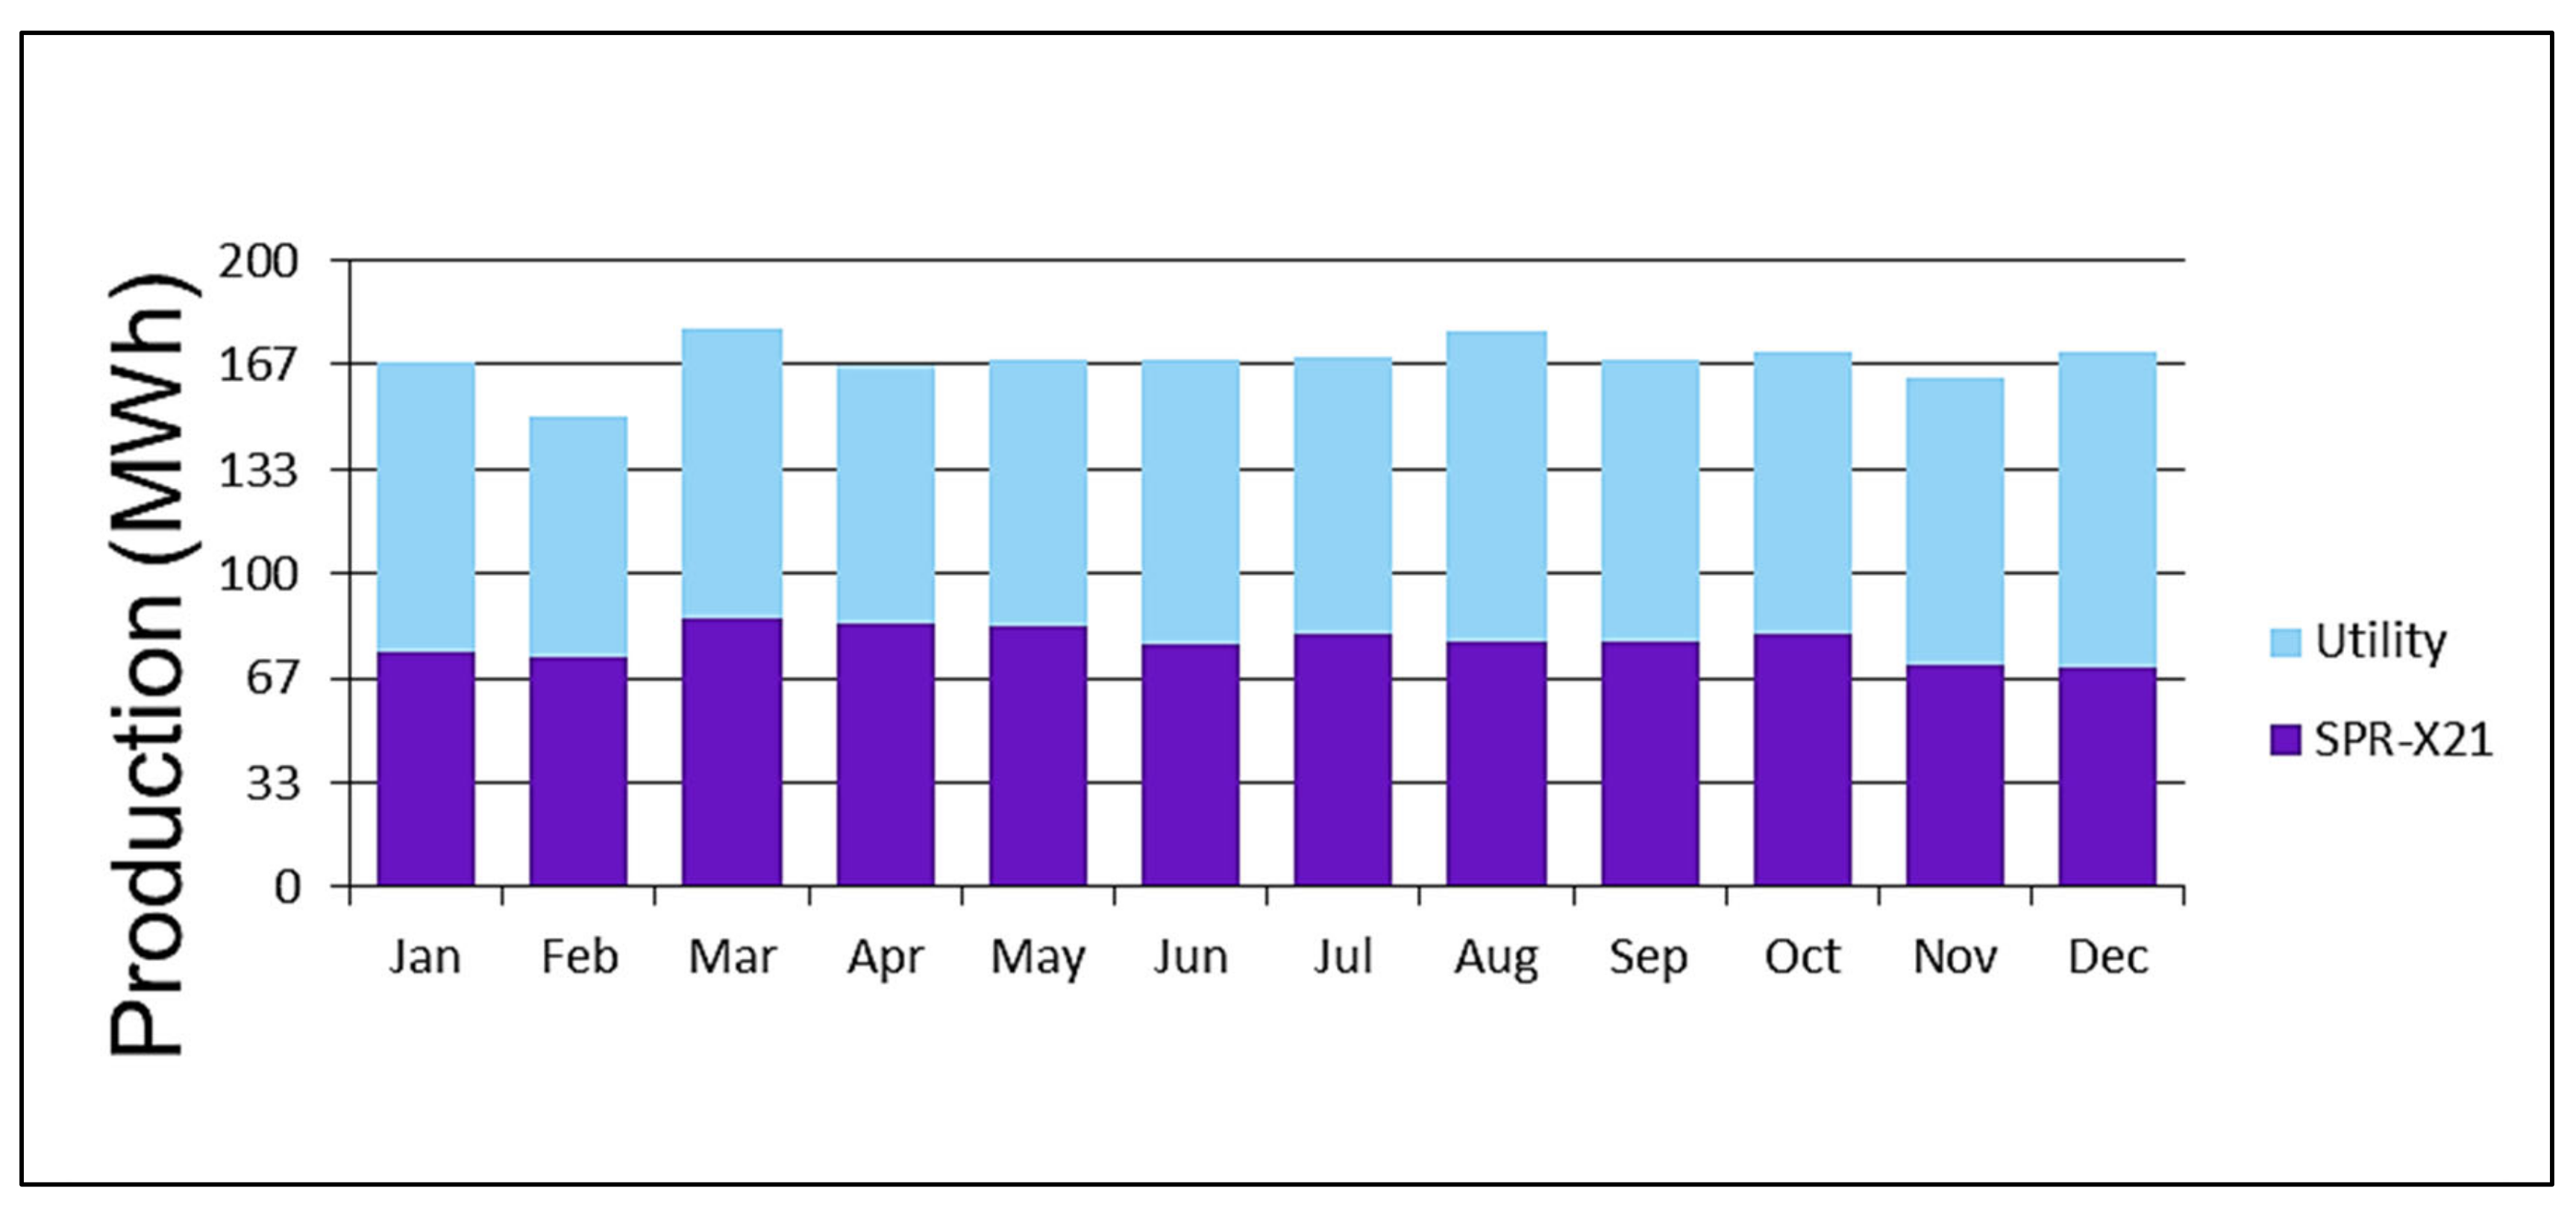
3.3. The First Configuration
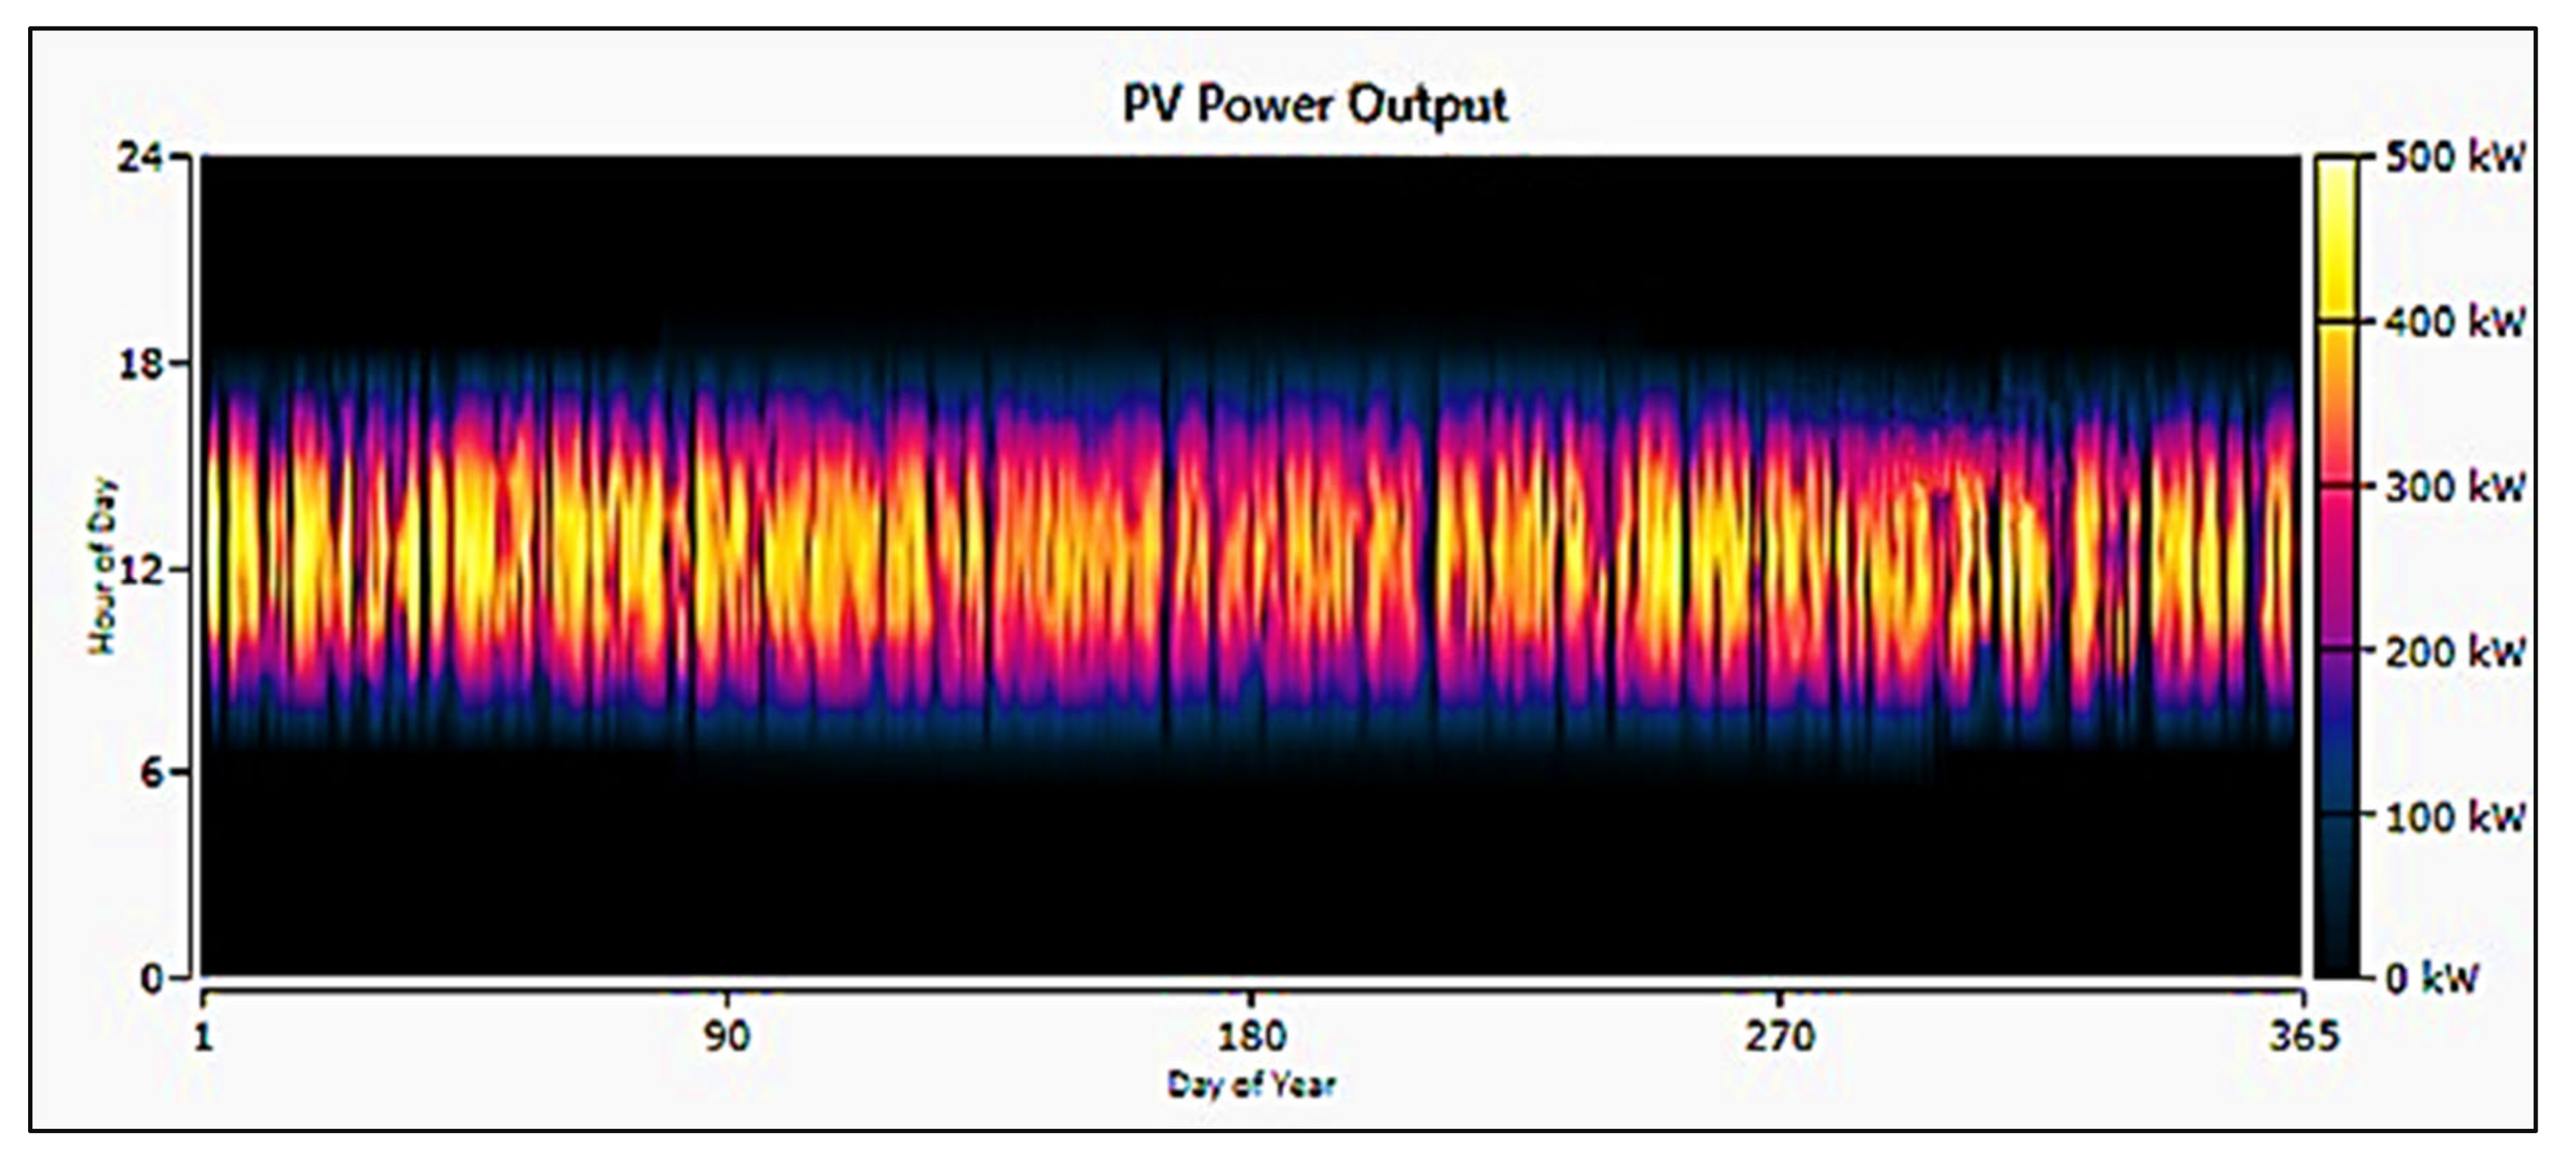
3.3.1. PV Arrays: SunPower X21-335-BLK
3.3.2. Storage: Generic 100 kWh Li-Ion
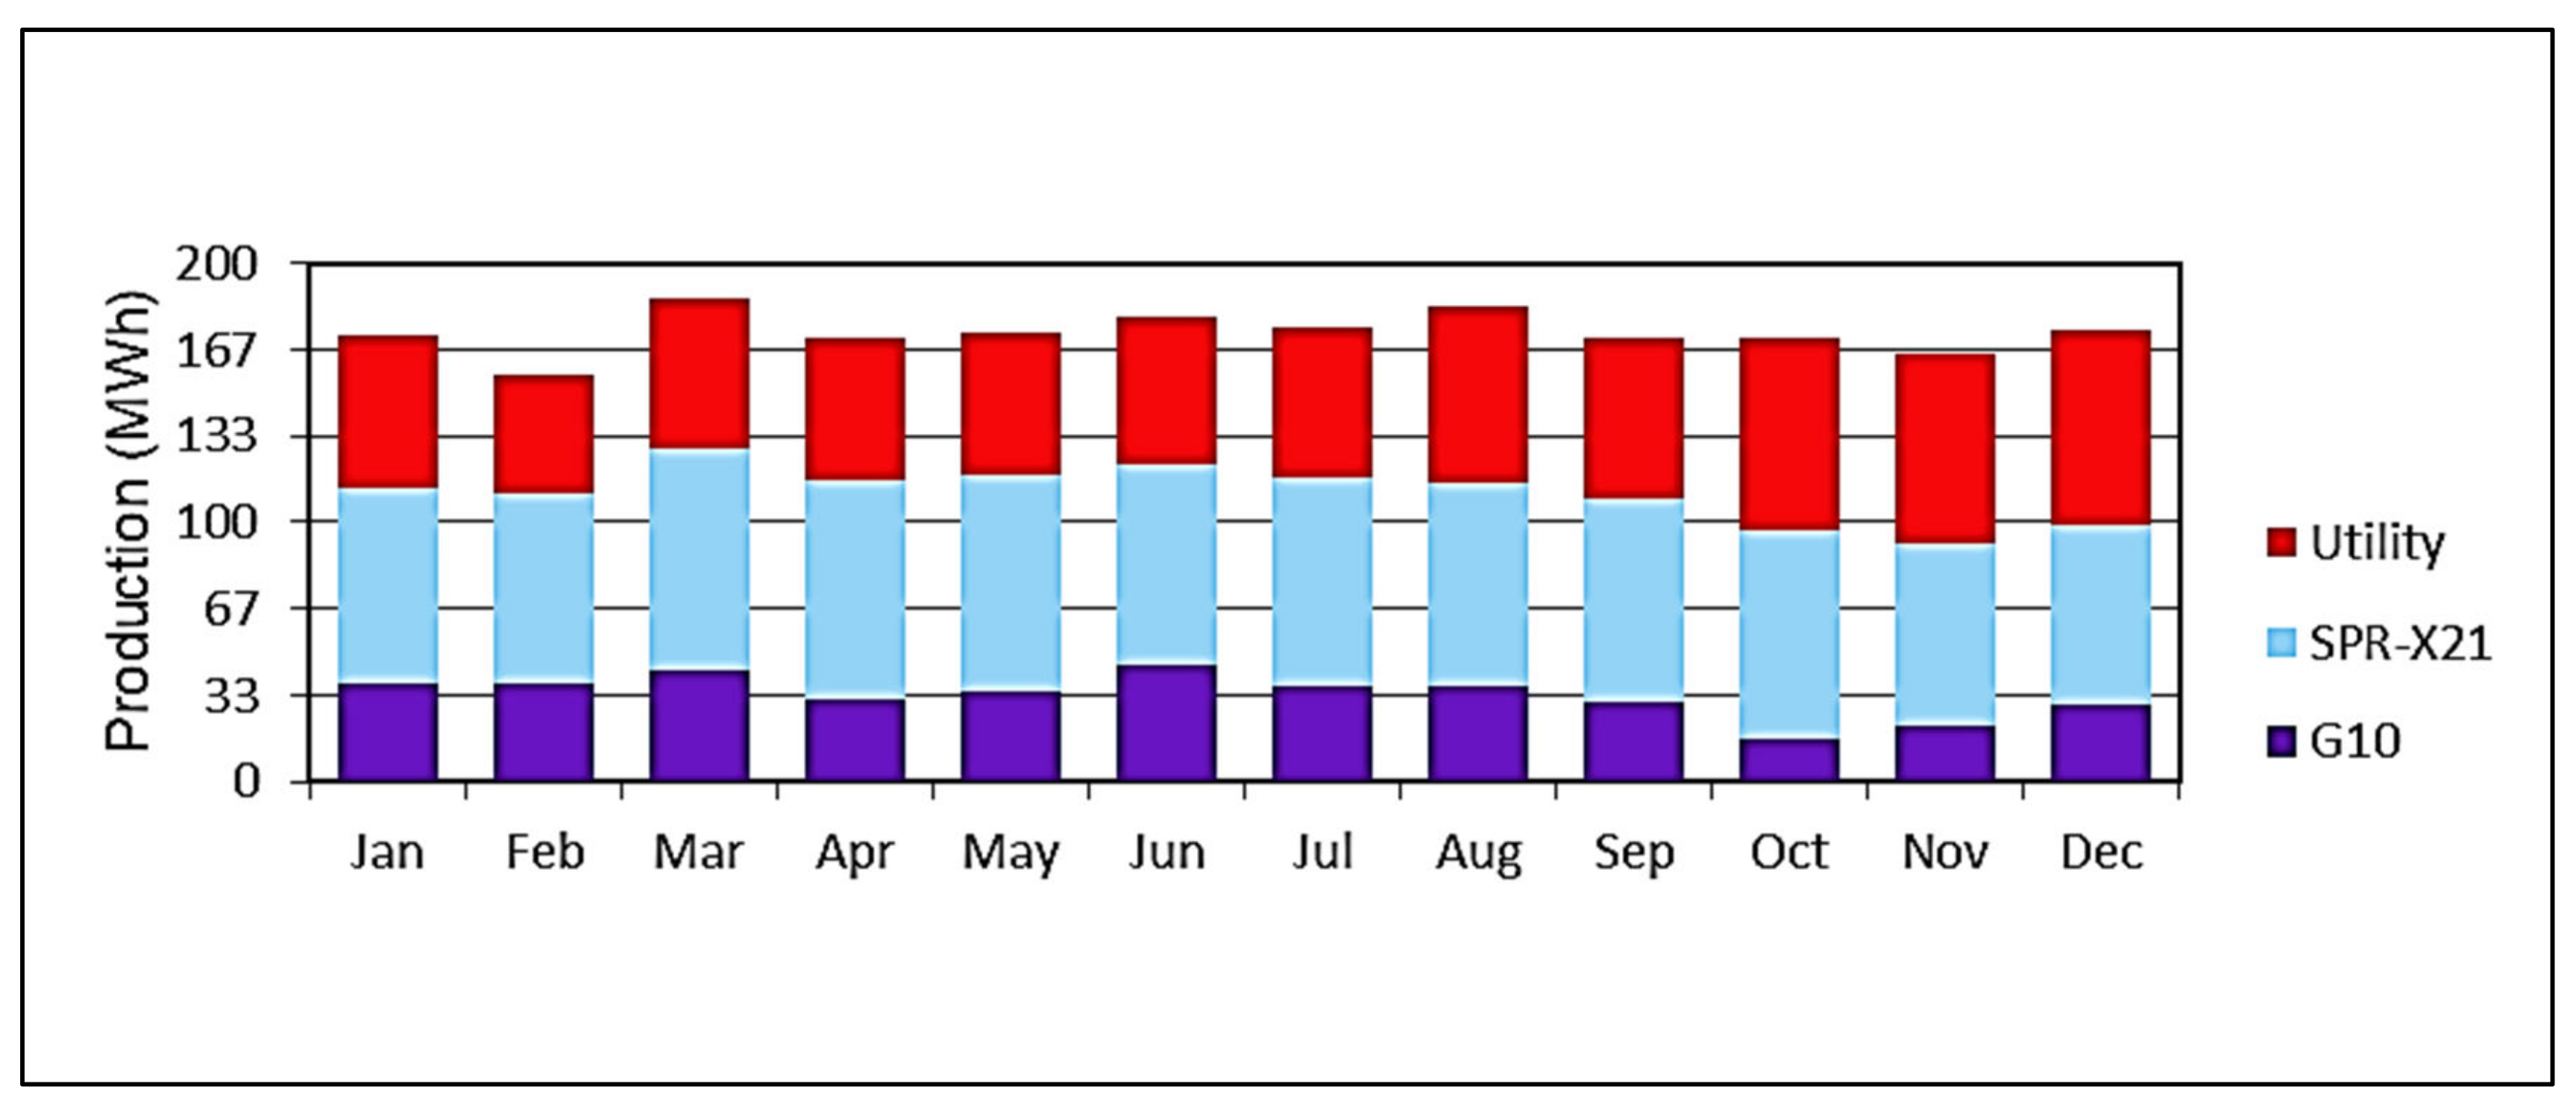
3.4. The Second Configuration
3.4.1. PV Arrays: SunPower X21-335-BLK
3.4.2. Wind Turbine: Generic 10 kW
3.4.3. Storage: Generic 100 kWh Li-Ion
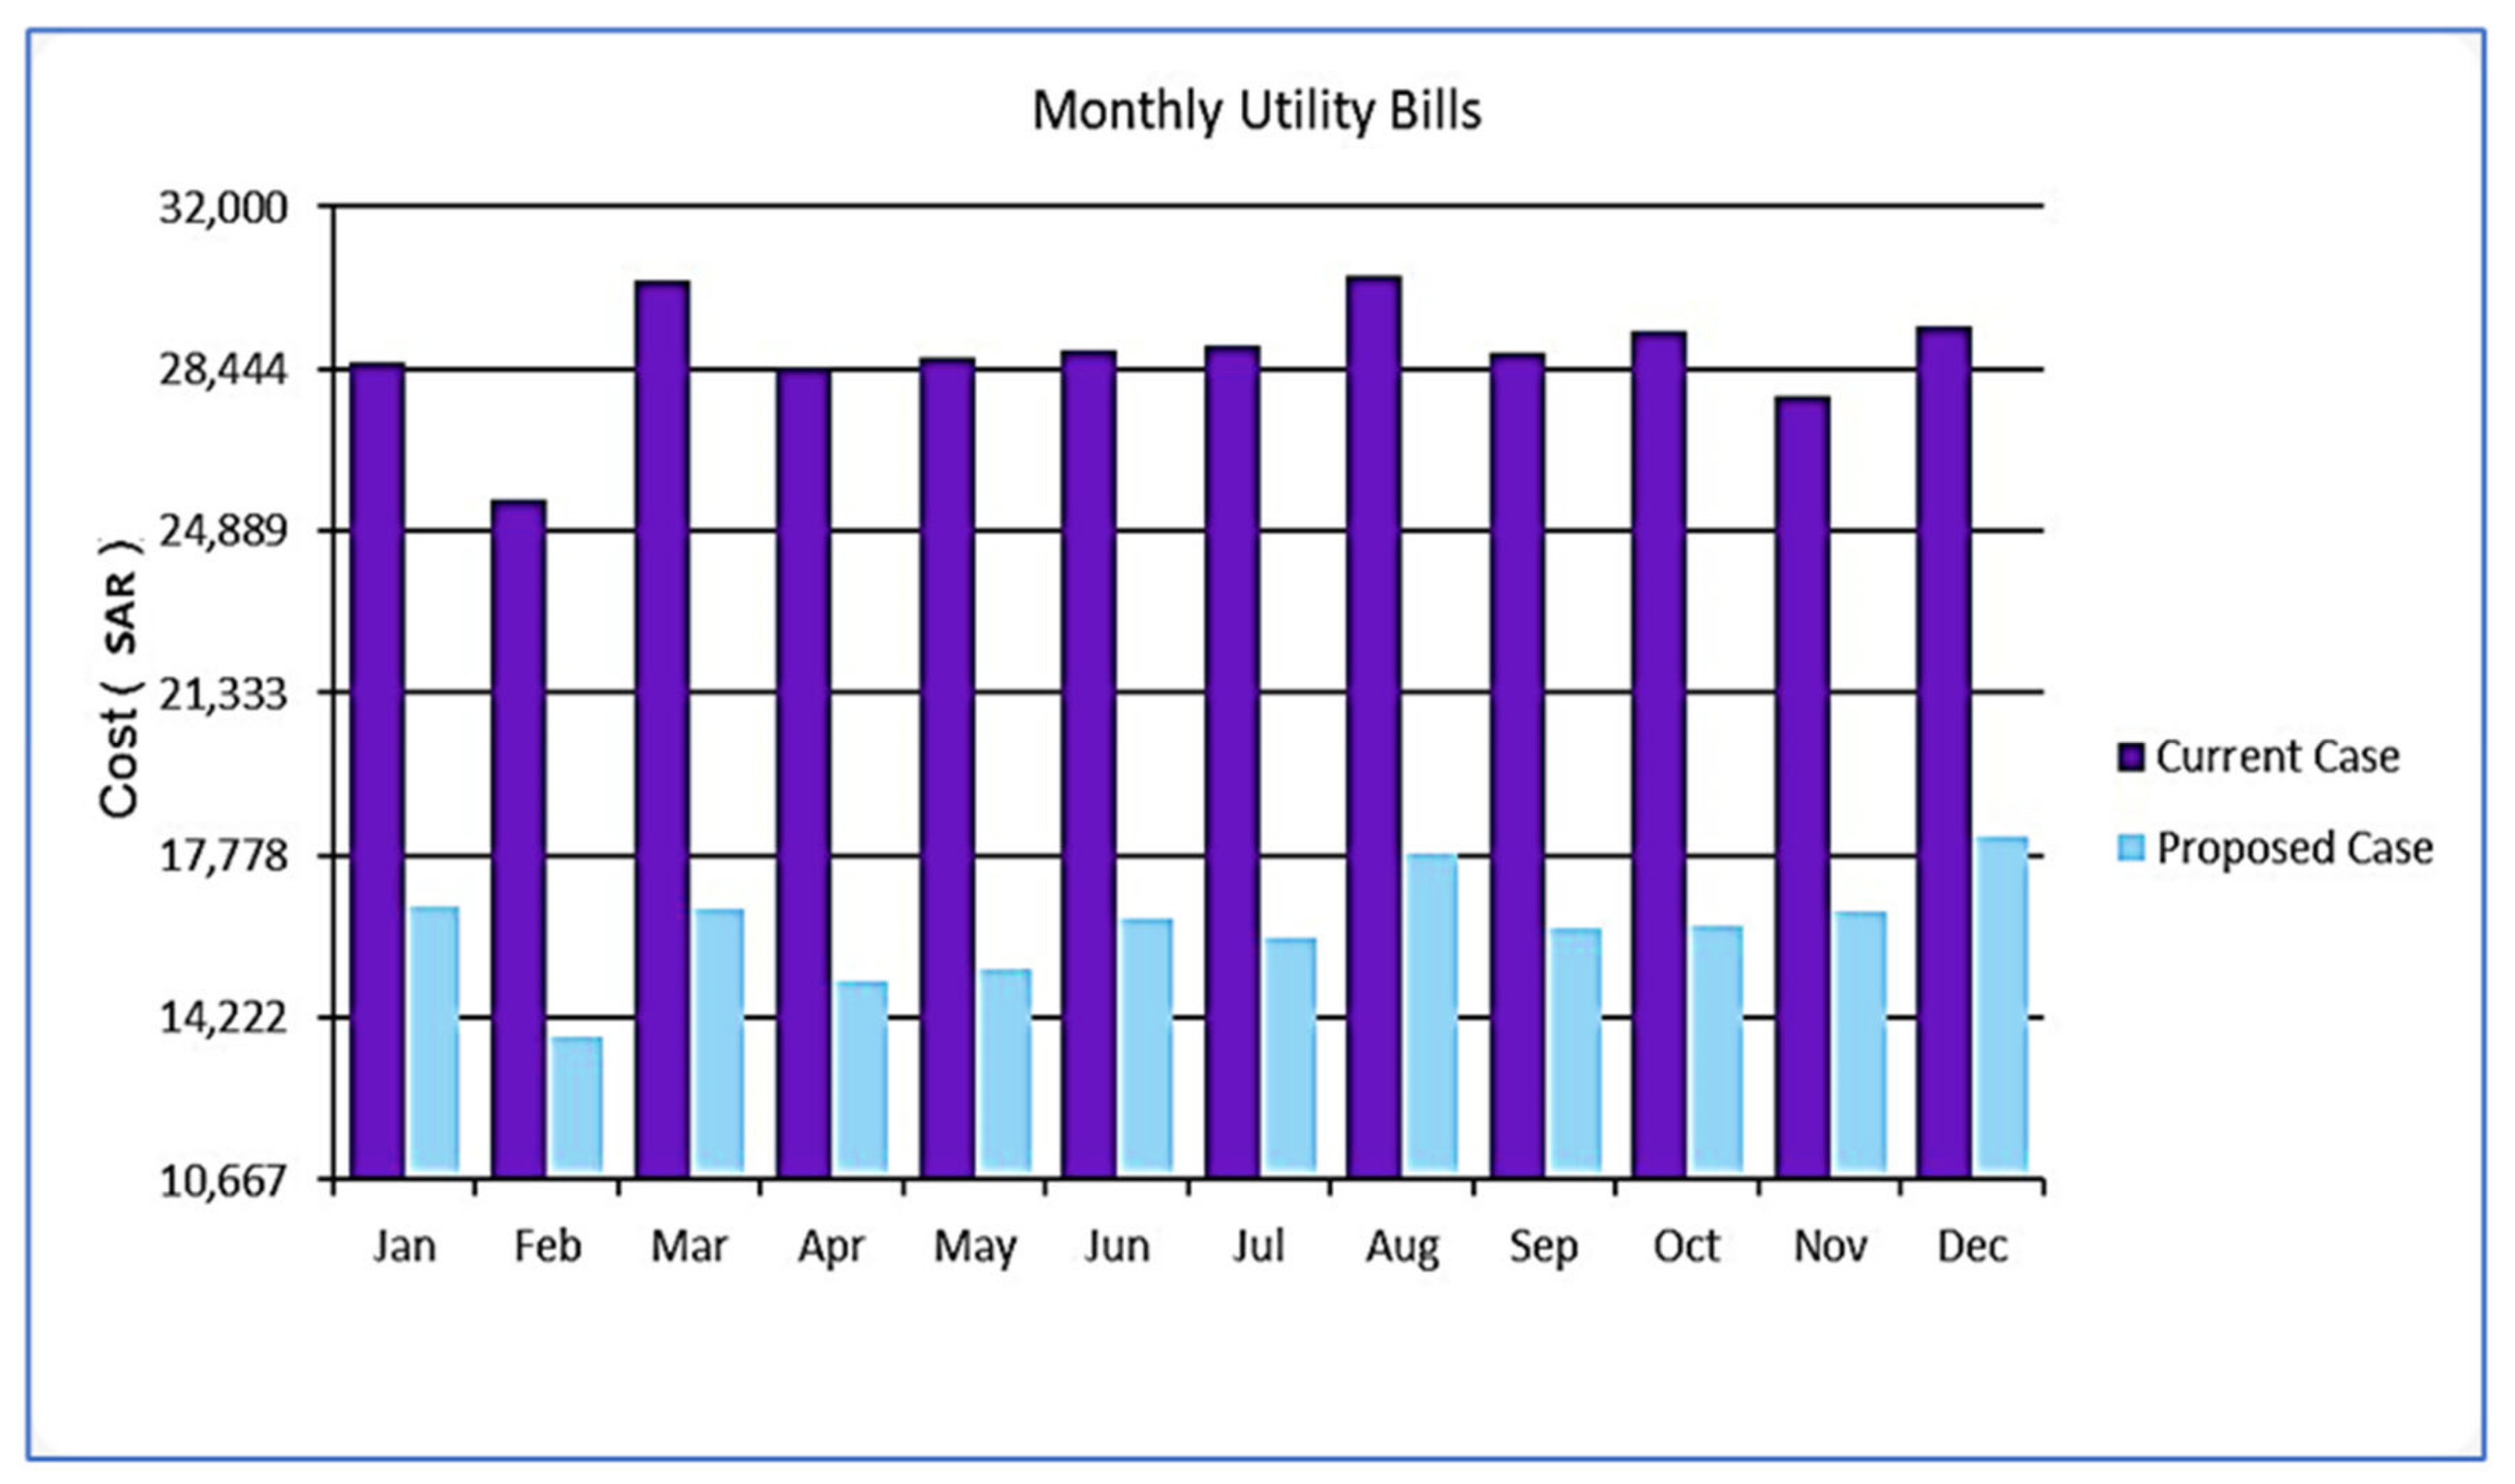
3.5. Financial Sustainability
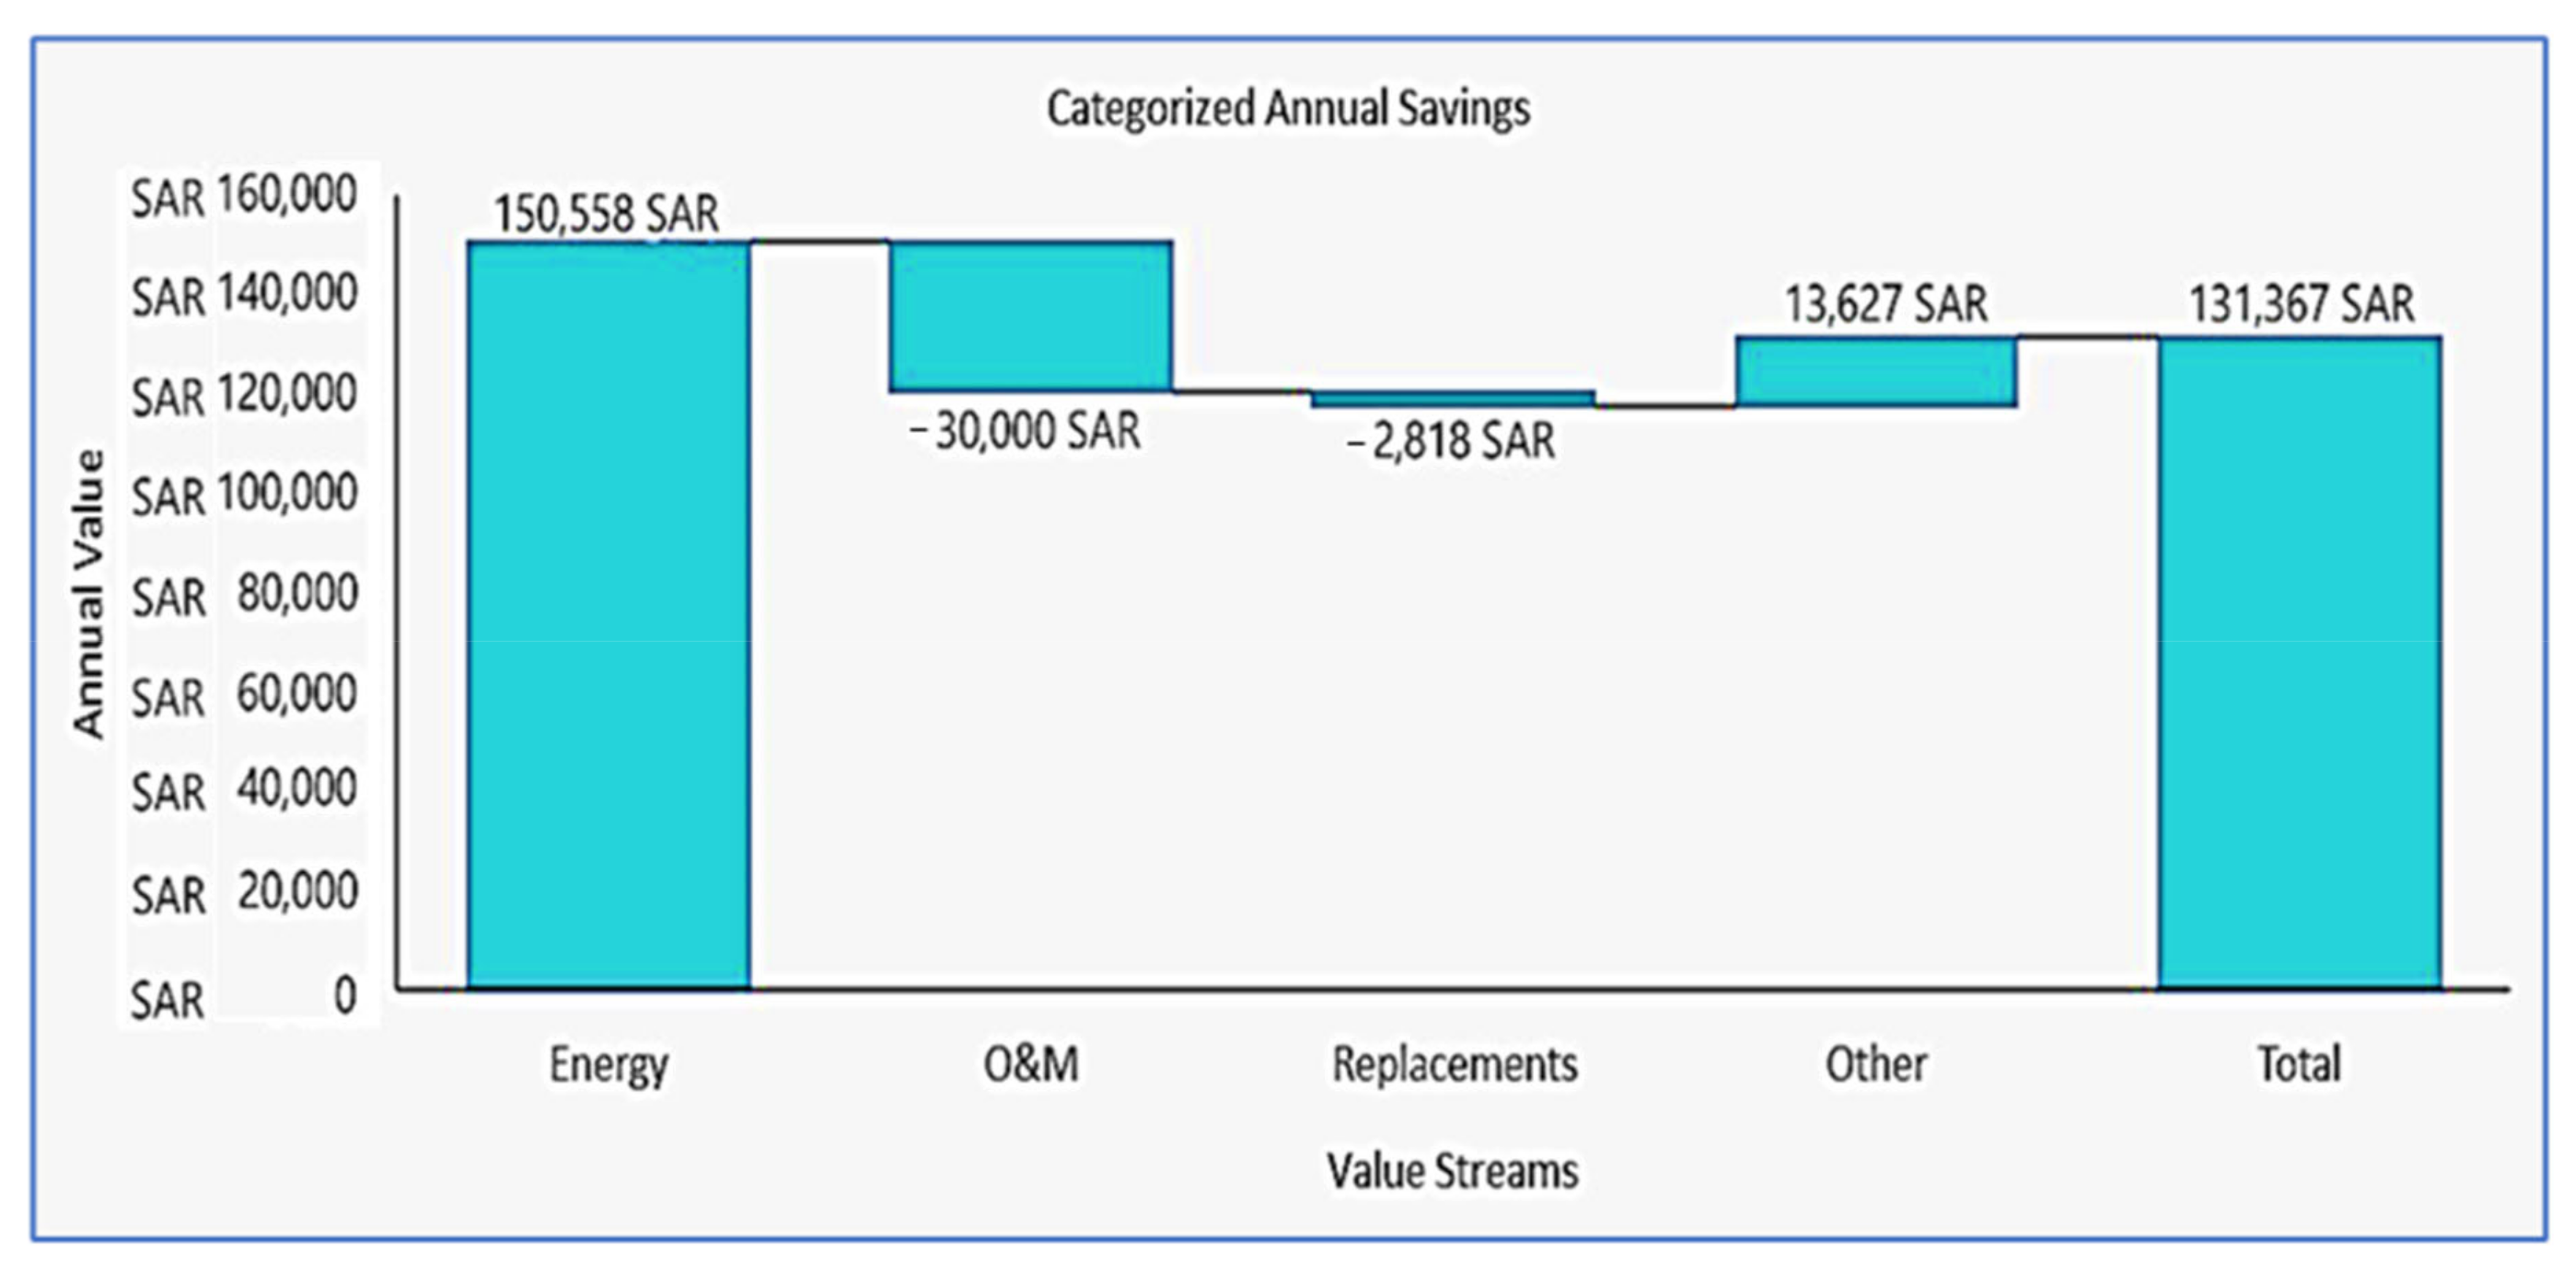
3.5.1. The First Configuration
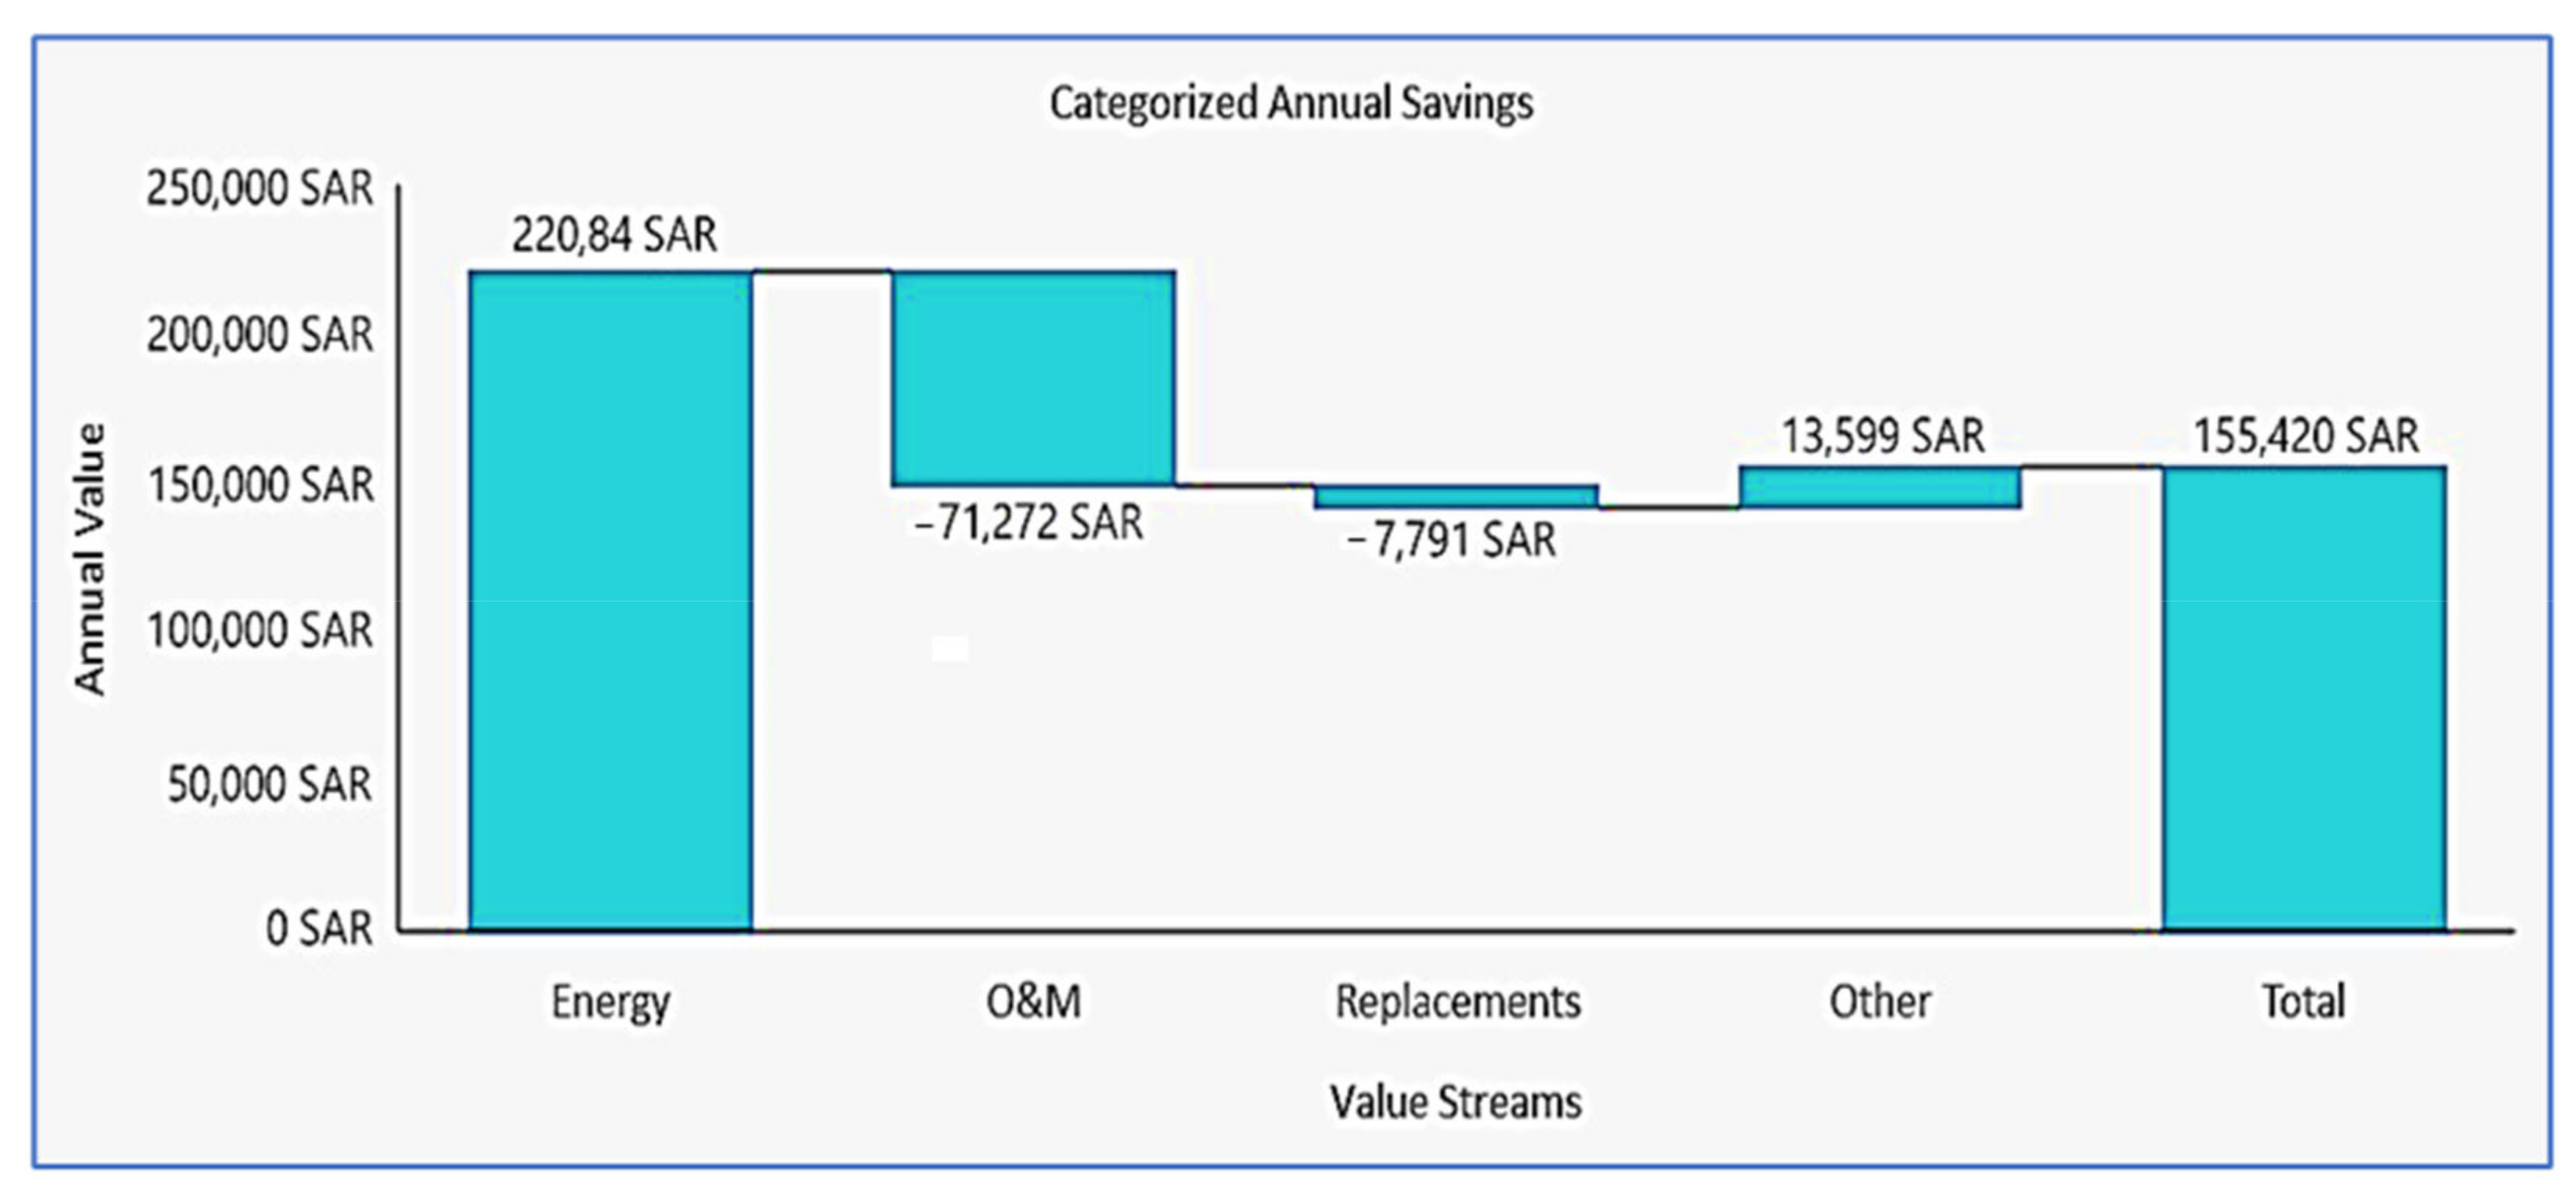
3.5.2. The Second Configuration
4. Conclusions
- To improve the study, more load data from more industries in Jeddah’s second industrial city are needed as well as a feasibility study of a hybrid system as a backup system for high load demand;
- Sustainable development goals (DSGs), goal 7, i.e., affordable and clean energy, and goal 11, i.e., sustainable cities and communities, should be discussed in future study;
- It is recommended that the effects of dust on the photovoltaic system and dust cleaning procedures be studied and included. On the other hand, environmental issues should be considered for the case study;
- Consider studying and evaluating an off-grid hybrid system for the chosen industry to see whether it is feasible to supply the load without using the grid;
- Consider solar modules and compare with the current results to find the best choice for economics [21].
Author Contributions
Funding
Institutional Review Board Statement
Informed Consent Statement
Data Availability Statement
Acknowledgments
Conflicts of Interest
Abbreviations
| HOMER | Hybrid optimization model for electric renewables |
| PV | Photovoltaic |
| MCDM | Multi-criteria decision making |
| HRES | Hybrid renewable energy system |
| COE | Cost of energy |
| POWER | Prediction of worldwide energy resource |
| TAC | Total annualized cost |
| DSGs | Sustainable development goals |
References
- Baseer, M.; Meyer, J.; Rehman, S.; Alam, M. Wind power characteristics of seven data collection sites in Jubail, Saudi Arabia using Weibull parameters. Renew. Energy 2017, 102, 35–49. [Google Scholar] [CrossRef] [Green Version]
- Shaahid, S.; Al-Hadhrami, L.M.; Rahman, M. Potential of Establishment of Wind Farms in Western Province of Saudi Arabia. Energy Procedia 2014, 52, 497–505. [Google Scholar] [CrossRef] [Green Version]
- Eltamaly, A.M.; Addoweesh, K.E.; Bawa, U.; Mohamed, M.A. Economic Modeling of Hybrid Renewable Energy System: A Case Study in Saudi Arabia. Arab. J. Sci. Eng. 2014, 39, 3827–3839. [Google Scholar] [CrossRef]
- Eltamaly, A.M. Design and implementation of wind energy system in Saudi Arabia. Renew. Energy 2013, 60, 42–52. [Google Scholar] [CrossRef]
- Salah, M.M.; Abo-Khalil, A.G.; Praveen, R. Wind speed characteristics and energy potential for selected sites in Saudi Arabia. J. King Saud Univ. Eng. Sci. 2019, 33, 119–128. [Google Scholar] [CrossRef]
- Allhibi, H.; Chowdhury, H.; Zaid, M.; Loganathan, B.; Alam, F. Prospect of wind energy utilization in Saudi Arabia: A review. Energy Procedia 2019, 160, 746–751. [Google Scholar] [CrossRef]
- Rehman, S.; Khan, S.A. Fuzzy Logic Based Multi-Criteria Wind Turbine Selection Strategy—A Case Study of Qassim, Saudi Arabia. Energies 2016, 9, 872. [Google Scholar] [CrossRef] [Green Version]
- Al-Ghamdi, S.A. Investigation of Wind Power Potential in Al-Aqiq, Saudi Arabia. IOP Conf. Ser. Mater. Sci. Eng. 2020, 982, 012021. [Google Scholar] [CrossRef]
- Al Zohbi, G.; Al Wuhayb, F.; Dernayka, S. Evaluation of Wind power energy potential in four sites in Saudi Arabia. Int. J. Renew. Energy Sources 2020, 5, 30–46. [Google Scholar]
- Krishnamoorthy, M.; Periyanayagam, A.D.V.R.; Kumar, C.S.; Kumar, B.P.; Srinivasan, S.; Kathiravan, P. Optimal Sizing, Selection, and Techno-Economic Analysis of Battery Storage for PV/BG-based Hybrid Rural Electrification System. IETE J. Res. 2020, 1–16. [Google Scholar] [CrossRef]
- Sharma, K.K.; Gupta, A.; Kumar, R.; Chohan, J.S.; Sharma, S.; Singh, J.; Khalilpoor, N.; Issakhov, A.; Chattopadhyaya, S.; Dwivedi, S.P. Economic evaluation of a hybrid renewable energy system (HRES) using hybrid optimization model for electric renewable (HOMER) software—A case study of rural India. Int. J. Low-Carbon Technol. 2021, 16, 814–821. [Google Scholar] [CrossRef]
- Vendoti, S.; Muralidhar, M.; Kiranmayi, R. Techno-economic analysis of off-grid solar/wind/biogas/biomass/fuel cell/battery system for electrification in a cluster of villages by HOMER software. Environ. Dev. Sustain. 2020, 23, 351–372. [Google Scholar] [CrossRef]
- Sanjay, K.C.; Karthikeyan, M.; Prasannakumaran, K.M.; Kirubakaran, V. Techno Commercial Study of Hybrid Systems for the Agriculture Farm Using Homer Software. In Hybrid Renewable Energy Systems; Wiley: New York, NY, USA, 2021; pp. 115–133. [Google Scholar] [CrossRef]
- Nguyen, Q.; Beni, M.H.; Parsian, A.; Malekahmadi, O.; Karimipour, A. Discrete ordinates thermal radiation with mixed convection to involve nanoparticles absorption, scattering and dispersion along radiation beams through the nanofluid. J. Therm. Anal. 2020, 143, 2801–2824. [Google Scholar] [CrossRef]
- Sheikholeslami, M.; Farshad, S.A.; Ebrahimpour, Z.; Said, Z. Recent progress on flat plate solar collectors and photovoltaic systems in the presence of nanofluid: A review. J. Clean. Prod. 2021, 293, 126119. [Google Scholar] [CrossRef]
- Alphan, H. Modelling potential visibility of wind turbines: A geospatial approach for planning and impact mitigation. Renew. Sustain. Energy Rev. 2021, 152, 111675. [Google Scholar] [CrossRef]
- Saudi Arabia Renewable Resource Atlas, King Abdullah City for Atomic and Renewable Energy. Available online: https://ksa-climate.com/wp-content/uploads/2018/11/Renewable-Resources-Atlas.pdf (accessed on 20 December 2021).
- Mehravar, M.; Harireche, O.; Faramarzi, A.; Alani, A.M. Modelling the variation of suction pressure during caisson installation in sand using FLAC3D. Ships Offshore Struct. 2014, 12, 893–899. [Google Scholar] [CrossRef]
- Mehravar, M.; Harireche, O.; Faramarzi, A. Evaluation of undrained failure envelopes of caisson foundations under combined loading. Appl. Ocean Res. 2016, 59, 129–137. [Google Scholar] [CrossRef] [Green Version]
- Nurunnabi, M.; Roy, N.K. Grid connected hybrid power system design using HOMER. In Proceedings of the 2015 International Conference on Advances in Electrical Engineering (ICAEE), Dhaka, Bangladesh, 17–19 December 2015; pp. 18–21. [Google Scholar] [CrossRef]
- Panchenko, V.; Izmailov, A.; Kharchenko, V.; Lobachevskiy, Y. Photovoltaic Solar Modules of Different Types and Designs for Energy Supply. In Research Anthology on Clean Energy Management and Solutions; IGI Global: Hershey, PA, USA, 2021; pp. 731–752. [Google Scholar] [CrossRef]
- Hoseinzadeh, S.; Garcia, D.A. Techno-economic assessment of hybrid energy flexibility systems for islands’ decarbonization: A case study in Italy. Sustain. Energy Technol. Assess. 2021, 51, 101929. [Google Scholar] [CrossRef]
- Jafari, S.; Sohani, A.; Hoseinzadeh, S.; Pourfayaz, F. The 3E Optimal Location Assessment of Flat-Plate Solar Collectors for Domestic Applications in Iran. Energies 2022, 15, 3589. [Google Scholar] [CrossRef]
- Shakouri, M.; Ghadamian, H.; Hoseinzadeh, S.; Sohani, A. Multi-objective 4E analysis for a building integrated photovoltaic thermal double skin Façade system. Sol. Energy 2022, 233, 408–420. [Google Scholar] [CrossRef]
- Esmaeilion, F.; Ahmadi, A.; Hoseinzadeh, S.; Aliehyaei, M.; Makkeh, S.A.; Garcia, D.A. Renewable energy desalination; a sustainable approach for water scarcity in arid lands. Int. J. Sustain. Eng. 2021, 14, 1916–1942. [Google Scholar] [CrossRef]
- Gilani, H.A.; Hoseinzadeh, S. Techno-economic study of compound parabolic collector in solar water heating system in the northern hemisphere. Appl. Therm. Eng. 2021, 190, 116756. [Google Scholar] [CrossRef]
- Hoseinzadeh, S.; Ghasemi, M.H.; Heyns, S. Application of hybrid systems in solution of low power generation at hot seasons for micro hydro systems. Renew. Energy 2020, 160, 323–332. [Google Scholar] [CrossRef]


| Architecture | Cost | |||||||
|---|---|---|---|---|---|---|---|---|
| PV Module (kW) | Wind Turbine | Battery System | Simple | Converter (kW) | NPC (SAR) | COE (SAR) | Operating Cost (SAR/y) | Initial Capital (SAR) |
| 500 | 1 | 5 | 1 | 294 | 4.32 | 0.175 | 213.024 | 1.57 |
| 500 | 1 | 4 | 1 | 327 | 4.32 | 0.175 | 212.430 | 1.58 |
| 500 | 2 | 5 | 1 | 303 | 4.33 | 0.175 | 211.545 | 1.59 |
| 500 | 2 | 5 | 1 | 309 | 4.33 | 0.175 | 211.434 | 1.59 |
| 500 | 1 | 6 | 1 | 320 | 4.33 | 0.175 | 212.492 | 1.58 |
| 500 | 1 | 6 | 1 | 323 | 4.33 | 0.175 | 212.474 | 1.58 |
| 500 | 1 | 7 | 1 | 311 | 4.33 | 0.175 | 212.594 | 1.58 |
| 500 | 2 | 4 | 1 | 310 | 4.33 | 0.175 | 211.623 | 1.59 |
| 500 | 1 | 4 | 1 | 296 | 4.33 | 0.175 | 213.505 | 1.57 |
| 500 | 1 | 5 | 1 | 339 | 4.33 | 0.175 | 212.371 | 1.58 |
| 500 | 1 | 8 | 1 | 254 | 4.33 | 0.175 | 213.941 | 1.56 |
| 500 | 3 | 6 | 1 | 294 | 4.33 | 0.175 | 210.450 | 1.61 |
| Production | kWh/y | % |
|---|---|---|
| PV | 937,282 | 46.5 |
| Grid Purchases | 1,079,986 | 53.5 |
| Total | 2,017,268 | 100 |
| Consumption | ||
| AC Primary Load | 1,916,250 | 100 |
| Grid Sales | 0 | 0 |
| Total | 1,916,250 | 100 |
| Component | Capital (SAR) | Replacement (SAR) | O&M (SAR) | Salvage (SAR) | Total (SAR) |
|---|---|---|---|---|---|
| Generic 100 kWh Li-Ion | 15,000.00 | 6364.11 | 0.00 | −1197.79 | 2,016,632.00 |
| Generic 100 kWh Li-Ion Bonus Depreciation | −137,025.00 | 0.00 | 0.00 | 0.00 | −137,025.00 |
| Generic 100 kWh Li-Ion ITC | −3900.00 | 0.00 | 0.00 | 0.00 | −3900.00 |
| Generic 100 kWh Li-Ion MACRS | 0.00 | 0.00 | −117,179.00 | 0.00 | −117,179.00 |
| Simple Tariff | 0.00 | 0.00 | 2,517,333.81 | 0.00 | 2,517,333.81 |
| SunPower X21-335-BLK | 2,240,000.00 | 0.00 | 387,825.50 | 0.00 | 2,627,825.50 |
| SunPower X21-335-BLK Bonus Depreciation | 204,624.00 | 0.00 | 0.00 | 0.00 | 204,624.00 |
| SunPower X21-335-BLK ITC | 582,400.00 | 0.00 | 0.00 | 0.00 | 582,400.00 |
| SunPower X21-335-BLK MACRS | 0.00 | 0.00 | −174,987.65 | 0.00 | −174,987.65 |
| System Converter | 90,778.13 | 38,514.78 | 0.00 | −7248.87 | 122,044.04 |
| System | 1,553,483.88 | 44,878.89 | 2,729,000.87 | −8446.66 | 4,318,916.98 |
| Quantity | Value |
|---|---|
| Rated Capacity (kW) | 500 |
| Minimum Output (kW) | 0 |
| Maximum Output (kW) | 497 |
| Mean Output (kW) | 107 |
| Mean Output (kWh/d) | 2568 |
| PV Penetration (%) | 48.9 |
| Capacity Factor (%) | 21.4 |
| Levelized Cost (SAR/kWh) | 0.217 |
| Hours of Operation (h/year) | 4406 |
| Total Production (kWh/year) | 937,282 |
| Quantity | Value | Units |
|---|---|---|
| Batteries | 5 | qty. |
| String Size | 1 | batteries |
| Nominal Capacity | 500 | kWh |
| Usable Nominal Capacity | 400 | kWh |
| Annual Throughput | 62,342 | hWh/year |
| Expected Life | 15 | year |
| Capital Cost | 15,000 | SAR |
| Production | kWh/yr. | % |
|---|---|---|
| PV | 937,282 | 45 |
| Wind Turbine | 401,924 | 19.3 |
| Grid Purchases | 742,481 | 35.7 |
| Total | 2,081,688 | 100 |
| Consumption | ||
| AC Primary Load | 1,916,250 | 100 |
| Grid Sales | 0 | 0 |
| Total | 1,916,250 | 100 |
| Component | Capital (SAR) | Replacement (SAR) | O&M (SAR) | Salvage (SAR) | Total (SAR) |
|---|---|---|---|---|---|
| Generic 10 kW | 412,720.00 | 131,578.17 | 533,544.46 | −74,152.74 | 1,003,689.90 |
| Generic 100kWh Li-Ion | 9000.00 | 8009.21 | 0.00 | −1025.96 | 15,982.25 |
| Generic 100 kWh Li-Ion Bonus Depreciation | −945.00 | 0.00 | 0.00 | 0.00 | −945.00 |
| Generic 100kWh Li-Ion MACRS | 0.00 | 0.00 | −808.13 | 0.00 | −808.13 |
| Simple Tariff | 0.00 | 0.00 | 1,608,195.45 | 0.00 | 1,608,195.45 |
| SunPower X21-335-BLK | 2,240,000.00 | 0.00 | 387,825.50 | 0.00 | 2,627,825.50 |
| SunPower X21-335-BLK Bonus Depreciation | −204,724.00 | 0.00 | 0.00 | 0.00 | −204,624.00 |
| SunPower X21-335-BLK ITC | −582,400.00 | 0.00 | 0.00 | 0.00 | −582,400.00 |
| SunPower X21-335-BLK MACRS | 0.00 | 0.00 | −174,986.65 | 0.00 | −174,986.65 |
| System Converter | 105,420.19 | 44,727.03 | 0.00 | −8418.08 | 141,729.14 |
| System | 1,979,171.19 | 184,314.4 | 2,353,770.63 | −83,597.77 | 4,433,658.45 |
| Quantity | Value |
|---|---|
| Rated Capacity (kW) | 500 |
| Minimum Output (kW) | 0 |
| Maximum Output (kW) | 497 |
| Mean Output (kW) | 107 |
| Mean Output (kWh/d) | 2568 |
| PV Penetration (%) | 48.9 |
| Capacity Factor (%) | 21.4 |
| Levelized Cost (SAR/kWh) | 0.217 |
| Hours of Operation (h/year) | 4406 |
| Total Production (kWh/year) | 937,282 |
| Quantity | Value |
|---|---|
| Rated Capacity (kW) | 220 |
| Minimum Output (kW) | 0 |
| Maximum Output (kW) | 220 |
| Mean Output (kW) | 45.9 |
| Wind Penetration (%) | 21 |
| Capacity Factor (%) | 20.9 |
| Levelized Cost (SAR/kWh) | 0.193 |
| Hours of Operation (h/year) | 7092 |
| Total Production (kWh/year) | 401,924 |
| Quantity | Value | Units |
|---|---|---|
| Batteries | 3 | qty. |
| String Size | 1 | batteries |
| Nominal Capacity | 300 | kWh |
| Usable Nominal Capacity | 240 | kWh |
| Annual Throughput | 90,852 | hWh/year |
| Expected Life | 9.91 | year |
| Capital Cost | 9000 | SAR |
Publisher’s Note: MDPI stays neutral with regard to jurisdictional claims in published maps and institutional affiliations. |
© 2022 by the authors. Licensee MDPI, Basel, Switzerland. This article is an open access article distributed under the terms and conditions of the Creative Commons Attribution (CC BY) license (https://creativecommons.org/licenses/by/4.0/).
Share and Cite
Melaibari, A.A.; Abdul-Aziz, A.M.; Abu-Hamdeh, N.H. Design and Optimization of a Backup Renewable Energy Station for Photovoltaic Hybrid System in the New Jeddah Industrial City. Sustainability 2022, 14, 17044. https://doi.org/10.3390/su142417044
Melaibari AA, Abdul-Aziz AM, Abu-Hamdeh NH. Design and Optimization of a Backup Renewable Energy Station for Photovoltaic Hybrid System in the New Jeddah Industrial City. Sustainability. 2022; 14(24):17044. https://doi.org/10.3390/su142417044
Chicago/Turabian StyleMelaibari, Ammar A., Abdullah M. Abdul-Aziz, and Nidal H. Abu-Hamdeh. 2022. "Design and Optimization of a Backup Renewable Energy Station for Photovoltaic Hybrid System in the New Jeddah Industrial City" Sustainability 14, no. 24: 17044. https://doi.org/10.3390/su142417044
APA StyleMelaibari, A. A., Abdul-Aziz, A. M., & Abu-Hamdeh, N. H. (2022). Design and Optimization of a Backup Renewable Energy Station for Photovoltaic Hybrid System in the New Jeddah Industrial City. Sustainability, 14(24), 17044. https://doi.org/10.3390/su142417044