Review

High Penetration of Solar Photovoltaic Structure on the Grid System Disruption: An Overview of Technology Advancement

by
Md. Shouquat Hossain
1,*,
Naseer Abboodi Madlool
2,
Ali Wadi Al-Fatlawi
2 and
Mamdouh El Haj Assad
3,*
1
Institute for Energy Research, Jiangsu University, Zhenjiang 212013, China
2
Department of Mechanical Engineering, Faculty of Engineering, University of Kufa, Najaf 540011, Iraq
3
Department of Sustainable and Renewable Energy Engineering, University of Sharjah, Sharjah 27272, United Arab Emirates
*
Authors to whom correspondence should be addressed.
Sustainability 2023, 15(2), 1174; https://doi.org/10.3390/su15021174
Submission received: 29 November 2022 / Revised: 31 December 2022 / Accepted: 6 January 2023 / Published: 8 January 2023

Abstract

:
Solar photovoltaic (PV) power generation is distinct from conventional power generation systems. It is vital to comprehend the effect of an expanded control system on solar PV generation. This article discusses the advancement made to the module, which is critical to PV and electric power systems, to achieve a high PV penetration in the smart grid system. The first zone initiates the solar power energizing transformation, which transfers a controlled energy load to a grid system. The descriptive subsections consider the accessibility of electronic inverters, solar PV energies, and grid concepts, as well as their realizability. As a result, a case study was considered, where various scientists around the world participated, discussion ensued, and future suggestions were made. Finally, practical conclusions were drawn from the investigations. This paper infers that the improvement of appropriate methods is fundamental to the viability and effectiveness of overseeing a high infiltration of PV inside low-voltage (LV) conveyance systems. This review provides an overview of the current state, effects, and unique difficulties associated with PV penetration in LV appropriation systems. Nonetheless, grid innovation is not well developed, and it requires continuous research from various rational aspects.

1. Introduction

The worldwide demand for energy, especially electrical energy, is continually expanding in tandem with time. Although petroleum-based energy sources are still abundantly available, global ecological concerns have been vehemently encouraging renewable energy sources. Among other sources of renewable energy, solar power, in particular photovoltaic energy, is the most promising sustainable source because it does not have both supply constraints and physical byproducts that cause an environmental hazard. It is anticipated that solar PV will be the highest supplier of power generation among all the foreseeable sustainable power sources by 2040 [1]. Along with the extensive PV establishment in solar power plants, private clients also contribute to residential rooftop systems. Single-stage rooftop photovoltaic (PV) systems are currently being installed and connected to low-voltage (LV) distribution systems. The sphere of PV infiltration is rapidly expanding in the LV dispersion arrangement every year. By definition: “A high penetration circumstance exists if extra endeavors can be incorporated to coordinate the scattered generators in an ideal way” [2]. The European Photovoltaic Industry Association (EPIA), announced in 2013, should achieve the target of 177 GW of energy at the end of 2014 [3]. The Australian Clean Energy Regulator (ACER) mentioned that Australia’s total solar PV installation surpassed 3.5 GW in 2014 [4].
However, the possibility of a huge number of PVs in the low-voltage circulation systems has not yet been seen while the systems are under construction. Such increased amounts of PV penetration in low-voltage appropriation systems might adjust the typical operating conduct of the circulation systems. While the majority of LV circulation systems are distributed, there is a nagging suspicion that powerful energy streams could exist between upstream high-voltage systems and downstream low-voltage systems. As the level of PV entrance in the LV dissemination system expands, the demand for the conveyance feeder decreases because a critical segment of power is privately provided by the introduced PVs, causing a higher voltage variety in LV appropriation systems [5]. Dispersed generation systems are particularly vulnerable to poor power quality issues such as voltage profile shifts and intensity stream inversions, both of which can occur within LV circulation systems [6]. However, a voltage imbalance will take place due to the unbalanced flow of current. This can happen due to the unbalanced impedances in the transposed distribution networks, or because there are not enough of them. This unbalance impedance and the inverting of the control stream will cause the voltage to increase in two stages and a drop in the third stage to prevent the possibility of harming electrical machinery [7]. Therefore, operational planning for energy storage systems is crucial in maximizing the flow of power through the grid when there is a high penetration of PV and numerous access points connected to the grid. Consequently, there will be an improved PV power’s peak-cutting ability and absorption capacity in the distribution network after that to support the efficient, secure, and safe operation of the power system [8,9].
The penetration of renewable energy in electric power systems is steadily rising. The effects of wind and solar energy on the grid are well known, and they have attained a high level of maturity [10]. However, high-penetration grid-connected photovoltaic (PV) systems can cause a reverse power flow, which could harm the safety, dependability, and financial performance of the distribution network, resulting in negative consequences such as voltage over-limits and increased power loss. These drawbacks can be successfully mitigated with reasonable energy storage optimization, allocation, and usage [11]. Wang et al. [11] solved the problem by using an improved particle swarm optimization algorithm and an energy storage optimization model to create a distribution network that takes into account PV and load power. Policies that promote the use of renewable energy sources enable nations to install more of them, and replace conventional energy sources like fossil fuels, catching up to with those that effectively use renewable energy, such as Germany and China [12,13,14]. Similarly, Husain et al. [15] described Malaysia’s transformation into a high-solar PV energy penetration country over a decade. However, Malaysia made a tremendous effort to join the group of nations with a high penetration of solar PV energy. In order to increase the PV hosting capacity for an off-grid remote industrial microgrid, Arit et al. [16] proposed a novel methodical and techno-economic approach that incorporates battery energy storage and takes grid disturbance and recovery into account.
With a high penetration of private rooftop photovoltaics in an environment of low load and high solar generation, a positive succession of overvoltage is observed in the LV conveyance systems. Solar generation at this level may cause the inverter to stumble, resulting in a potential loss of solar generation. Grid-connected PV has issues that may require setting limits on the amount of photovoltaic generation that can be stored in the LV conveyance systems. The variable voltage in LV circulation systems necessitates the use of some administrative devices. A survey reveals that the issue focused mainly on the PV yield depiction, a voltage quality issue caused by PV output discontinuity, and the effect of voltage issues in LV appropriation systems, yet, a topology investigation of various relief methods to solve voltage issues has not been conducted and methodically performed [17,18].
A photovoltaic (PV) installation is rapidly growing in popularity globally. Besides, the solar PV industry is rapidly expanding, with annual growth rates of more than 40% over the last decade [19]. Typically, a large number of solar photovoltaic control plants will be integrated into control systems at some point. The total limit of California’s proposed solar PV generation interconnection has exceeded over 9500 MW [20]. Many of the projected ventures are bigger than 500 MW, which requires a high-voltage transmission system [21]. Sunlight energy is converted into DC power by semiconductor solar cells, which are used to control solar PV control. The DC power is then recharged to the AC power system by electronic DC-to-AC inverters. By this means, they do not encounter the idleness phase, which commonly occurs in the nary synchronous generators. Their controlling characteristics govern the inverters’ dynamic behavior and connection to control systems. In addition, it is critical to understand how the increased penetration of solar PV generation into the control system impacts the power grid in order to determine its potential impact [22,23]. A few sources talk about how wind control infiltration affects the control system that does not have a lot of security [24,25]. However, when discussing the effect of solar photovoltaic generation on the control system, a lack of signal integrity is inconveniently accessible. The effect of solar PV generation area and infiltration level on the control system’s little signal strength is investigated in this paper. A modular investigation [26] has been performed to decide on the low recurrence motions’ recurrence, damping proportion, and mode state.
Many of these PV systems have been integrated with the low-voltage distribution grid due to the need for decentralized (distributed) power generation. The increased penetration of PV into the grid, on the other hand, presents its own set of challenges. Increasing levels of PV penetration frequently exacerbate the severity of these challenges. These challenges also affect the point of interconnection of PV systems on the grid and the state and type of legacy devices already installed on the grid. The proliferation of PV systems connected to the low voltage distribution grid necessitates a review of the challenges (both current and future) on the distribution of grid network systems with high PV penetration and some potential solutions to mitigate these challenges. This article will attempt to conduct a comprehensive topological analysis of various alleviation techniques, LV circulation systems, and power electronic inverter innovation in ongoing solar power generation. This paper also discusses the current state and effects of high PV penetration in controlled inverter innovations in detail. A thorough examination of the various topologies is provided, and the highlights of each technique are recognized as a sound foundation for future applications. In addition, a possible future research project to improve voltage issues in LV distribution systems with a lot of PV in them, is also shown.
The purpose of this paper is to present a comprehensive topology summary study of various mitigation methods that have been proposed in recent publications, stated with the basic definition of a solar PV system. The current state of affairs, as well as the effects of high PV penetration in LV distribution networks, are topics discussed as part of the review being conducted in this article. A comprehensive discussion of the various technology topologies is provided, and the advantageous characteristics of each method are pointed out in such a way as to provide a solid basis for applications in the future, providing some countries with real examples of solar panel deployment for maximum penetration and their technical framework for photovoltaic systems. Solar PV energy on the grid and the development of PV technology are also discussed. This study investigates the impact of large-scale penetration on transmission line power flow. Finally, a comparison study and a possible future recommendation of such a study are presented to further improve the voltage issues that occur in LV distribution networks that have a high percentage of PV penetration.

2. Solar PV System: An Overview

The solar PV system can be described as steady-state and dynamic modelling. A simple overview of the two models has been described below.

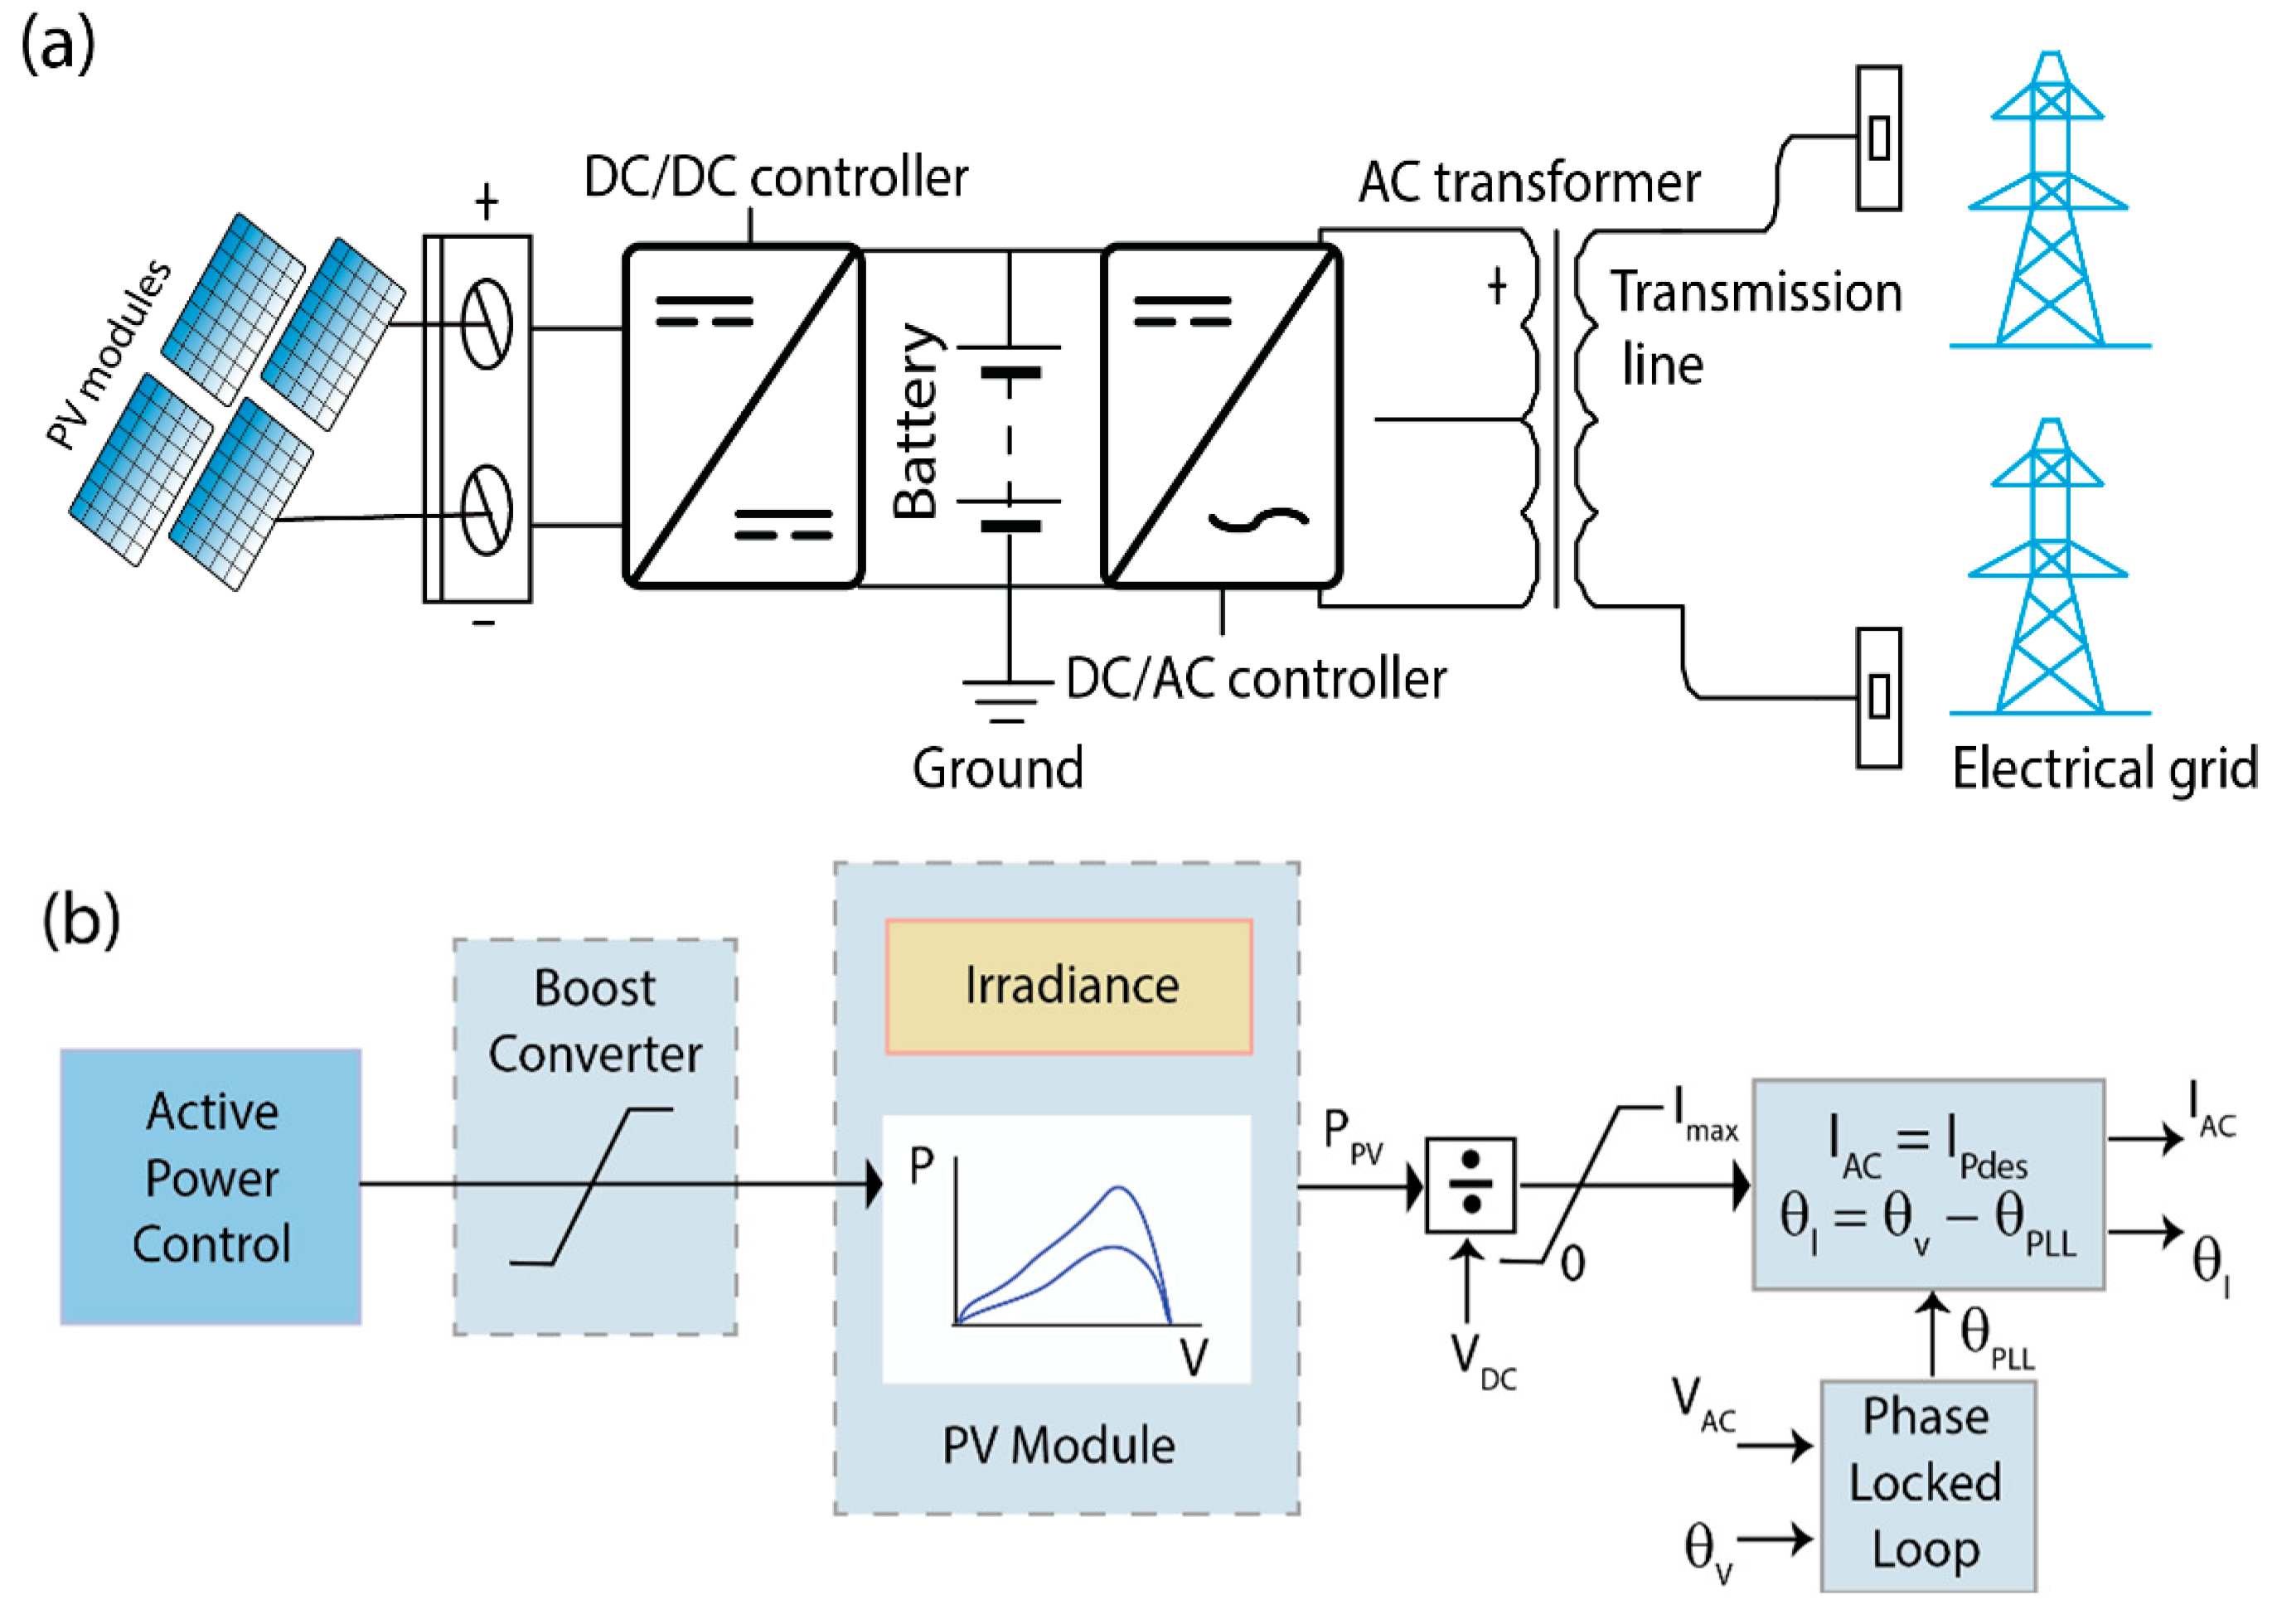
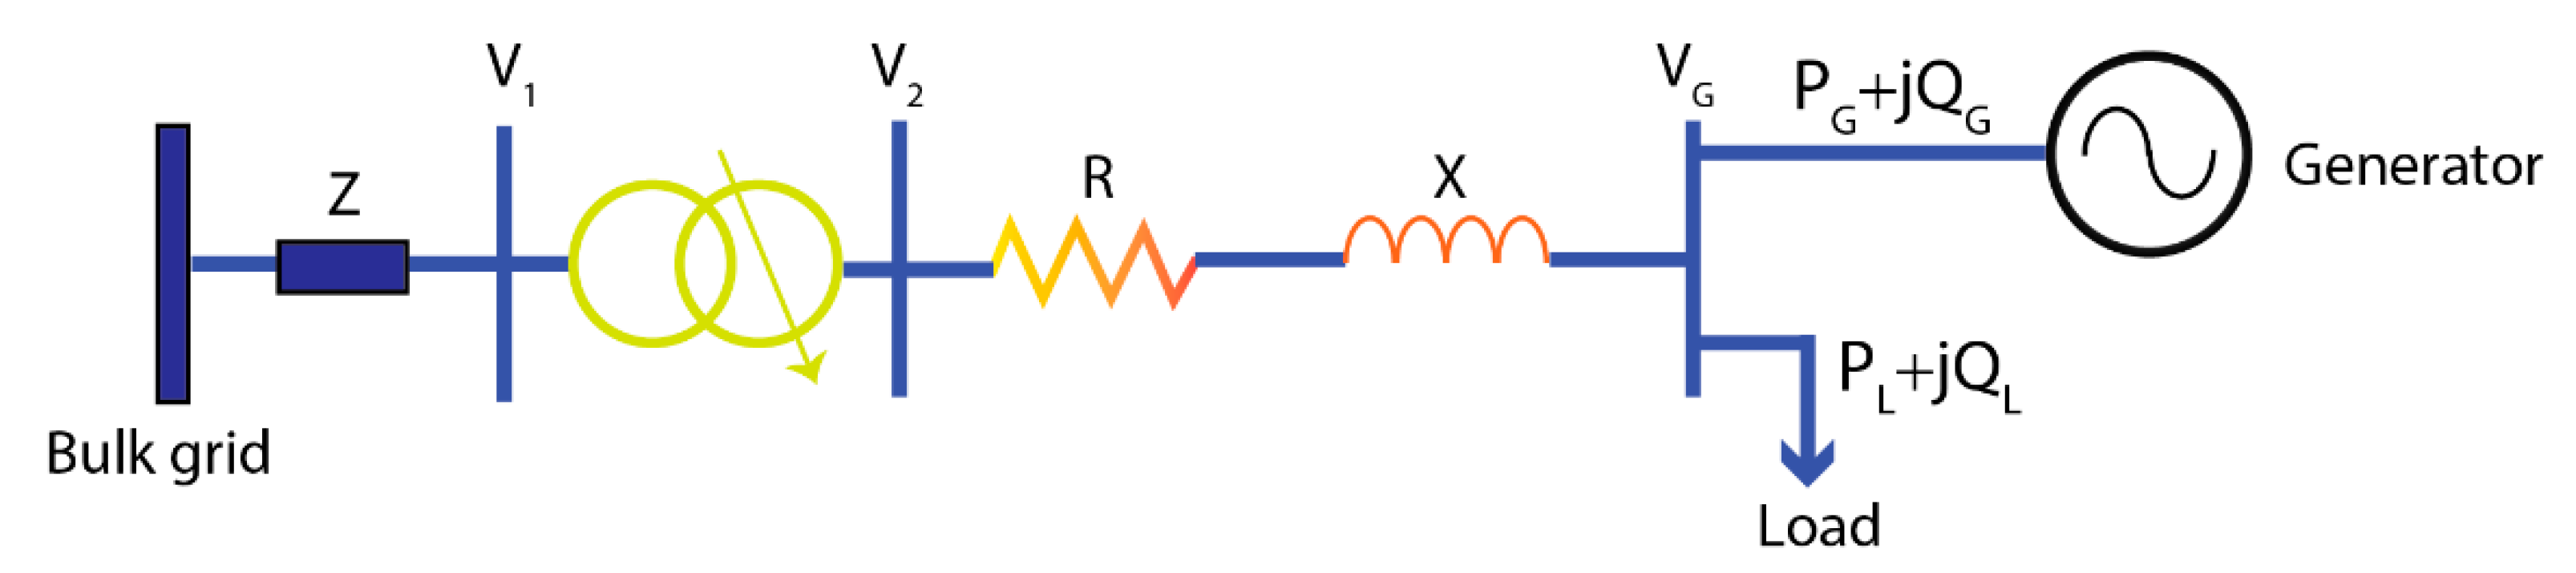
2.1. Steady-State Modelling

Numerous photovoltaic modules have been coupled with DC-to-AC power electronic inverters, which can be installed in solar PV plants. The detailed illustration of each DC-to-AC inverter with the associated solar PV modules is also incorporated into the solar PV farms. As can be viewed, the model consists of an equivalent pad-mounted transformer and a solar PV generator. Figure 1a shows a simplified model for most solar PV systems [27].
According to the IEEE 1547 2003 standard, the solar photovoltaic inverter “will not actively control the voltage at the point of common coupling (PCC)” [28] and that is why the majority of solar photovoltaic systems are designed to operate at a constant unity power factor, which is typically the real power [29]. The electronic power inverters generate reactive power in addition to the real power, and thus, to solve this challenge, solar PV arrays are designed to supply the real power inherently.
Figure 1. (a) Equivalent single-state and (b) PV generation model for a solar PV power plant [30].
Sustainability 15 01174 g001

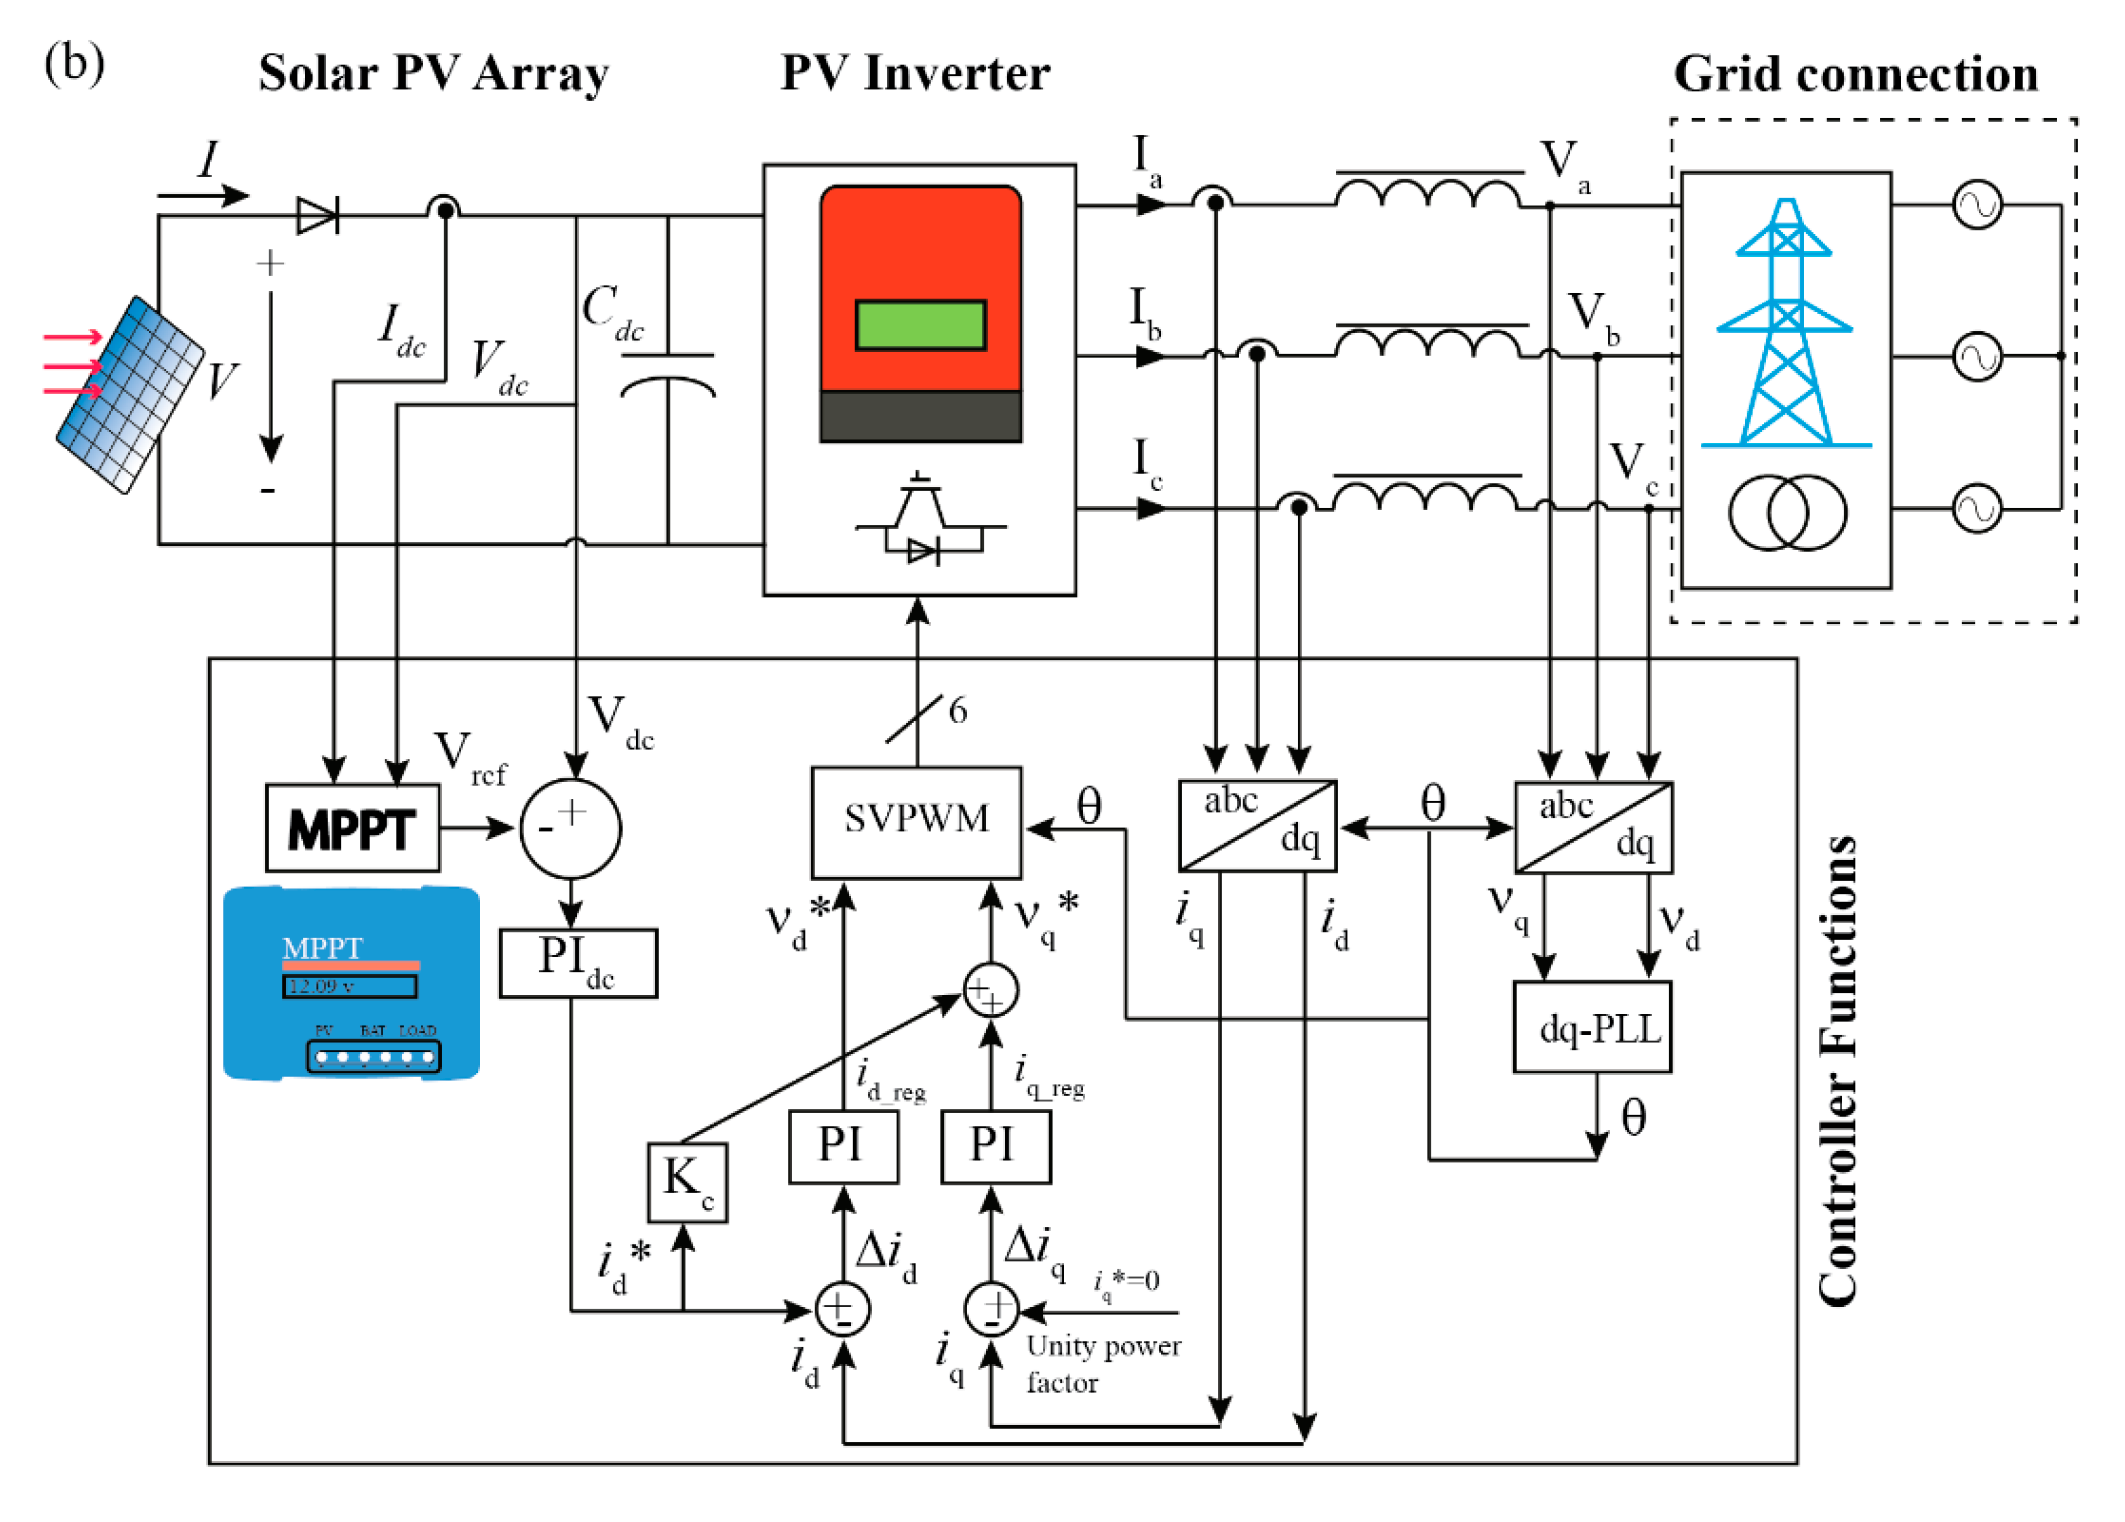
2.2. Dynamic Modelling

The dynamic simulation model has been combined with a PV power-generating system and steady-state modelling [27]. The block diagram in Figure 1b represents dynamic system modelling [30], which has the characteristics listed below:
(1)
To maximize the amount of real power extracted from photovoltaic modules, MPPT (maximum power point tracking) is used [31];
(2)
The power level of PV modules can be verified on the DC voltage and irradiation;
(3)
The inverter as a function of the fixed unity power operative factor;
(4)
The inverter mainly represents a current source;
(5)
The time delay circuit is the main property of an inverter for over-and under-frequency voltage tripping;
(6)
The phase-locked loop (PLL) [27].

3. High Levels of PV Penetration in LV Distribution Grids

Figure 2 shows a particular line diagram of an LV distribution grid [32,33]. As can be seen from the figure, the load side is connected to a distributed generator, and V2 represents the voltage on the substation’s secondary bus. The feeder line reactance is denoted by the symbol X, and the feeder resistance is denoted by the symbol R. Low-voltage distribution grids have a high R/X ratio and are naturally unbalanced. The high R/X ratio was chosen to ensure that power flows in a single direction, that is from a high upstream voltage to a low downstream voltage. This is primarily due to asymmetry in load currents and mismatched feeder impedances, which leads to an irregular voltage level in each phase. As a result, LV distribution grids may face technical challenges as a result of the high number of solar PV panels installed on residential rooftops, deteriorating the situation, and resulting in poor power quality.
This article has discussed the potential difficulties associated with older LV distribution networks, found in the study conducted in [5,34], wherein the effects of disseminated asset combination on distribution networks have been discussed in the aspects of voltage issues, assurance issues, and system issues. The effects of asset combination on distribution grids are critical in terms of voltage issues, assurance issues, and system issues, which were accounted for as significant effects [6]. An overvoltage occurs due to the mismatch with the neighborhoods partaking in the same delivery transformer. PV installations have various influences on the LV distribution networks, particularly in inverted power streams, voltage rise and oscillations, responsive power variances, and increments in power loss [35].

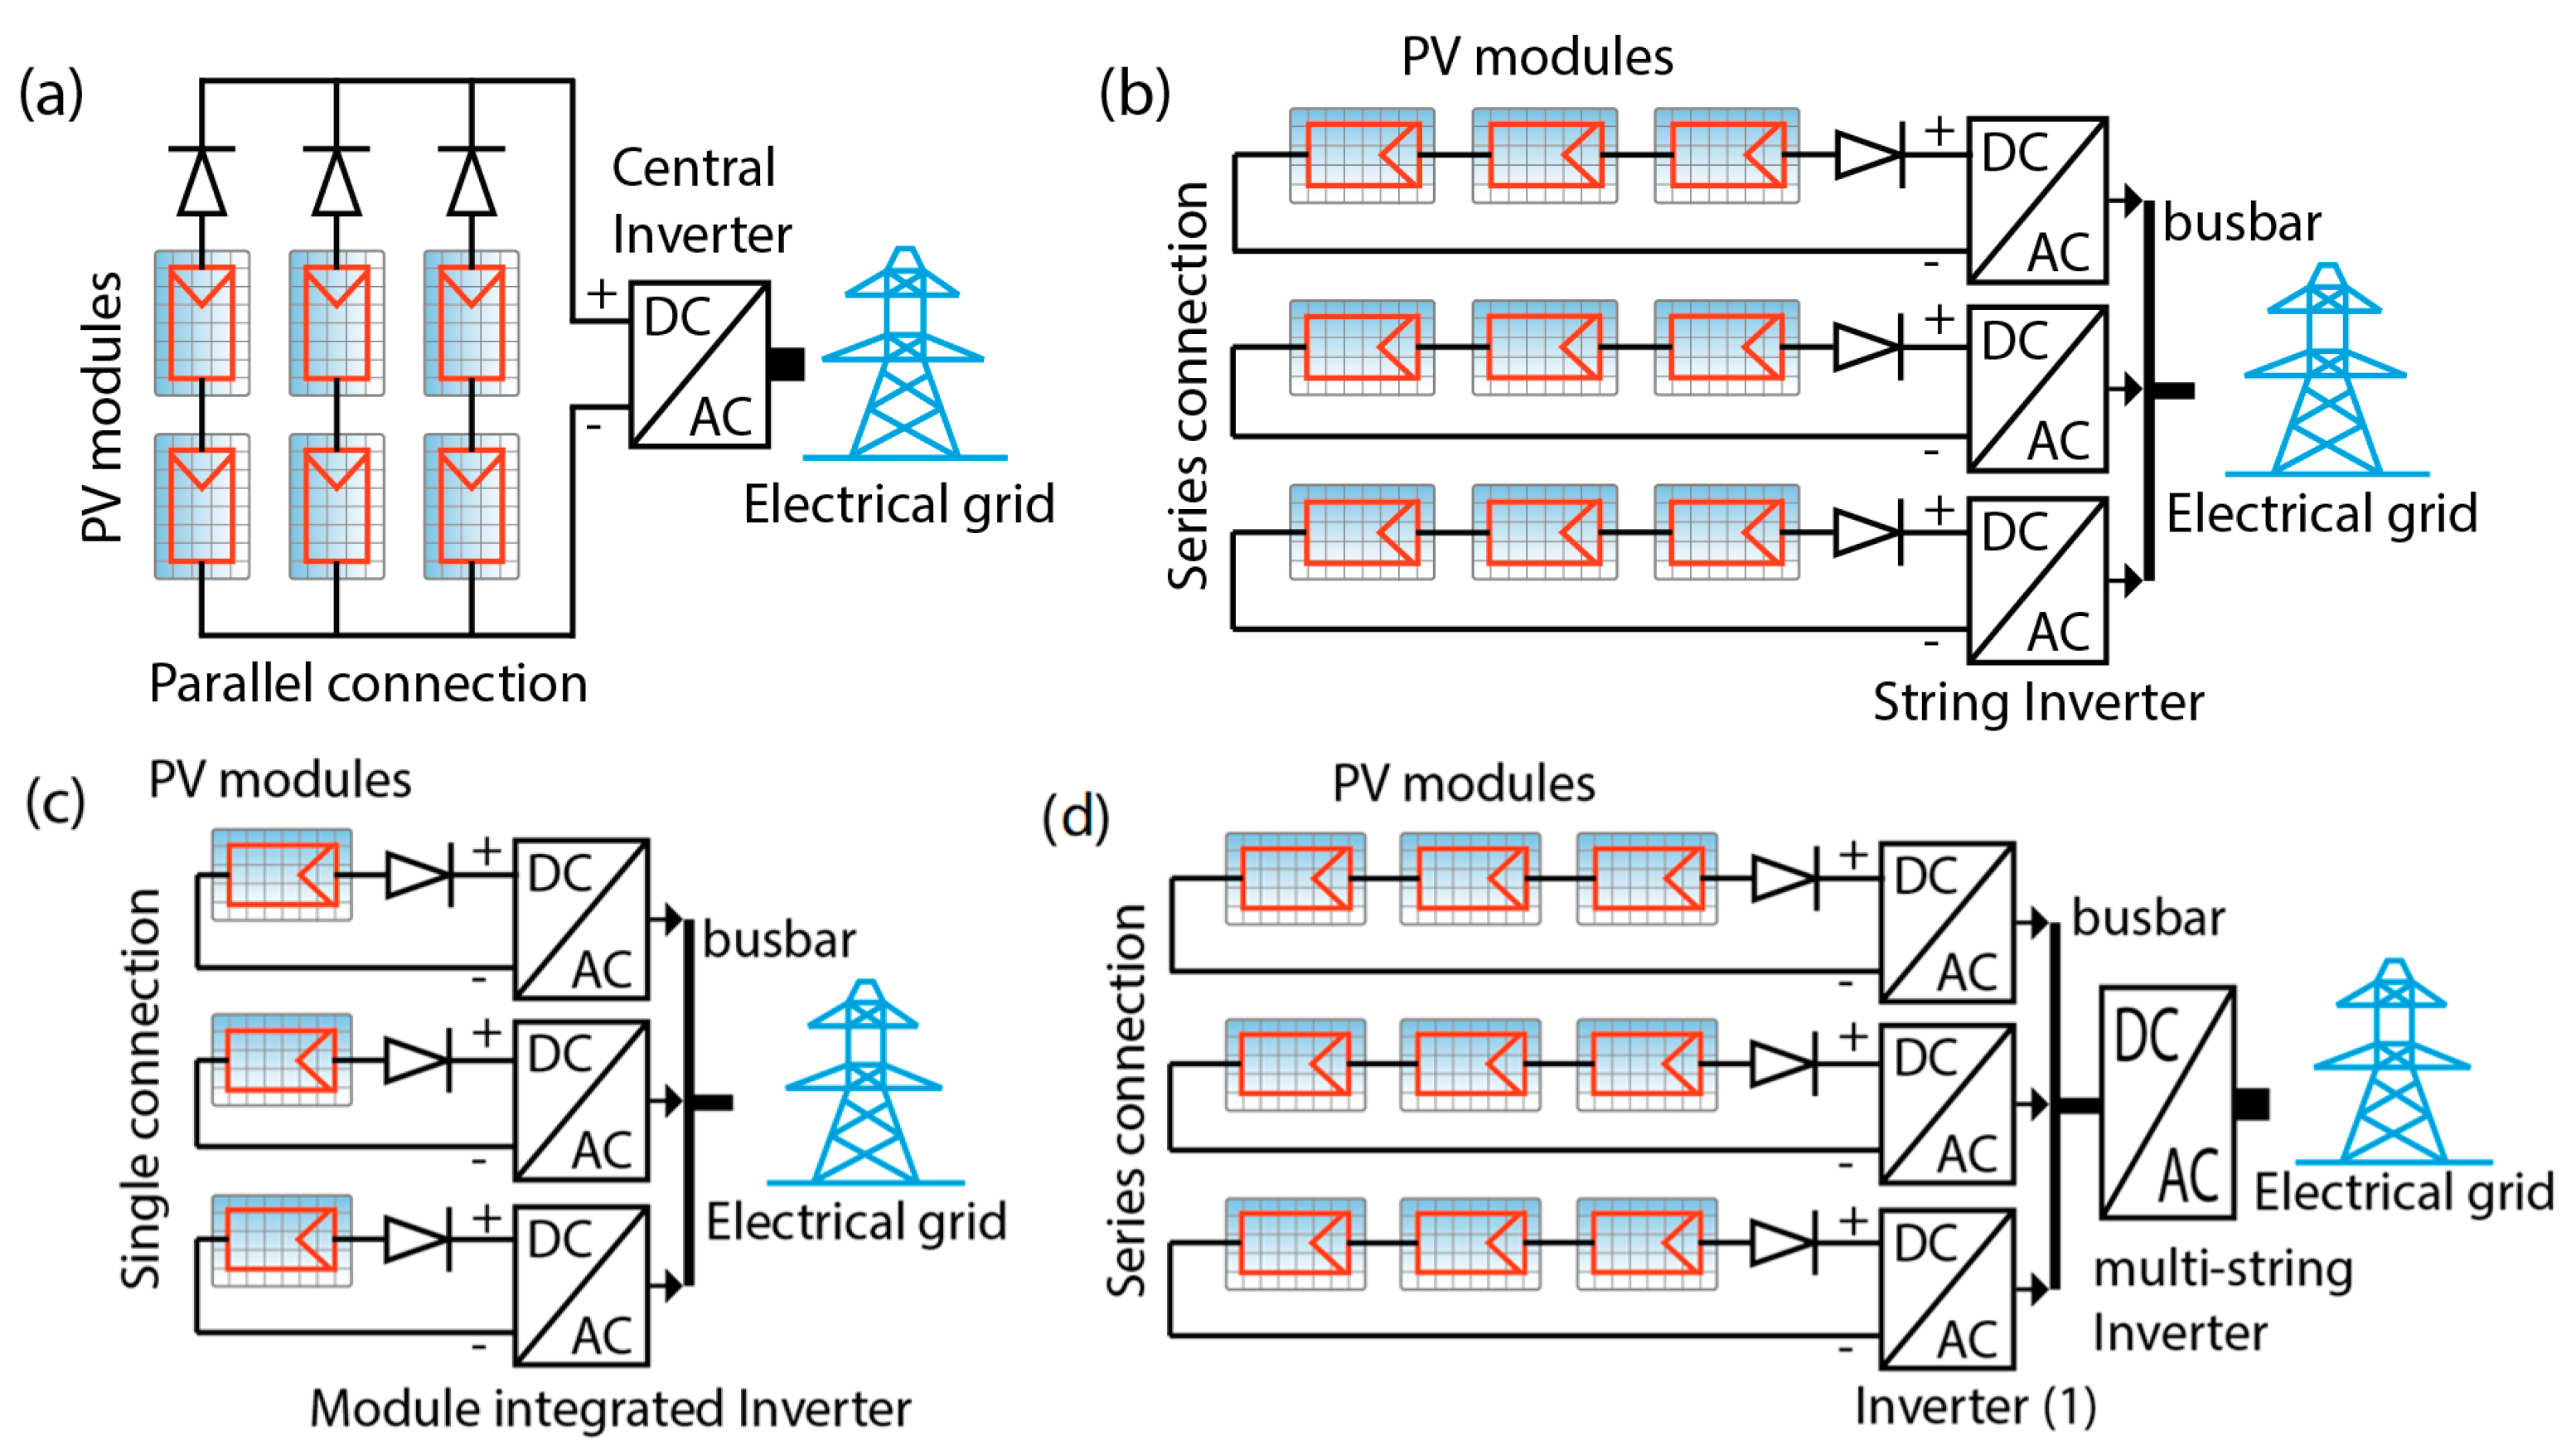
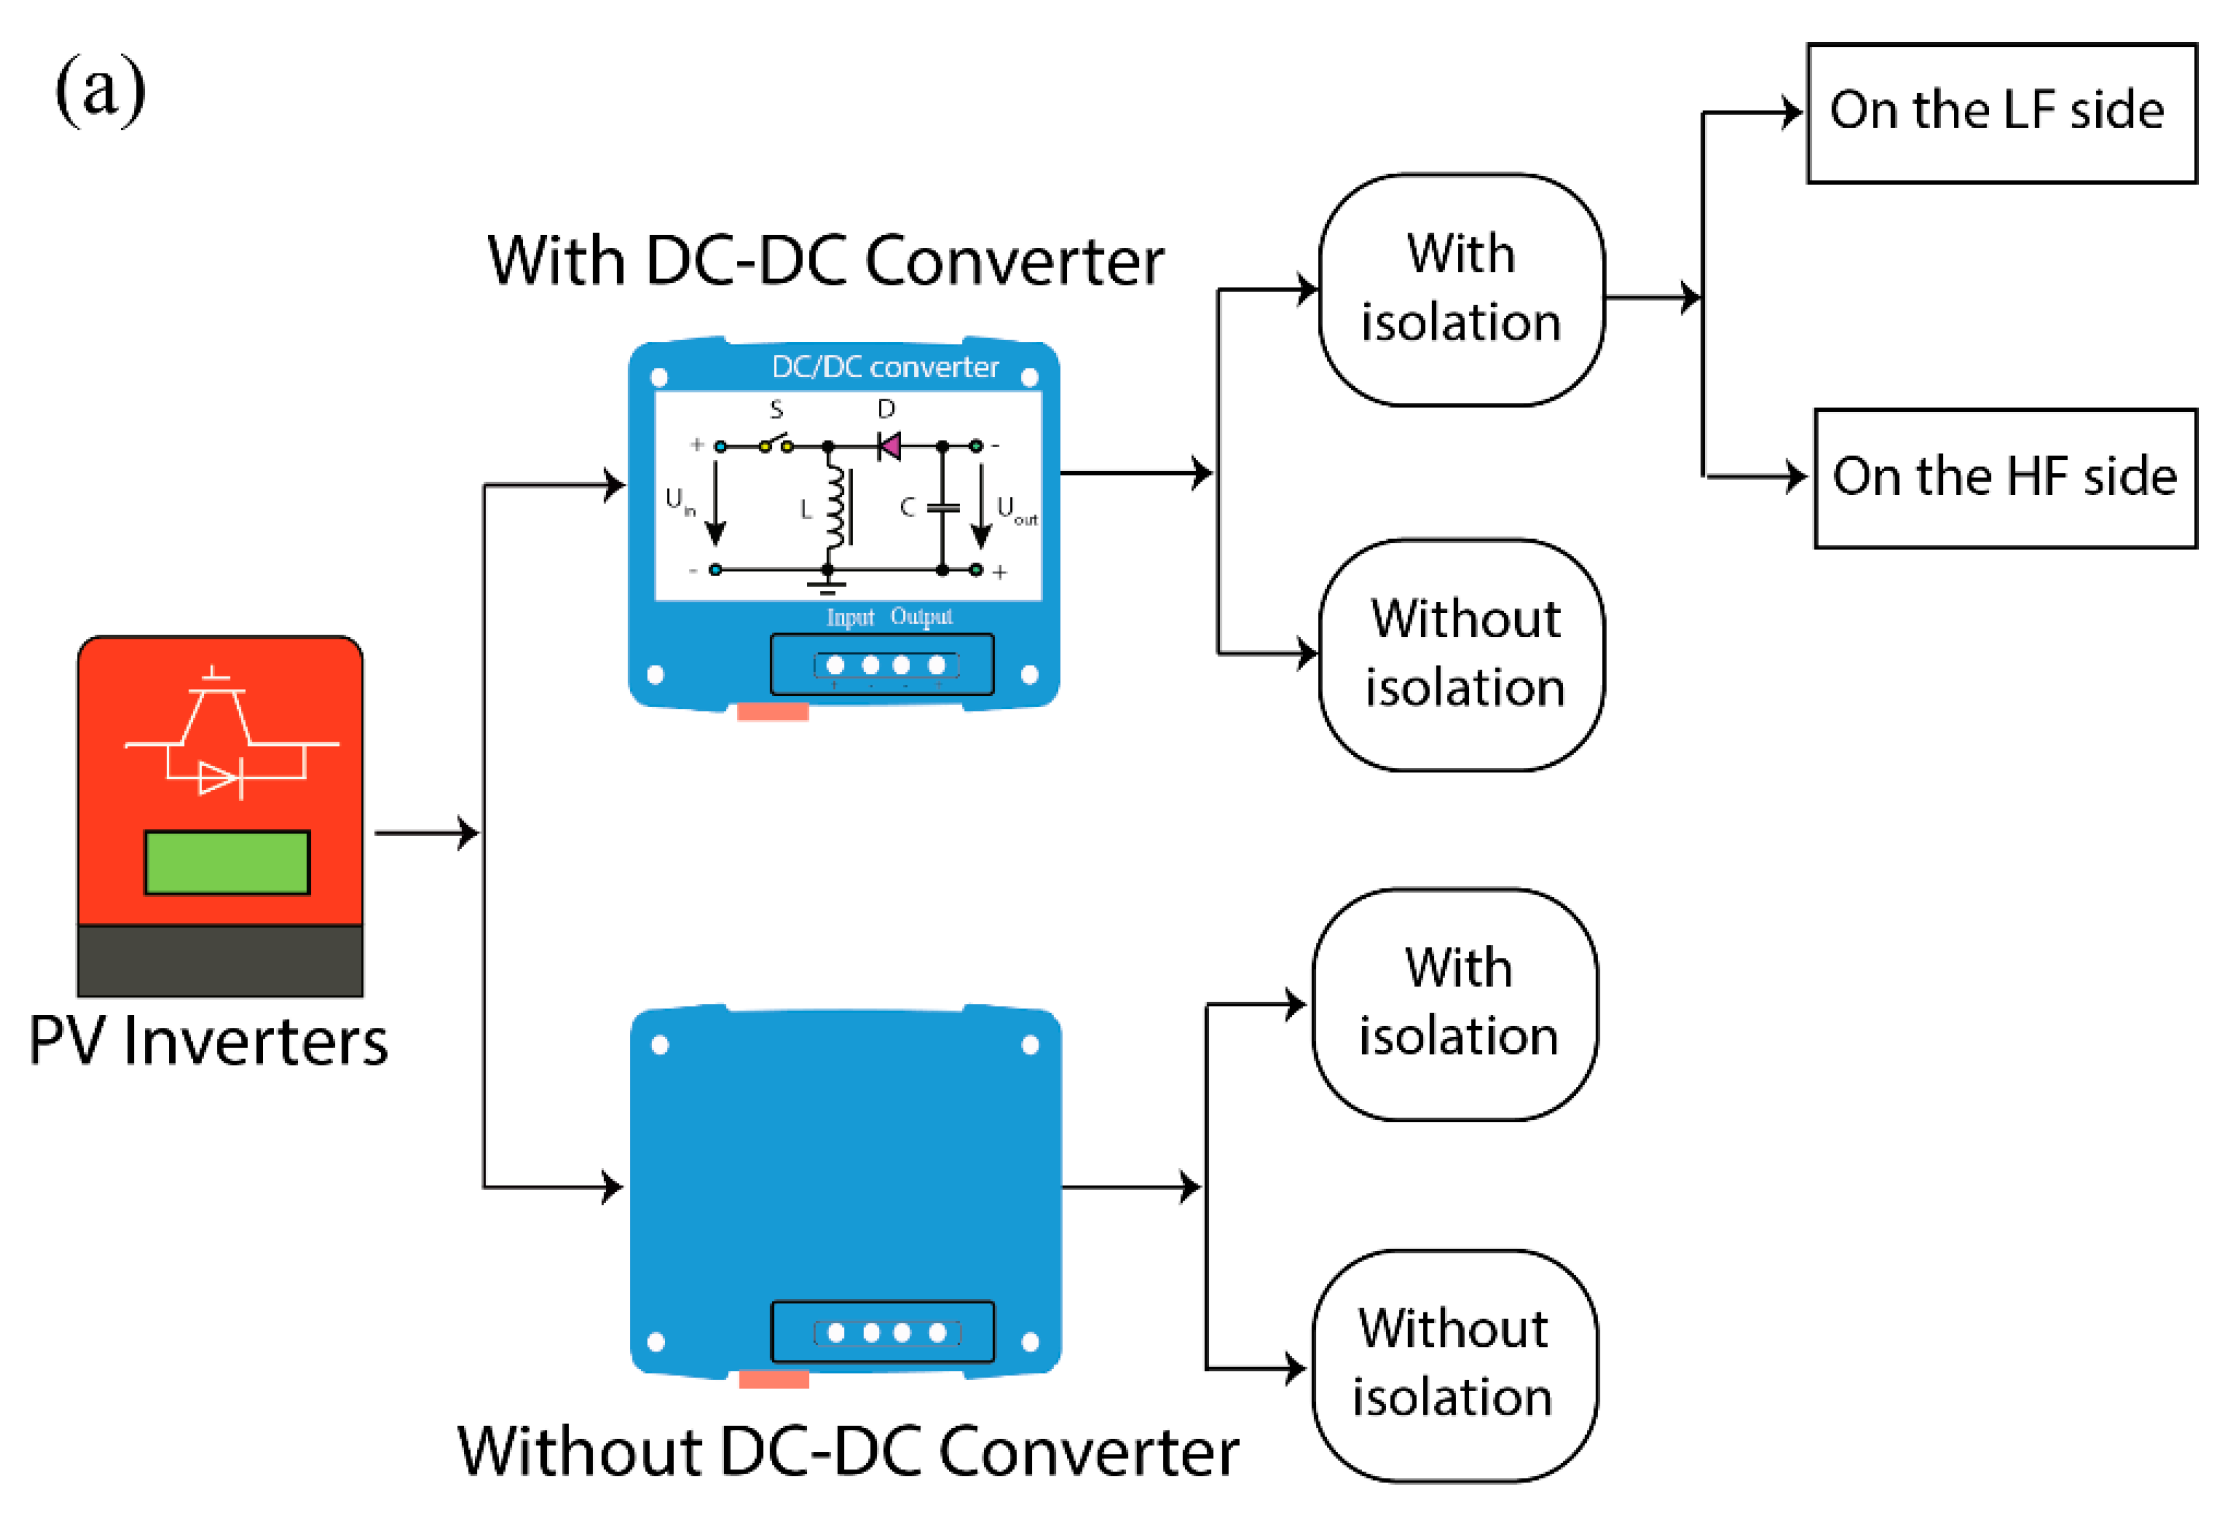
3.1. Technical Features of PV Grid-Connected Inverter

(A) 
Main circuit structure
The PV grid-connected systems can be classified into four types by the combination of modules, which include central inverter as shown in Figure 3a, string inverter as illustrated in Figure 3b, module integrated inverter as shown in Figure 3c, and multi-string inverter as illustrated in Figure 3d [36,37].
In the central inverter, the PV plant is coordinated with a number of parallel sequences associated with a solitary central inverter on the DC side. However, any trouble encountered by the central inverter will subsequently cause a breakdown of the entire system. The string inverter separates the PV plant into a few parallel strings, and every PV string is deployed to an assigned inverter that is associated with the lattice on the AC side, which acts as a discrete MPPT on each photovoltaic string. This increases energy production by minimizing shading losses, which increases the energy yield and improves supply reliability. The string inverter’s application zone uses only a small amount of power (2–3 kW) from single-stage lattice-associated systems. The module-coordinated inverter, which utilizes one inverter for every module, is the advancement of the string inverter. Since each module has its MPP tracker, this topology ensures that the inverter is adaptable to the PV attributes. Module-coordinated inverters have more extensive AC-side cabling, since each module must be connected to an AC grid. Although its support is very confusing, particularly for veneer-incorporated PV systems, it can be utilized for PV plants of around 50–400 Wp [38].
Another advancement of the string inverter innovation is the multistage inverter. It permits the association of a few string inverters with isolated Tracking systems for MPPs (employing a DC/AC converter) with a typical DC/AC inverter [39]. Therefore, a compact and economical arrangement will consolidate the benefits of the central and string inverter advances. This multi-string inverter topology permits the mixture of the PV string inverters of various advancements and different introductions (south, north, west, and east). These attributes permit time-oriented solar power, which independently upgrades each string inverter’s task efficiency. This inverter mechanism has been developed as a standard feature in the PV system innovation of grid-associated PV plants.
Conventionally, a PV topology is classified under two closely associated classes: namely, PV inverters with a DC/DC converter and PV inverters without a DC/DC converter. As shown in Figure 4a, there are diverse power designs. The algorithm of the first category is easier than that of the second, but the structure is more complex with lower efficiency. It is conceivable to maintain a strategic distance from the completed work with a DC/AC converter due to the possession of more panels in the arrangement and lower grid voltage. Thus, a solitary-stage PV inverter can be utilized, prompting higher effectiveness. From a safety point of view, an isolation transformer is required by electrical standards when a PV system is connected to the grid [36]. Besides, the choice of an isolation transformer can also regulate the output voltage so that the DC bus voltage can possess a wide input range, after which the request of the venue can then optimize the design of the photovoltaic array.
(B) 
Control Strategy
The normal operation of a PV grid-connected inverter relies on effective control strategies, which are divided into three areas: namely, maximum power point tracking, grid-connected current control, and islanding effect detecting and dealing.
The output characteristics of PV arrays are non-linear and are influenced by irradiation, temperature, and load conditions. In a certain irradiation and temperature situation, only one voltage value corresponds to the maximum output power. Therefore, the MPPT is used to control and adjust the PV cell’s operation point based on external characteristics, such as irradiation, temperature, etc., to enable the PV arrays to always work at the maximum power point. The current methods that are commonly used include the constant voltage method, perturbation, and observation method, incremental conductance method, etc. As the voltage of the MPP changes in a narrow scope under different working conditions, the PV array output voltage can be stabilized at the voltage of the nominal MPP. The advantage of this method is simple, but when irradiation or temperature changes, the MPP shifts accordingly and, as a result, causes a power loss [40].
Since the ratio of the voltage of the MPP to the open-circuit voltage of PV arrays is nearly constant, a small PV module, which has the same characteristics as the PV arrays, is arranged next to the arrays. By detecting its open-circuit voltage and multiplying it with a proportionality coefficient, the voltage of the MPP can be computed. This method can improve the efficiency of the MPPT, and its cost similar to that of the traditional constant voltage method. The perturbation and observation method periodically adjusts the output voltage and observes how the output power changes in order to find the maximum power point through a repeated fine-tuning strategy. The advantage of this method is its simplified structure and a few measurement parameters. However, the power loss may increase due to the nearness of the oscillation to the maximum power point. Furthermore, the initial voltage value and step length have a great impact on the tracking precision and convergence speed, especially when there is a rapid change in the environment, which may affect the proper functioning of the method [41].
The main function of the PV grid-connected systems is to transform the DC power created by the PV arrays into AC power with the same voltage and frequency as those of the grid. As a result, the control method is the same as the current PWM inverter synchronizing with the grid. The harmonics of the input current are to be reduced as low as possible in order to minimize its impact on the grid. The controlling effect is just like a current source whose power factor is 1 with the principle flowing chart, as shown in Figure 4b.
The VS-PWM inverter is applied in speed adjustment of an AC motor drive, active filters, PWM rectifiers, uninterruptable power supply (UPS), and high-performance PV grid-connected systems, and they all have a current feedback control loop feature. Thus, the performance of the inverters mainly relies on the current control strategy. Compared with a traditional open-loop VS-PWM inverter, a current source PWM inverter can reduce the output voltage and current ripple effectively and lower the total harmonic distortion rate.
The PV system connected directly to a power grid should have perfect protective measures. The islanding effect occurs when grid power is interrupted for some reason. Consequently, the PV grid-connected system fails to detect it and continues working. Hence, this leads the PV system and its load to form a power island that the electric power companies have no control over. The islanding effect brings a potential safety hazard, and it is forbidden for the maintenance of power quality and safety. At the moment, there are several effective methods for detecting the islanding effect, such as the active frequency shift, active phase shift, reactive power compensation, etc. [42]. The detection technique of islanding can be carried out in two different approaches, which are: one, to study detection indexes, i.e., defining more effective measurement parameters as the evidence of power interruption that includes voltage, frequency, phase, waveform distortion, changes in load impedance, etc.; and two, to improve judgment methods, and when the detection indexes of power interruption are enough, it can evolve into intelligent control, positive feedback of active power or positive feedback of reactive power methods, etc., based on the empirical law in order to detect islanding rapidly.

3.1.1. Solar Panel Deployment for Maximum Penetration

The declining cost of solar photovoltaic (PV) generated energy has resulted in a rapid increase in the configuration of PV plants, with projections that PV plants will play a significant role in the future of the United States’ electricity establishments. Solar energy generation has a high penetration level, and expanded grid adaptability is expected to completely use the variable and questionable yield from the PV power generation, which will eventually shift solar energy generation to a more popular period or lessen the solar yield [43,44].
Various investigations have identified the benefits and challenges of large-scale PV penetration [45,46]. At a low infiltration level, a PV regularly uproots the most expensive cost of power sources of generation and may likewise give the system an abnormal amount of solid capacity [47,48]. Figure 5 gives a recreated system transmission to a solitary California summer day with PV infiltration levels from 0% to 10% (on an annual premise), which shows how the PV uproots the most astounding cost of power generation and a decrease in the requirement for topping capacity due to its fortuitous dependability with request designs [49].
This example shows us the estimation of a PV capacity drops at a genuinely low penetration (on an energy premise). The typical load of the short PV maintains the same infiltration bends with 6% and 10% infiltration respectively as shown in Figure 5. The net load in Figure 5 is the bend at the highest point of the “Gas Turbine” region. After this point, the PV does not indicate significant measures of firm capacity to the system. A few extra difficulties occur in the financial organization of solar PV, which usually happens due to an increase in the infiltration level [49].
However, Hawaii drives the country to infiltrate private rooftop solar PV systems. As a result, it is at the forefront of the challenges of reconciling high levels of solar PV penetration. Meanwhile, Hawaii has been on track to become a world leader in the use of solar PV assets, both on a dispersed and utility-scale since 2017, with installed solar PV capacity infiltration levels exceeding 75% of normal daytime net system loads on a few island electric grids [51]. Table 1 shows the distribution circuit circulated generation (DG) infiltration levels in Hawaii’s PV industry [46].
Incorporating a distributed power generation of any kind, including the DGPV, can increase the local distribution system voltage, which will potentially result in overvoltage violations, as shown in Figure 6a. The utility voltage regulation equipment (e.g., a tap-changing voltage regulator), originally installed to manage a voltage drop on a long feeder, can also manage this increase in voltage only if properly configured to handle the bidirectional power flows as shown in Figure 6b. However, this can increase operations of utility regulation equipment and may not be sufficient for a very high DGPV penetration [52].
We suggest advanced (or “smart”) inverters, which can give utility-bolster highlights, for example, voltage bolster improves recurrence and voltage ride-through, and a large group of self-ruling and remotely controlled efficacy. This report is accessible at no cost from the laboratory for Renewable Energy Technologies in the United States (NREL) controllable capacities. A significant number of these propelled inverter capacities are portrayed in more detail in the Electric Power Research Institute’s literature on Common Functions in Version 3 Smart Inverters. Specifically, the powerful hardware inside the present-day PV inverters can be utilized to adjust voltage challenges from disseminated power generation by moving the staging point of their sinusoidal current yield to ingest (or infuse) receptive power as shown in Figure 7. However, as described below, before 2014, the U.S. interconnection standards required a DGPV that acted as a passive grid participant by not actively managing voltage 7 and by tripping offline during unpredictable grid disturbances.
Despite these confinements since in the year 2010, the availability of “advanced” inverters has increased dramatically, including PV inverters due to the universal prerequisites [46]. Today, inverters could be obtained off the rack in the United States and are likely to have numerous projected capacities worked in, even though these highlights might be stashed away or covered up in the U.S. markets. Previous studies have shown that the best inverters can solve voltage problems and that 25% to 100% of more PV can be used for advanced receptive power controls. For example, volt/volt-ampere reactive (VAR) and consistent power factor (PF) [54,55,56].

3.1.2. Technical Framework for Photovoltaic System Interconnection

In the United States, the IEEE 1547 Standard for Interconnecting Distributed Resources with Electric Power Systems is the most frequently used technical requirements specification document for the interconnection of distribution-connected photovoltaic systems. IEEE 1547 talks about the technical requirements for interconnecting at the point where the distributed resource is connected. When we have a PV system, this is usually the low side of a transformer that is owned by the utility. IEEE 1547 has recently been in development [57]. The amendment contemplates changes to the technical requirements for active regulation of the point of standard coupling voltage, over-and under-voltage trip levels and times, and over-and under-frequency trip levels and times [58].

3.2. Required Control Capabilities by Photovoltaic Systems

According to IEEE 1547, distribution-connected photovoltaic systems must incorporate a significant amount of autonomous control in order to operate in coordination with the rest of the electrical power system. When there is a local utility island formed, these controls include undervoltage and overvoltage trip points and times, as well as under and over-frequency trip points. The inverter must also be disconnected from the utility for two seconds when the island is formed. IEEE 1547 does not say how these controls are supposed to work. Instead, it specified how well the whole system should work at the point of common coupling. In addition to IEEE 1547 requirements, some US utilities have demanded additional control capabilities, particularly for some PV systems. For example, the ability of the interconnected utility to remotely turn off or curtail the PV system’s real power output [57,59].

4. High Penetration Renewable Energy

The PV penetration in Spain represents an unobtrusive power market share of about 3.1–3.2% as compared to the 7–8% share in the case of other European nations such as Greece, Italy, and Germany [59]. However, Spain’s power system has been short on money for the last decade [60]. That is why additional costs are being controlled in contrast to the rapid expansion of photovoltaic installations in Spain [61].
Solar innovation has advanced significantly and it is now critical to improve management performance and understand the impact of those plants on the grid, as well as the result of real PV’s high penetration levels in conveyance systems. The potential consequences of high levels of photovoltaic penetration are discussed in [62]. The development of this renewable power source could be a very important part of it [63].
Spain has set a goal to alleviate the potential impacts of the PV plants on the dispersed orientation concept. The low-voltage side of the substation’s 300 A/60 A and 22 kV/110 V transformer streams were connected to a PQ analyzer on top 1000. Similarly, after a PV system’s general switch, the PCC should conduct an estimation (see Figure 8). The PQ analyzer has eight channels for quantifying the number of streams and voltages. However, it is connected to a four-wire system with unbiased voltage/present and an impartial basic connection to the ground directly.
As a result of Spain’s limited ability to connect to neighboring countries, the country’s power grid can be considered a partial island. When variable renewable energy sources (mainly wind) began to develop over the last decade, we found out that two important aspects of the system operation were developed [58], which are:
The Red Electrica de Espana transmission system operator’s (TSO’s) grid codes and operational procedures (POs) [64];
Since 2006, the Control Centre for Renewable Energy (CECRE) has been in operation. CECRE is regarded as a world-first initiative for monitoring and controlling renewable energy plants, particularly wind farms [65].

4.1. Renewable Energy Penetration in France

Following the EU Directive 2009/28/EU, France has set a target to utilize 23% of its sustainable power source in end energy utilization and 27% of renewable power in 2020 [66]. Under this directive, the legislature of France chose to restrict the atomic energy capacity to half in 2025. To guarantee energy sustainability, the French government and other energy investing sectors are investing more in sustainable power development.
Grid associated with Higher Renewable Energy Source (HRES), as shown in Figure 9a, contains a few direct grid (DG) segments, that work in conjunction with the grid or capacity modules [67]. The HRES could be a suitable choice to achieve the sustainable power goal of the French government. However, the hybrid system is being planned as a system of various appropriate parts, such as PV plants, hydro turbines, grids, converters, electrolyzers, and an H2 stockpiling tank. The techno-monetary components of these segments are vital to acquire the relevant favorable reenactment to be proclaimed decisively, as shown in Figure 9a.
It is found that the well-coordinated establishment of solar photovoltaic (PV) plants reduces over 43% of the power loss in the place of business from the utility grid. Additionally, the PV/Grid system that meets the collective demand has a per-unit cost of power that is approximately 10% less than the utility grid levy.

4.2. PV System and High Penetration

The solar PV rooftop system of solar power production is shown in Figure 9b. This photovoltaic system generates energy via a DC (Direct Current) photovoltaic cluster and stores it via a DC battery (see Table 2), which also includes an inverter for switching power between direct current and alternating current since the grid and load are in the alternating current phase, which is contrary to a standard photovoltaic cluster. The discourse on the test system is explained in HOMER programming. To use HOMER, you need to have a model with inputs. This model tells you about technology options, costs, and resources [68]. These inputs are used by HOMER to investigate different system configurations or combinations of parts. It comes up with a list of possible configurations that can be sorted by their net present value. HOMER also shows simulation results in a wide range of tables and graphs that make it easier to compare different configurations and judge them for their economic and technical merits, as well [69].
For the PV system in the major urban areas, about a 10% to 20% increase in cost is most likely to be encountered between 2030 and 2050 atmospheric variable characteristics. We discovered that the Hoba system has the most effective techno-financial performance in conjunction with the least operational cost but a higher inexhaustible energy source in both the prevailing and the future atmospheric characteristics. In the short to medium term, it is highly necessary to hybridize renewable energy sources, which will start at a minimum infiltration in Australia’s west, the Northern Territory, and Queensland, with up to a conceivable 150 MW to 200 MW of accessible renewable opportunities, as shown in Figure 10a. With the decrease in innovation costs over time, there may be a potential for higher infiltrations of renewable energy sources as assurance and interest for more remote energy development grow. This could result in an additional 850 MW of off-grid renewable energy capacity, for a total of more than 1 GW [71].
As the infiltration of sustainable renewable power sources increases, a different empowering mechanism must be put into practice to guarantee the strength of the power system. These incorporate mechanisms and controls for energy stockpiling and stack administration, among others. With all the related solar energy in fractures considered, these innovations will fundamentally increase the cost of the ventures, as well as empower a bigger decrease in fuel usage than would otherwise be conceivable. Nonetheless, due to the imaginative concept, the utilization of these advancements will, as a rule, require some administrative backup or different motivators, for example, the ARENA’s RAR program. The gap between what is written down as possible PV applications, and what is installed, is still very big. When solar and wind became more economically viable, the Australian Renewable Energy Agency (ARENA) started the Regional Australia’s Renewables (RAR) program in 2013 [72]. The RAR program started because many parts of regional Australia thought that these technologies were now cost-competitive with other energy sources.
The penetration level and working reasoning of the energy stockpiling impacts the innovation choice. There are various advanced energy stockpiling mechanisms, ranging from batteries and capacitors to mechanical technological interactions. For example, flywheels or hydro pumps. Figure 10b depicts a concise outline of the practicality of some energy stockpiling advancements [71].
Figure 10. (a) The estimated market size of the off-grid renewables and (b) various grid-scale energy storage technologies [71,73].
Sustainability 15 01174 g010

4.3. Solar PV Energy on the Grid

The power yield from Solar PV Energy innovation is to a great extent and it is subjected to the irradiance levels (solar irradiance), which is a fluctuating asset and subsequently cannot be pragmatically controlled. The establishment of the system associated with Solar PV innovation introduces a test on the System Operator (SO) and Distribution Grid Operator (DNO), including their advantages as well as disadvantages. The electrical grid capacities for supplying loads through halfway power plant installation and transmission of generated power supply should be exhaustively verified. These grids are prognostically planned, and the associated works have to be meticulously organized to allow the flow of the unidirectional stream of power from the transmission grid to consumers using power distribution networks. In the UK, the urban distribution is comprised of 11 kV or 33 kV medium voltage (MV) allocation that provides 400 V of low voltage (LV) that utilizes an advanced stepdown transformer (i.e., MV/LV distribution transformers). Contingent upon the different power demands, individual customers are provided with a single-stage or 3-stages facility. The excess power spilling out of the medium voltage will be channeled to a low-voltage facility. It is essential to take note that these grids are intended to keep the reduction in the voltage to an allowable extent without overloading the segments [74].
The approximate yield of a regular UK local grid associated with the photovoltaic system is located in the vicinity of two or three (1 to 5) kW [75], given the normally accessible space on the rooftop of private housekeeping in tandem with the system proficiency. When there is a dynamic load inside the building, the daily PV power yield increases, and any excess power is transferred to the general lattice for further transmission. The proximity of high penetration of GCPV systems in a low voltage distribution environment within a small region, usually referred to in the future as bunched, may affect the power quality of the current distribution system [76]. In this situation, the principal issue is that the PV system will send out dynamic power to the grid, which can bring about an overvoltage incident, as shown in Figure 11a.
Real information for both the system and the run-of-the-mill house load profile has been utilized to assemble a practical model to survey the effect of various penetration levels of the associated PV systems. Figure 11a,b show an example of PV voltage rising at the panels with a low voltage distribution grid. This system is maintained by a 500 MVA critical substation that consists of two 33/11 kV 20 MVA transformers that supply six 11 kV active feeders, each of which supplies eight 11/0.4 kV substations. Each 11/0.4 kV substation services 384 distributed properties via four active spiral feeders. The system provides 18,432 properties in total. With the end goal of increasing inspection efficiency in mind, a single 400 V feeder, its associated loads, and GCPV systems were demonstrated in detail. Simultaneously, the remainder of the load was disentangled as a lumped load. The schematic graph of this system is shown in Figure 11b.
South-West England (SWE) is a region in the United Kingdom that serves approximately 1.5 million electric power consumers. This region has the highest concentration of photovoltaic (PV) installations. Hence, it is necessary to introduce more significant effects on the PV power generation establishments than any other power generation system zones [77]. The territory is divided into 1888 Lower Layer Super Output Areas (LSOAs) that are utilized as land units [21]. LSOAs are spatial territories that contain about 600 domestic units, planned by the Office of National Statistics (ONS) to describe the financial attributes of the UK. For each LSOA, an integral informational index is produced for the PV arrangement and power request. Figure 12 demonstrates the spatial and factual distribution of the PV arrangement crosswise over LSOA in the SW England distribution locale, ascertaining the PV penetration (that is, isolating a total number of PV systems by the number of interested clients) for each LSOA [78].
The guide shows a critical variable sent per LSOA in the PV with some nearby bunch highlighted with a greater photovoltaic penetration (i.e., darker territories). Such variety is also clear in the left histogram, which demonstrates the distribution of LSOAs crosswise over various levels of PV penetrations. It is discovered that a dominant part of the LSOA usually has low penetration, with a few numbers somewhere in the range of 10% and 20% PV penetration with, more importantly, PV establishments in provincial territories.
The system’s integration of sustainable energy sources, including photovoltaic (PV) penetration, will continue to grow to meet up with the UK power consumers’ demand and the KYOTO convention’s target. However, the invasion of a high turnaround voltage and its effect on the system (i.e., on the LV grid) is currently affecting the conventional lattice arrangement, necessitating the use of more powerful and capable network systems, i.e., smart grids [74].

4.4. Development of PV Technology

Solar photovoltaic facilities are solely employed to generate electricity in one or more ways. The primary PV technology that has been applied is around 90% of the PV installed capacity based on the silicon PV cell. Those technologies have given solid support to the global PV industry for a long time. Technology in terms of capability and motivation needs to receive additional enhancements in performance and lowering of energy production cost. For example, in the United States, the PV installation price for utility scale is about 65%, whereas the cost for a rooftop unit for residential houses is 85%. Therefore, the Federal Research and Development (R&D) sector should focus on significant research in solar PV technologies, which can, in all probability, reduce the overall cost.
Today’s thin-film solar PV technology business is fast growing because of the prevailing 10% of advertising media, PV-intensive public acceptance, and some associated rare materials for PV modules that can ensure longer durability during inclement weather. Some thin-film R&D companies used global-multiple materials to make the PV module more flexible and less weighty, all of which will help to overcome their present characteristic limitation. This will significantly make progress in terms of higher performance and durability, which can ultimately lower module costs in the foreseeable future.
Another major part of technology for solar energy generation is the aspect of concentrated solar power (CSP), also known as a solar thermal generation. This is also important for commercial-scale production but it still needs federal support even though CSP is not as mature as the PV technology since the CSP commercial scale has been involved in high-risk uncontrollable power disturbances. However, it is not encouraging to perform a new design and materials for experimentation. Thus, the federal PV and CSP R&D sector should focus more on the new system designs with accessible global-multiple materials to establish a commercialized scale of more advanced solar generation technology.

5. Impact of Large-Scale Penetration

Renewable energy sources, particularly wind and solar, are critical for meeting the world’s growing energy demand and ensuring environmentally sustainable growth of power production. However, supposing that renewable electricity is produced on a large scale and fed into the grid system without proper control measures, then it may hamper the integrity, reliability, security, and stability of the power grid system as a whole. Nowadays, solar PV-based power plants have become an important integral utility-level power provider like other conventional power plants, and other plants of the order of hundreds or of larger megawatts are coming up in India, whereby the penetration into the grid is on a continuous increase. However, there is still no specialized control for grid support, and the units often get disconnected when there is any grid disturbance, which may likely affect the grid.
For the analysis, the IEEE 9-bus system was used as a reference platform. ETAP programming has demonstrated the impact of the IEEE 9-transport test system, colloquially referred to as the P.M Anderson 9-transport system. It is a simplified representation of the Western System Coordinating Council’s (WSCC) system that consists of nine distinct modes of transport and three generators. This system incorporates a photovoltaic solar array. The WSCC 9-bus system is depicted in Figure 13 as a single-line diagram. Additionally, Figure 13 illustrates the voltage levels and transmission line impedances. Additionally, this system includes three 100 MVA two-winding transformers, six lines, and three loads (135.532 MVA, 94.45 MVA, and 102.64 MVA). 13.8 kV, 16.5 kV, 18 kV, and 230 kV are the base kV levels [82].
The effect on transmission line power flow is illustrated in Figure 14a,b, where the real and reactive power loading of all transmission lines in the grid is observed and plotted for all penetration levels (b). This can be seen in case 1. The variation in transmission line loading was mixed with some lines experiencing an increase in power and others a decrease in power. Few of the lines even noticed significant changes in power flow, which can lead to power reversal beyond a certain point. The changes in line 1’s loading are the most severe of all. As a result, when planning the grid network, it is critical to consider the impact of solar penetration on transmission line loading parameters [82].
The solar energy potential in India is massive and advantageous because of its intrinsic geographical area that is close to the equator. Hence, India consistently experiences about 3000 long periods of daylight, which is proportionate to 5000 trillion kWh of energy.
India’s vision is to reduce the reliance on conventional power to 20–25% by using its various solar resources in 2050. The National Action Plan on Climate Change established a renewable energy goal of procuring 5% of total electricity, which is expected to increase annually by 1% until it reaches 15% in 2020 [18].

6. Comparisons Study and Importance

As previously stated, numerous challenges to PV penetration exist at the current level. Many of these challenges would become exacerbated in light of the future circumstances as mentioned previously to increase photovoltaic (PV) penetration. Table 3 summarizes these issues and the possible solutions based on the keys highlighted in previous examples [83].

7. Conclusions

This paper presents and classifies various challenges associated with PV-penetrated grids. With the inevitable future increase in PV penetration, this paper also examined various technologies and their implications for higher levels of PV penetration in the grid. The existing technical solutions and penetration were also presented. The current status of the PV penetration into the grid system and its subsequent effects have been reviewed in this paper. The findings from the research show that grid flexibility needs further improvement for the high penetration of PV power. For example, in California, a U.S. single summer day of PV penetration has risen from 0% to 10%, which created a huge cost of generation.
In India, PV power generation and penetration are continuously rising, aiming to have more than hundreds of MW of PV power supply to the grid system. They are yet to follow any particular controls for practical grid support. However, the grid supply is automatically disconnected due to the disturbances from the extra energy load imposed by the PV plants. India and France jointly founded the International Solar Alliance (ISA) and focused on developing solar energy and its products. A high solar penetration on the power conveyance system can be reasonably accomplished on the off chance that it is the coveted goal. In any case, the advancement of this conveyance system requires acknowledgment that the power grid is a key to the discontinuity arrangements, which will empower the high penetration of solar energy plants. However, many of these existing solutions require further development, and this study suggests some future research directions. Consequently, the role played by the grid administrators and controllers is important.

Future Recommendations

Solar PV−based electricity production technologies are expanding to a large extent of human applicative innovations. The PV-installed solar power capacity has greatly improved technology in terms of price and performance, which will bring a breakthrough to the residential solar system business. Nevertheless, more progressive innovations are needed to increase the solar penetration regime at an adequate social cost. The majority of these issues are still in the early stage of development. As shown in Table 4, these challenges within the current level of photovoltaic integration are classified into six categories based on their impact areas.

Author Contributions

Conceptualization, M.S.H.; methodology, M.S.H., N.A.M., A.W.A.-F. and M.E.H.A.; software, M.S.H.; resources, M.S.H. and M.E.H.A.; writing—original draft preparation, M.S.H.; writing—review and editing, M.S.H.; supervision, M.S.H. and M.E.H.A.; revision and editing, N.A.M. and A.W.A.-F. All authors have read and agreed to the published version of the manuscript.

Funding

This research received no external funding.

Institutional Review Board Statement

Not applicable.

Informed Consent Statement

Not applicable.

Data Availability Statement

The data presented in this study are available on request from the corresponding author.

Conflicts of Interest

The authors declare no conflict of interest.

References

  1. Quan, L.; Wolfs, P. A Review of the Single Phase Photovoltaic Module Integrated Converter Topologies with Three Different DC Link Configurations. IEEE Trans. Power Electron. 2008, 23, 1320–1333. [Google Scholar] [CrossRef] [Green Version]
  2. Hubert, F.; Christoph, M. High Penetration of Photovoltaic Systems in Electricity Networks. Informacije MIDEM 2009, 39, 216–219. [Google Scholar]
  3. Joshua, S.H. GTM Forecasting More than 85 Gigawatts of Solar PV to Be Installed in 2017. 2017. Available online: https://cleantechnica.com/2017/04/05/gtm-forecasting-85-gw-solar-pv-installed-2017/ (accessed on 3 February 2022).
  4. APVI. Australian PV Institute (APVI) Solar Map Funded by the Australian Renewable Energy Agency. 2018. Available online: http://pv-map.apvi.org.au/analyses (accessed on 2 May 2018).
  5. Alam, M.J.E.; Muttaqi, K.M.; Sutanto, D. A comprehensive assessment tool for solar PV impacts on low voltage three phase distribution networks. In Proceedings of the 2nd International Conference on the Developments in Renewable Energy Technology (ICDRET 2012), Dhaka, Bangladesh, 5–7 January 2012; pp. 1–5. [Google Scholar]
  6. Walling, R.A.; Saint, R.; Dugan, R.C.; Burke, J.; Kojovic, L.A. Summary of Distributed Resources Impact on Power Delivery Systems. IEEE Trans. Power Deliv. 2008, 23, 1636–1644. [Google Scholar] [CrossRef]
  7. Ghiani, E.; Pilo, F. Smart inverter operation in distribution networks with high penetration of photovoltaic systems. J. Mod. Power Syst. Clean Energy 2015, 3, 504–511. [Google Scholar] [CrossRef] [Green Version]
  8. Lai, C.S.; Jia, Y.; Lai, L.L.; Xu, Z.; McCulloch, M.D.; Wong, K.P. A comprehensive review on large-scale photovoltaic system with applications of electrical energy storage. Renew. Sustain. Energy Rev. 2017, 78, 439–451. [Google Scholar] [CrossRef]
  9. Das, C.K.; Bass, O.; Kothapalli, G.; Mahmoud, T.S.; Habibi, D. Overview of energy storage systems in distribution networks: Placement, sizing, operation, and power quality. Renew. Sustain. Energy Rev. 2018, 91, 1205–1230. [Google Scholar] [CrossRef]
  10. Mendonça, H.; De Castro, R.M.; Martínez, S.; Montalbán, D. Voltage Impact of a Wave Energy Converter on an Unbalanced Distribution Grid and Corrective Actions. Sustainability 2017, 9, 1844. [Google Scholar] [CrossRef] [Green Version]
  11. Wang, H.; Wang, J.; Piao, Z.; Meng, X.; Sun, C.; Yuan, G.; Zhu, S. The Optimal Allocation and Operation of an Energy Storage System with High Penetration Grid-Connected Photovoltaic Systems. Sustainability 2020, 12, 6154. [Google Scholar] [CrossRef]
  12. Hashim, H.; Ho, W.S. Renewable energy policies and initiatives for a sustainable energy future in Malaysia. Renew. Sustain. Energy Rev. 2011, 15, 4780–4787. [Google Scholar] [CrossRef]
  13. Basri, N.A.; Ramli, A.T.; Aliyu, A.S. Malaysia energy strategy towards sustainability: A panoramic overview of the benefits and challenges. Renew. Sustain. Energy Rev. 2015, 42, 1094–1105. [Google Scholar] [CrossRef]
  14. Muhammed, G.; Tekbiyik-Ersoy, N. Development of Renewable Energy in China, USA, and Brazil: A Comparative Study on Renewable Energy Policies. Sustainability 2020, 12, 9136. [Google Scholar] [CrossRef]
  15. Husain, A.A.F.; Ahmad Phesal, M.H.; Kadir, M.Z.A.A.; Ungku Amirulddin, U.A.; Junaidi, A.H.J. A Decade of Transitioning Malaysia toward a High-Solar PV Energy Penetration Nation. Sustainability 2021, 13, 9959. [Google Scholar] [CrossRef]
  16. Arif, S.; Rabbi, A.E.; Ahmed, S.U.; Hossain Lipu, M.S.; Jamal, T.; Aziz, T.; Sarker, M.R.; Riaz, A.; Alharbi, T.; Hussain, M.M. Enhancement of Solar PV Hosting Capacity in a Remote Industrial Microgrid: A Methodical Techno-Economic Approach. Sustainability 2022, 14, 8921. [Google Scholar] [CrossRef]
  17. Hassaine, L.; Olias, E.; Quintero, J.; Salas, V. Overview of power inverter topologies and control structures for grid connected photovoltaic systems. Renew. Sustain. Energy Rev. 2014, 30, 796–807. [Google Scholar] [CrossRef]
  18. Zeng, Z.; Yang, H.; Zhao, R.; Cheng, C. Topologies and control strategies of multi-functional grid-connected inverters for power quality enhancement: A comprehensive review. Renew. Sustain. Energy Rev. 2013, 24, 223–270. [Google Scholar] [CrossRef]
  19. Kroposki, B.; Margolis, R.; Ton, D. Harnessing the sun. IEEE Power Energy Mag. 2009, 7, 22–33. [Google Scholar] [CrossRef]
  20. Mahapatra, S. India Achieves 20 Gigawatts Solar Capacity 4 Years Ahead of Initial Target. 2018. Available online: https://cleantechnica.com/2018/02/07/india-achieves-20-gigawatts-solar-capacity-4-years-ahead-initial-target/ (accessed on 3 February 2022).
  21. Business Today. India Achieves 20 GW Solar Capacity Goal Four Years Ahead of Deadline. 2018. Available online: https://www.businesstoday.in/current/economy-politics/india-achieves-20-gw-solar-capacity-goal-4-years-ahead-deadline/story/269266.html (accessed on 3 February 2022).
  22. Nguyen, A.; Velay, M.; Schoene, J.; Zheglov, V.; Kurtz, B.; Murray, K.; Torre, B.; Kleissl, J. High PV penetration impacts on five local distribution networks using high resolution solar resource assessment with sky imager and quasi-steady state distribution system simulations. Sol. Energy 2016, 132, 221–235. [Google Scholar] [CrossRef]
  23. Sepasi, S.; Reihani, E.; Howlader, A.M.; Roose, L.R.; Matsuura, M.M. Very short term load forecasting of a distribution system with high PV penetration. Renew. Energy 2017, 106, 142–148. [Google Scholar] [CrossRef]
  24. Gautam, D.; Vittal, V. Impact of DFIG based wind turbine generators on transient and small signal stability of power systems. In Proceedings of the 2009 IEEE Power & Energy Society General Meeting, Calgary, AB, Canada, 26–30 July 2009; pp. 1–6. [Google Scholar]
  25. Ullah, N.R.; Thiringer, T. Effect of operational modes of a wind farm on the transient stability of nearby generators and on power oscillations: A Nordic grid study. Wind Energy 2007, 11, 63–73. [Google Scholar] [CrossRef]
  26. Kundur, P.; Rogers, G.J.; Wong, D.Y.; Wang, L.; Lauby, M.G. A comprehensive computer program package for small signal stability analysis of power systems. IEEE Trans. Power Syst. 1990, 5, 1076–1083. [Google Scholar] [CrossRef]
  27. Achilles, S.; Schramm, S.; Bebic, J. Transmission System Performance Analysis for High Penetration PV. NRELlSR-581-42298. 2008. Available online: https://www1.eere.energy.gov/solar/pdfs/42300.pdf (accessed on 3 February 2022).
  28. National Grid. Winter Outlook 2014/15. 2014. Available online: http://www2.nationalgrid.com/UK/Industry-information/Future-of-Energy/FES/Winter-Outlook/ (accessed on 15 March 2022).
  29. Liu, Y.; Bebic, J.; Kroposki, B.; Bedout, J.d.; Ren, W. Distribution System Voltage Performance Analysis for High-Penetration PV. In Proceedings of the 2008 IEEE Energy 2030 Conference, Atlanta, GA, USA, 17–18 November 2008; pp. 1–8. [Google Scholar]
  30. Liu, H.; Jin, L.; Le, D.; Chowdhury, A.A. Impact of high penetration of solar photovoltaic generation on power system small signal stability. In Proceedings of the 2010 International Conference on Power System Technology, Hangzhou, China, 24–28 October 2010; pp. 1–7. [Google Scholar]
  31. Ahmed, N.A.; Miyatake, M. A novel maximum power point tracking for photovoltaic applications under partially shaded insolation conditions. Electr. Power Syst. Res. 2008, 78, 777–784. [Google Scholar] [CrossRef]
  32. Xiaohu, L.; Aichhorn, A.; Liu, L.; Li, H. Coordinated control of distributed energy storage system with tap changer transformers for voltage rise mitigation under high photovoltaic penetration. IEEE Trans. Smart Grid 2012, 3, 897–906. [Google Scholar]
  33. Haque, M.M.; Wolfs, P. A review of high PV penetrations in LV distribution networks: Present status, impacts and mitigation measures. Renew. Sustain. Energy Rev. 2016, 62, 1195–1208. [Google Scholar] [CrossRef]
  34. Schoene, J.; Zheglov, V.; Houseman, D.; Smith, J.; Ellis, A. Photovoltaics in distribution systems–integration issues and simulation challenges. In Proceedings of the IEEE on Power and Energy Society General Meeting (PES) 2013, Vancouver, BC, Canada, 21–25 July 2013; pp. 1–5. [Google Scholar]
  35. Katiraei, F.; Aguero, J.R. Solar PV Integration Challenges. IEEE Power Energy Mag. 2011, 9, 62–71. [Google Scholar] [CrossRef]
  36. Dong, M.; Luo, A. Design and Control of inverters for PV gridconnection generation system. J. Power Syst. Autom. 2006, 30, 97–102. [Google Scholar]
  37. Zhou, M. Report for reviewing the renewable energy and energy saving in USA. J. Renew. Energy 2007, 25, 98–101. [Google Scholar]
  38. Carrasco, J.M. Leopoldo Garcia Franquelo. Power-Electronic Systems for the Grid Integrationof enewable Energy Sources: A Survey. IEEE Trans. Ind. Electron. 2006, 53, 1002–1016. [Google Scholar] [CrossRef]
  39. Haeberlin, H. Evolution of Inverters for Grid connected PV-Systems from 1989 to 2000. In Proceedings of the 17th European Photovoltaic Solar Energy Conference, Munich, Germany, 22–26 October 2001. [Google Scholar]
  40. Clerk Maxwell, J. A Treatise on Electricity and Magnetism, 3rd ed.; Clarendon: Oxford, UK, 1892; Volume 2, pp. 68–73. [Google Scholar]
  41. IEA-PVPS. Innovative Electrical Concepts. 2001. Available online: https://www.iea-pvps.org/index.php?id=9&no_cache=1&tx_damfrontend_pi1%5BshowUid%5D=397&tx_damfrontend_pi1%5BbackPid%5D=9 (accessed on 20 March 2022).
  42. Feng, D. Principle and Application of Solar Energy Generation; People’s Posts and Telecommunications Press: Beijing, China, 2007; pp. 56–58. [Google Scholar]
  43. Denholm, P.; Margolis, R.M. Evaluating the limits of solar photovoltaics (PV) in electric power systems utilizing energy storage and other enabling technologies. Energy Policy 2007, 35, 4424–4433. [Google Scholar] [CrossRef]
  44. Khoie, R.; Yee, V.E. A forecast model for deep penetration of renewables in the Southwest, South Central, and Southeast regions of the United States. Clean Technol. Environ. Policy 2015, 17, 957–971. [Google Scholar] [CrossRef]
  45. Brinkman, G.L.; Denholm, P.; Drury, E.; Margolis, R.; Mowers, M. Toward a Solar-Powered Grid-Operational Impacts of Solar Electricity Generation. IEEE Power Energy 2011, 9, 24–32. [Google Scholar] [CrossRef]
  46. Shah, R.; Mithulananthan, N.; Bansal, R.C. Oscillatory stability analysis with high penetrations of large-scale photovoltaic generation. Energy Convers. Manag. 2013, 65, 420–429. [Google Scholar] [CrossRef]
  47. Denholm, P.; Margolis, R.M.; Milford, J.M. Quantifying Avoided Fuel Use and Emissions from Solar Photovoltaic Generation in the Western United States. Environ. Sci. Technol. 2009, 43, 226–232. [Google Scholar] [CrossRef] [PubMed]
  48. Perez, R.; Taylor, M.; Hoff, T.; Ross, J.P. Reaching Consensus in the Definition of Photovoltaics Capacity Credit in the USA: A Practical Application of Satellite-Derived Solar Resource Data. IEEE J. Sel. Top. Appl. Earth Obs. Remote Sens. 2008, 1, 28–33. [Google Scholar] [CrossRef]
  49. Denholm, P.; Mehos, M. Enabling Greater Penetration of Solar Power via the Use of CSP with Thermal Energy Storage; NREL/TP-6A20-52978; National Renewable Energy Laboratory: Golden, CO, USA, 2011. [Google Scholar]
  50. Denholm, P.; Margolis, R.M.; Milford, J. Production Cost Modeling for High Levels of Photovoltaics Penetration; NREL/TP-581-42305; National Renewable Energy Laboratory: Golden, CO, USA, 2008. [Google Scholar]
  51. Hawaii. High Penetration of Distributed Solar PV Generation. 2014. Available online: https://www.energy.gov/sites/prod/files/2014/12/f19/1-Champley-DEPresentation-Sep2014.pdf (accessed on 27 March 2022).
  52. Palmintier, B.; Giraldez, J.; Gruchalla, K.; Gotseff, P.; Nagarajan, A.; Harris, T.; Bugbee, B.; Baggu, M. Feeder Voltage Regulation with High-Penetration PV Using Advanced Inverters and a Distribution Management System; National Renewable Energy Laboratory: Golden, CO, USA, 2016. [Google Scholar]
  53. Palmintier, B.; Broderick, R.; Mather, B.; Coddington, M.; Baker, K.; Ding, F.; Reno, M.; Lave, M.; Bharatkumar, A. On the Path to SunShot: Emerging Issues and Challenges in Integrating Solar with the Distribution System; Technical Report NREL/TP-5D00-65331; National Renewable Energy Laboratory: Golden, CO, USA, 2016. Available online: http://www.nrel.gov/docs/fy16osti/65331.pdf (accessed on 27 March 2022).
  54. Coddington, M.; Barry, M.; Benjamin, K.; Kevin, L.; Alvin, R.; Abraham, E.; Roger, H.; Tom, K.; Kristen, N.; Jeff, S. Updating Interconnection Screens for PV System Integration; National Renewable Energy Laboratory: Golden, CO, USA, 2012. Available online: https://www.nrel.gov/docs/fy12osti/54063.pdf (accessed on 27 March 2022).
  55. Martin, B.; Stetz, T.; Bründlinger, R.; Mayr, C.; Ogimoto, K.; Hatta, H.; Kobayashi, H.; Ben, K.; Barry, M.; Michael, C.; et al. Is the Distribution Grid Ready to Accept Large-Scale Photovoltaic Deployment? State of the Art, Progress, and Future Prospects. Prog. Photovolt. Res. Appl. 2011, 20, 681–697. [Google Scholar]
  56. Seuss, J.; Reno, M.J.; Broderick, R.J.; Grijalva, S. Improving distribution network PV hosting capacity via smart inverter reactive power support. In Proceedings of the 2015 IEEE Power & Energy Society General Meeting, Denver, CO, USA, 26–30 July 2015; pp. 1–5. [Google Scholar]
  57. NREL. IEEE 1547 and 2030 Standards for Distributed Energy Resources Interconnection and Interoperability with the Electricity Grid; National Renewable Energy Laboratory: Golden, CO, USA, 2014. Available online: https://www.nrel.gov/docs/fy15osti/63157.pdf (accessed on 4 April 2022).
  58. IEA. Task 14: High Penetration of PV in Local Distribution Grids; IEA: Paris, France, 2014; Available online: https://www.researchgate.net/publication/324727329 (accessed on 4 April 2022).
  59. IEEE 1547-2018; IEEE Standard for Interconnection and Interoperability of Distributed Energy Resources with Associated Electric Power Systems Interfaces. IEEE: Piscataway, NJ, USA, 2018. Available online: https://standards.ieee.org/standard/1547-2018.html (accessed on 4 April 2022).
  60. Paz Espinosa, M. Understanding the electricity tariffdeficit and its challenges. SEFO -Span. Econ. Financ. Outlook 2013, 2, 2. [Google Scholar]
  61. Prol, J.L.; Steininger, K.W. Photovoltaic self-consumption regulation in Spain: Profitability analysis and alternative regulation schemes. Energy Policy 2017, 108, 742–754. [Google Scholar] [CrossRef]
  62. Eltawil, M.A.; Zhao, Z. Grid-connected photovoltaic power systems: Technical and potential problems—A review. Renew. Sustain. Energy Rev. 2010, 14, 112–129. [Google Scholar] [CrossRef]
  63. Gonzalez, A.; Keith, J. Spain’s Solar-Power Collapse Dims Subsidy Model. The Wall Street Journal. 2011. Available online: https://www.wsj.com/articles/SB125193815050081615 (accessed on 12 April 2022).
  64. RED. Electricity Business in Spain. 2022. Available online: https://www.ree.es/en/about-us/business-activities/electricity-business-in-Spain (accessed on 12 April 2022).
  65. RED. Control Centre of Renewable Energies (CECRE). 2022. Available online: https://www.ree.es/en/press-office/infographs-and-maps/control-centre-of-renewable-energies-%28cecre%29 (accessed on 12 April 2022).
  66. Wyns, T.; Khatchadourian, A.; Oberthür, S. EU Governance of Renewable Energy Post-2020-Risks and Options; Institute for European Studies-Vrije, Universiteit Brussel: Brussels, Belgium, 2014. [Google Scholar]
  67. Dalton, G.J.; Lockington, D.A.; Baldock, T.E. Feasibility analysis of renewable energy supply options for a grid-connected large hotel. Renew. Energy 2009, 34, 955–964. [Google Scholar] [CrossRef]
  68. ECOWAS. HOMER Software for Renewable Energy Design; Center for Renewable Energy and Energy Efficiency (ECREEE): Amherst, MA, USA, 2013. [Google Scholar]
  69. Kenneth, E.O.; Roland, U. Optimization of Renewable Energy Efficiency using HOMER. Int. J. Renew. Energy Res. 2014, 4, 421–427. [Google Scholar]
  70. Ma, W.W.; Rasul, M.G.; Liu, G.; Li, M.; Tan, X.H. Climate change impacts on techno-economic performance of roof PV solar system in Australia. Renew. Energy 2016, 88, 430–438. [Google Scholar] [CrossRef]
  71. AECOM. Australia’s Off-Grid Clean Energy Market Research Paper. 2014. Available online: https://arena.gov.au/assets/2014/12/ARENA_RAR-report-20141201.pdf (accessed on 12 April 2022).
  72. Bert, H.; Anthony, D.; Olivia, B.; Steven, R.; Lyndon, F. Identifying risks, costs, and lessons from ARENA-funded off-grid renewable energy projects in regional Australia. Prog. Photovolt. Res. Appl. 2018, 26, 642–650. [Google Scholar]
  73. AECOM. Australian Remote Renewables: Opportunities for Investment. 2013. Available online: https://www.assorinnovabili.it/public/sitoaper/AperNelMondo/Internazionale/Report%20Australia.PDF (accessed on 14 April 2022).
  74. IET. Increasing Solar Energy System & Challenges to the UK Grid. Power Academy Essay Challenge. 2016. Available online: https://conferences.theiet.org/power-academy/-documents/essay-a-akuoko.cfm (accessed on 14 April 2022).
  75. Hemingway, J. Estimating Generation from Feed in Tariff Installations. 2013. Available online: https://assets.publishing.service.gov.uk/government/uploads/system/uploads/attachment_data/file/266474/estimating_generation_from_fit_installations.pdf (accessed on 14 April 2022).
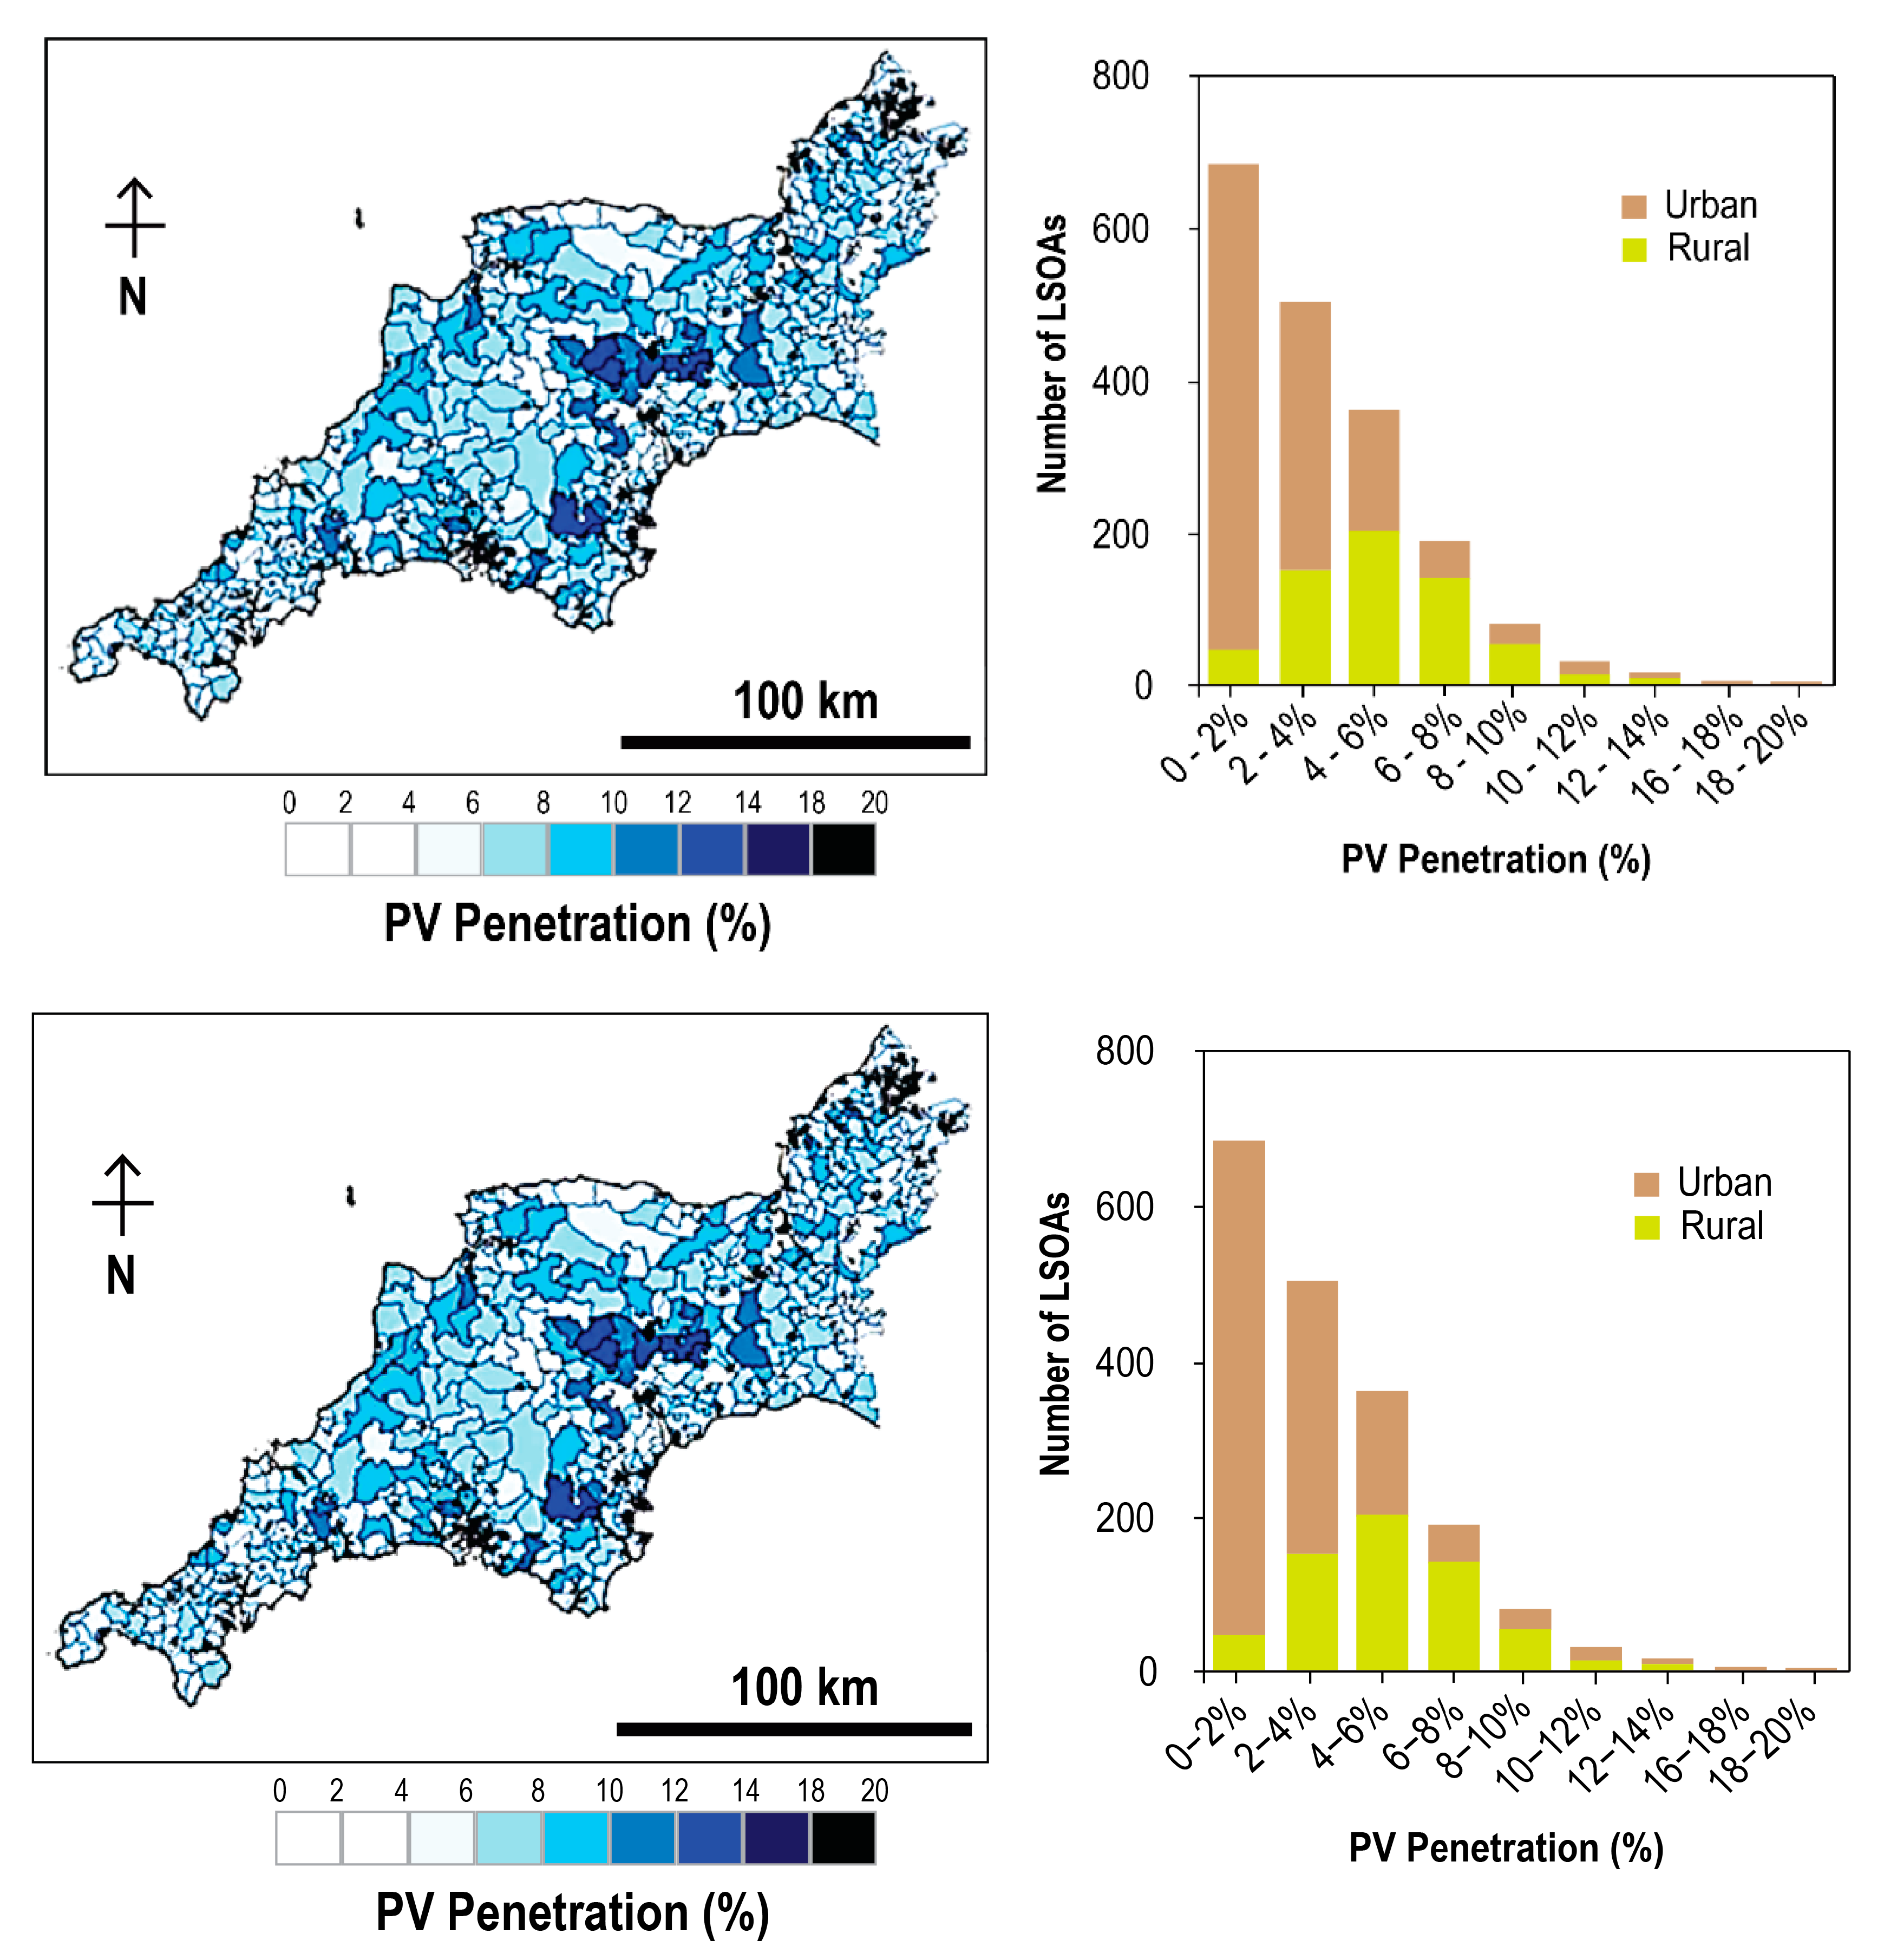
  76. Hernandez, J.; Medina, A.; Jurado, F. Impact comparison of PV system integration into rural and urban feeders. Energy Convers. Manag. 2008, 49, 1747–1765. [Google Scholar] [CrossRef]
  77. Rowley, P.; Leicester, P.; Palmer, D.; Westacott, P.; Candelise, C.; Betts, T.; Gottschalg, R. Multi-domain analysis of photovoltaic impacts via integrated spatial and probabilistic modelling. IET Renew. Power Gen. 2015, 9, 424–431. Available online: http://digital-library.theiet.org/content/journals/10.1049/iet-rpg.2014.0374 (accessed on 15 April 2022). [CrossRef] [Green Version]
  78. Candelise, C.; Westacott, P. Can integration of PV within UK electricity network be improved? A GIS based assessment of storage. Energy Policy 2017, 109, 694–703. [Google Scholar] [CrossRef]
  79. ECC. Sub-National Electricity Consumption Data. Department of Energy and Climate Change. 2018. Available online: https://www.gov.uk/government/collections/sub-nationalelectricity-consumption-data (accessed on 16 February 2018).
  80. Ofgem. Feed-in Tarrif Register. 2014. Available online: https://www.ofgem.gov.uk/publications-and-updat (accessed on 20 April 2022).
  81. DECC. Renewable Energy PlanningDatabase. Department of Energy and Climate Change. 2014. Available online: https://www.gov.uk/government/publications/renewableenergy-planning-database-monthly-extract (accessed on 20 April 2022).
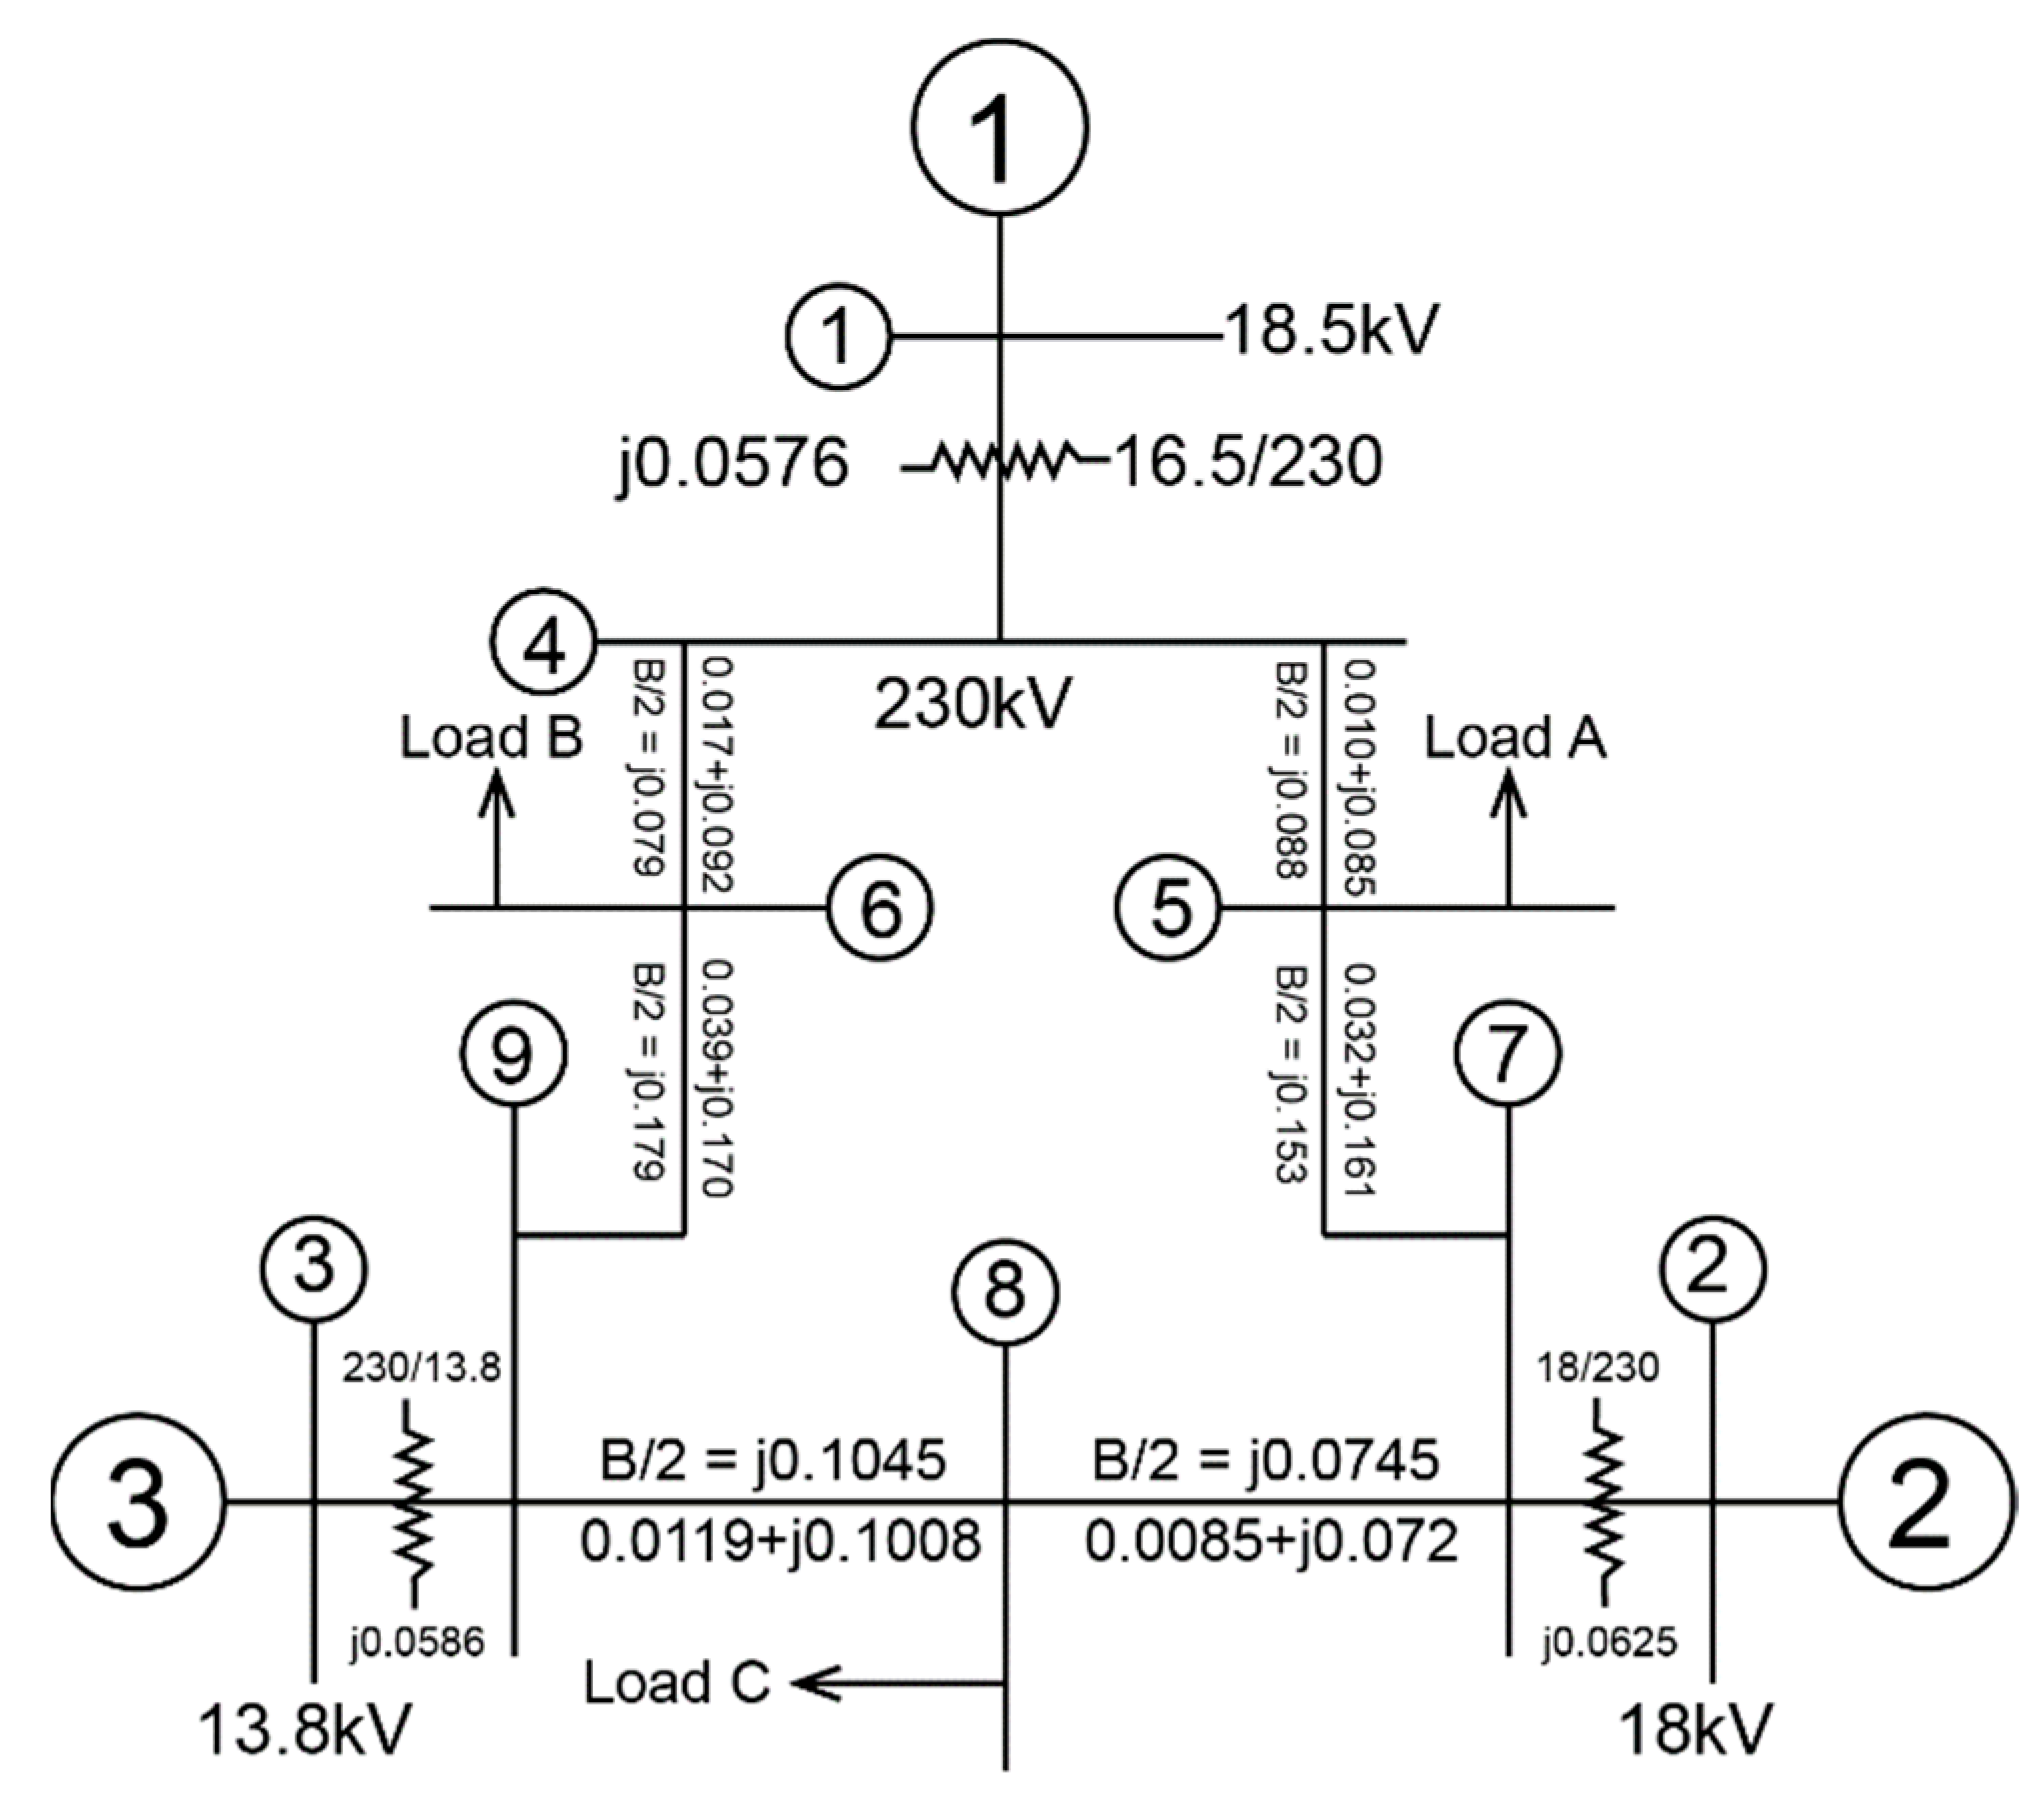
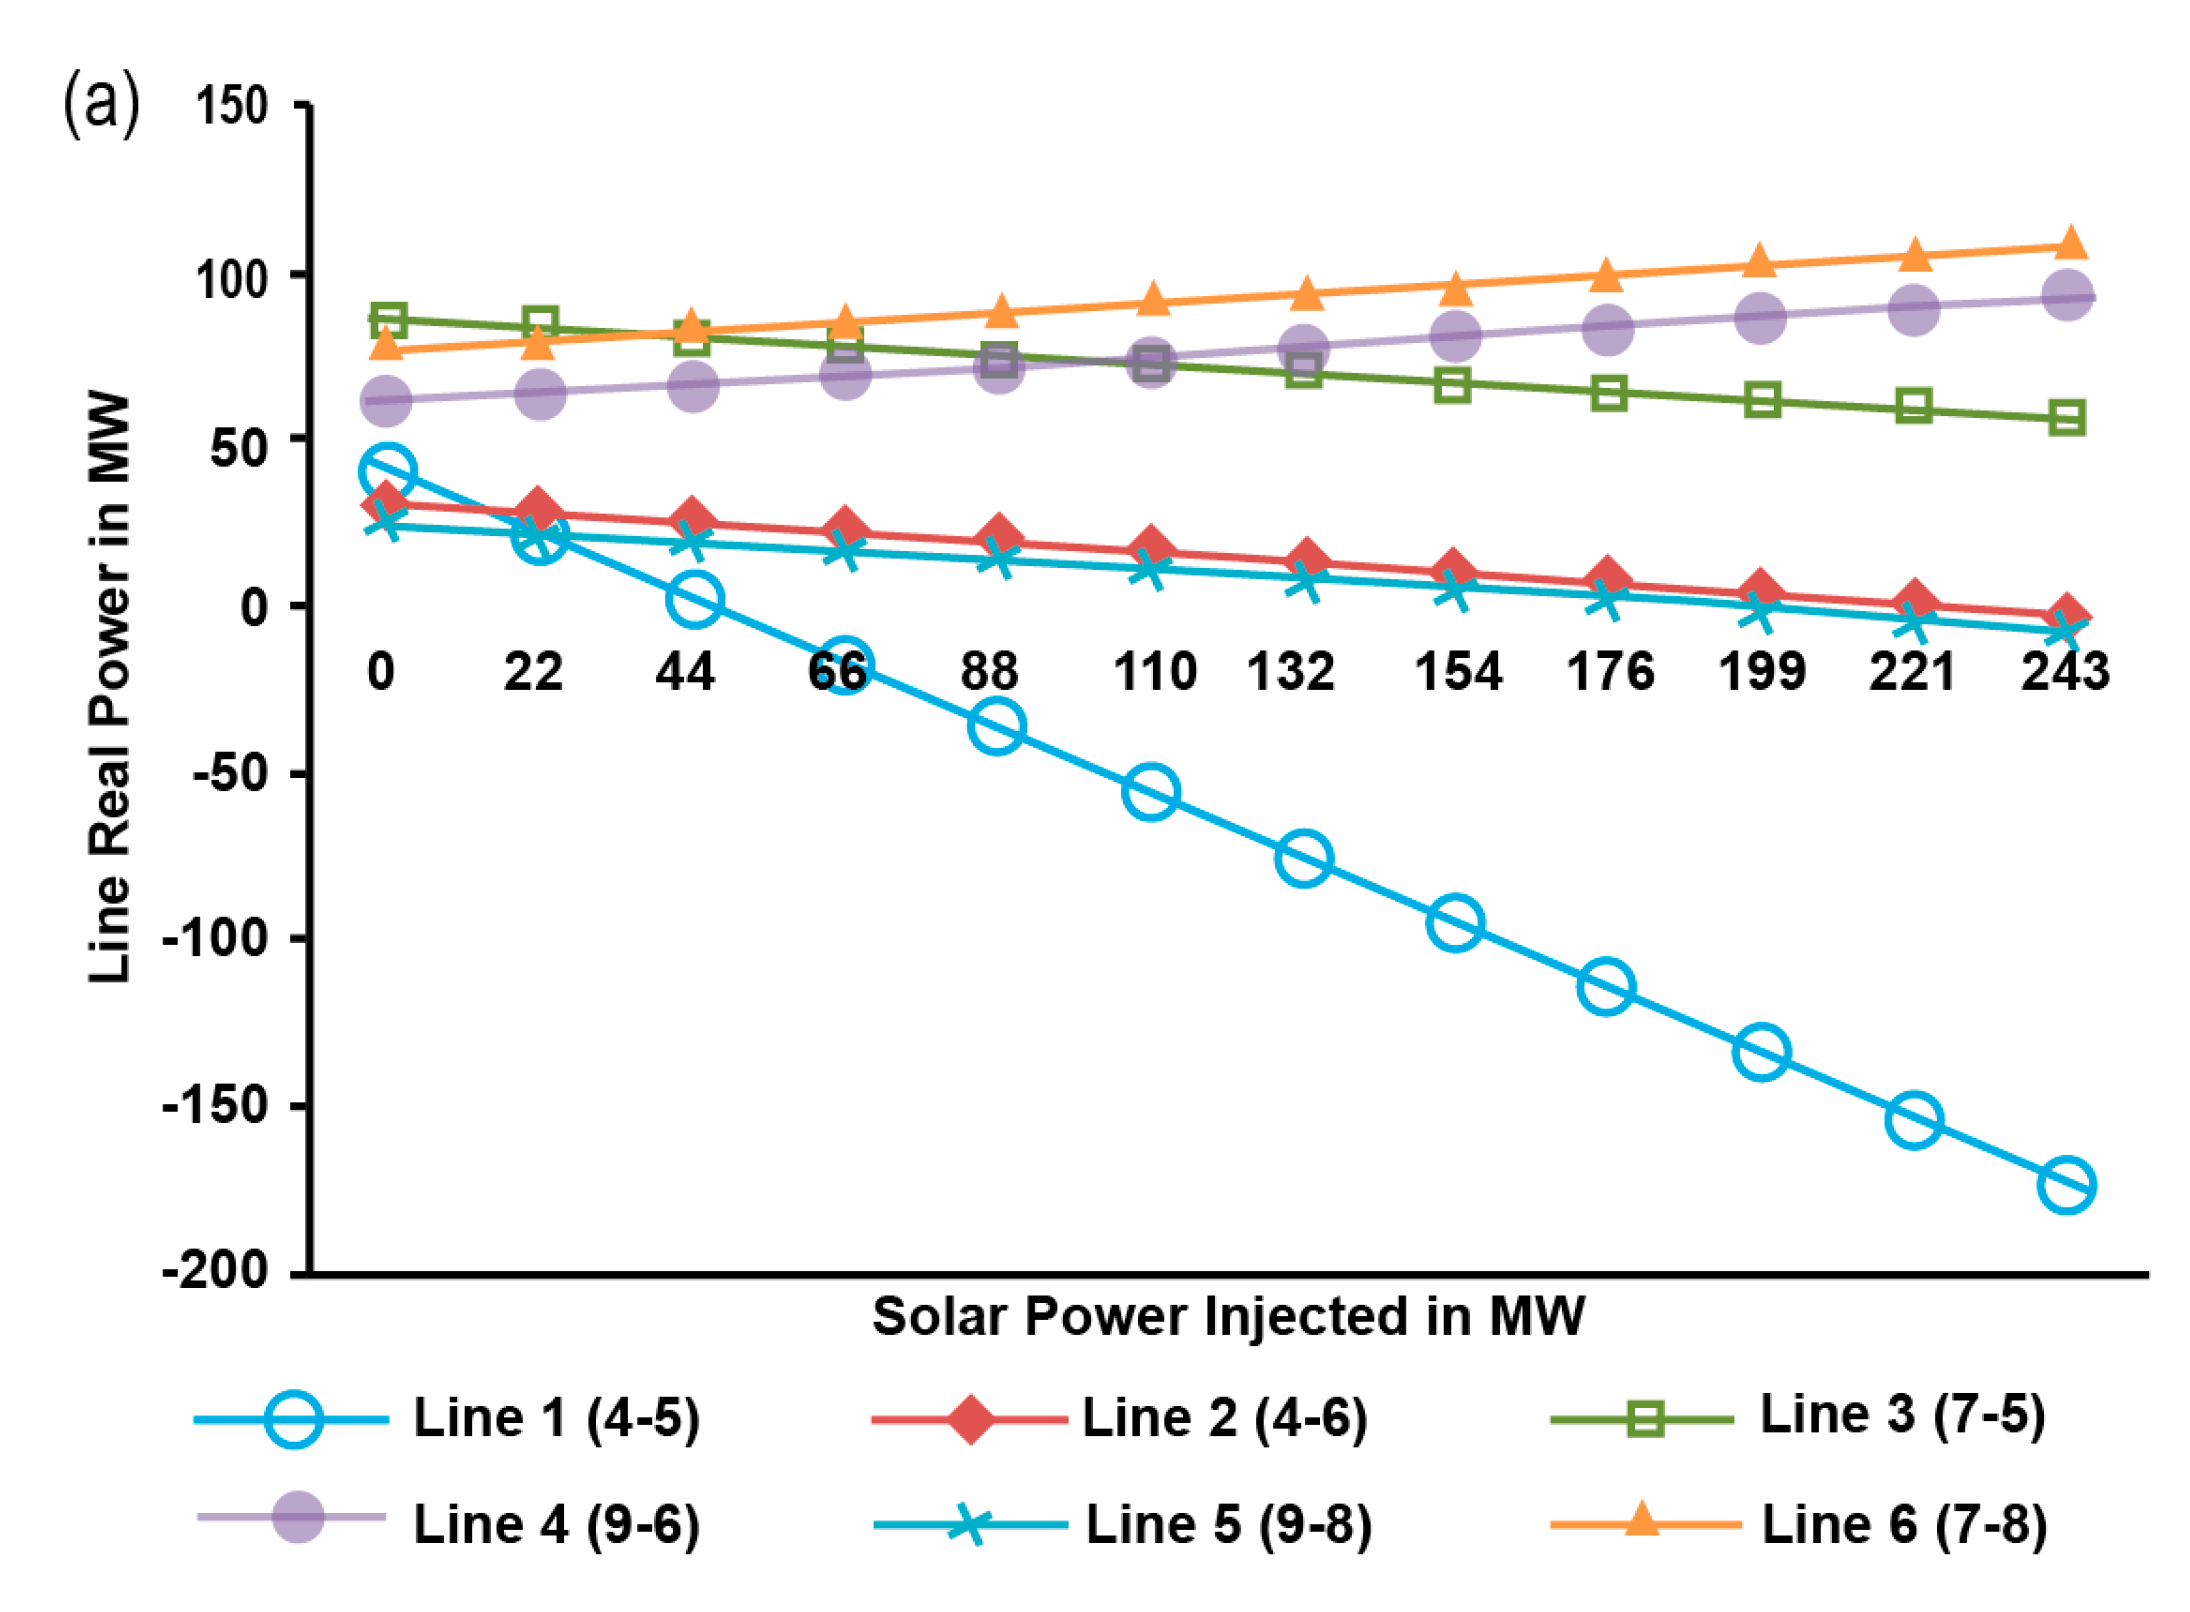
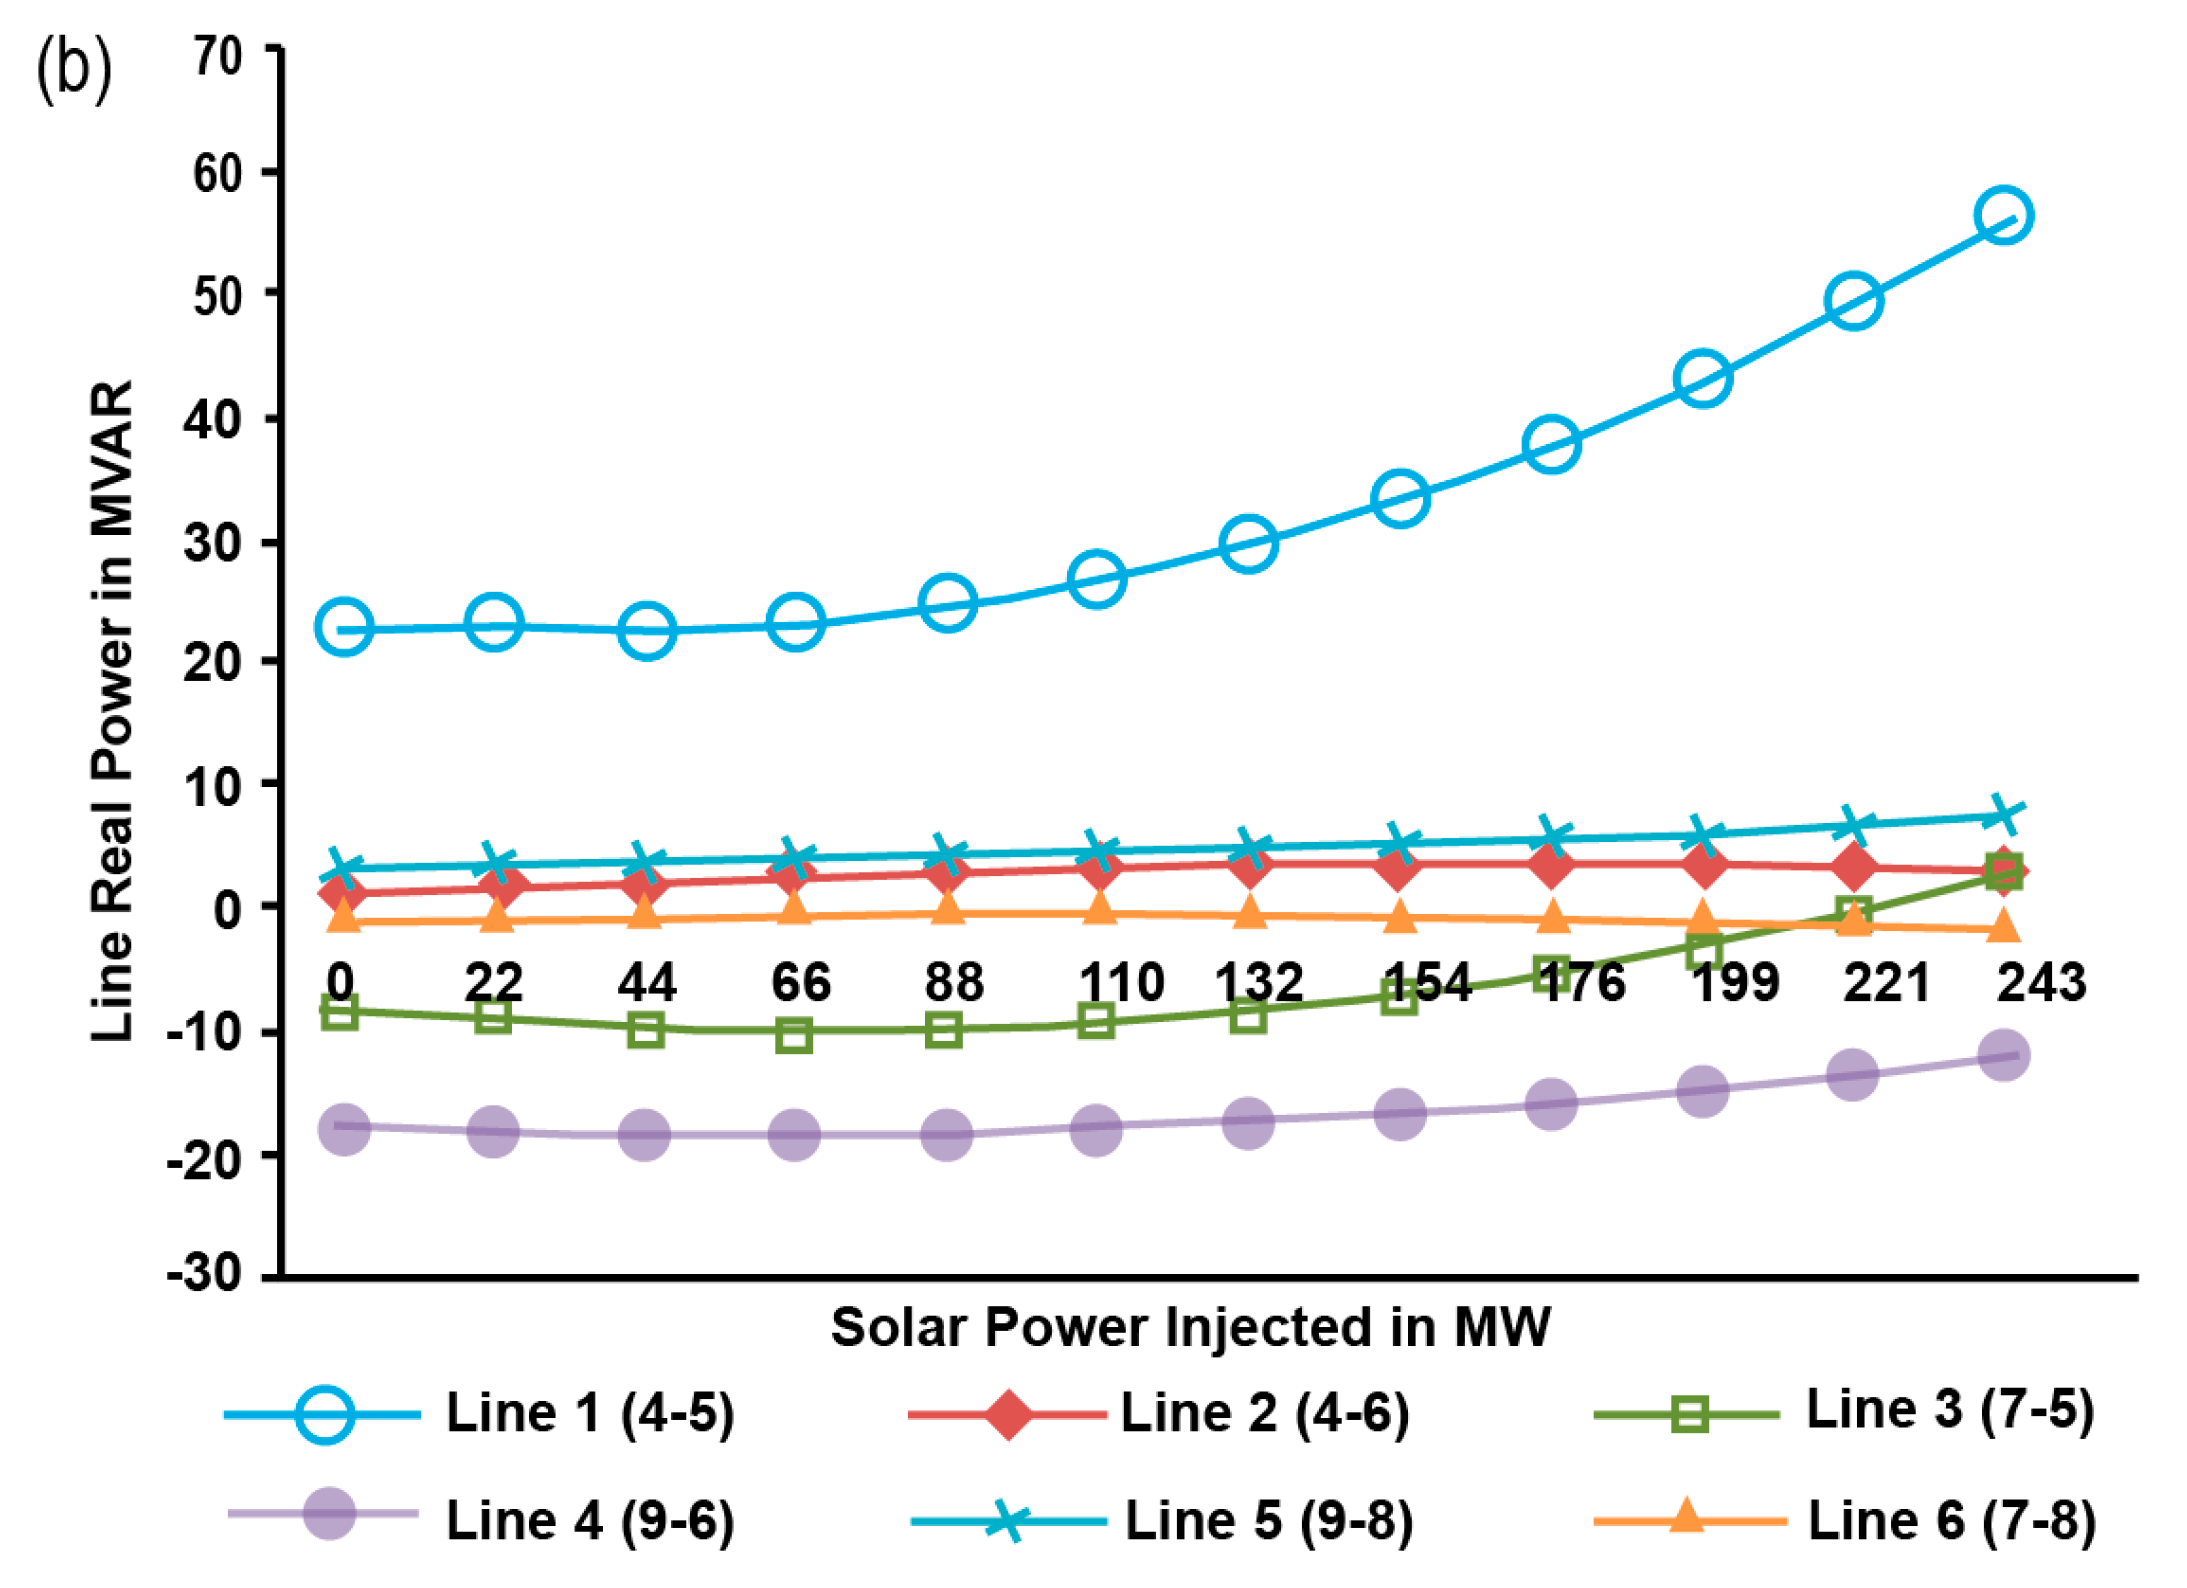
  82. Kumar, K.A.; Selvan, M.P.; Rajapandiyan, K. Grid stability analysis for high penetration solar photovoltaics. In Proceedings of the 1st International Conference on Large-Scale Grid Integration of Renewable Energy, New Delhi, India, 6–8 September 2017; Available online: https://regridintegrationindia.org/wp-content/uploads/sites/3/2017/09/10C_4_GIZ17_098_paper_AJIT_KUMARK.pdf (accessed on 20 April 2022).
  83. Olowu, T.O.; Sundararajan, A.; Moghaddami, M.; Sarwat, A.I. Future Challenges and Mitigation Methods for High Photovoltaic Penetration: A Survey. Energies 2018, 11, 1782. [Google Scholar] [CrossRef] [Green Version]
  84. IEA. Solar PV. 2020. Available online: https://www.iea.org/reports/renewables-2020/solar-pv (accessed on 20 April 2022).
  85. IRENA. Future of Solar Photovoltaic. 2019. Available online: https://irena.org/-/media/Files/IRENA/Agency/Publication/2019/Nov/IRENA_Future_of_Solar_PV_2019.pdf (accessed on 20 April 2022).
  86. Sampath Kumar, D.; Gandhi, O.; Rodríguez-Gallegos, C.D.; Srinivasan, D. Review of power system impacts at high PV penetration Part II: Potential solutions and the way forward. Sol. Energy 2020, 210, 202–221. [Google Scholar] [CrossRef]
  87. Solomon, A.A. Large scale photovoltaics and the future energy system requirement. AIMS Energy 2019, 7, 600–618. [Google Scholar] [CrossRef]
  88. Wilson, G.M.; Al-Jassim, M.; Metzger, W.K.; Glunz, S.W.; Verlinden, P.; Xiong, G.; Mansfield, L.M.; Stanbery, B.J.; Zhu, K.; Yan, Y.; et al. The 2020 photovoltaic technologies roadmap. J. Phys. D Appl. Phys. 2020, 53, 493001. [Google Scholar] [CrossRef]
  89. Khan, M.F.H. Designing a Grid-Tied Solar PV System. 2019. Available online: https://www.researchgate.net/publication/334112610_DESIGNING_A_GRID-TIED_SOLAR_PV_SYSTEM (accessed on 20 April 2022).
  90. Zhang, S.; Yang, J.; Shi, Y.; Wu, X.; Ran, Y. Dynamic Energy Storage Control for Reducing Electricity Cost in Data Centers. Math. Probl. Eng. 2015, 2015, 380926. [Google Scholar] [CrossRef] [Green Version]
  91. Shadfar, H.; Ghorbani Pashakolaei, M.; Akbari Foroud, A. Solid-state transformers: An overview of the concept, topology, and its applications in the smart grid. Int. Trans. Electr. Energy Syst. 2021, 31, e12996. [Google Scholar] [CrossRef]
Figure 2. A distribution grid is depicted as a single-line diagram [33].
Sustainability 15 01174 g002
Figure 3. A classification of PV grid−connected systems in terms of the combination of modules. (a) central inverter, (b) string inverter, (c) module integrated inverter, and (d) multi−string inverter.
Sustainability 15 01174 g003
Figure 4. (a) Power configurations for PV inverters with and without DC−DC converters and (b) configuration of a photovoltaic system connected to a PV inverter and an MPPT system that is connected to the grid.
Sustainability 15 01174 g004aSustainability 15 01174 g004b
Figure 5. Simulated dispatch for a summer day in California, with PV penetration ranging from 0% to 10% [50].
Sustainability 15 01174 g005
Figure 6. (a) Voltage effect of DGPV and (b) mitigation using a voltage regulator [53].
Sustainability 15 01174 g006
Figure 7. Advanced inverters absorb reactive power and assist in mitigating voltage rise challenges on the feeder [53].
Sustainability 15 01174 g007
Figure 8. Grid and photovoltaic systems schematic block diagram [63].
Sustainability 15 01174 g008
Figure 9. (a) Grid−connected hybrid system and (b) PV system configuration.
Sustainability 15 01174 g009
Figure 11. (a) PV voltage rise due to combined PV panels and (b) low voltage distribution grid [76].
Sustainability 15 01174 g011
Figure 12. PV penetration across the distribution region of South−West England, map (left) and histogram (right) [79,80]; several demand customers [81].
Sustainability 15 01174 g012
Figure 13. Diagram of the ETAP model IEEE 9-bus system in a single line [82].
Sustainability 15 01174 g013
Figure 14. The plot of (a) real and (b) reactive power in transmission lines at various levels of solar photovoltaic (PV) penetration [82].
Sustainability 15 01174 g014aSustainability 15 01174 g014b
Table 1. Levels of distributed generation (DG) penetration in Hawaii’s distribution circuits [51].
Circuit Penetration LevelNo. of Circuits Percentage of Circuits
Hawaiian ElectricHawai’i Electric LightMaui Electric Hawaiian ElectricHawai’i Electric LightMaui Electric
>120% Daytime Minimum Load (“DML”)10121824.3%15.4%5.8%
>100% up to and including 120% DML299177.0%6.6%12.4%
≥75% up to and including 100% DML59262114.2%19.1%15.3%
<75% DML227809154.6%58.8%66.4%
Total416136137100.0%100.0%100.0%
Table 2. The system components size description. This table is rewired from these sources [70].
ComponentsSize OptionsInterpretation
PV (kW)5–10Thin films PV: DC power generation
Battery (count)2S45S25P
Converter (count)6DCMC converter
Gird electricityCO2 emission factor 924 g/kWh
Table 3. Summary of PV penetration for the present and future challenges with suggested combinatorial solutions and future direction [84,85,86,87,88].
ChallengesExisting (with Present
Penetration Levels)
Future (with Smart Cities, PHEVs, Solar Eclipse, Transactive Energy, Big Data, and Cybersecurity)Suggested Future Solutions
Reverse Flow of PowerA potential issue, depending on the feeder’s point of interconnection (POI).An increase is anticipated. Reduced the number of possible points of connection.Feeders are loaded to a minimum.
Concerns about voltage instabilityThe use of on/off load tap changers has proven to be effective.Increase anticipated.Geographic Smoothing (GS) in conjunction with photovoltaic fleet management.
Complicated coordination of protectionThere are no significant coordination issues with relays/inverters, sectionalizes, fuses, or reclosers.Increased bidirectional current flow and fault current levels, increased line-to-ground voltage due to an increase in single-phase consumers, possible desensitization of substation relays, fuses blowing unexpectedly, reclosers, and sectionalizes malfunctioning.Advanced short circuit analysis with a high penetration of photovoltaics. Intelligent Inverter (SI) with fault current monitoring and control.
Problems with the power factorThere is no significant concern.Expected increase.For both utilities and people who make their electricity, dynamic reactive power control with SI can help them use less power.
HarmonicsThere is no significant concern.Expected increase.All SI conform to UL 1741. SI+ features Dynamic Load Harmonic Control (DLHC). Utilization of Static Synchronous Compensation Devices (STATCOMs).
Instability of FrequencyThere is no significant concern. Germany’s ‘50.2 Hz’ frequency issue.Expected increase.For utility−scale photovoltaic systems, GS with PV aggregation. SI+ Fault Ride Through (FRT), Energy Routing Optimization (OER).
Losses at the feederIncreased slightly depending on the POI.Future possible increases.Algorithms for optimal photovoltaic placement that are robust, OER on distribution feeders.
The grid’s thermal limitsNo discernible effects.Expected increase.All SI must comply with UL 1741. Location optimization of utility-scale and small−scale aggregated photovoltaic systems, OER.
Supply−chain securityThere is no significant issue.Threatened.Accurate forecasting methods (for supply security) should include future market analysis. Taking into account the PV system’s intermittent nature as well as the development of other dispatchable energy sources.
Cybersecurity in Distributed Energy Resources (DER) and substationsThere are no communication or control links. The IEEE 2030 standard has not been completed.It is necessary to have reliable and well−defined communication and control protocols. In a transactive energy (TE) environment, interoperability of distributed energy resources (DRE) is critical.Electronic Device That Is Intelligent (IEDs). IEEE 2030 standards in their entirety and adoption by all photovoltaic systems. Architecture for high−performance computing and communication.
Dynamic modelling of high penetration photovoltaicsDistribution Management Systems (DMS) based on Geographic Information Systems (GIS) model photovoltaic (PV) systems as a negative load.System modelling with PHEVs and the rise of prosumers would be needed to figure out how the system works. Modelling energy routes for Internet of Things (IoT) −enabled TE will need to be done. More in-depth studies on the effects of solar eclipses would be needed.Dynamic PV systems models be developed for remote monitoring and control via GIS-based DMS and GIS−based Energy Management Systems (EMS).
ForecastingForecasting is inherently uncertain. The level of precision is still quite low.Accuracy is critical for proper planning, unit commitment, and dispatch.Forecasting in a hybrid fashion (nowcasting + forecasting). More precise forecasting models through the use of multiple forecasting methods.
A problem with dispatching and schedulingThere have been no significant issues reported.Increased PV penetration in a transactive environment will necessitate the use of optimal power flow and dispatch with a high PV penetration.Optimal Smart Inverter Scheduling (OSID). The storage system’s optimal set point. Techniques for mitigating forecast and communication errors in (OSID).
Table 4. The challenges for high levels of PV penetration and recommendation [69,89,90,91].
Challenges for
Higher Levels of PV Penetration
Recommendations
The PV output’s intermittent nature.
  • Lack of inertia (e.g., synchronous generators).
  • The distribution network’s unidirectional power flow.
  • Voltage instability, reversal of power flow, feeder losses, harmonics, protection complexity, thermal concerns, and frequency concerns.
  • Latency, performance, quality of service, and resilience in big data.
  • Security at the endpoint, protocol level, organizational level, and data level.
  • Voltage instability, unintentional islanding, coordination, scheduling, and dispatch of protection measures.
  • Harmonics, frequency, islanding, LH/VRTs, and smart Inverters are some of the things that can go wrong with your electricity.
  • Security, forecasting, photovoltaic panels, and cybersecurity.
  • Develop intelligent relays/inverters that automatically disconnect grid-tied photovoltaic systems when their output falls below a specified threshold value.
  • Develop dynamic energy storage systems to mitigate the effects of output variability from renewable energy sources such as photovoltaic systems.
  • Replace the inverter with a solid-state transformer. It would be extremely advantageous for the future smart grid. This is because of its interfacing capability as an alternating current or direct current grid system and its ease of dynamic control. Those controls are included: power and power management.
Disclaimer/Publisher’s Note: The statements, opinions and data contained in all publications are solely those of the individual author(s) and contributor(s) and not of MDPI and/or the editor(s). MDPI and/or the editor(s) disclaim responsibility for any injury to people or property resulting from any ideas, methods, instructions or products referred to in the content.

