Article

A Study on Spatial Accessibility of the Urban Stadium Emergency Response under the Flood Disaster Scenario

1
Department of Economics and Management, Shanghai University of Sport, Shanghai 200438, China
2
School of Geographical Sciences, East China Normal University, Shanghai 200241, China
*
Author to whom correspondence should be addressed.
Sustainability 2022, 14(24), 17041; https://doi.org/10.3390/su142417041
Submission received: 15 September 2022 / Revised: 1 December 2022 / Accepted: 14 December 2022 / Published: 19 December 2022
(This article belongs to the Special Issue Urban Climate Change, Transport Geography and Smart Cities)

Abstract

:
In the context of global climate change and the rapid development of the sports industry, increasingly frequent flooding has become a significant challenge for Chinese cities today and one of the hot issues in risk management for sports events. In order to reveal the impact of flooding on the spatial accessibility of emergency response to stadiums in the central urban area within the outer ring of Shanghai, this article evaluates the accessibility of medical emergency services in the central urban area under the impact of flooding based on flood scenario simulations and GIS network analysis. Results show that under the different flooding scenarios, as the intensity of flooding increases, urban road traffic in flood-prone areas is blocked by ponding, and some stadiums are inaccessible to emergency vehicles. The scope of emergency response services for some medical institutions along the Huangpu River is significantly reduced, while emergency response times for stadiums in the riverside area are delayed considerably. Some stadiums are unable to access emergency medical services. The study’s results can offer a case reference for upgrading the level of emergency management of stadiums under urban-scale flooding and optimizing the quality of regional medical emergency services.

1. Introduction

Global climate change and speedy urbanization have increased extreme climatic and hydrological events’ frequency, extent, and impact. Consequently, flooding has become one of the major disasters in cities, constraining cities’ sustainable economic and social development and affecting the physical and psychological well-being of urbanites [1,2,3]. In recent events such as the ‘international sports events super-cycle’ (consolidation of post-covid major sporting events within a short period of time) alongside the rapid development of the global sports industry, competitive sport is receiving global attention because of its enormous economic and social value [4,5,6]. As global major sporting events increase in frequency, there is an increased risk to various sports activities in the face of natural disasters, thereby highlighting the essentiality of emergency management. Sports stadiums are responsible for diverse cultural, recreational, commercial, and urban functions and serve as an important infrastructure for developing sports activities [7,8,9]. As important iconic buildings in cities, stadiums often have a large number of people moving around in a short span of time and are special nodes in the network of material, human, and information flow in the city [10]. In addition, stadiums also serve as emergency shelters. When Hurricane Irma hit the Americas in 2017, the spacious and well-equipped Germain Arena in Miami became a shelter for the surrounding residents [11]. At the beginning of the COVID-19 outbreak in 2020, Wuhan urgently converted 10 stadiums, which were independently located, well-ventilated, with sufficient access and clear distribution (for easy access and quarantine), into square cabin hospitals, reversing a once extremely passive situation in the fight against the outbreak [12]. In recent years, the scale of events held in stadiums across the country has shown explosive growth, resulting in the security management and risk warning of events becoming increasingly urgent, especially in the eastern coastal regions. The number of stadiums and events is much higher in the eastern coastal regions than in the central and western regions. Furthermore, the peak of the sports event from July to October every year coincides with the flood and typhoon season. As a result of its special location at the land-sea interface, global warming has directly led to an increase in extreme disaster events, including storms and floods [13]. Besides causing severe damage to venues and casualties, this has also led to a series of serious consequences such as traffic disruptions, impairment of public facility service functions and reduced emergency response capabilities [14,15,16]. Sports events that rely on stadium facilities are sensitive to natural disasters. Natural disasters and incidents may affect the experience of the sports event and also damage the city’s reputation (in the event of mismanagement) and constrain the city’s development of the sports industry resultantly.
In this context, government and academia have devoted considerable attention to research topics such as disaster risk identification and assessment [17,18,19,20,21], emergency response and management [22,23,24,25], environmental restoration and facility reconstruction [26,27,28]. Coles et al. measured the service domains of emergency medical and fire emergency services response times within 8 and 10 min for different flooding scenarios in York, UK, and analysed the vulnerability of nursing homes and emergency shelters and the risks they would face in the case of reduced or disrupted emergency service accessibility [23]. Yin J et al. analysed the spatial accessibility of emergency medical care in the area within the outer ring of Shanghai based on numerical simulations of flooding in the Huangpu River. They showed that the distribution and number of first aid stations, the degree of flooding (depth and extent of water), and the speed of vehicle travel holistically determine emergency medical accessibility [25]. Arrighi et al. measured the service domain of emergency medical and fire emergency services response times within 8 min in Galluzzo, Florence, Italy, under normal weather and flood scenarios based on a traffic road network simulation system [29]. Researchers have also made advances in flood control, environmental risk prevention, and stadium flood control. The state of Rio de Janeiro in Brazil was hit by heavy rainstorms in 2010, damaging the Maracanã Stadium and thus affecting the preparations for the Rio Olympics at that time. M Duarte et al. described the various flood control projects under construction in the Mangue region, where the Maracanã Stadium is located, to mitigate the risk of flooding [30]. Zhu pointed out that public neglect of environmental risk prevention and flooding measures in sports stadiums is becoming increasingly severe and suggested that the relevant authorities should build a management system, operational mechanism and legal system under the framework of emergency management, command and rescue plans [31]. Despite some extant research on flooding risks in sports stadiums, there is still a paucity of quantitative analysis in this area, particularly on the combined impact of flooding on urban stadiums, especially in developing countries and emerging economic markets.
According to the International Disaster Reduction Strategy implemented in recent years, integrating stadiums into the emergency management system and strengthening the response capability of their surrounding public service institutions is an effective strategy to reduce the many adverse effects of flooding on sports activities. In urban areas with a high density of sports events, the orderly implementation of emergency management and prevention of disasters in stadiums is especially significant in improving the quality of urban emergency management and promoting the sustainable development of the sports industry. Currently, the research on urban flood response capacity primarily focuses on theoretical and planning aspects [32]. There is still a lack of cases exploring changes in the emergency response capacity of public service facilities in urban stadiums in the face of natural disasters. This article reveals the impact of flooding on the spatial accessibility of the emergency response of stadiums in downtown Shanghai within the outer ring and evaluates the accessibility of medical emergency services in the central city under the impact of flooding based on flooding simulation results and road network data, to provide a case reference for improving the level of emergency management of stadiums in flooding at an urban scale and optimizing the quality of regional medical emergency services.

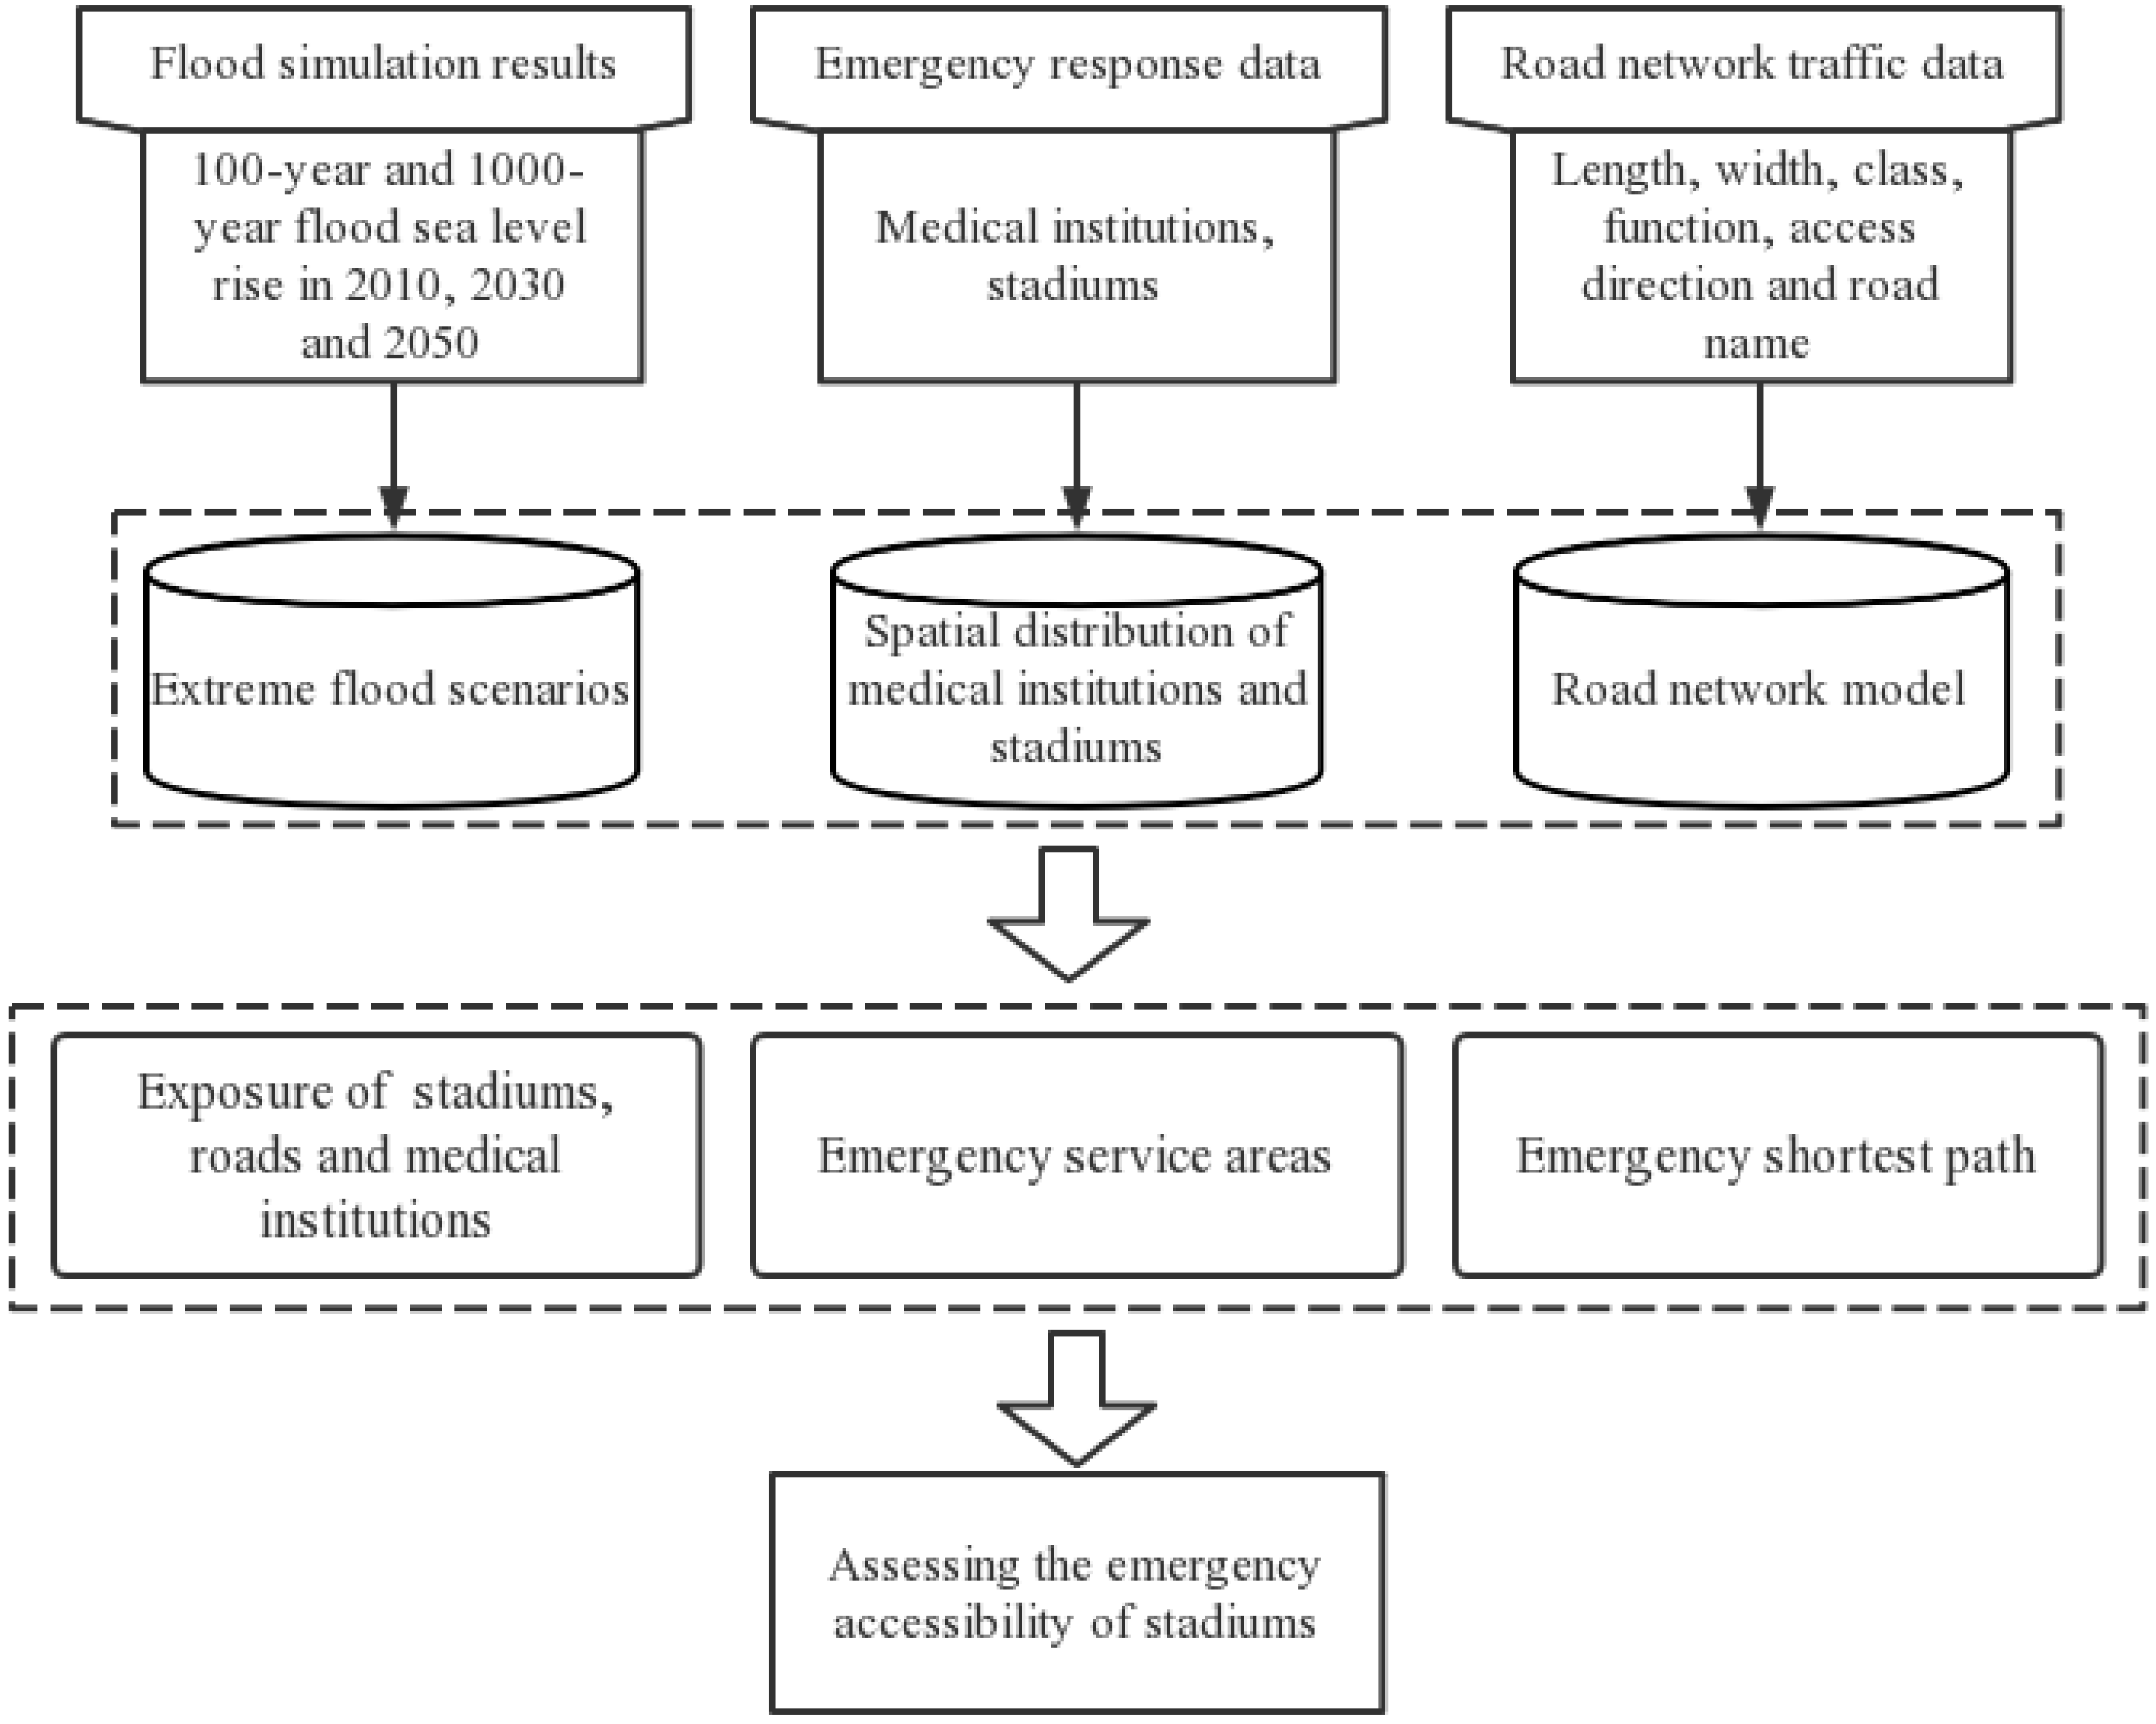
2. Data and Methodology
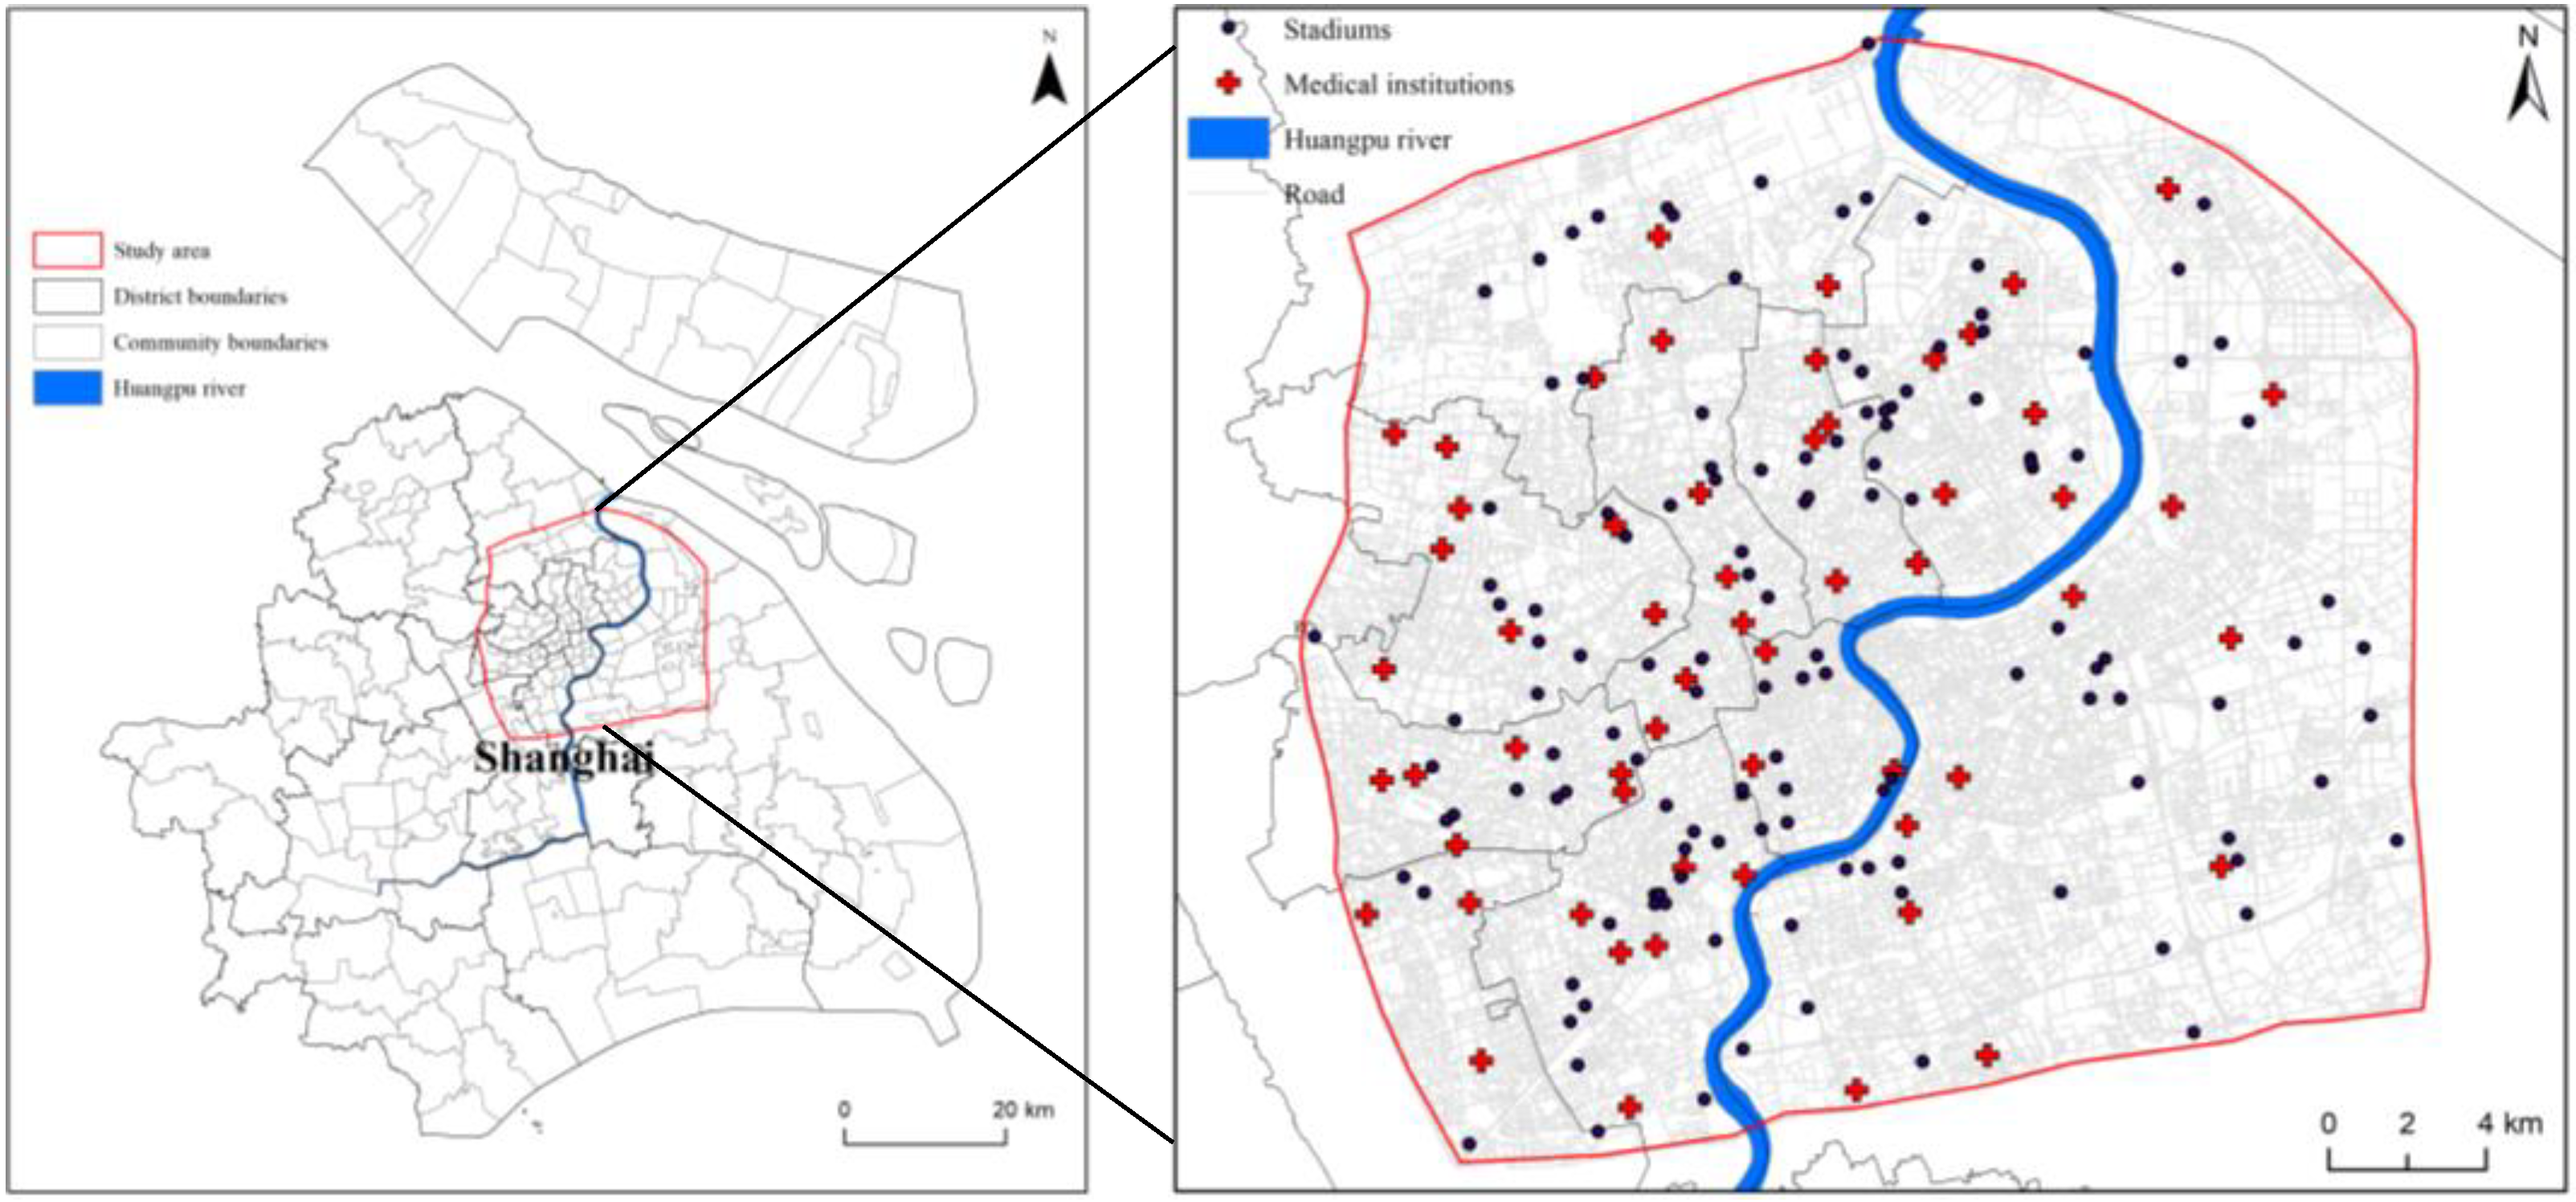
2.1. Study Area

Shanghai is located in the eastern part of China, on the eastern edge of the Yangtze River Delta, at the intersection of China’s “Belt and Road” initiative and the “Yangtze River Economic Belt” development strategy, which is the economic, financial, trade and transportation centre of China. The Yangtze River Delta lies at the centre of the coastline in the north and south of China and is surrounded by water on all sides, with the East China Sea to the east, Hangzhou Bay to the south, and Taihu Lake to the west. The Huangpu River winds through the city from west to east in its upper reaches and changes direction from south to north in its middle and lower reaches, dividing Shanghai into western and eastern parts. The central city within the outer ring of Shanghai is the core area of the urban system, located in the middle and lower reaches of the Huangpu River, with a total area of about 667 km2 [33]. It is densely populated, highly asset-rich and low-lying, making it a typical flood-prone area (Figure 1). In recent years, ground subsidence (up to over 3 m), the reduction of the river network and the rapid increase in impermeable surfaces in the central city have led to a decrease in evapotranspiration, infiltration and an increase in direct runoff, exacerbating the depth of inundation and the extent of flooding. Historically, flooding has occurred frequently in downtown Shanghai, with over 500 floods occurring from 251 AD to 2000, according to incomplete statistics [34]. These events highlight the weakness of floodwalls, which are currently rated based only on their top height water level and do not directly consider other failure mechanisms, such as floodwall damage and gate failure, as disaster-causing mechanisms. To resist flooding, since the 1950s, Shanghai has built and repeatedly renovated and expanded the flood control wall system along the Huangpu River, of which the urban section can withstand once-in-a-millennium flooding (1984 design standards). However, the actual capacity of the flood control wall system along the Huangpu River has been greatly reduced due to sea level rise and ground settlement [35,36]. In the case of a compound flooding incident such as “typhoon, heavy rainfall, high tide and upstream water” [37], the urban flooding risk prevention and control situation will be extremely challenging.
Shanghai is rich in sports resources, with a strong demand for sports consumption and good development of the sports industry. By the end of 2019, the total size of the city’s sports industry was 178.088 billion yuan, with an added value of 55.896 billion yuan, accounting for 1.5% of the city’s GDP [38]. Between 2016 and 2020, 696 major domestic and international sporting events were successfully held in Shanghai. The impact of Shanghai brand sports events such as the F1 China Grand Prix, ATP 1000 Shanghai Masters, Shanghai International Marathon, the Global Equestrian Championships, and the World Golf Championships-HSBC Champions has increased year after year. The sports competition and performance industry have gradually become an important strategic support for Shanghai to build a globally famous sports city. The supporting professional sports stadium facilities have gradually become a new highlight in Shanghai’s urban development and construction.

2.2. Research Data

Data for this study consisted of flood inundation simulation results, road network traffic data, and spatial distribution data of urban public medical institutions and stadiums. The simulation results use inundation areas and depths in the once-in-a-century and once-in-a-millennium flood scenarios (in 2010, 2030, and 2050, mainly with different sea level heights) of the Huangpu River basin obtained from previous studies [39,40] and selected the flood zones in downtown Shanghai. Urban public medical institutions are medical emergency centres responsible for the unified dispatch of public health service resources in the central city of Shanghai, providing medical emergency services and rescue to the public. Stadiums, including gymnasiums, indoor stadiums, and sports halls, are professional places for sports training, sports competition, and physical exercise. The selection of stadiums in this study is based on the following two main criteria: 1. they have hosted international and domestic sports events; 2. they meet the requirements for temporary transformation into emergency shelters.
The list of stadiums and the data on urban public medical institutions come from the open map website, lbs.amap.com. The road network data was obtained from the 2013 Shanghai Traffic (Amap) navigation data set. Based on the research objectives, the central urban area’s road network data was screened, with 102,000 sections obtained. The list of attributes includes fundamental information such as length, width, class, function, access direction and road name. Concerning the “Technical Standard of Highway Engineering (JTG B01-2003)” and the actual situation of roads in Shanghai, the roads are divided into five grades with the maximum speed limit set as 120 km/h for expressways, 80 km/h for freeways, 60 km/h for main roads, 50 km/h for secondary roads and 30 km/h for branch roads. This study has selected public medical institutions and highly vulnerable stadiums in urban areas as critical research objects for flood disaster emergency services. For further analysis and modeling, the initial data is classified and screened using EXCEL 2016 and geographically processed using ArcGIS 10.8. After screening and processing the initial data, 57 medical institutions with emergency rescue capabilities and 137 stadiums with both cultural and sports welfare and emergency management values were obtained, as shown in Figure 1.

2.3. Methodology

Based on flood numerical simulations and GIS network analysis, this study assesses the impact of different levels of flooding and traffic congestion on the spatial accessibility of stadiums for emergency response. Thus, it provides a reference for how the urban sports industry can cope with the environmental risks of flooding. Firstly, the inundation of flooded stadiums, roads, and medical emergency institutions is identified according to the results of flood inundation simulations with different recurrence periods. Secondly, a road traffic network model is constructed. And the New Service Area function in the Network Analyst tool is used to calculate the service area covered by the emergency medical services under normal and different recurrence period inundation scenarios. Moreover, the New Closest Facility of GIS Network Analyst was used to simulate the shortest path from the medical emergency institutions to each stadium under normal flooding scenarios. Finally, recommendations for countermeasures to deal with the environmental risks of flooding in the urban sports industry are proposed (Figure 2).

2.3.1. Flood Numerical Simulation

The flood inundation maps of river basins in the Shanghai municipal area used in the study were obtained directly from the GIS Key Laboratory (Ministry of Education) of East China Normal University. This study considers once-in-a-century and once-in-a-millennium flood disaster scenarios underwater level conditions in 2010, 2030 and 2050. More information on the urban river flood models used in the analysis can be referred to the paper by Yin et al. [41] and Li et al. [42].

2.3.2. Identification of Flooded Stadiums

Stadiums were selected for the research objectives. According to the location of the stadiums in downtown Shanghai, the simulated flood disaster water depth distribution map was superimposed with the distribution map of the stadiums in the area. The superimposed layer of the stadiums in downtown Shanghai and the disaster water depth were then obtained to determine whether each stadium would be affected by the flooding and the inundation depth of the stadiums under the flooding disaster, as shown in Figure 2.

2.3.3. Identification of Inundated Roads and Emergency Service Areas

This study used ArcGIS 10.8 to reclassify the flood inundation area, selected 0.3 m as the water depth (the height of vehicle exhaust and the standard for waterlogged roads in some cities) as the classification threshold and overlaid the area with inundation depth beyond 0.3 m with the central city road network. The cleared inundated road network is the affected area. The existing road network was imported into the layers using the “Network Dataset” in ArcGIS 10.8 to construct the topological relationship of the traffic road network. Next, by using the “New Service Area” function of the Network Analyst tool, each medical institution and road with a water depth of more than 0.3 m were imported into the service area analysis as facilities and line barriers, thereby calculating the service area covered by the medical emergency facilities under normal and different recurrence period inundation scenarios. Since emergency vehicles are exempt from some traffic regulations when providing rescue services, the standard traffic rules were not considered in this study. The scope of services that medical institutions can cover within 5, 10 and 15 min under typical and different recurrence period inundation scenarios was thus obtained (the optimal emergency time is within 8–10 min).

2.3.4. Emergency Shortest Path

The critical indicators for measuring the emergency rescue capability of urban public services to disasters are mainly spatial accessibility and its service scope based on road network analysis [43]. Therefore, this study uses the “New Closest Facility” for GIS network analysis. In the normal scenario, the shortest path exists from the medical institutions to the stadium. However, in the flooding scenario, some medical institutions lose their emergency response capacity, resulting in the need for more distant emergency points to assist at stadiums. In addition, the road is impassable when the water depth exceeds the warning line for vehicles, and emergency vehicles have to take a detour to the site of the incident. Both situations can lead to delays in response times. In the flooding scenario, vehicles cannot pass safely, and parts of the road network are closed when water reaches 0.25–0.35 m (the height of vehicle exhaust and the standard for waterlogged roads in some cities). It causes rescue vehicles to be inaccessible or require detours delaying rescue times. Thus, a road network with a water depth of below 0.3 m was used as the base road to simulate and calculate the shortest path from the urban public medical institutions to the location of each stadium. With Reference to the “Code for Transport Planning on Urban Road (GB50220-95)”, combined with the difference in the urban vehicle travel speed during daytimes, evenings, peak hours and weekends, the vehicle speed was set to the maximum speed limit in the S1, S2, S3 scenarios (Table 1), respectively, to include all potential urban vehicle travel conditions and to find the shortest path from medical institutions to stadiums for emergency rescue under normal and different degrees of flooding scenario, respectively.

3. Result Analysis

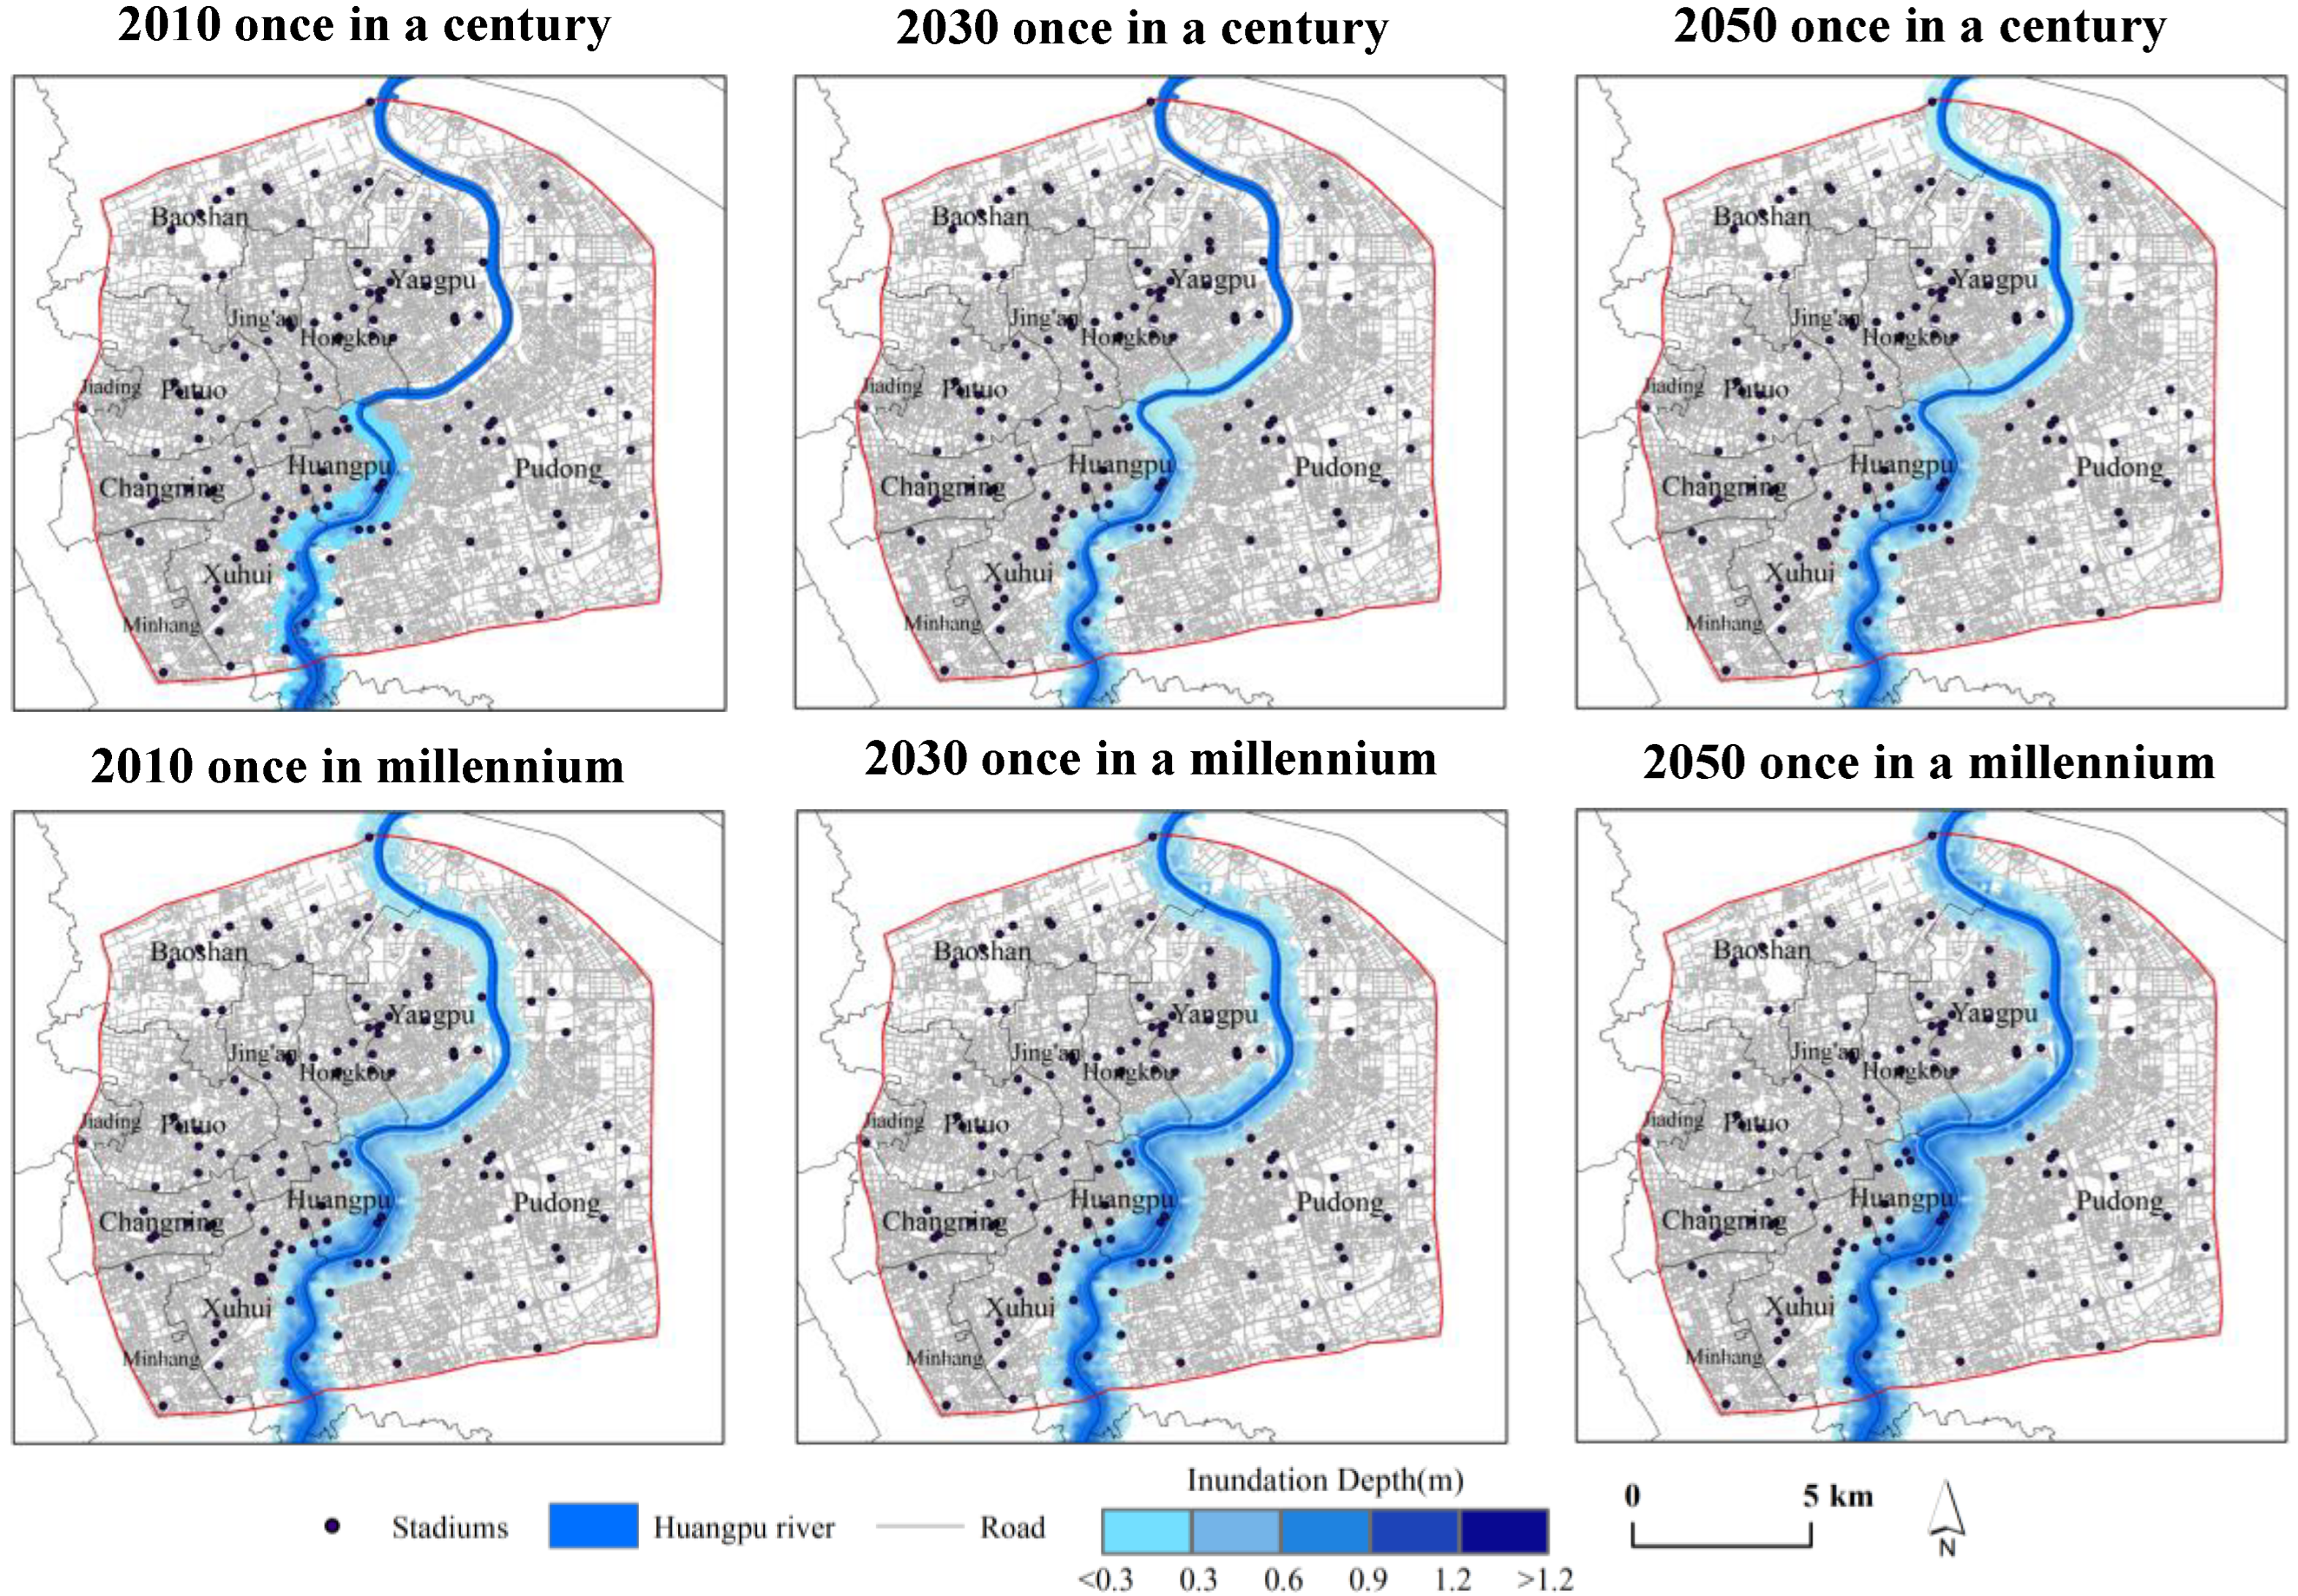
3.1. Flood Inundation and Exposure Analysis

According to the simulation results of inundation of stadiums in downtown Shanghai under the flood scenario (Figure 3), 8, 12, and 16 stadiums are inundated in 2010, 2030 and 2050 under the once-in-a-century flooding disasters, respectively. There are eight stadiums with inundation depths of more than 0.3 m in all three years, namely Shanghai Rowing Club (Long Wu Road Branch), Fei Meng Sports Park (Qian Tan Branch), DYNAMIX ACT, Shanghai Wei Ran Youth Sports Club, Shanghai Civil Aviation College Gymnasium, Expo Huangpu Sports Park, Huangpu District Workers’ Gymnasium and Mercedes-Benz Arena. 17, 17 and 22 stadiums being flooded in 2010, 2030 and 2050 in the once-in-a-millennium flooding disasters, respectively, with 10, 13 and 14 stadiums inundated to a depth of more than 0.3 m respectively. In 2010, the stadiums with an inundation depth of more than 0.3 m are Shanghai Rowing Club (Long Wu Road Branch), Fei Meng Sports Park (Qian Tan Branch), DYNAMIX ACT, Shanghai Wei Ran Youth Sports Club, Shanghai Civil Aviation College Gymnasium, Expo Huangpu Sports Park, Huangpu District Workers’ Gymnasium, Mercedes-Benz Arena, WEDER-TERA City Sports Hall, Shanghai Huangpu Gymnasium. The year 2030 adds the Shanghai Jiushi International Equestrian Centre, Shanghai Wusong Middle School Gymnasium and Shanghai Pudong Swimming Pool to the year 2010, while the year 2050 adds the Qiujiang Dock Road Football Stadium to the year 2030.

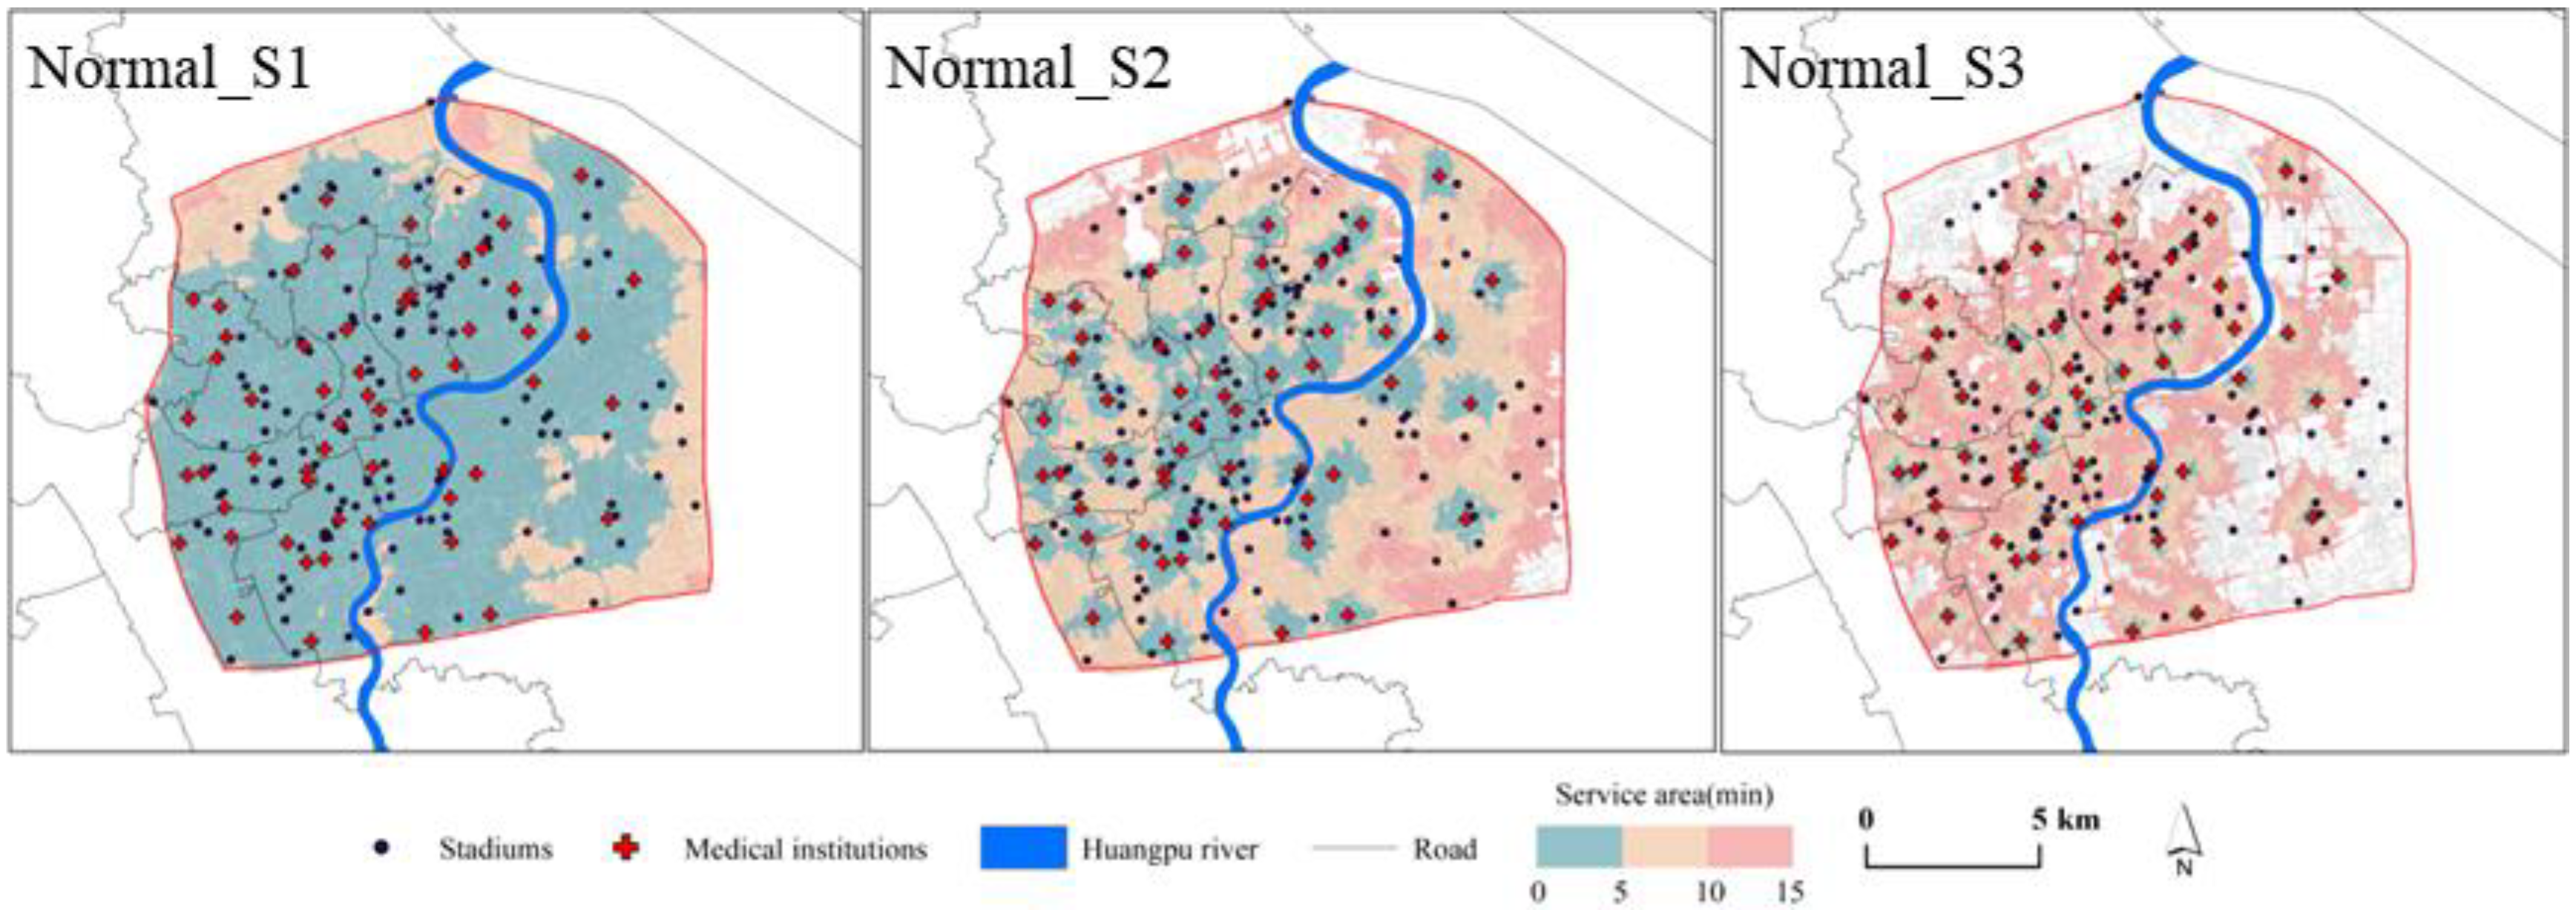
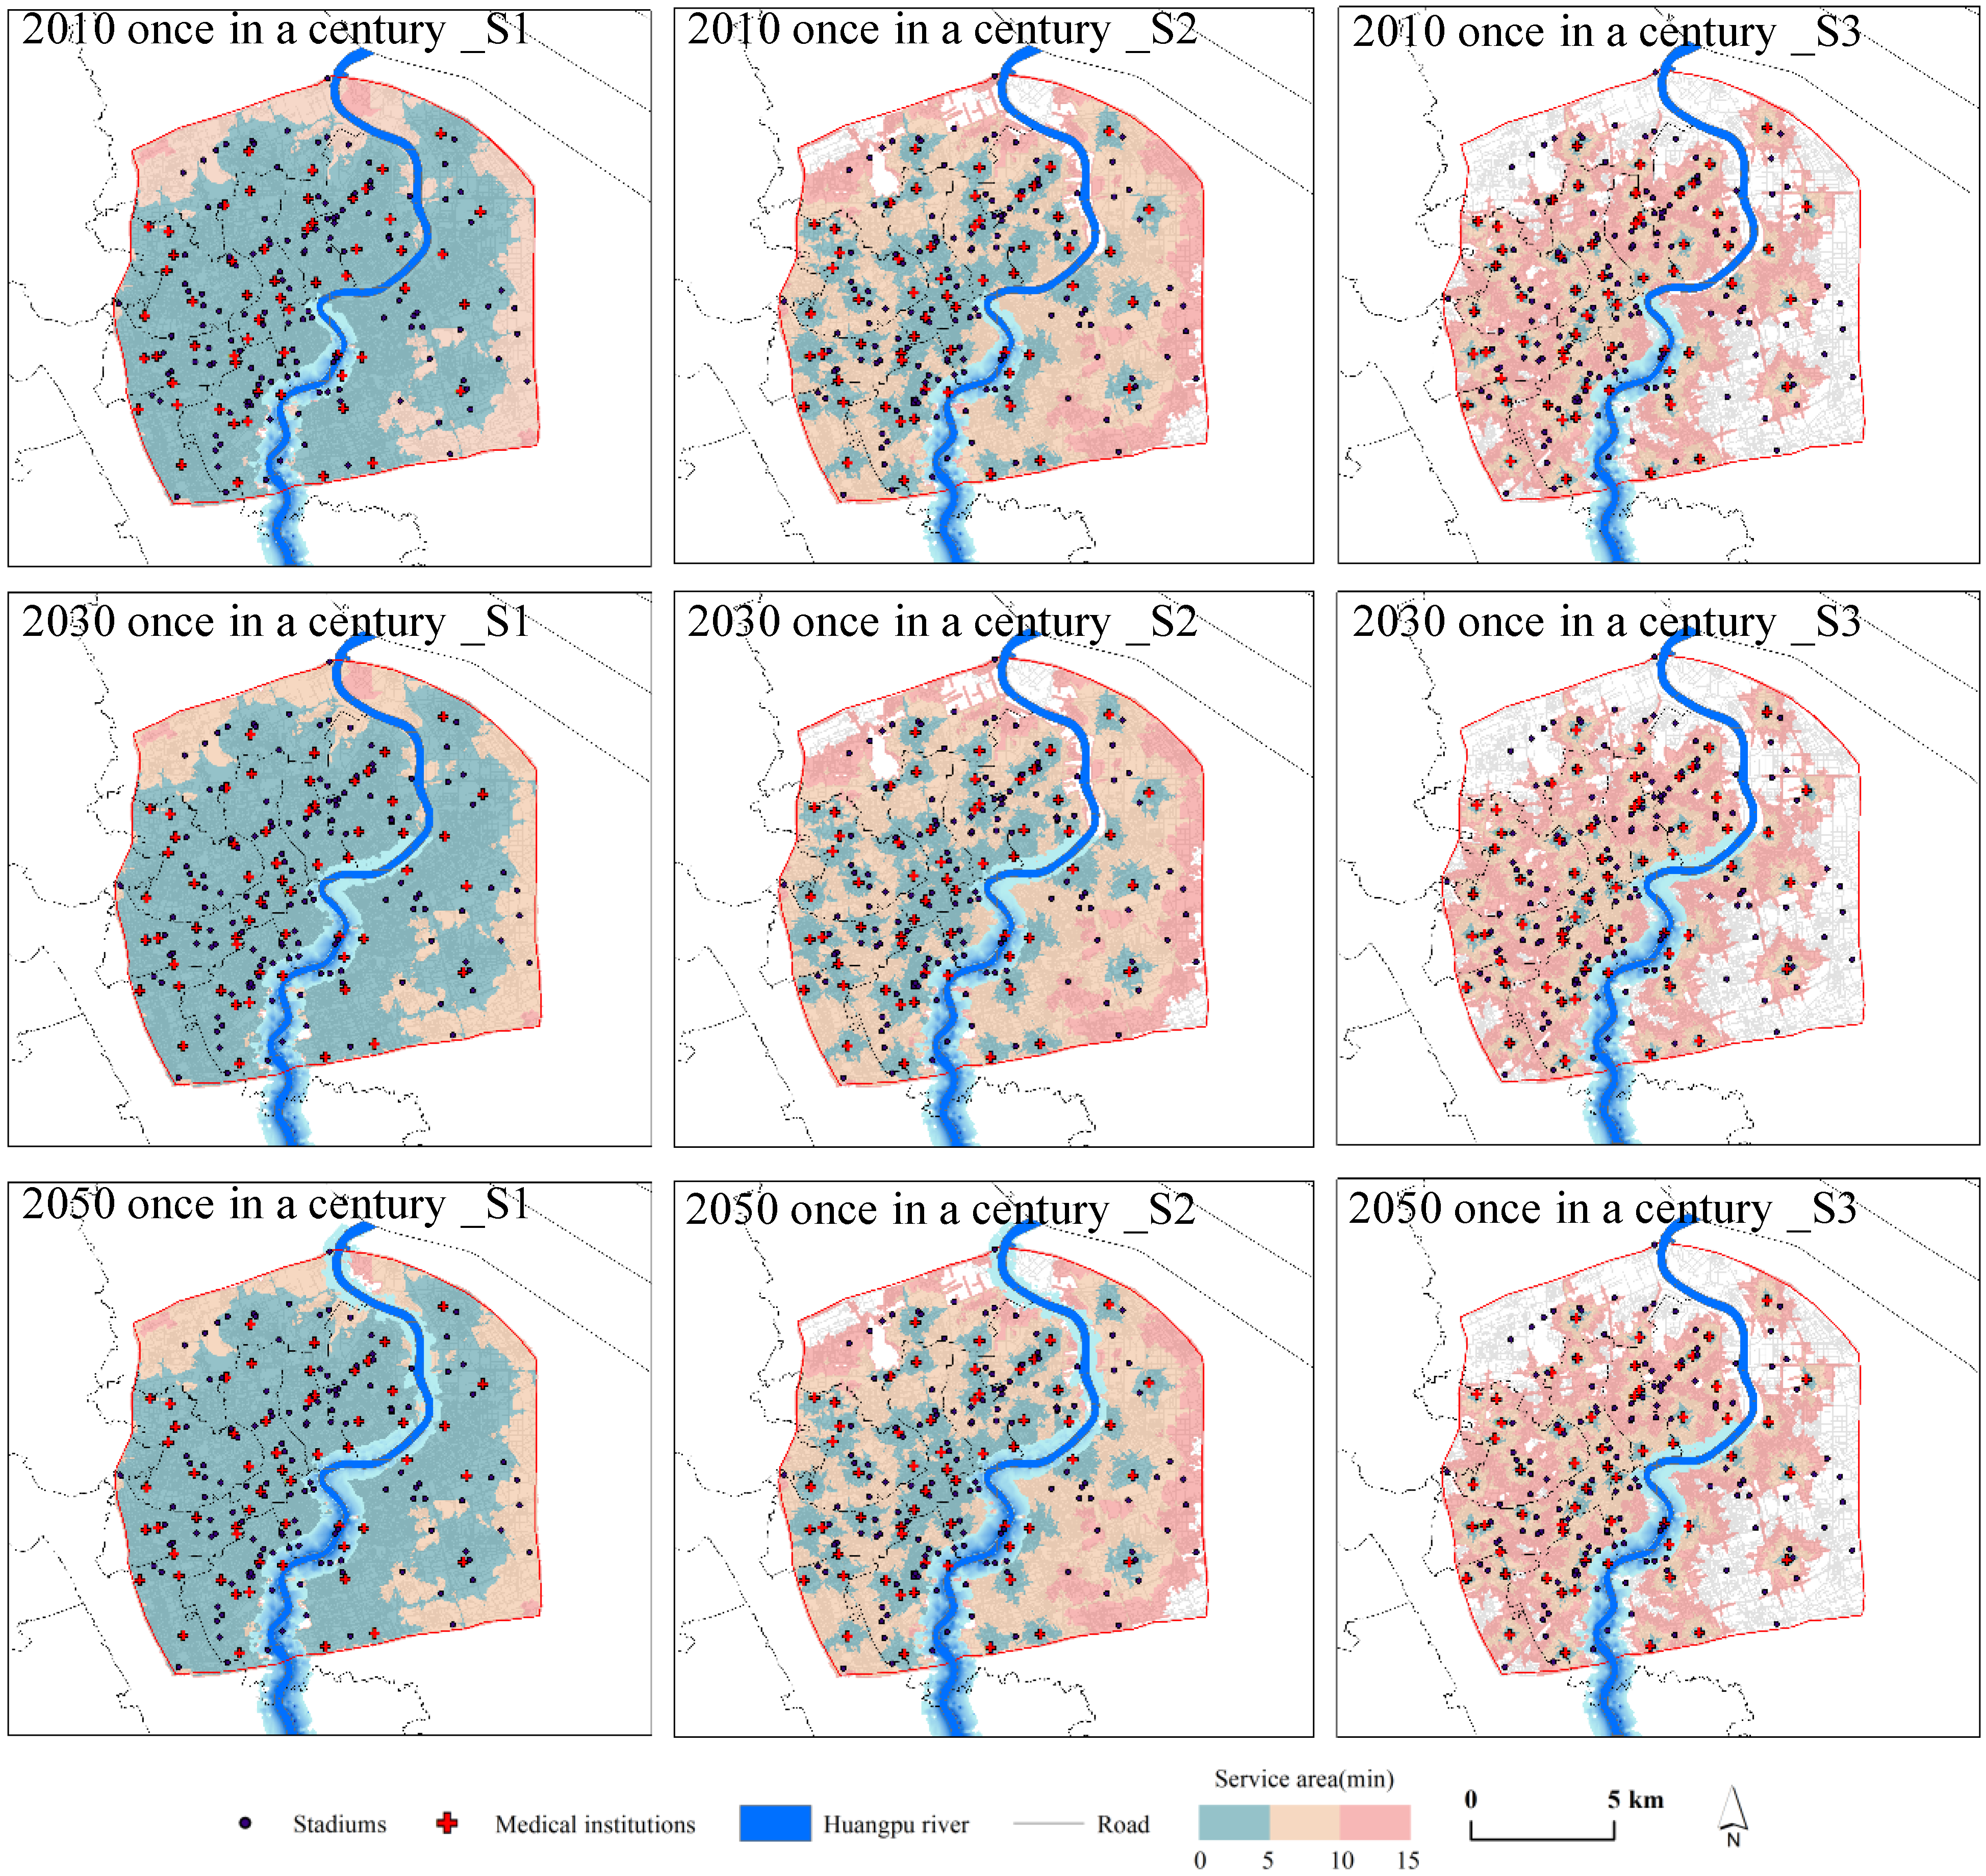
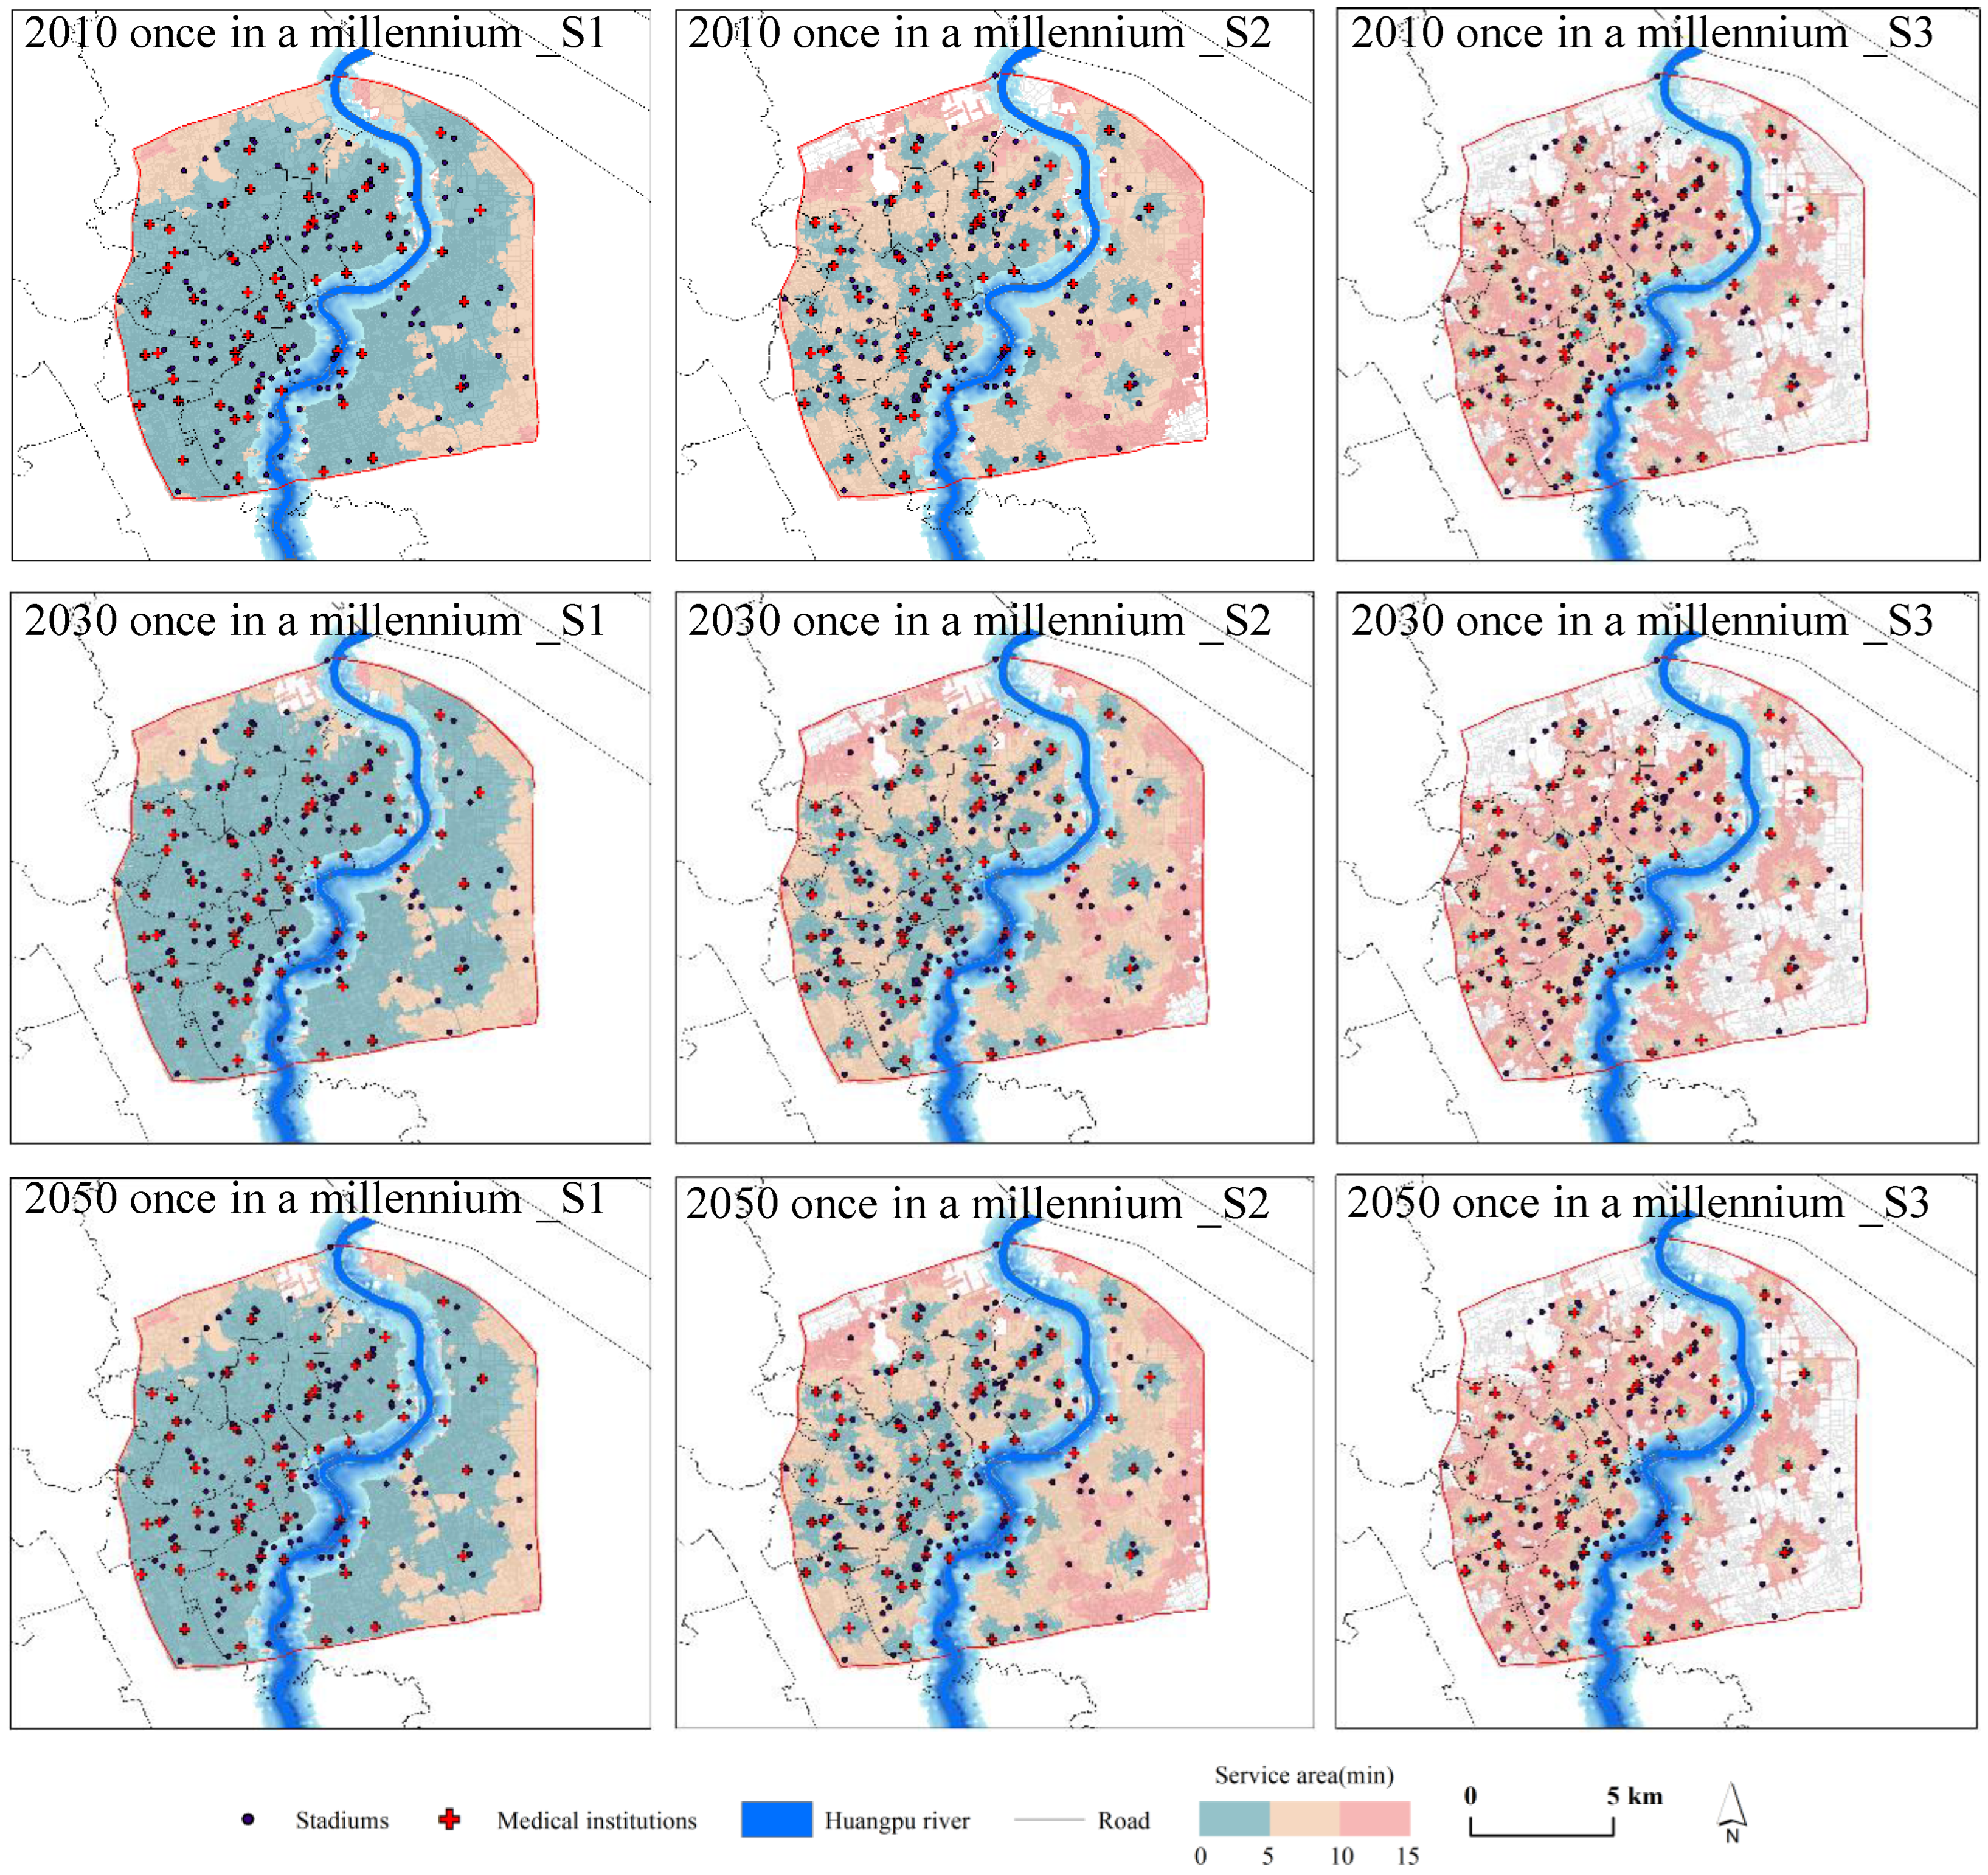
3.2. Emergency Service Area Analysis

Under a normal scenario (roads unaffected by waterlogging), almost all stadiums in the region have access to rapid medical emergency services, as shown in Figure 4 and Table 2, because of the relatively high number of medical institutions in the central city. In the S1 scenario, where the road is clear, 90% of the stadiums are reachable by ambulance within 5 min, with a significant degree of overlap between the service areas of each medical institution. The emergency response is thus rapid and efficient. Under the S2 scenario, normal traffic conditions (partial road congestion) and medical emergency services to stadiums within 5 min dropped to 45%. All stadiums in the region have access to medical emergency services within 15 min. In comparison, under the S3 scenario during peak commuter traffic (extreme road congestion), 30 stadiums (22%) cannot access emergency services within 15 min.
Under the once-in-a-century flood scenario, some roads along the Huangpu River are blocked in Xuhui, Huangpu and Pudong districts due to waterlogging above 0.3 m. At the same time, the number of medical institutions losing their emergency response capacity in the affected areas has gradually increased due to the extent of flooding, with the number of medical institutions losing their emergency response functions in 2010, 2030 and 2050 being 2, 2 and 3. In the 2010 scenario, the scope of medical emergency services because of flooding is reduced, with five fewer stadiums available to emergency services at 15 min in the S3 scenario compared to the normal scenario, which represents about 4% of the whole number of stadiums. By 2030 and 2050, approximately 6% and 7% of stadiums will not have access to medical emergency services within 15 min under ideal traffic conditions in the S1 scenario. In comparison to the normal scenario, the number of stadiums that can be covered during the 5 min emergency response time is reduced by 7 (about 5%) and 8 (about 6%), respectively. Under the S3 scenario of extreme traffic congestion, medical emergency services are only able to cover 74% of the central city and 73% of the stadiums within 15 min, a reduction of approximately 4% and 5% compared to the normal no-flood scenario (Figure 5 and Table 2).
Under the once-in-a-millennium flood scenario, some municipal roads along the Huangpu River become impassable due to flooding, and the number of medical institutions in the affected areas is significantly higher than under the once-in-a-century flood scenario. The number of medical institutions that will lose their emergency response function in 2010, 2030 and 2050 is 3, 6 and 7, respectively. In the 2010 scenario, the number of stadiums without access to medical emergency services within the 15 min emergency response time ranges from 12 (S1) to 38 (S3), representing approximately 9% to 28% of the total number of stadiums in the central city. In 2030 and 2050, 90% and 88% of the total number of stadiums in the entire central city can be covered by medical emergency services within 5 min under ideal traffic conditions S1. However, about 10% and 12% of stadiums still do not have access to medical emergency services within 15 min. Under S3 conditions of extreme traffic congestion, medical emergency services could only cover 69% and 67% of the city’s stadiums within 15 min, a reduction of approximately 8% and 11% from the normal no-flood scenario (Figure 6 and Table 2).

3.3. Emergency Shortest Path

The stadium and its surroundings will be relatively unfamiliar to the participating athletes and sports events spectators. However, the emergency shelter value of the stadium is irreplaceable. During floods, the stadium will not only be one of the potentially most damaged areas of the city but may also act as a command hub for emergency evacuation and rescue tasks after a disaster. Therefore, it is essential to discuss the stadium’s emergency response. This article addresses this issue by calculating the fastest paths from medical institutions to each stadium within downtown Shanghai in 2010, 2030 and 2050 under normal, once-in-a-century and once-in-a-millennium flooding scenarios (Figure 6). Under normal scenarios, it takes approximately 2.90 min for medical emergency vehicles to reach all stadiums in the region, with a maximum arrival time of approximately 7.14 min. The flooding scenario prevents some stadiums from accessing emergency services due to traffic disruptions in some areas and delayed response times for some medical institutions. Under the once-in-a-century and S1 scenario, the number of stadiums without access to medical emergency services in 2010, 2030 and 2050 is 7, 8 and 10, and the average rescue time to reach 2, 3 and 3 stadiums is delayed by 0.47 min, 0.60 min and 0.92 min respectively. Under the once-in-a-millennium flood and S1 scenario, as the scope of the flooding impact expands, there is also a significant uptick in the number of medical institutions affected by the disaster. The number of stadiums losing medical emergency services in 2010, 2030 and 2050 is 12, 14 and 16, with the average rescue time reaching 5, 12 and 15 stadiums delayed by 0.57 min, 1.16 min and 1.00 min, respectively. The longest of these delays is over 4 min. The delay in emergency response time for medical facilities will continue to increase in the more congested road conditions of S2 and S3 (Figure 7).

4. Discussion

Global climate change, caused by human activities, has led to a significant increase in the intensity and frequency of extreme weather events [44]. At the same time, coupled with the proliferation of impermeable urban land areas during urbanization has dramatically altered the original water cycle processes, leading to an increasing impact of heavy rainfall and flooding, which has had an enormous impact on the normal socio-economic development of cities, regions and even countries [45,46].
The article aims to carry out an assessment of the accessibility of medical emergency services in stadiums under flooding scenarios through numerical flood simulation and GIS network analysis, taking stadiums in downtown Shanghai as the research object, in order to provide a case reference for improving the level of emergency management of stadiums under flooding in urban scale and optimising the quality of regional medical emergency services. Previous work on the accessibility of urban public emergency response services under different flooding scenarios (river flooding and storm inundation) has been comprehensive and a research paradigm has been initially established. However, it should be recognized that previous work on the accessibility of urban public emergency response services has been limited to studies of urban flood emergency response under ideal traffic conditions (maximum or average speed), without fully considering the impact of possible urban traffic congestion and human travel behaviour on disaster emergency response [47,48,49]. This study provides a focused analysis of the urban road network, taking complete account of various traffic conditions, classifying road traffic speeds, and carrying out sensitivity analysis, which can more realistically reflect the impact of flooding inundation on urban emergency response time and rescue efficiency. Regarding flood risk prevention and control for stadiums, research on emergency management of stadiums at home and abroad needs to be more mature and still a relatively new research field. The theoretical foundation is fragile and mainly focuses on the management and recovery after the occurrence of hazards [30,31,50], especially lacking quantitative research on the impact of natural hazards on urban stadiums and the research on the emergency accessibility of stadiums based on risk prevention has not yet begun. Most of the studies have isolated the stadium from its environment and explored the risk prevention and control issues from the perspective of stadium facilities [51], stadium management systems [52], and stadium participants [53,54]. There needs to be more research that places stadiums in specific scenarios that tie them to their surroundings and thus analyzes their ability to interact with other public services in extreme disaster situations. Therefore, based on the risk threat posed by hazards to the sports industry, especially the high frequency and hazard of floods, the potential risks, and significant losses, and the importance and urgency of weak emergency management in sports stadiums, this study shifts the focus of emergency management research forward to examine the emergency accessibility of stadiums based on the principle of risk prevention and on the premise that risks can be made manageable and do not turn into disaster events. A representative area of Shanghai was selected as the empirical study area, and stadiums that regularly host various major events were selected as the primary research subjects. Based on the simulation of flooding scenarios, ArcGIS network analysis was used to analyze the emergency accessibility of stadiums under flooding scenarios. This study not only enriches the theoretical system of stadium emergency management from the perspective of pre-disaster risk prevention but also fills the gap in the quantitative study of stadium emergency management and provides decision-making suggestions for stadium risk prevention, hazard prevention and mitigation, improvement of emergency response capacity and sustainable development. It has specific research value at both the theoretical and practical levels.

5. Conclusions and Prospects

Based on the principle of risk prevention, this paper is the first to analyze the spatial accessibility of emergency response for stadiums in downtown Shanghai under extreme flooding scenarios, filling a gap in quantitative research on the emergency management of stadiums. The main conclusions are as follows:
(1)
The research shows that under current and different recurrence scenarios, the inundation area is primarily concentrated within 3 km of the Huangpu River. Furthermore, it shows a trend of gradual expansion from north to south.
(2)
In extreme flood scenarios, more and more stadiums are affected as the flooded area extends. 8, 12 and 16 stadiums are flooded under the once-in-a-century flood scenario in 2010, 2030 and 2050 respectively; 17, 17 and 22 stadiums are flooded under the once-in-a-millennium flood scenario in 2010, 2030 and 2050 respectively.
(3)
Under normal and flooding inundation scenarios, medical facilities in central Shanghai have the fastest paths to reach each stadium according to the speeds of S1, S2 and S3. In the flood scenario, some roads along the Huangpu River in the municipal area are impassable to vehicles due to flooding. Some stadiums might have delays or even unavailability of medical emergency vehicles. Also, up to 15 stadiums will experience delays in accessing emergency services.
(4)
Overall, the floods do not affect the central city to a large extent, with the impact mainly concentrated on both sides of the Huangpu River. However, as most of the city’s significant sports events held in professional stadium facilities are located along the river, the situation will be even more complicated if the stadiums are damaged. Therefore, it is necessary to explore further disaster prevention and mitigation measures for stadiums in central urban areas in the case of flooding.
Further practical actions should be taken in Shanghai to ensure the accessibility of critical nodes and sections of the urban road network and emergency public services under flooding scenarios. Firstly, Shanghai should continue to improve its flood control system to adapt to the current climate change, optimize the city’s own flood control and storage functions, and strengthen the construction of sponge cities, the renovation of comprehensive urban underground corridors and the comprehensive management of urban flood-prone spots. Secondly, based on the city’s overall development plan, Shanghai should reasonably plan and lay out the city’s primary emergency response departments and public service facilities, and relocate some of the more vulnerable public service units in heavily flooded areas. The city’s key public service sectors could be reasonably spread out to avoid the problem of spatial mismatch. For stadiums located in heavily flooded areas, emergency plans should be drawn up in accordance with the scale of the stadium, the type of stadium and other characteristics, set up disaster warnings, equipped with shelter materials and rescue equipment, and regularly carry out flood prevention rehearsals to ensure effective measures and responses to heavy rainfall and flooding disasters to enhance the resilience of the stadium. Thirdly, the wading capability of medical emergency vehicles could be further optimized. Other means of transport (such as hovercrafts, amphibious vehicles, helicopters, etc.) could also be deployed in a timely and coordinated manner in extreme weather warning situations to adequately safeguard the emergency response capabilities of key public services in the city. A fleet of air boats could be set up in Shanghai specifically for emergency rescue work in severe conditions. The air boat is amphibious, high speed and flexible, allowing it to travel over all terrains and reach areas that cannot be accessed by vehicles, thus improving the efficiency of emergency rescue. Finally, real-time flood forecasts and traffic information should provide route navigation for emergency vehicles, guiding them to safely pass through (or avoid) flooded areas and ensuring the spatial accessibility of emergency public services.
Urban natural hazard risk systems are highly complex and subject to multivariate factors, leading to the complexity and enormity of disaster risk assessment. This article explored the impact of flooding on the spatial accessibility of medical emergency response in stadiums. Next, research in this area can focus on disaster risk assessment for different urban natural hazards in terms of infrastructure, transport, industrial and mining enterprises and ecological environment, strengthen the risk assessment and empirical research on different types of natural hazards, accelerate the construction of urban natural disaster risk research database, and realise the dynamic assessment of natural disaster risk, to continuously improve the disaster mitigation and risk management capability of urban communities. There are also limitations to the study, such as the lack of consideration of real-time road access and the differences in size and function of different stadiums. Future research should be further refined and extended in the following two areas: (1) based on urban traffic data and emergency vehicle attendance data, the speed of emergency vehicles is optimized for flooding scenarios. (2) Realistically, each stadium’s actual size and function often differ. Subsequent studies could consider the differences in the flood resilience of different types of stadiums, refine the classification of stadiums and comprehensively analyze their emergency accessibility.

Author Contributions

Methodology, Y.S. and Q.Y.; Formal analysis, Y.W.; Data curation, Y.W.; Writing—original draft, Y.W.; Writing—review & editing, H.L. and Y.S.; Visualization, Y.W.; Supervision, H.L.; Project administration, Y.S.; Funding acquisition, H.L. All authors have read and agreed to the published version of the manuscript.

Funding

This research was funded by the National Social Science Foundation of China (Grant number: 19BTY012) and the National Natural Science Foundation of China (Grant number: 41601566).

Conflicts of Interest

The authors declare no conflict of interest.

References

  1. Field, C.B.; Barros, V.R.; Change, I.P.C. (Eds.) Climate Change 2014: Impacts, Adaptation, and Vulnerability. Part A: Global and Sectoral Aspects; Contribution of Working Group II to the Fifth Assessment Report of the Intergovernmental Panel on Climate Change; Guangdong Academy of Agricultural Sciences: Guangzhou, China, 2014. [Google Scholar]
  2. Qiu, H.J.; Cao, M.M.; Sheng, H.U.; Wang, Y.M.; Hao, J.Q.; Liu, W. Susceptibility and Periodicity of Flood Disasters Since the 1950s in China. Earth Environ. 2014, 42, 17–24. [Google Scholar]
  3. Yin, Z.E.; Xu, S.Y.; Yin, J.; Wang, J. Small-scale Based Scenario Modeling and Disaster Risk Assessment of Urban Rainstorm Water-logging. Acta Geogr. Sin. 2010, 65, 553–562. [Google Scholar]
  4. Mules, T.; Faulkner, B. An economic perspective on special events. Tour. Econ. 1996, 2, 107–117. [Google Scholar] [CrossRef]
  5. Crompton, J.L. The economic impact of sports tournaments and events. Parks Recreat.-West VA 1999, 34, 142–151. [Google Scholar]
  6. Burbank, M.; Andranovich, G.; Heying, C.H. Olympic Dreams: The Impact of Mega-Events on Local Politics; Lynne Rienner Publishers: Colorado, CO, USA, 2001. [Google Scholar]
  7. Baade, R.A.; Dye, R.F. The impact of stadium and professional sports on metropolitan area development. Growth Change 1990, 21, 1–14. [Google Scholar] [CrossRef]
  8. Stevens, T. Sport and Urban Tourism Destinations: The Evolving Sport, Tourism and Leisure Functions of the Modern Stadium. In Sport Tourism Destinations; Elsevier: Amsterdam, The Netherlands, 2005; pp. 205–220. [Google Scholar]
  9. Li, S.X. Multi Functions of Large-scale Venues in the Construction of Public Sports Service System. J. Chengdu Sport Univ. 2014, 40, 17–21. [Google Scholar]
  10. Wang, F.Q.; Li, Q.Y. The Correlation between Traffic Accessibility and Positioning of Ten Major Large-Medium-sized Gymnasiums: A Case Study on the Guang-Fo Area. South Archit. 2021, 6, 100–106. [Google Scholar]
  11. Ma, T.P. The Value of Sports Stadium in Emergency Management and Traditional Cultural and Sports Functions. J. Hunan Univ. 2021, 35, 84–92. [Google Scholar]
  12. Fang, C.N.; Liu, F.Z. Construction of Wuhan Makeshift Hospitals and Functional Expansion of Sports Stadiums under COVID-19 Crisis. J. Wuhan Inst. Phys. Educ. 2020, 54, 5–11. [Google Scholar]
  13. Solomon, S. IPCC (2007): Climate Change the Physical Science Basis; Agu Fall Meeting Abstracts; United States Government Publishing Office: Washington, DC, USA, 2007; p. U43D-01. [Google Scholar]
  14. Liao, Y.; Nie, C.; Yang, L.; Li, H. An overview of the risk assessment of flood disaster. Prog. Geogr. 2012, 31, 361–367. [Google Scholar]
  15. Yin, J.; Jing, Y.; Yu, D.; Ye, M.; Yang, Y.; Liao, B. A vulnerability assessment of urban emergency in schools of Shanghai. Sustainability 2019, 11, 349. [Google Scholar] [CrossRef] [Green Version]
  16. Shan, X.; Wen, J.; Zhang, M.; Wang, L.; Ke, Q.; Li, W.; Du, S.; Shi, Y.; Chen, K.; Liao, B. Scenario-based extreme flood risk of residential buildings and household properties in Shanghai. Sustainability 2019, 11, 3202. [Google Scholar] [CrossRef] [Green Version]
  17. Shi, Y. Population vulnerability assessment based on scenario simulation of rainstorm-induced waterlogging: A case study of Xuhui District, Shanghai City. Nat. Hazards 2013, 66, 1189–1203. [Google Scholar] [CrossRef]
  18. Yin, J.; Yu, D.; Lin, N.; Wilby, R.L. Evaluating the cascading impacts of sea level rise and coastal flooding on emergency response spatial accessibility in Lower Manhattan, New York City. J. Hydrol. 2017, 555, 648–658. [Google Scholar] [CrossRef] [Green Version]
  19. Yang, J.; Pei, Y.; Zhang, Y.; Ge, Q. Risk assessment of precipitation extremes in northern Xinjiang, China. Theor. Appl. Climatol. 2018, 132, 823–834. [Google Scholar] [CrossRef] [Green Version]
  20. Chen, Y.; Wang, Y.; Zhang, Y.; Luan, Q.; Chen, X. Flash floods, land-use change, and risk dynamics in mountainous tourist areas: A case study of the Yesanpo Scenic Area, Beijing, China. Int. J. Disaster Risk Reduct. 2020, 50, 101873. [Google Scholar] [CrossRef]
  21. Chen, Y.; Li, J.; Chen, A. Does high risk mean high loss: Evidence from flood disaster in southern China. Sci. Total Environ. 2021, 785, 147127. [Google Scholar] [CrossRef]
  22. Becker, P.; Tehler, H. Constructing a common holistic description of what is valuable and important to protect: A possible requisite for disaster risk management. Int. J. Disaster Risk Reduct. 2013, 6, 18–27. [Google Scholar] [CrossRef]
  23. Coles, D.; Yu, D.; Wilby, R.L.; Green, D.; Herring, Z. Beyond ‘flood hotspots’: Modelling emergency service accessibility during flooding in York, UK. J. Hydrol. 2017, 546, 419–436. [Google Scholar] [CrossRef] [Green Version]
  24. Mojtahedi, M.; Oo, B.L. Critical attributes for proactive engagement of stakeholders in disaster risk management. Int. J. Disaster Risk Reduct. 2017, 21, 35–43. [Google Scholar] [CrossRef]
  25. Yin, J.; Xu, S.; Jing, Y.; Yin, Z.; Liao, B. Evaluating the impact of fluvial flooding on emergency responses accessibility for a mega-city’s public services: A case study of emergency medical service. J. Geogr. Sci. 2018, 73, 1737–1747. [Google Scholar]
  26. Asgary, A.; Anjum, M.I.; Azimi, N. Disaster recovery and business continuity after the 2010 flood in Pakistan: Case of small businesses. Int. J. Disaster Risk Reduct. 2012, 2, 46–56. [Google Scholar] [CrossRef]
  27. Gourevitch, J.D.; Singh, N.K.; Minot, J.; Raub, K.B.; Rizzo, D.M.; Wemple, B.C.; Ricketts, T.H. Spatial targeting of floodplain restoration to equitably mitigate flood risk. Glob. Environ. Change 2020, 61, 102050. [Google Scholar] [CrossRef]
  28. Xiao, Y.; Tian, K.; Yuan, M.; Ouyang, Y.; Huang, H. Examining the complex relationships between socioeconomic development and the improvement of ecological environment in post-disaster reconstruction: The case of Wenchuan earthquake disaster area in Western China. J. Clean. Prod. 2022, 337, 130581. [Google Scholar] [CrossRef]
  29. Arrighi, C.; Pregnolato, M.; Dawson, R.; Castelli, F. Preparedness against mobility disruption by floods. Sci. Total Environ. 2019, 654, 1010–1022. [Google Scholar] [CrossRef]
  30. Duarte, M.; Fonseca, P.; Ortigao, A. Flash flood control works around the Maracana stadium district in Rio de Janeiro, Brazil. In Institution of Civil Engineers-Civil Engineering; Thomas Telford Ltd: London, UK, 2013; pp. 44–48. [Google Scholar]
  31. Zhu, Y. Strategies for Prevention and Control of Flood Control Safety and Environmental Risks in Stadiums under the Influence of Marine Climate. J. Coast. Res. 2020, 104, 756–760. [Google Scholar] [CrossRef]
  32. Environment, D.F.; Affairs, R. The National Flood Emergency Framework for England; Defra: London, UK, 2014. [Google Scholar]
  33. Shi, Y.; Yao, Q.; Wen, J.; Xi, J.; Li, H.; Wang, Q. A spatial accessibility assessment of urban tourist attractions emergency response in Shanghai. Int. J. Disaster Risk Reduct. 2022, 74, 102919. [Google Scholar] [CrossRef]
  34. Quan, R. Risk assessment of flood disaster in Shanghai based on spatial–temporal characteristics analysis from 251 to 2000. Environ. Earth Sci. 2014, 72, 4627–4638. [Google Scholar] [CrossRef]
  35. Yin, J.; Yu, D.; Yin, Z.; Wang, J.; Xu, S. Modelling the combined impacts of sea-level rise and land subsidence on storm tides induced flooding of the Huangpu River in Shanghai, China. Clim. Change 2013, 119, 919–932. [Google Scholar] [CrossRef]
  36. Yin, J.; Yu, D.; Yin, Z.; Wang, J.; Xu, S. Modelling the anthropogenic impacts on fluvial flood risks in a coastal mega-city: A scenario-based case study in Shanghai, China. Landsc. Urban. Plan. 2015, 136, 144–155. [Google Scholar] [CrossRef]
  37. He, F.F.; Hu, H.Z.; Dong, G.T.; Xu, H.Q. Compound Flooding Simulation and Prediction of Future Recurrence in Shanghai Downtown Area. J. Catastrophol. 2020, 35, 93–98. [Google Scholar]
  38. Notice of the General Office of the Shanghai Municipal People’s Government on the Issuance of the “14th Five-Year Plan” for the Development of Sports in Shanghai. 2021. Available online: https://www.shanghai.gov.cn/202120bgtwj/20211022/956b7bbb68fb4267bbcd6b5b440b5507.html (accessed on 14 September 2022).
  39. Yin, J.; Yu, D.; Yin, Z.; Wang, J.; Xu, S. Multiple scenario analyses of Huangpu River flooding using a 1D/2D coupled flood inundation model. Nat. Hazards 2013, 66, 577–589. [Google Scholar] [CrossRef]
  40. Wang, J.; Deng, Y.; Song, C.; Tian, D. Measuring time accessibility and its spatial characteristics in the urban areas of Beijing. J. Geogr. Sci. 2016, 26, 1754–1768. [Google Scholar] [CrossRef] [Green Version]
  41. Yin, J.; Yu, D.; Wilby, R. Modelling the impact of land subsidence on urban pluvial flooding: A case study of downtown Shanghai, China. Sci. Total Environ. 2016, 544, 744–753. [Google Scholar] [CrossRef] [Green Version]
  42. Li, M.; Kwan, M.-P.; Yin, J.; Yu, D.; Wang, J. The potential effect of a 100-year pluvial flood event on metro accessibility and ridership: A case study of central Shanghai, China. Appl. Geogr. 2018, 100, 21–29. [Google Scholar] [CrossRef]
  43. Su, F.; Yin, J.; Yin, Z.E.; Yu, D.P.; Xu, S.Y. Variation Analysis of Flood Dynamic Risk in Huangpu River Basin. Sci. Geogr. Sin. 2014, 34, 621–626. [Google Scholar]
  44. Stott, P. How climate change affects extreme weather events. Science 2016, 352, 1517–1518. [Google Scholar] [CrossRef]
  45. Huff, F.A. Characteristics and Contributing Causes of an Abnormal Frequency of Flood-Producing Rainstorms at Chicago 1. JAWRA J. Am. Water Resour. Assoc. 1995, 31, 703–714. [Google Scholar] [CrossRef]
  46. Xu, H.; Ma, C.; Lian, J.; Xu, K.; Chaima, E. Urban flooding risk assessment based on an integrated k-means cluster algorithm and improved entropy weight method in the region of Haikou, China. J. Hydrol. 2018, 563, 975–986. [Google Scholar] [CrossRef]
  47. Sohn, J. Evaluating the Significance of Highway Network Links Under the Flood Damage: An Accessibility Approach; Transportation Research Part A: Policy and Practice; Elsevier: Amsterdam, The Netherlands, 2006; pp. 491–506. [Google Scholar]
  48. Chang, M.-S.; Tseng, Y.-L.; Chen, J.-W. A Scenario Planning Approach for the Flood Emergency Logistics Preparation Problem Under Uncertainty; Transportation Research Part E: Logistics and Transportation Review; Elsevier: Amsterdam, The Netherlands, 2007; pp. 737–754. [Google Scholar]
  49. Bodoque, J.M.; Amérigo, M.; Díez-Herrero, A.; García, J.A.; Cortés, B.; Ballesteros-Cánovas, J.A.; Olcina, J. Improvement of resilience of urban areas by integrating social perception in flash-flood risk management. J. Hydrol. 2016, 541, 665–676. [Google Scholar] [CrossRef] [Green Version]
  50. Gulzar, S.M.; Mir, F.U.H.; Rafiqui, M.; Tantray, M.A. Damage assessment of residential constructions in post-flood scenarios: A case of 2014 Kashmir floods. Environ. Dev. Sustain. 2021, 23, 4201–4214. [Google Scholar] [CrossRef]
  51. Brown, M.T. Sport Facility Management: Organizing Events and Mitigating Risks. J. Sport Manag. 2004, 18, 296–298. [Google Scholar] [CrossRef]
  52. Dang, Z.; Liu, S.; Li, T.; Gao, L. Analysis of stadium operation risk warning model based on deep confidence neural network Algorithm. Comput. Intell. Neurosci. 2021, 2021, 3715116. [Google Scholar] [CrossRef]
  53. Leopkey, B.; Parent, M.M. Risk management strategies by stakeholders in Canadian major sporting events. Event Manag. 2009, 13, 153–170. [Google Scholar] [CrossRef]
  54. Gratz, J.; Church, R.; Noble, E. Safeguarding the Spectator. Weatherwise 2005, 58, 42–45. [Google Scholar] [CrossRef]
Figure 1. Location of the study area.
Sustainability 14 17041 g001
Figure 2. Research methodologies.
Sustainability 14 17041 g002
Figure 3. Inundation extents and depths for flood scenarios in the city center of Shanghai.
Sustainability 14 17041 g003
Figure 4. Accessibility for medical emergency service under normal conditions.
Sustainability 14 17041 g004
Figure 5. Accessibility for medical emergency service under the flood scenario once in a century.
Sustainability 14 17041 g005
Figure 6. Accessibility for medical emergency service under the flood scenario once in a millennium.
Sustainability 14 17041 g006
Figure 7. Closest facility analysis for medical institutions to stadiums under normal conditions and flood scenarios.
Sustainability 14 17041 g007
Table 1. Maximum speed limit in different classes of roads and speeds in different conditions. Source: [33].
TypeElevated
Road
ExpresswayMain
Road
Secondary
Road
Branch
Road
S1 (Maximum speed limit)12080605030
S2 (evening and weekend)1/2S11/2S11/2S11/2S11/2S1
S3 (daytime)1/4S11/4S11/4S11/4S11/4S1
Table 2. Medical emergency service areas under normal and flood scenarios.
Flood Scenarios5 min10 min15 min
S1S2S3S1S2S3S1S2S3
Normal123611113712361137137107
(90%)(45%)(8%)(100%)(90%)(45%)(100%)(100%)(78%)
2010_100y11757913011757130130102
(85%)(42%)(6%)(95%)(85%)(42%)(95%)(95%)(74%)
2030_100y11655912911657129129101
(85%)(40%)(6%)(94%)(85%)(42%)(94%)(94%)(74%)
2050_100y11556912711556127127100
(84%)(41%)(6%)(93%)(84%)(41%)(93%)(93%)(73%)
2010_1000y1145581251145512512599
(83%)(40%)(6%)(91%)(83%)(40%)(91%)(91%)(72%)
2030_1000y1115391231115312312394
(81%)(39%)(6%)(90%)(81%)(39%)(90%)(90%)(69%)
2050_1000y1095191211095112112192
(80%)(37%)(6%)(88%)(80%)(37%)(88%)(88%)(67%)
Publisher’s Note: MDPI stays neutral with regard to jurisdictional claims in published maps and institutional affiliations.

