Article

Ammonia Recovery from Organic Waste Digestate via Gas–Liquid Stripping: Application of the Factorial Design of Experiments and Comparison of the Influence of the Stripping Gas

1
Process and Environmental Technology Lab, Department of Chemical Engineering, KU Leuven, J. De Nayerlaan 5, B-2860 Sint-Katelijne-Waver, Belgium
2
School of Life Sciences and Technology, Avans University of Applied Sciences, Lovensdijkstraat 61, 4818 AJ Breda, The Netherlands
3
Department of Engineering Science, University of Oxford, Parks Road, Oxford OX1 3PJ, UK
*
Author to whom correspondence should be addressed.
Sustainability 2022, 14(24), 17000; https://doi.org/10.3390/su142417000
Submission received: 18 September 2022 / Revised: 27 November 2022 / Accepted: 8 December 2022 / Published: 19 December 2022
(This article belongs to the Topic New Advances in Waste and Biomass Valorization)

Abstract

:
The effects of temperature, pH, and gas-to-liquid-volume-ratio on ammonia recovery via gas–liquid stripping have been widely studied. However, there is a lack of a structured approach towards characterising the stripping process. Furthermore, limited information is available on the effect of the composition of the stripping gas on ammonia recovery. This study includes the application of a factorial design of experiments to ammonia stripping. The outcome is a mathematical relationship for ammonia recovery as a function of process conditions. The temperature was found to have the highest influence on ammonia recovery. With respect to the influence of the stripping gas, similar ammonia recoveries were reported when using air, CH4, and N2 (96, 92, and 95%, respectively). This was attributed to their similar influences on the pH of the digestate, and subsequently, on the free ammonia equilibrium. In addition, the presence of CO2 in the stripping gas had a critical effect on ammonia recovery due to its influence on the total ammonia equilibrium in the digestate. These results showed the possibility of using different stripping gases interchangeably to obtain similar ammonia recoveries, with a critical emphasis on their CO2 content.

1. Introduction

Anaerobic digestion (AD) is a well-established technology used to valorise organic waste streams into a renewable fuel in the form of biogas [1]. During AD, nitrogenous organic matter is decomposed to ammonia, which is present in the liquid phase as an equilibrium between two species: free ammonia (i.e., gaseous NH3) and ammonium ions (NH4+) [2,3]. The sum of these species is called total ammonia (TA). Free ammonia (FA) is known to inhibit the AD process above specific threshold concentrations (80 mg/L–1.1 g/L) [4,5]). Excess FA can negatively affect methanogenesis, decrease steady-state biogas yields, and inhibit the AD process [6,7]. Ammonia present in the effluent stream of an anaerobic digester (also called digestate) can also cause pollution in the atmosphere and water bodies [8]. Additionally, ammonia is known to be a compound that has widespread industrial and energetic applications. It is widely used for the production of nitrogen-containing fertilisers for agriculture, chemical compounds, materials, and pharmaceuticals [9]. Ammonia also has great energetic potential as its higher volumetric energy density makes it an easier fuel to store compared to hydrogen [10]. Furthermore, ammonia can be decomposed to produce hydrogen, which is a clean and renewable fuel. Therefore, the recovery of ammonia from the AD process not only solves both process inhibition and environmental pollution problems but also provides an opportunity for nutrient valorisation in congruence with the transition to a circular economy for future sustainable development.
Gas–liquid stripping is a widely established technology used to recover ammonia directly from anaerobic digestate [11,12]. The process is defined as the mass transfer of ammonia from the liquid phase (digestate) to the gas phase (stripping gas) [13]. This technology requires a relatively low energy input compared to other physiochemical separation methods (e.g., ion exchange resins, membrane separation, etc.). Furthermore, it is not adversely affected by solids in the liquid phase, which makes it an attractive separation technology [14]. The steps in the ammonia stripping process can be described as follows [15]: (i) conversion of NH4+ ions to FA, (ii) diffusion of FA from the bulk liquid phase to the interface between the liquid and gaseous phase, (iii) transfer of FA across the interface into the gaseous phase, and (iv) diffusion of FA into the bulk of the gas phase. Thermodynamically, the extent of ammonia recovery (AR) by stripping is dictated by the following equilibria: (i) the thermodynamic equilibrium of ammonia according to Henry’s law and (ii) the ammonia dissociation equilibrium [16,17]. Henry’s law dictates the distribution of ammonia in the liquid and gaseous phases at equilibrium. It is numerically represented as H NH 3 = p NH 3 c NH 3 , where H NH 3 is Henry’s coefficient of ammonia (kPa/(mol/L)), c NH 3 is the concentration of FA in the liquid phase (mol/L), and p NH 3 is the partial pressure of ammonia in the gaseous phase (Pa) [18]. H NH 3 depends upon multiple factors, such as the temperature and composition of the liquid phase [16]. The ammonia dissociation equilibrium is related to the distribution of the free ammonia and ammonium ion species (Equation (1)).
NH 4 +   NH 3 +   H +
The distribution of species in this equilibrium determines the FA that can be physically removed from the system and is governed by process conditions such as the pH and temperature of the liquid phase. An increase in both process conditions increases the proportion of FA, consequently increasing AR [12]. In addition to thermodynamic considerations, AR is also positively affected by the stripping gas flow rate [19]. An increase in the flow rate maintains the driving force for ammonia mass transfer and decreases the mass transfer resistance [20]. The gas flow rate can be combined with the stripping time and volume of the liquid and represented as a dimensionless number termed G/L ( G / L = Q g . t / V l ), where Q g is the gas flow rate, t is the stripping time, and V l is the volume of liquid stripped [21]. In this study G/L will be used instead of the gas flow rate. Many studies have experimentally demonstrated the positive effect of the three process conditions (temperature, pH, and G/L) on AR [16,22]. Leverenz et al. (2021) reported that ammonia concentrations decreased from 4 g N/L to 0.7 g N/L as the stripping temperature increased from 50 to 80 °C when stripping the liquid fraction of the thermophilic food waste digestate [4]. Similarly, an increase in pH from 8.5 to 11 enhanced AR from 25% to 80% from pig slurry digestate [19]. An increase in G/L from 0 to 3000 was shown to increase AR from 0% to 96% when stripping pig manure digestate [23].
However, while there is enough information on the influence of process conditions on AR from digestate, few studies proposed a structured approach for researchers to investigate AR [16]. Determining the precise range of process conditions to optimise AR can involve numerous experimental trials, making it a time- and cost-intensive process. A structured approach could help predict AR under certain conditions, thereby minimising the experiments that need to be performed. Furthermore, it is also desirable to obtain information on the relative influence of the process conditions with respect to each other. The current study addresses these knowledge gaps by applying a full factorial design of experiments to ammonia stripping. It is hypothesised that this design of experiments (DoE) can provide a numerical relationship with which to estimate the AR as a function of the process conditions. The current study also investigates which of the three process conditions has the strongest influence on AR. While full factorial DoE is a well-established technique, its application to gas–liquid stripping for recovering ammonia from digestate remains relatively less studied. In contrast to research on process conditions, the influence of the stripping-gas composition on AR has usually been overlooked. In the literature, the most commonly used stripping gases are N2, air, steam, and methane (as biogas) [11,24]. While the choice of stripping gas is frequently dictated by factors such as cost, availability, and post-stripping applications, few studies compare their influence on AR. This information could provide more flexibility in choosing a stripping gas for future studies. The choice of stripping gas can influence the AR via its effect on the composition of the liquid phase during the stripping process. It is well known that digestate contains inorganic species such as HCO3, CO32−, and dissolved CO2 in equilibrium [25]. The composition of the stripping gas can influence the concentration gradient between the CO2 in the liquid (digestate) and gaseous (stripping gas) phases. The subsequent interphase mass transfer of CO2 can cause a change in the pH of the digestate, subsequently affecting AR [26,27]. Thus, it is hypothesised that stripping gases that affect the free ammonia (FA) equilibrium in digestate can demonstrate similar ammonia recoveries.
Therefore, the aims of this study can be summarised as follows: (i) to demonstrate the application of a full factorial design to ammonia recovery from digestate by stripping and (ii) to compare the influence of the choice of stripping gas on ammonia recovery. Gas–liquid stripping was performed in batch experiments in a series of trials utilising cow manure digestate as the liquid phase.

2. Materials and Methods

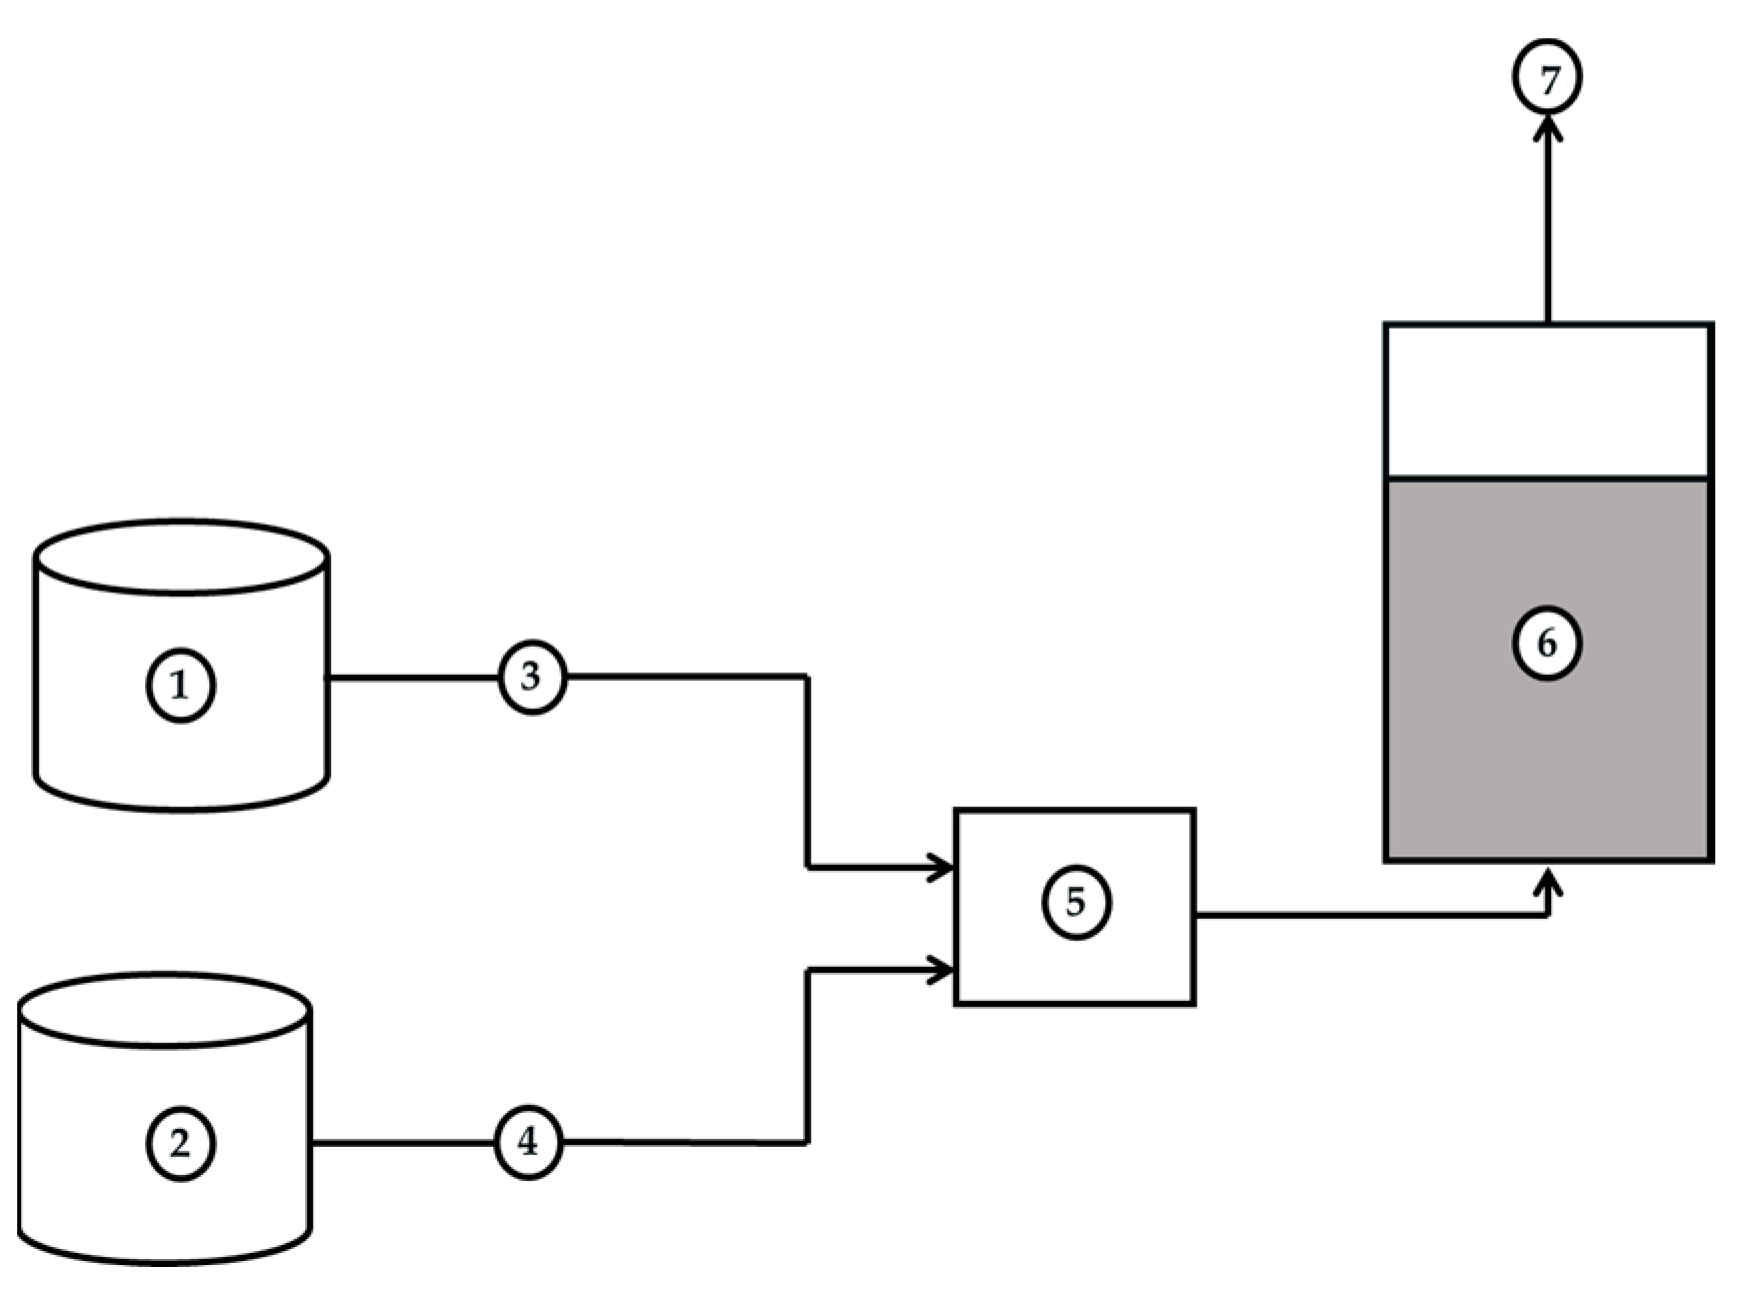
2.1. Experimental Setup and Procedure

Digestate was collected from a full-scale mesophilic anaerobic digester (Temse, Belgium) treating dairy cow manure and operating at a hydraulic retention time (HRT) of 20 days. The characteristics of the digestate were 66.65 ± 0.91 g/kg total solids (TS), of which 70.92 ± 0.16% were volatile solids (VS), with 3.07 ± 0.03 g N/kg TAN and pH 7.7 ± 0.02.
A schematic representation of the experimental stripping setup is shown in Figure 1. For the stripping experiments, 1.5 L of digestate were introduced into a cylindrical, glass stripping column with an internal diameter of 10 cm and subsequently heated to the desired temperature using a water bath (Witeg, Wertheim, Germany). The desired two-component gas mixture was produced by blending different gases from gas cylinders (CH4~99% purity, CO2~99% purity, N2~99% purity, air, Air Liquide, BE) in a 1 L airtight glass vessel. Gas flow rates were controlled using mass flow controllers, one for each gas (Aalborg G37, Atlantic City, NJ, USA). The gas mixture was introduced into the airtight stripping column via a diffuser. Digestate samples were withdrawn from the stripping column every 20 min. The stripping gas containing ammonia originating from the top of the stripping column was vented to the atmosphere.

2.2. Design of Experiments

A full factorial set of experiments was designed with three factors and two levels. The process conditions—temperature, pH, and G/L—were designated as the three factors. Each factor was assigned to two levels. The upper and lower levels (minimum and maximum values) for temperature, pH, and G/L were 37 and 80 °C, 8 and 11, and 500 and 1500, respectively. These minimum and maximum values were chosen such that they are representative of the range of process conditions that are usually implemented by other studies in the literature [12]. In coded units, each factor’s minimum and maximum values were defined as −1 and 1, respectively. The full factorial experiments were described using the DOE function in Minitab (edition 17). The AR experimentally determined for each trial was used to generate the regression equation. The main effects of each process condition were calculated to investigate the influence of a process condition on AR. The main effect measures the increase in AR caused by an increase in the process condition from its minimum value to the maximum value in the experimental interval while keeping all other process conditions constant [28,29]. The stripping gas for this set of experiments was biogas (60% CH4 and 40% CO2). Three gas mixtures, air + CO2, CH4 + CO2, and N2 + CO2, were selected to compare the AR from different stripping gases. The % CO2 in each stripping gas mixture was set at 0%, 20%, and 40%. The process conditions for all the experiments in the second set were fixed at 57 °C, pH 9.5, and G/L 1000.

2.3. Biochemical Parameters

For all digestate samples collected, the total ammonia nitrogen (TAN) was measured by the Kjeldahl distillation method (Büchi KjelFlex K-360, Hendrik-Ido-Ambacht, The Netherlands). The sample was distilled using steam, and the distillate captured in boric acid was subsequently titrated with 0.05 M HCl (Metrohm 848 Titrino plus, Herisau, Switzerland) [30]. The pH of the digestate samples was measured using a PHC201 Intellical probe with an HQ40d multimeter (Hach Instruments, Loveland, CO, USA).

2.4. Measurement of Error in the Stripping Process

Since many experiments have been included, not all of them could be performed in triplicate due to practical constraints. Therefore, three experimental trials (ranging over CO2 concentration and stripping gas composition) were repeated thrice to define the reproducibility and reliability of the results (see Supplementary Material). These results indicated that the final ammonia recovery measured was consistently reproducible, and an error margin of 5% was set for all the results of the stripping experiments.

2.5. Calculations

(i)
Ammonia Recovery
Ammonia recovery during the stripping process was calculated according to Equation (2).
Ammonia   Recovery   ( AR ,   % ) = M TAN ( t = 0 ) M TAN ( t = end ) M TAN ( t = 0 )
M TAN ( t = 0 ) is the mass of TAN in the digestate before stripping, M TAN is the mass of TAN in the digestate after stripping, and t is the stripping time. Ammonia recovery is determined by calculating the change in absolute mass of TAN to account for the difference in liquid mass due to evaporation, water-droplet entrainment, etc.
(ii)
Fraction of free ammonia (F)
The fraction of free ammonia was defined by taking into account the activity coefficient of ammonium ions [25,27]. The incorporation of activity coefficients improves the accuracy when estimating F. This is mathematically described in Equation (3).
F = [ NH 3 ] [ NH 3 + NH 4 + ] = K d · γ NH 4 + 10 pH + K d · γ NH 4 +
where [ NH 3 ] is the concentration of FA, [ NH 3 + NH 4 + ] is the concentration of TA, K d is the acid-dissociation constant for ammonium ions, and γ NH 4 + is the activity coefficient of NH4+ ions using the Pitzer approach.

3. Results and Discussion

Section 3.1 will discuss the application of the factorial design of experiments on the recovery of ammonia via gas–liquid stripping. While there has been well-established research on the influence of process conditions on ammonia recovery, the results in Section 3.1 will demonstrate how a structured approach can be used to generate a mathematical relationship for ammonia recovery as a function of the process conditions and then to compare their relative influence.

3.1. Factorial Design of Experiments

Table 1 shows the experimental runs performed as a part of the full factorial set of experiments and the experimental AR for each run. Runs 1 to 8 were performed as a part of the factorial DoE. Run 9 was performed at centre-point conditions, where the process conditions were the average of their minimum and maximum values (temperature 57 °C, pH 9.5 and G/L 1000). The ANOVA analysis for the factorial DoE is added in Supplementary Materials. The p-values were above the level of significance (0.095) attributed to the experimental error. The results were still presented to demonstrate the application of factorial DoE to ammonia stripping. Furthermore, the results were partially validated experimentally.
The DoE generated a regression equation to establish the numerical relationship between the three process conditions and AR (Equation (4)).
AR = 50.38 + 23.38 × Temperature + 5.12 × pH + 4.375   G / L + 6.125   Temperature × pH + 2.375   Temperature × G / L + 1.625   pH × G / L
The values of Temperature , pH , and G / L denoted in Equation (4) are in terms of their coded units (−1 and 1 for the lower and upper values of the level, respectively). The adjusted- R 2 value for Equation (4) was 0.857, which indicates that the regression equation was not a complete fit with the experimental values. This could be attributed to the experimental error and nonidealities associated with the stripping process. Similar values of adjusted- R 2 (0.83–0.89) were also reported by other studies implementing factorial DoE to ammonia stripping from digestate [15,27]. These studies attributed this range of adjusted- R 2 to the variation in digestate characteristics during experimentation and experimental and measurement error. The accuracy of the regression equation was investigated by calculating the AR at the centre-point conditions (experimental run 9, Table 1). Substituting the coded units for Temperature , pH , and G / L as 0, 0, and 0 (average of −1 and 1) in Equation (4), an AR of 50.38% was predicted. This is comparable to the AR of 47%, which was experimentally recorded in run 9. The accuracy of the regression equation could be further verified by performing experimental runs at process conditions away from the centre point. However, these were rendered out of the scope of this current study. Additionally, the DoE was also used to find the appropriate range of process conditions to maximise AR. The highest AR achieved was 97% when all process conditions were set at their maximum level, while the lowest AR (24%) was obtained when the process conditions were set at their minimum level. Thus, the range of temperature, pH, and G/L needed to optimise AR between 80% to 97% was determined. Figure 2 shows the plots of AR for each process variable, while keeping the other two constant. ‘Cur’ denotes the value of the process condition at the intersection of the red vertical line and horizontal dotted line. The corresponding AR is designated as ‘y’. A minimum temperature of 70 °C was required to obtain an AR of at least 80%. Increasing the temperature from 70 °C to a maximum temperature of 80 °C was predicted to cause a proportional increase in AR. Further, the pH and G/L values required to maximise AR were also the maximum values possible (11 and 1500, respectively). Thus, the AR can be maximised by maximising the process conditions.
The factorial DoE was also used to investigate which of the three process conditions significantly influenced AR. Table 2 shows that the main effects of the three process conditions were all positive. This implies that an increase in each process condition will cause an increase in AR, which is well established in the literature [19,22]. The main effect of temperature was the greatest at a value of 46.75, followed by pH at 10.25, and G/L at 8.75. This result implies that if all other process conditions remain constant, an increase in temperature will cause a much higher increase in AR compared to pH and G/L. The strongest influence of temperature could further be demonstrated by plotting the 2-D surface contour plots for the interaction effects. The variation of AR relating to two process variables (keeping the third variable constant) is shown in Figure 3. The regions coloured dark blue depict the range of process conditions where AR is lowest (below 30%), while dark green-coloured regions depict the highest AR (above 80%). The dark blue-coloured regions occur when the temperature is lowest (below 40 °C). Similarly, the dark green coloured regions occur at the regions of high temperature (above 40 °C). Conversely, no regions of AR above 80% could be obtained when varying pH and G/L with a constant temperature of 58 °C. Thus, this further confirms that the temperature variable has the strongest influence.
An explanation for the relatively high main effect of temperature can be attributed to its multiple influences on the stripping process. An increase in temperature increases the acid-dissociation constant of the ammonium ion ( K d ). The temperature increase shifts the equilibrium between ammonium ions and FA towards the latter (Equation (1)), consequently increasing the amount of FA available to be stripped [31,32].
Furthermore, an increase in temperature decreases the solubility of FA in the digestate and increases its diffusion and mass transfer rates, all of which contributes to higher ammonia recoveries [33,34]. The fact that the main effect for pH was more substantial compared to G/L can also be explained by its positive effect on the FA equilibrium, as an increase in pH consumes H+ ions, shifting the equilibrium in Equation (1) towards FA [35]. These results show that increasing temperature, compared to pH and G/L, will have a more positive influence on AR. Additionally, the interaction effects Temperature * pH , pH * G / L , and Temperature * G / L were also calculated to investigate whether the process variables impact each other (Table 2) The values were 6.13, 1.63, and 2.37, respectively. However, all the interaction effects were insignificant, implying that the process variables were not influenced by each other and, subsequently, did not have any secondary effect on AR.

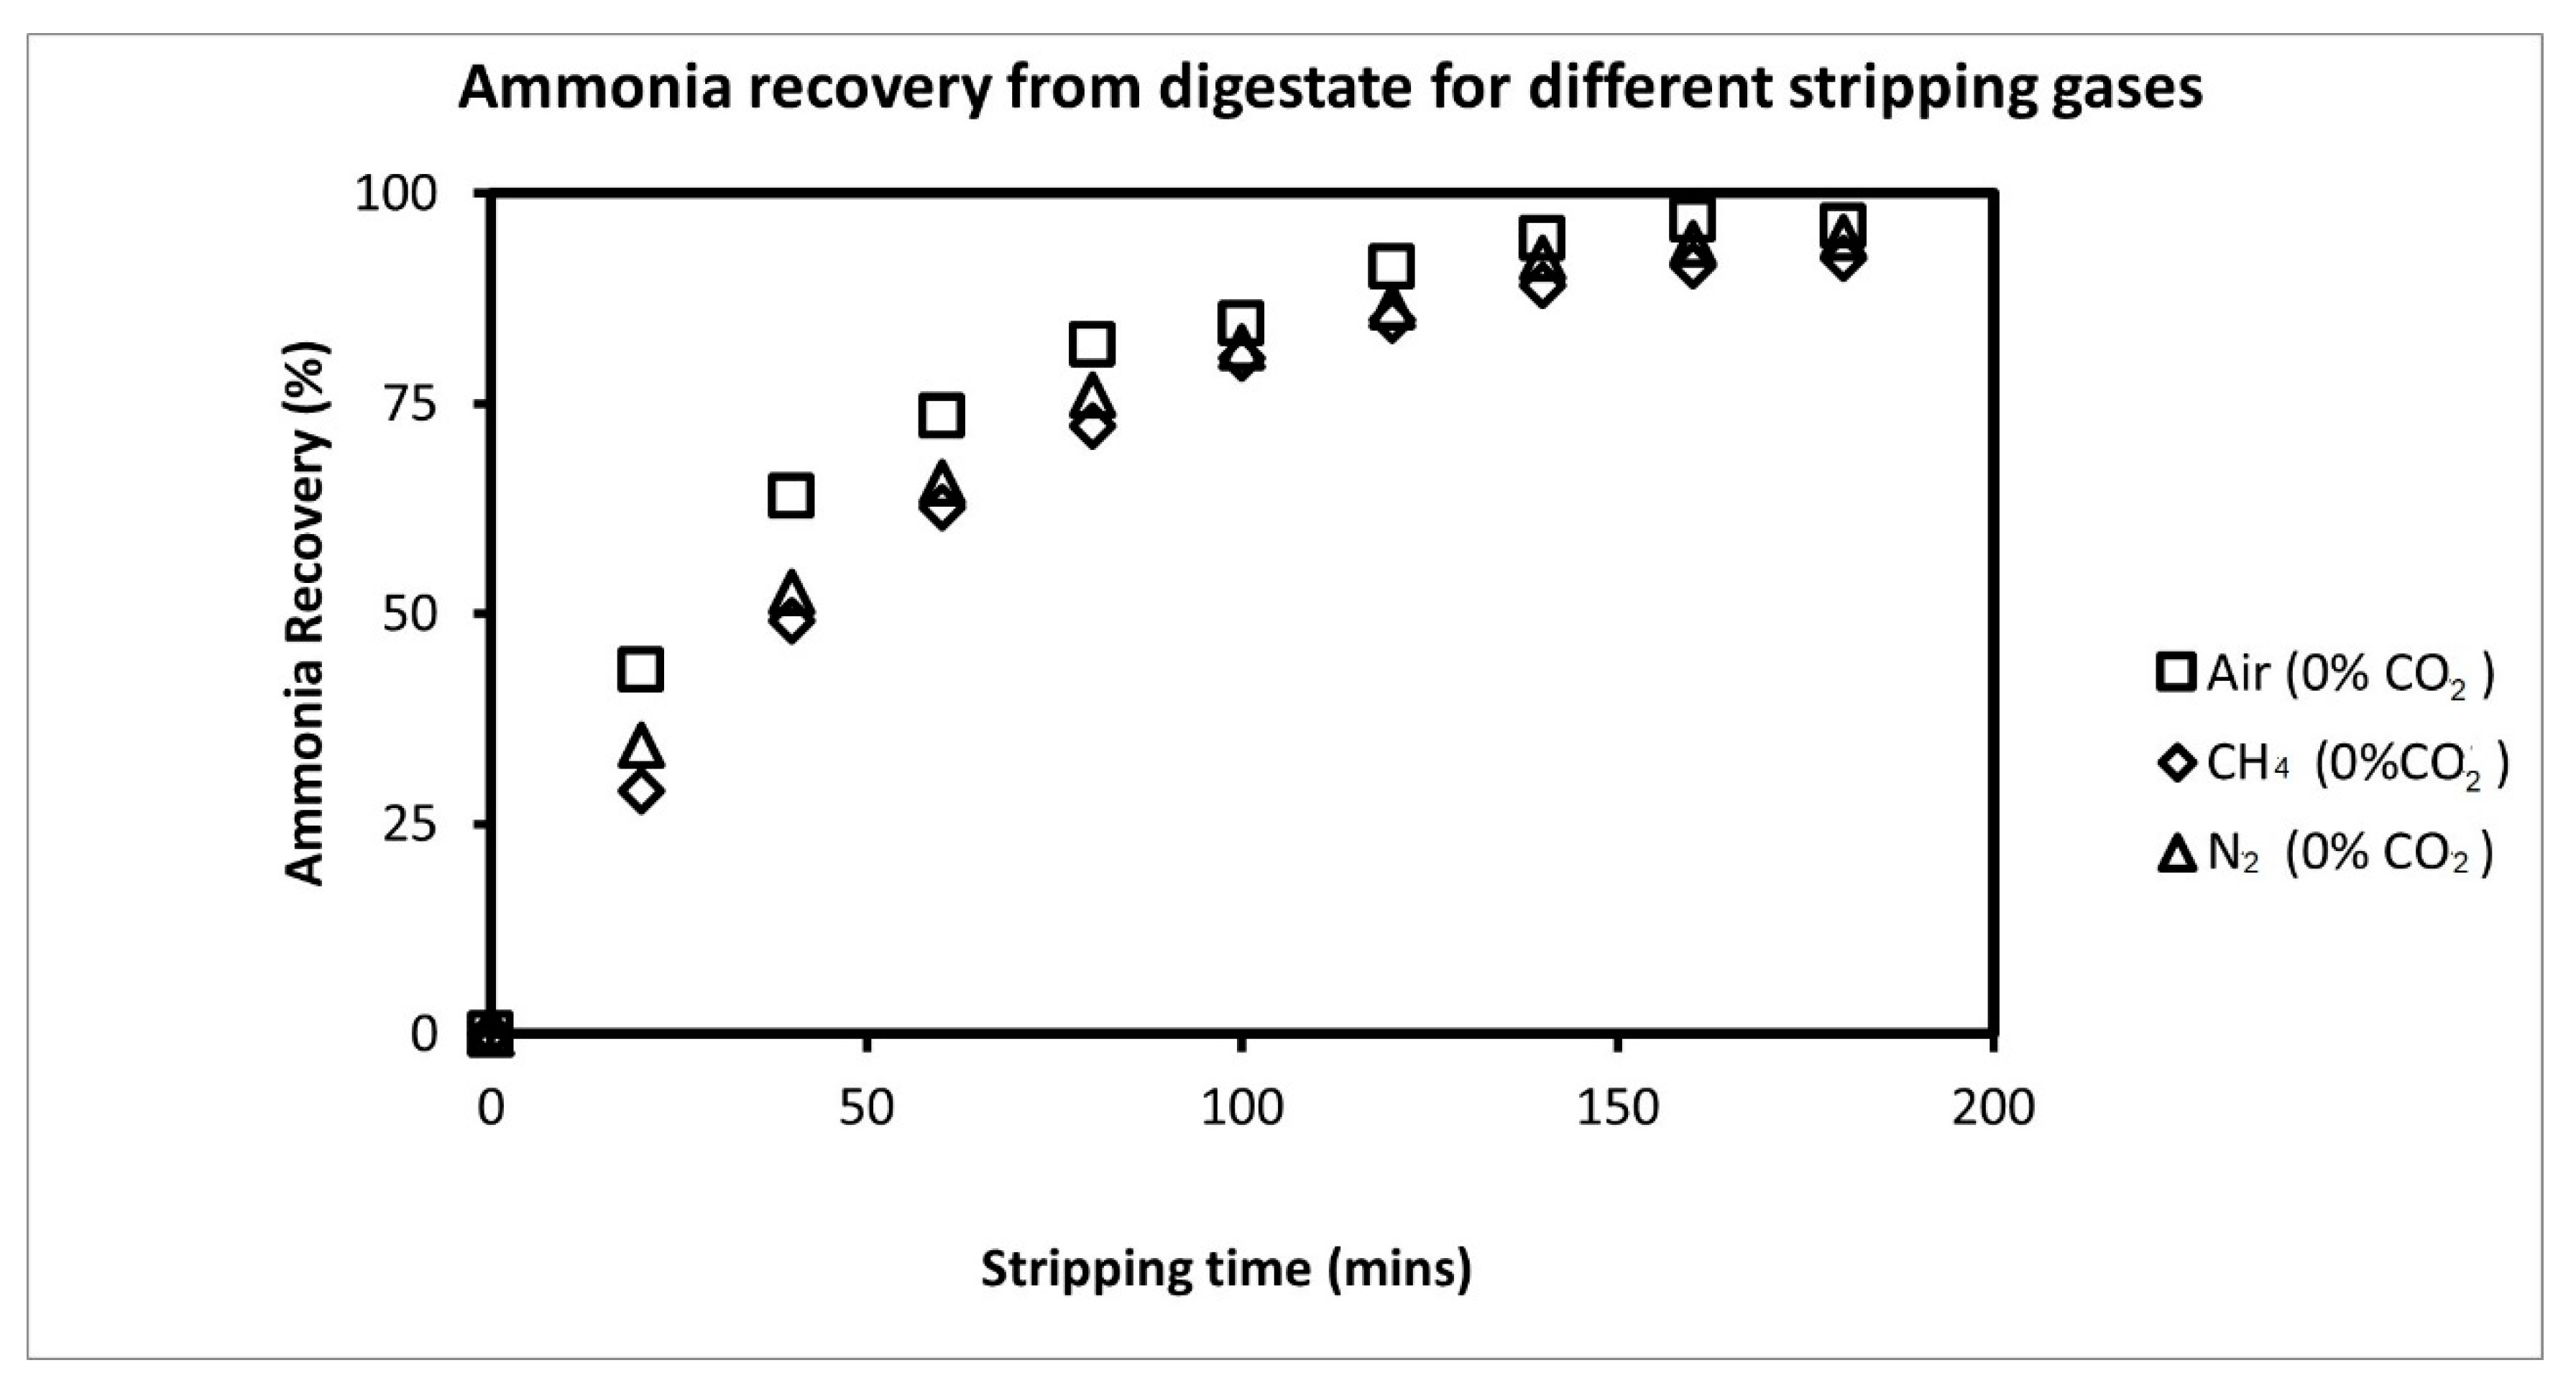
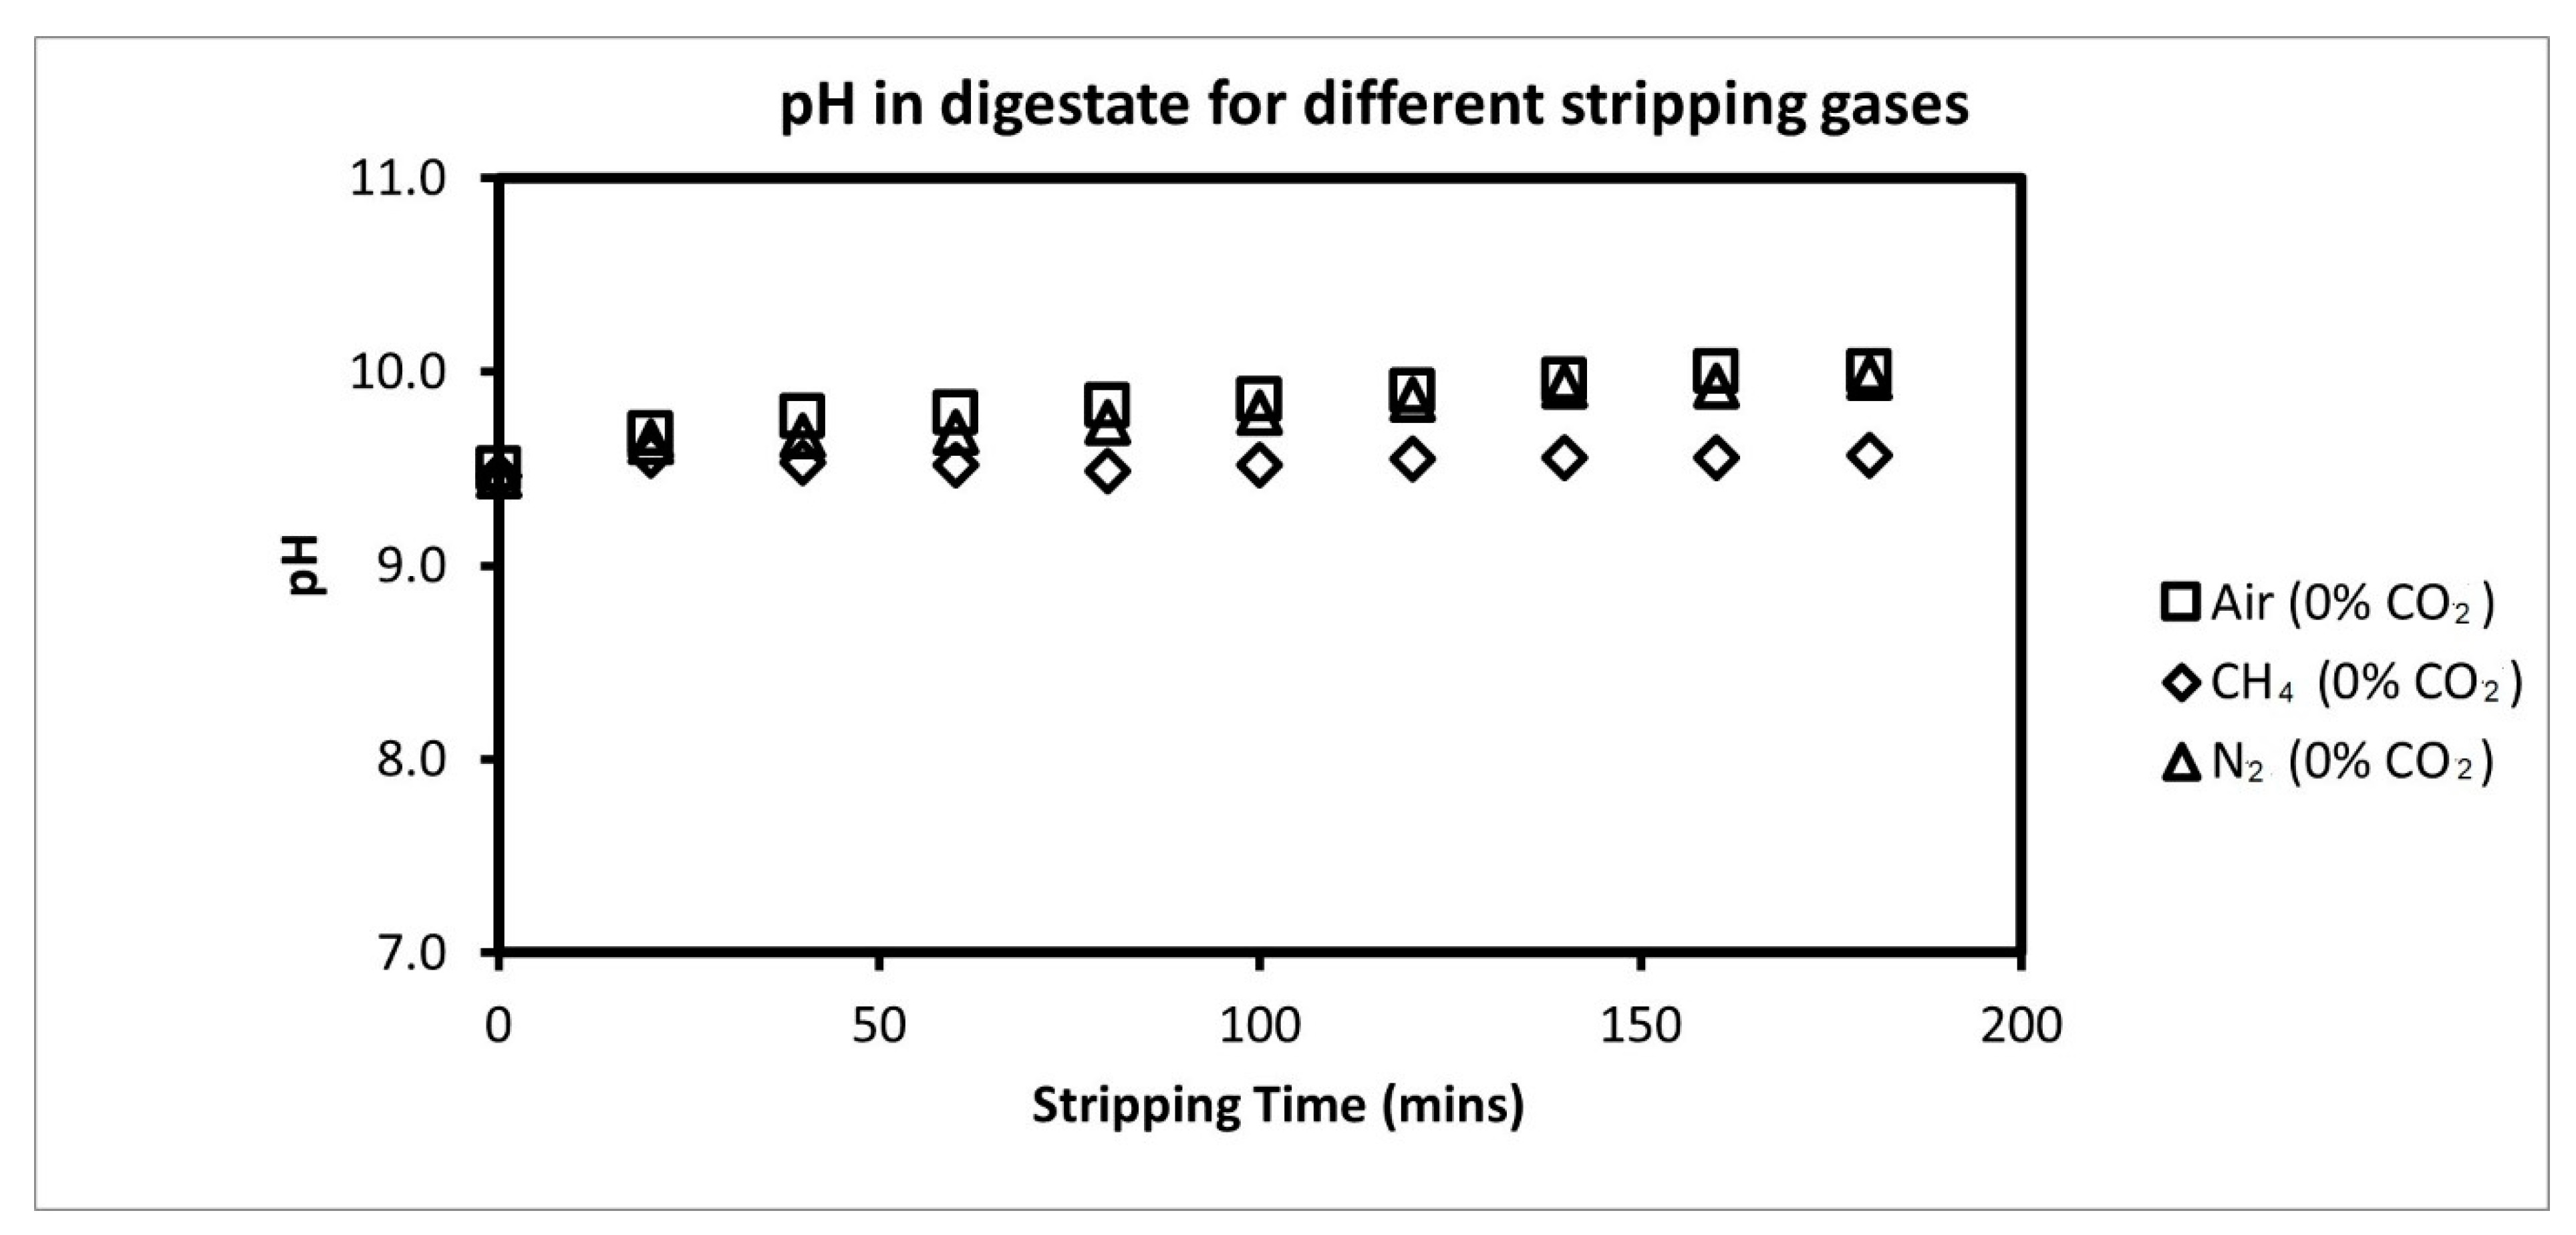
3.2. Comparison of Ammonia Recovery from Different Stripping Gases

Section 3.1 described the relationship between ammonia recovery and the process conditions, whereas Section 3.2 will investigate the influence of the choice of stripping gas. The stripping performance (in terms of ammonia recovery) when using air, N2, and CH4 as stripping gases was compared. Figure 4 compares the AR of the three gases, air, N2, and CH4, at 0% CO2 in the gas mixture. The AR increased for all three gases as the stripping time reached final ARs of 96, 94, and 92%, respectively.
The similarly high Ars observed for all three gases can be explained by the similar interaction of the gases with the FA equilibrium in the digestate phase during the stripping process. Specifically, this is attributed to the mass transfer of CO2 from the digestate to the gas phase. The direction of CO2 mass transfer between liquid and gaseous phases is dictated by its interphase concentration difference. For N2 and CH4, the concentration of CO2 in the stripping gas was 0%, while air had a CO2 concentration of ~0.04% (which is assumed here as negligible). Thus, the concentration gradient dictated an increased driving force for the mass transfer of CO2 from the digestate to the gaseous phase. This caused a shift in the bicarbonate equilibrium in the digestate towards the left (according to Le Chatelier’s principle). This shift consumed the H+ ions in the solution. It thus increased the pH of the liquid phase (Figure 5), consequently resulting in high ARs (Equations (1), (5) and (6)) [26,27]).
CO 2 + H 2 O HCO 3 + H +
HCO 3 CO 3 2 + H +
After stripping, the final pH values when using air, CH4, and N2 were 9.96, 9.57, and 9.97, respectively. Although the marginally lower pH when stripping with CH4 could not be explained, it did not cause a lower AR. The similar influence of the three stripping gases on the FA equilibrium in the digestate could further be demonstrated by measuring the ratio of FA to TA (F) in the digestate. This parameter indicates the proportion of TA available as FA to be physically removed from the system. Figure 6 shows the F for all three gases plotted as a function of stripping time. Throughout stripping, the value of F for all three gases was similar, with the final values F for air, N2, and CH4 at 0.98, 0.98, and 0.95, respectively. The high F values can be attributed to the high pH in the digestate due to the removal of CO2.
A comparison of the solubility of air, CH4, and N2 in aqueous solutions also supports the abovementioned observations. Henry’s constants of the gases were calculated to compare the solubility of these gases in the digestate. These are defined as the ratio of the concentration of species in the aqueous phase to the partial pressure in the gaseous phase (mmol/(m3·Pa)) [36]. For air, CH4, and N2, Henry’s constants at 57 °C were calculated as 0.00439, 0.00827, and 0.00378 (mmol/(m3·Pa), respectively, showing their low solubility in digestate compared to CO2 (0.15) [18]. The low solubility of air, CH4, and N2 implies that they do not dissolve in the digestate to affect the FA equilibrium. Instead, it is the mass transfer of CO2, which is the critical component in the stripping gas mixture that affects ammonia recovery. This mass transfer of CO2 via interphase diffusion between the digestate and the stripping gas affects the extent of ammonia recovery. Further, it also depends on the interphase-CO2 concentration gradient. The mass transfer of CO2 from the stripping gas to the digestate decreases F and thereby decreases AR. Similarly, the mass transfer of CO2 from the digestate to the stripping gas increases FA and, therefore, AR. To further demonstrate the influence of %CO2, its concentration in the gas mixture air + CO2, CH4 + CO2, and N2 + CO2 was increased to 20% and then to 40%. For all three stripping gas mixtures, the AR decreased as %CO2 increased. Table 3 shows that the final AR for air, CH4, and N2 at 20% CO2 were 66%, 64%, and 70%, respectively. At 40% CO2, the final AR for air, CH4, and N2 were 50%, 55%, and 57%, respectively. Thus, air, CH4, and N2 showed similar ARs at higher CO2 concentrations in the gas mixture. These results confirmed the critical nature of CO2 in the stripping gas mixture.
Other studies in the literature have also reported similar observations on the critical nature of CO2. Bousek et al., (2015) [37] reported ammonia recoveries of 96%, 68%, and 47% when stripping pig manure and maize silage digestate with air, biogas, and flue gas, which are gases with 0%, 14–18%, and 33–35% CO2, respectively. A similar decrease in ammonia recovery from approximately 95% to 65% and 55% with increasing CO2 concentration ammonia recovery at 10%, 20%, and 40% CO2, respectively, was also reported when stripping pig manure digestate [38].
The similarity in ARs achieved by air, N2, and CH4 has broad implications on the choice of stripping gas mixtures used for ammonia recovery from digestate. These findings can provide flexibility for the selection of the stripping gas. It may even be argued that these observations could be extended to other stripping gas mixtures. The components of the stripping gas mixture that can dissolve in digestate and affect F will have a critical effect on ammonia recovery, while components without this effect are interchangeable. Future studies could optimise the AR by maintaining a %CO2 in the stripping gas that is below the CO2 dissolved in the digestate to maintain the favourable concentration gradient. An additional basis for the comparison of these gases could be their economic cost. Assuming the same capital and operational expenditure for the stripping column equipment, the market cost for air, N2, and CH4 are 2.35/m3, 1.47/m3, and 7.28/m3, respectively [39]. Thus, the use of CH4 as stripping gas can be 3–5 times more cost-intensive compared to air or N2. This implies that the use of air or N2 as stripping gas is much more economically attractive.
These results are particularly relevant for the use of biogas as a stripping gas. Biogas (with a typical concentration of ~60% CH4–40% CO2) is the primary gaseous product from the AD process and is, therefore, a suitable choice for a stripping gas. In theory, the biogas stream that is used for stripping could also be used for energy generation, with suitable post-processing to remove impurities. For this application, the concentration of CO2 becomes important in the stripping, power generation, and resource recovery contexts. Biogas with a potentially lower CO2 concentration that is used as a stripping agent would result in a higher ammonia recovery from the AD process. While the ammonia recovered could be valorised for industrial use, this could also solve the problem of ammonia inhibition, thereby, increasing biogas yields. The decrease in %CO2 in the biogas stream also implies an increase in %CH4, increasing the energy density of the gas for combustion. Further, the ammonia and biogas stream can also be considered as a potential combined-gas fuel stream, for energy production in a solid-oxide fuel cell (SOFC) [40]. Therefore, in theory, using biogas with a lower %CO2 could have two-fold benefit: increasing ammonia efficiency, consequently improving the valorisation of nitrogen from waste streams, as well as increasing the energetic potential of the outflowing stripping gas stream.

4. Conclusions

This study demonstrated the application of the factorial design of experiments to the characterisation of ammonia recovery by stripping. A regression equation was generated to estimate the AR under certain process conditions. Furthermore, the temperature was calculated to influence ammonia recovery to the largest extent, followed by pH and G/L. Utilising air, CH4, and N2 as stripping gases showed similar ammonia recoveries of 96, 94, and 92%, respectively. This similarity was attributed to their comparable effects on the total ammonia equilibrium. The % CO2 in the stripping gas was the critical component in the stripping gas mixture.

Supplementary Materials

The following supporting information can be downloaded at: https://www.mdpi.com/article/10.3390/su142417000/s1, Table S1: Experimental data points performed in replicates, average ammonia recovery and standard deviation; Table S2: ANOVA for DoE. ‘*’ represents the multiplication of two terms; Figure S1: Ammonia recovery averaged over three trials using air (0% CO2) as the stripping gas.; Figure S2: Ammonia recovery averaged over three trials using 80% N2-20% CO2 as stripping gas; Figure S3: Ammonia recovery averaged over three trials using 60% CH4-40% CO2 as the stripping gas.

Author Contributions

A.P.: Conceptualisation, Investigation, Writing—Original Draft, S.A.: Conceptualisation, Writing—Review & Editing, Supervision R.D.: Conceptualisation, Writing—Review & Editing, Supervision L.A.: Conceptualisation, Writing—Review & Editing, Supervision. All authors have read and agreed to the published version of the manuscript.

Funding

This research was funded in part by Flanders Innovation & Entrepreneurship (VLAIO) and the Dutch Research Council (NWO) by the N2kWh project (IWT/150062).

Institutional Review Board Statement

Not applicable.

Informed Consent Statement

Not applicable.

Data Availability Statement

Data will be made available on request.

Acknowledgments

We would like to thank Sasha Hafner (Hafner Consulting LLC) for providing detailed Excel spreadsheets, allowing us to make calculations to estimate F accurately.

Conflicts of Interest

The authors declare that they have no known competing financial interests or personal relationships that could have appeared to influence the work reported in this paper.

References

  1. Wu, D.; Li, L.; Peng, Y.; Yang, P.; Peng, X.; Sun, Y.; Wang, X. State indicators of anaerobic digestion: A critical review on process monitoring and diagnosis. Renew. Sustain. Energy Rev. 2021, 148, 111260. [Google Scholar] [CrossRef]
  2. Gallert, C.; Winter, J. Mesophilic and thermophilic anaerobic digestion of source-sorted organic wastes: Effect of ammonia on glucose degradation and methane production. Appl. Microbiol. Biotechnol. 1997, 48, 405–410. [Google Scholar] [CrossRef]
  3. Krakat, N.; Anjum, R.; Dietz, D.; Demirel, B. Methods of ammonia removal in anaerobic digestion: A review. Water Sci. Technol. 2017, 76, 1925–1938. [Google Scholar] [CrossRef]
  4. Leverenz, H.; Adams, R.; Hazard, J.; Tchobanoglous, G. Continuous thermal stripping process for ammonium removal from digestate and centrate. Sustainability 2021, 13, 2185. [Google Scholar] [CrossRef]
  5. Huang, H.; He, L.; Zhang, Z.; Lei, Z.; Liu, R.; Zheng, W. Enhanced biogasification from ammonia-rich swine manure pretreated by ammonia fermentation and air stripping. Int. Biodeterior. Biodegrad. 2019, 140, 84–89. [Google Scholar] [CrossRef]
  6. Nielsen, H.B.; Angelidaki, I. Strategies for optimizing recovery of the biogas process following ammonia inhibition. Bioresour. Technol. 2008, 99, 7995–8001. [Google Scholar] [CrossRef]
  7. Rajagopal, R.; Massé, D.I.; Singh, G. A critical review on inhibition of anaerobic digestion process by excess ammonia. Bioresour. Technol. 2013, 143, 632–641. [Google Scholar] [CrossRef] [PubMed]
  8. Backes, A.M.; Aulinger, A.; Bieser, J.; Matthias, V.; Quante, M. Ammonia emissions in Europe, part II: How ammonia emission abatement strategies affect secondary aerosols. Atmos. Environ. 2016, 126, 153–161. [Google Scholar] [CrossRef] [Green Version]
  9. Deng, Z.; Linden NVan Guillen, E.; Spanjers, H.; Van Lier, J.B. Recovery and applications of ammoniacal nitrogen from nitrogen-loaded residual streams: A review. J. Environ. Manag. 2021, 295, 113096. [Google Scholar] [CrossRef]
  10. Valera-Medina, A.; Xiao, H.; Owen-Jones, M.; David, W.I.F.; Bowen, P.J. Ammonia for power. Prog. Energy Combust. Sci. 2018, 69, 63–102. [Google Scholar] [CrossRef]
  11. Serna-Maza, A.; Heaven, S.; Banks, C.J. Biogas stripping of ammonia from fresh digestate from a food waste digester. Bioresour. Technol. 2015, 190, 66–75. [Google Scholar] [CrossRef] [Green Version]
  12. Palakodeti, A.; Azman, S.; Rossi, B.; Dewil, R.; Appels, L. A critical review of ammonia recovery from anaerobic digestate of organic wastes via stripping. Renew. Sustain. Energy Rev. 2021, 143, 110903. [Google Scholar] [CrossRef]
  13. Srinath, E.G.; Loehr, R.C. Ammonia desorption by diffused aeration. Water Pollut. Control Fed. 1974, 46, 1939–1957. [Google Scholar]
  14. Georgiou, D.; Liliopoulos, V.; Aivasidis, A. Investigation of an integrated treatment technique for anaerobically digested animal manure: Lime reaction and settling, ammonia stripping and neutralization by biogas scrubbing. Bioresour. Technol. Rep. 2019, 5, 127–133. [Google Scholar] [CrossRef]
  15. Baldi, M.; Collivignarelli, M.C.; Abbà, A.; Benigna, I. The valorization of ammonia in manure digestate by means of alternative stripping reactors. Sustainability 2018, 10, 3073. [Google Scholar] [CrossRef] [Green Version]
  16. Yellezuome, D.; Zhu, X.; Wang, Z.; Liu, R. Mitigation of ammonia inhibition in anaerobic digestion of nitrogen-rich substrates for biogas production by ammonia stripping: A review. Renew. Sustain. Energy Rev. 2022, 157, 112043. [Google Scholar] [CrossRef]
  17. Bonmatı, A.; Flotats, X. Air stripping of ammonia from pig slurry: Characterisation and feasibility as a pre- or post-treatment to mesophilic anaerobic digestion August. Waste Manag. 2003, 23, 261–272. [Google Scholar] [CrossRef]
  18. Sander, R. Compilation of Henry’s law constants (version 4.0) for water as solvent. Atmos. Chem. Phys. 2015, 15, 4399–4981. [Google Scholar] [CrossRef] [Green Version]
  19. Guštin, S.; Marinšek-Logar, R. Effect of pH, temperature and air flow rate on the continuous ammonia stripping of the anaerobic digestion effluent. Process Saf. Environ. Prot. 2011, 89, 61–66. [Google Scholar] [CrossRef]
  20. Ni, J. Mechanistic models of ammonia release from liquid manure: A review. J. Agric. Eng. Res. 1999, 72, 1–17. [Google Scholar] [CrossRef]
  21. Jamaludin, Z.; Rollings-Scattergood, S.; Lutes, K.; Vaneeckhaute, C. Evaluation of sustainable scrubbing agents for ammonia recovery from anaerobic digestate. Bioresour. Technol. 2018, 270, 596–602. [Google Scholar] [CrossRef]
  22. Kinidi, L.; Tan, I.A.W.; Wahab, N.B.A.; Fikri, K.; Hipolito, C.N.; Salleh, S.F. Recent Development in Ammonia Stripping Process for Industrial Wastewater Treatment. Int. J. Chem. Eng. 2018, 2018, 3181087. [Google Scholar] [CrossRef]
  23. Liu, L.; Pang, C.; Wu, S.; Dong, R. Optimization and evaluation of an air-recirculated stripping for ammonia removal from the anaerobic digestate of pig manure. Process Saf. Environ. Prot. 2015, 94, 350–357. [Google Scholar] [CrossRef]
  24. Bi, S.; Qiao, W.; Xiong, L.; Mahdy, A.; Wandera, S.M.; Yin, D.; Dong, R. Improved high solid anaerobic digestion of chicken manure by moderate in situ ammonia stripping and its relation to metabolic pathway. Renew. Energy 2020, 146, 2380–2389. [Google Scholar] [CrossRef]
  25. Hafner, S.D.; Bisogni, J.J. Modeling of ammonia speciation in anaerobic digesters. Water Res. 2009, 43, 4105–4114. [Google Scholar] [CrossRef] [PubMed]
  26. Budzianowski, W.; Koziol, A. Stripping of Ammonia from Aqueous Solutions in the Presence of Carbon Dioxide. Chem. Eng. Res. Des. 2005, 83, 196–204. [Google Scholar] [CrossRef]
  27. Hafner, S.D.; Montes, F.; Alan Rotz, C. The role of carbon dioxide in emission of ammonia from manure. Atmos. Environ. 2013, 66, 63–71. [Google Scholar] [CrossRef]
  28. Lazić, Ž.R. Design of Experiments in Chemical Engineering; Wiley VCH GmbH: Weinheim, Germany, 2005. [Google Scholar] [CrossRef]
  29. Douglas, C.M. Design and Analysis of Experiments, 5th ed.; John Wiley and Sons: Hoboken, NJ, USA, 1997. [Google Scholar] [CrossRef]
  30. Sambusiti, C.; Monlau, F.; Ficara, E.; Musatti, A.; Rollini, M.; Barakat, A.; Melpei, F. Comparison of various post-treatments for recovering methane from agricultural digestate. Fuel Process. Technol. 2015, 137, 359–365. [Google Scholar] [CrossRef]
  31. Jiang, A.; Zhang, T.; Zhao, Q.B.; Li, X.; Chen, S.; Frear, C.S. Evaluation of an integrated ammonia stripping, recovery, and biogas scrubbing system for use with anaerobically digested dairy manure. Biosyst. Eng. 2014, 119, 117–126. [Google Scholar] [CrossRef]
  32. Zhao, Q.-B.; Ma, J.; Zeb, I.; Yu, L.; Chen, S.; Zheng, Y.-M.; Frear, C. Ammonia recovery from anaerobic digester effluent through direct aeration. Chem. Eng. J. 2015, 279, 31–37. [Google Scholar] [CrossRef]
  33. Zhang, L.; Lee, Y.W.; Jahng, D. Ammonia stripping for enhanced biomethanization of piggery wastewater. J. Hazard. Mater. 2012, 199, 36–42. [Google Scholar] [CrossRef] [PubMed]
  34. Provolo, G.; Perazzolo, F.; Mattachini, G.; Finzi, A.; Naldi, E.; Riva, E. Nitrogen removal from digested slurries using a simplified ammonia stripping technique. Waste Manag. 2017, 69, 154–161. [Google Scholar] [CrossRef] [PubMed]
  35. Walker, M.; Iyer, K.; Heaven, S.; Banks, C.J. Ammonia removal in anaerobic digestion by biogas stripping: An evaluation of process alternatives using a first order rate model based on experimental findings. Chem. Eng. J. 2011, 178, 138–145. [Google Scholar] [CrossRef] [Green Version]
  36. Stumm, W.; Morgan, J.J. Aquatic Chemistry: Chemical Equilibria and Rates in Natural Waters, 3rd ed.; John Wiley and Sons: Hoboken, NJ, USA, 1995. [Google Scholar] [CrossRef]
  37. Bousek, J.; Scroccaro, D.; Sima, J.; Weissenbacher, N.; Fuchs, W. Influence of the gas composition on the efficiency of ammonia stripping of biogas digestate. Bioresour. Technol. 2015, 203, 259–266. [Google Scholar] [CrossRef] [PubMed] [Green Version]
  38. Wang, D.; Xin, Y.; Shi, H.; Ai, P.; Yu, L.; Li, X.; Chen, S. Closing ammonia loop in efficient biogas production: Recycling ammonia pretreatment of wheat straw. Biosyst. Eng. 2019, 180, 182–190. [Google Scholar] [CrossRef]
  39. Liquide, A. Air Liquide Product Catalogue 2022. Available online: https://mygas.airliquide.be/catalog-gas-products (accessed on 18 October 2022).
  40. Saadabadi, S.A.; Thallam Thattai, A.; Fan, L.; Lindeboom, R.E.F.; Spanjers, H.; Aravind, P.V. Solid Oxide Fuel Cells fuelled with biogas: Potential and constraints. Renew. Energy 2019, 134, 194–214. [Google Scholar] [CrossRef]
Figure 1. Schematic representation of the experimental stripping process. (1) Air/N2/CH4 gas cylinders; (2) CO2 gas cylinder; (3) and (4) Mass flow controllers to control the flow rate of the gases; (5) Gas mixing tank; (6) Stripping column; (7) Outlet stripping gas.
Sustainability 14 17000 g001
Figure 2. Optimisation of AR for a range of process conditions. The black line is drawn between the AR at the two levels for each factor.
Sustainability 14 17000 g002
Figure 3. 2-D surface contour interaction plot for AR as a function of temperature, pH, and G/L. ‘*’ represents the multiplication of the two terms.
Sustainability 14 17000 g003
Figure 4. Ammonia recovery over time when stripping digestate with different gas mixtures at 0% CO2.
Sustainability 14 17000 g004
Figure 5. pH over time when stripping digestate with different gas mixtures at 0% CO2.
Sustainability 14 17000 g005
Figure 6. F over time when stripping digestate with different gas mixtures at 0% CO2.
Sustainability 14 17000 g006
Table 1. Ammonia-stripping experimental runs and the corresponding ammonia recovery. Runs 1–8 were part of the full factorial DoE, while run 9 was used for the verification of the numerical model.
RunTemperature (°C)pHG/LAmmonia
Recovery (%)
18011150097
280850061
3371150026
4378150032
537850024
6808150064
7801150073
83711150026
9579.5100047
Table 2. Main and interaction effects calculated for the three process conditions. A significance level of 0.95 was assumed. ‘*’ represents the multiplication of the two terms.
ParameterMain EffectsRegression Coefficients
Temperature46.7523.38
pH10.255.13
G/L8.754.38
Temperature * pH12.256.13
pH * G/L3.251.63
Temperature * G/L4.752.37
Table 3. Ammonia recovery from digestate for different gas mixtures with different % CO2. The process conditions during stripping were a temperature of 57 °C, a G/L of 1000, and a pH of 9.5.
Ammonia Recovery (%)
% CO2Air + CO2CH4 + CO2N2 + CO2
0969294
20666470
40505755
Publisher’s Note: MDPI stays neutral with regard to jurisdictional claims in published maps and institutional affiliations.

