Article

Multielement Analysis of Fresh and Salt Surface Water from Different Continents

Man-Technology-Environment Research Centre, School of Science and Technology, Örebro University, Fakultetsgatan 1, 70182 Örebro, Sweden
*
Author to whom correspondence should be addressed.
Sustainability 2022, 14(24), 16934; https://doi.org/10.3390/su142416934
Submission received: 24 October 2022 / Revised: 8 December 2022 / Accepted: 15 December 2022 / Published: 16 December 2022
(This article belongs to the Section Environmental Sustainability and Applications)

Abstract

:
Metals and metalloids in aquatic environments are a result of anthropogenic activities as well as of natural events. Many investigations have been carried out focusing on certain remote or polluted areas. The present project intended to obtain a more widespread picture of elements in fresh and salt surface water. For this purpose, samples were collected from 22 countries and three continents. These were analyzed for 29 elements, covering potentially toxic elements but also saline elements, by inductively coupled plasma mass spectrometry. Statistical analysis of the obtained results showed significant differences between countries as well as between water types: Alkali metals and earth alkaline metals contributed most to the distinction of water types. The results from this study were consistent with data from the literature regarding fresh water from different locations. Al, As, Cd, Co, Mo, Ni, Se, Ni, and U correlated with the geographic provenience of the samples. A correlation analysis, which also included three perfluorinated alkyl substances from a previous study, showed a correlation between the organic contaminants and V and As.

1. Introduction

Metals and metalloids are found in the environment due to natural sources and circulation but also because of increasing human activities [1,2,3]. Their persistence in the environment has resulted in a growing problem. On the one hand, negative impacts on biota and water are of high concern. On the other hand, humans can be negatively impacted due to the uptake of potentially toxic elements, such as arsenic, cadmium, or lead by plants or terrestrial and aquatic animals with subsequent introduction into the food chain [4]. Even if pollution coming from different industries, domestic wastes, and agrochemicals has been reported to be more severe in developing countries [5], the issue of metals in ground and surface water is of global interest. Interaction between groundwater and surface water can lead to increased salinity in water bodies in arid areas, where irrigation water is characterized by elevated concentrations of saline elements [6]. In recent decades, many investigations have been conducted around the world with a focus on metal contamination in the surface aquatic environment, covering rivers, lakes, glacial lakes, oceans, and estuary water [5,7,8,9,10,11,12,13,14,15,16,17]. The main elements of interest are those considered as potentially toxic to aquatic animals and humans alongside specific pollutants of a certain region [5,7,8,9]. An important issue in this respect is the understanding of interactions between natural as well as anthropogenic processes, especially regarding finding boundaries between pristine and polluted water streams [16]. Thus, most of the studies on metals and metalloids in various publications are of high local interest and are important for respective risk assessments. The actual pollution status has usually been described by related indices, such as the heavy metal pollution index (HPI), hazard index (HI) and carcinogenic risk (CR) [18] or Geo-accumulation Index (Igeo), Enrichment Factor (EF), Pollution Load index (PLI), Contamination Factor (CF), and Metal Index (MI), which were calculated as reported for specific water streams [13,17,19]. Pan and colleagues, for example, focused on As, Cd, Cr, Cu, Hg, Pb, and Zn in sediments and surface and ground water around one of the largest Cu-polymetallic ore clusters in China [20]. A Turkish research group investigated the influence of a lignite-fired thermal power plant on the concentrations of Cr, Mn, Fe, Ni, Cu, Zn, and Pb in the surrounding surface waters [17]. The limited and varying number of analytes as well as the geographical restriction complicates comparison between and overall assessment of different studies.
The present study was designed to enlarge a baseline study on organic pollutants using surface water samples that were collected in 22 countries from three continents coordinated by the United Nations Environment Programme (UNEP) to be tested for a total of 29 analytes. These are the metals and metalloids: silver (Ag), aluminum (Al), arsenic (As), barium (Ba), beryllium (Be), bismuth (Bi), calcium (Ca), cadmium, (Cd), cobalt (Co), chromium (Cr), copper (Cu), iron (Fe), gallium (Ga), potassium (K), lithium (Li), magnesium (Mg), manganese (Mn), molybdenum (Mo), sodium (Na), nickel (Ni), lead (Pb), rubidium (Rb), selenium (Se), strontium (Sr), tellurium (Te), thallium (Tl), uranium (U), vanadium (V), and Zink (Zn). The obtained data were statistically evaluated to assess similarities, correlations, or differences between datasets and meta-data regarding water type and provenience, whilst the local pollution status was not of concern. Thus, no pollution or risk indices were calculated as reported for specific water streams [13,17,18,19].

2. Materials and Methods

2.1. Sampling

In total, 98 surface water samples were collected between 2017 and 2019 in 22 countries participating in four regional projects coordinated by the United Nations Environment Programme (UNEP). Sampling locations had to be chosen by the participating country to be integrative and not influenced by local sources, e.g., at the mouth of large rivers or in estuaries. The sample distribution is shown in Table 1 and had 32 samples from Africa (six countries), 33 from Asia-Pacific (11 countries; of these, three from the Asian continent and eight from Pacific Islands countries), and 33 from GRULAC (five countries). Beforehand, the samples were assigned according to type as either fresh water (from rivers) or salt water (from oceans). Of the 98 samples, 67 were assigned fresh and 31 saltwater. Brazil was the only country where the sampling location was changed: 2017 samples were collected in the Amazon delta and assigned fresh water, whereas 2018 samples were collected at the Sao Paulo channel and assigned salt water. Briefly, water samples were collected using a basket to collect water at a depth of 30 cm to 1 m and then placed into a 1 L high density polyethylene bottle (HDPE).

2.2. Laboratory Analysis

Approximately 15 mL was used for metal analysis. For this purpose, all water samples were filtered using 0.20 µm PTFE (polytetrafluoroethylene) syringe filters. Stabilization of the solutions was accomplished by acidification using sub-boiled nitric acid to reach a final mass fraction of 1% HNO3. Storage temperature was 6 °C. Saltwater samples were diluted 1:100 using ultra-pure water to minimize the ionization depression by the saline matrix. Multielement Standard Solution 5 for ICP (Fluka) was used as certified reference solution to determine the trueness of the applied method at two different dilution levels, namely 1:100 and 1:10,000. The metal concentrations in the solutions were determined using inductively coupled mass spectrometry (ICP-MS Agilent 7500cx). The experimental settings were the following: output power 1500 W, Argon flows 15 L/min—plasma; 0.9 L/min—auxiliary; 0.2 L/min nebulizer. A MicroMist nebulizer was used, the sample flow being 0.3 mL/min. After nebulization, the sample passed through a Scott double pass spray chamber. The study covered the following elements (in order of increasing m/z): 7Li; 9Be; 23Na; 24Mg; 27Al; 39K; 43Ca; 51V; 53Cr; 55Mn; 56Fe; 59Co; 60Ni; 63Cu; 66Zn; 69Ga; 75As; 82Se; 85Rb; 88Sr; 95Mo; 107Ag; 111Cd; 125Te; 137Ba; 205Tl; 204+206+207+208Pb; 209Bi; and 238U. The collision cell was on for K, V, Cr, Fe, Cu, As, and Se with a He-flow of 5 mL/min. Quantification of the selected 29 elements was accomplished using five- or six-point external calibration based on multi-elemental standard solutions prepared from ICP multi-element standard solution VI (Merck, Germany). The calibration ranges were adjusted to the expected concentration of the respective analyte. To compensate for non-spectral interferences, rhodium was added as an internal standard to all test solutions, i.e., standard solutions, blanks, reference material, and samples, with a final mass concentration of 10 µg/L. The measured m/z was 103. All measurements were performed in triplicate.

2.3. Quality Control and Assurance

Based on triplicate measurements, the precision was calculated and expressed as relative standard deviation (RSD) which ranged from 0.15% up to 2.2% for all analytes, except Bi and U with values from 5% to 7%. The measurement of the reference solution led to recoveries ranging from 93% to 109% for the elements determined, proving the trueness of the method. Combining both good trueness and precision resulted in acceptable accuracy. All external calibration curves had R2 values ≥ 0.999. The limits of detection in the measured solutions were <0.001 µg/L for As, Co, Pb, Rb, Sr, Te, and U; between 0.001 µg/L and 0.005 µg/L for Ag, Ba, Be, Bi, Cd, Ga, Mg, Mn, and Tl; between 0.006 µg/L and 0.06 µg/L for Al, Cu, Fe, Li, Mo, Ni, and V; whilst Ca, Cr, K, Na, Se, and Zn had the highest LODs with values up to 2.5 µg/L. Thus, the analytical procedure chosen has been found to be applicable for the given analytical task.

2.4. Statistics

All data were maintained in Microsoft Office 365 Excel® (Microsoft Corporation, 2018. Microsoft Excel, Available at: https://office.microsoft.com/excel accessed on 7 December 2022). Statistical evaluations and visualization were made using R packages (versions 4.0.3 and 4.0.5) (R Core Team (2022). R: A language and environment for statistical computing. R Foundation for Statistical Computing, Vienna, Austria. URL https://www.R-project.org/ accessed on 7 December 2022.) with R-Studio (version 2022.07.1 Build 554; 2009–2022, R-Studio, PBC).
Following a normality test using histogram and density tests, the samples did not show normal distribution. Non-parametric testing was performed using the Kruskal–Wallis H test to determine if there are statistically significant differences between the independent variables and dependent variables. Post-hoc analysis was performed using the pairwise Wilcoxon test. Adjustment of the p-value was made using the Benjamini–Hochberg method. Significance level was set to p = 0.05. Correlation between variables was determined using the spearman method and hierarchical clustering in the heatmap using Euclidean distances (Ward method). Multivariate methods, such as hierarchical cluster analysis (HCA) and principal component analysis (PCA) were applied to assess similarities, correlations, or differences between datasets and meta-data. HCA was applied to find a natural grouping (clustering) of the data set to achieve less variation (greater similarity) within a group (cluster) and more variation (less similarity) between the groups (clusters). Clustering was made using Euclidean distances and the Ward method, which is a method of creating groups where the variance within the groups (clusters) is minimized. The data in a set are grouped into clusters of great(er) similarity to form a dendrogram. PCA is a multivariate projection method to extract and display systematic variation in a set of new variables, which correspond to a linear combination of the originals. The variation along the principal component is maximal. Similar approaches for evaluating such data sets are reported in the literature [20].
For statistical operations, concentrations below the limit of quantification (LOQ) were set to zero. Eleven samples had Na-concentrations outside of the calibration range, so that a value of 10,000,000 µg/L was assigned. Outliers were defined as values above (or below) the interquartile range multiplied by 1.5. The interquartile range is defined as the length of the middle 50% of data points, i.e., the difference between the third or upper quartile (75% of data points) and the first or lower quartile (25% of data points). Visualization is expressed as box whisker plots.
All countries are referred to by using their ISO alpha-3 code [21]. The countries were grouped geographically into the UN regions, whereby samples were collected only in three of the five, namely in Africa and Asia-Pacific, as well as the Group of Latin America and the Caribbean countries (GRULAC) [22].
The sample IDs were set-up as follows: ISO3 (YYYY-season) whereby YYYY refers to the sampling year and the seasons I to IV indicate sampling dates at the end of March (I), end of June (II), end of September (III) and end of December (IV).

3. Results

3.1. Elemental Concentrations in the Water Samples

Ninety-eight samples were analyzed for 29 elements as listed above. Eighteen analytes, namely Na; Mg; Al; K; Ca; V; Mn; Co; Cu; Ga; As; Rb; Sr; Mo; Ag; Ba; Pb; and U were found in all samples. Tl was not detected in 20 samples; Be not in 15 samples; Te, Bi, and Cd not in 12; Cr, Fe, and Ni not in 5; Se not in 3; whilst Li and Zn were present in all except one water sample. The sum of all concentrations alongside the percentage distribution of the elements determined is depicted in Figure 1. Due to different orders of magnitude of the concentrations of major and ultra-trace elements, this image mainly reflects the composition regarding major elements.

3.2. Regional Results

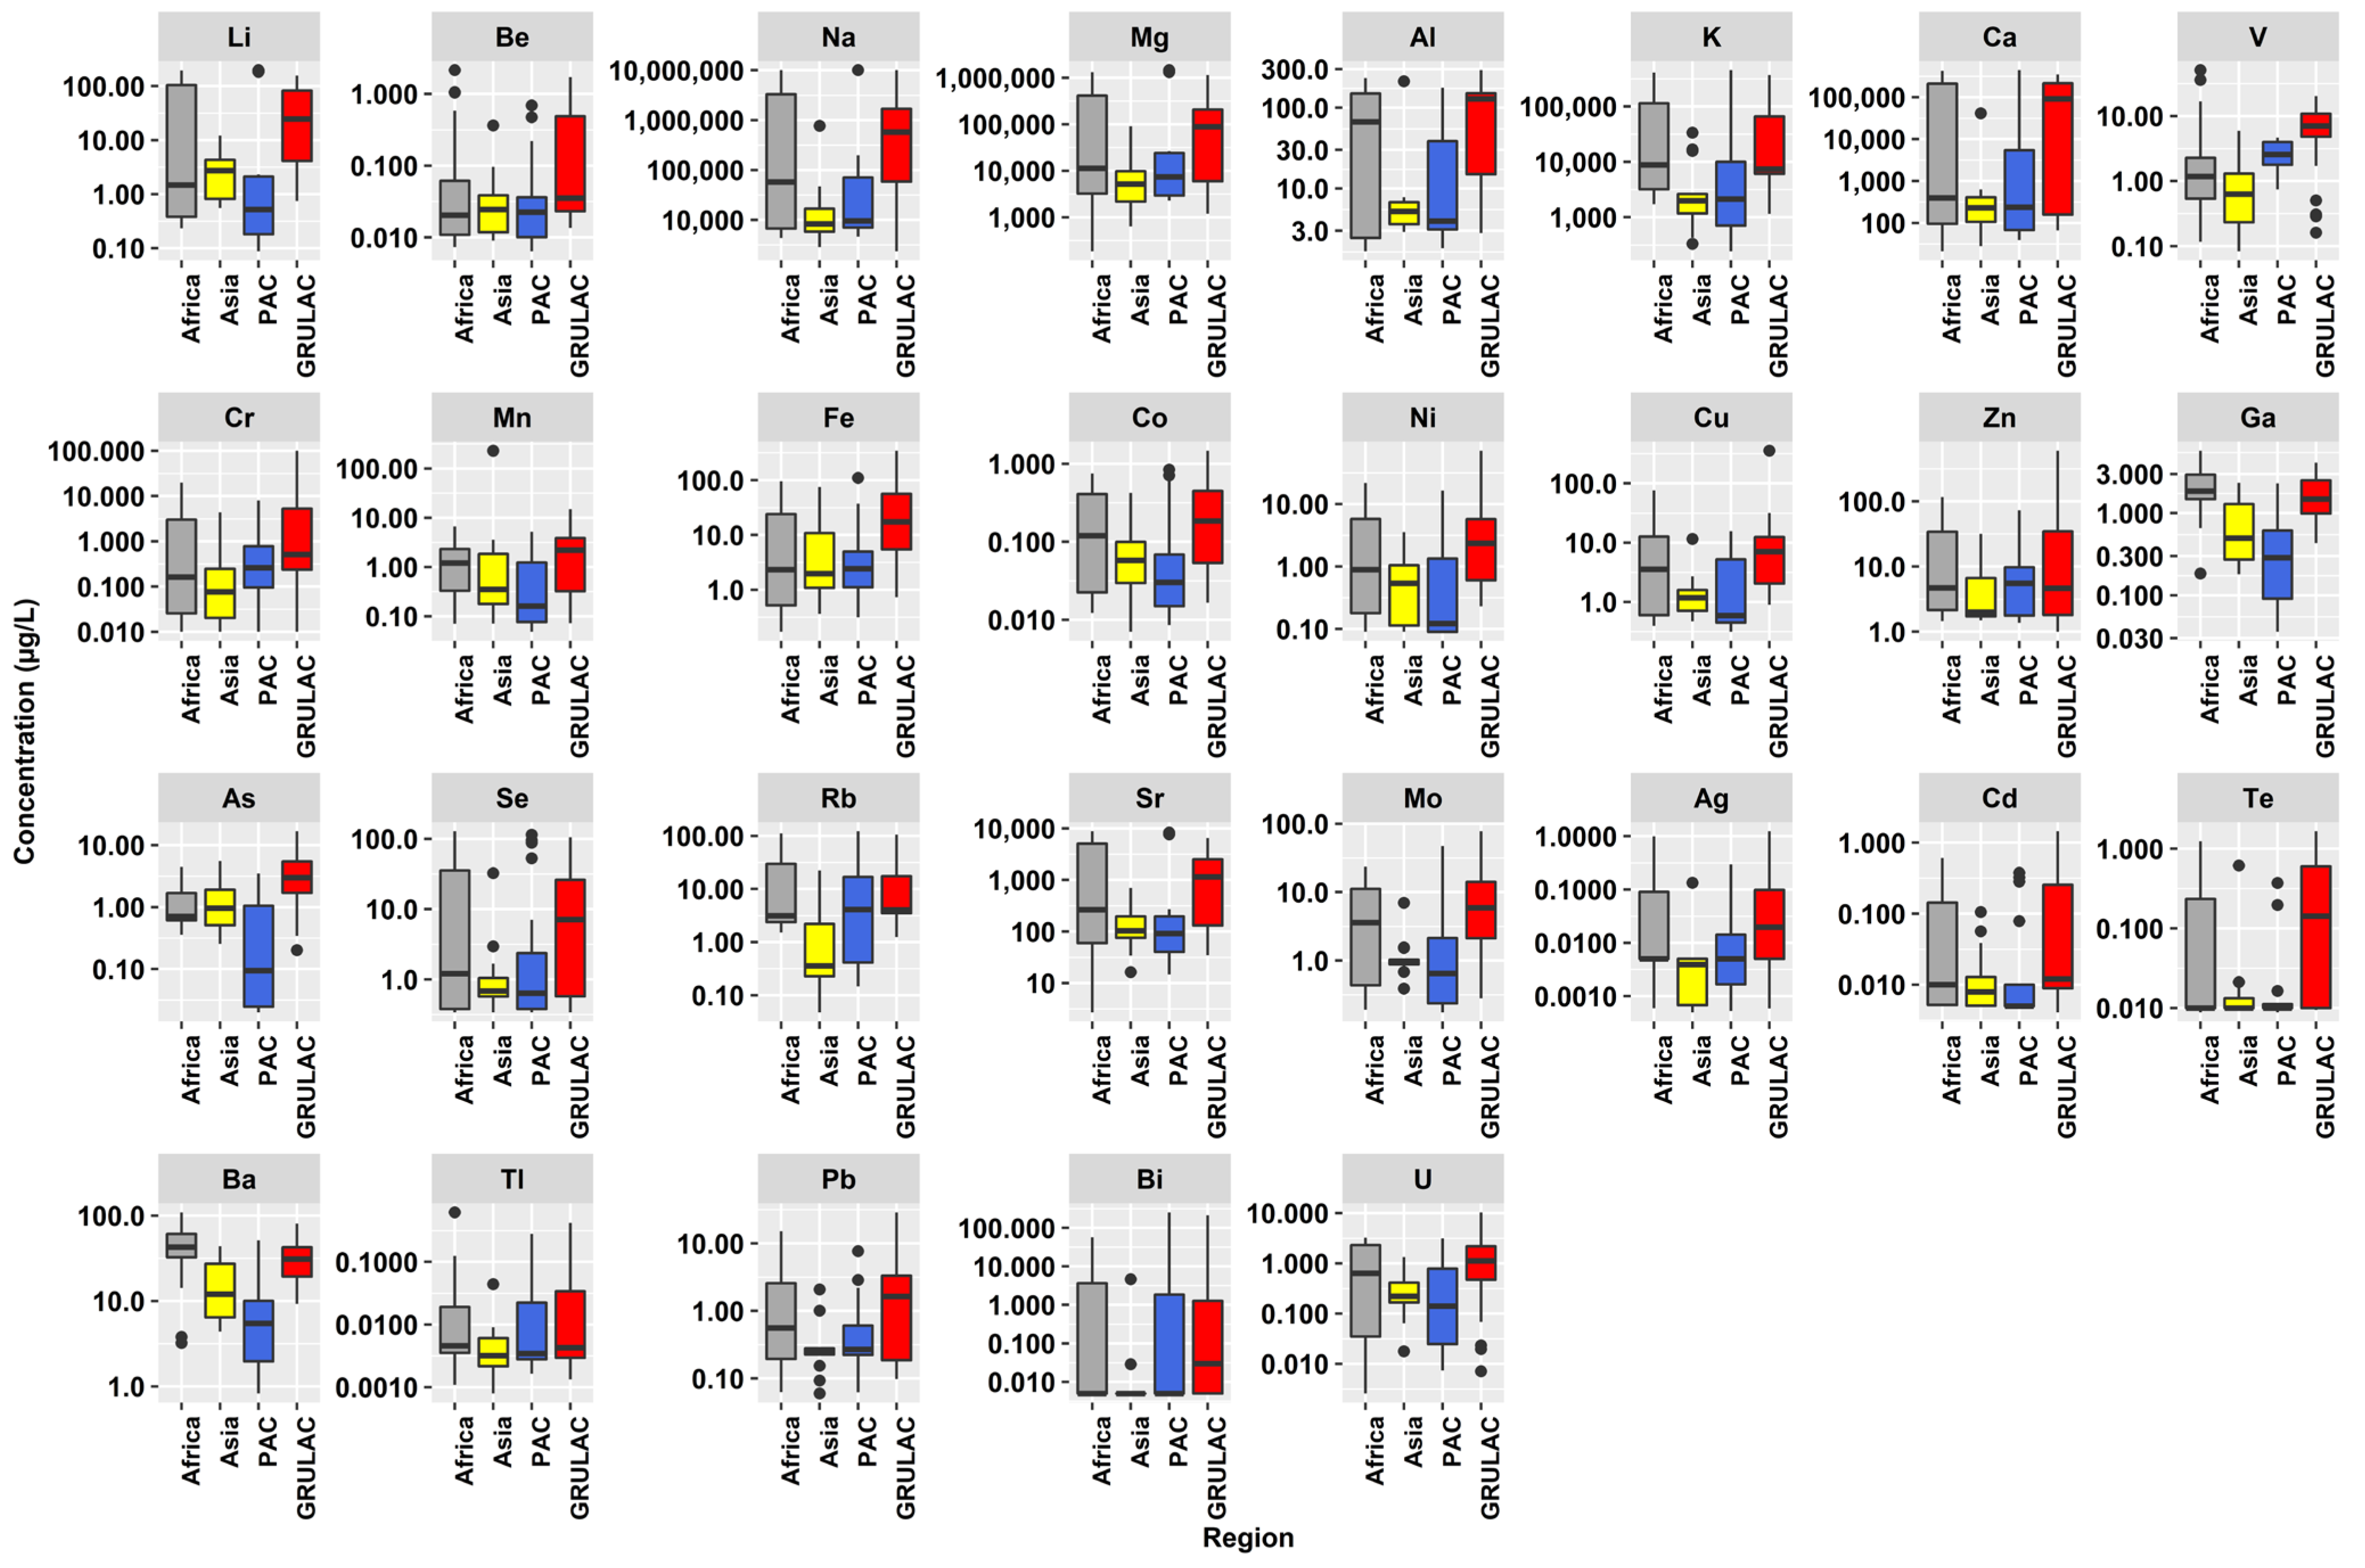
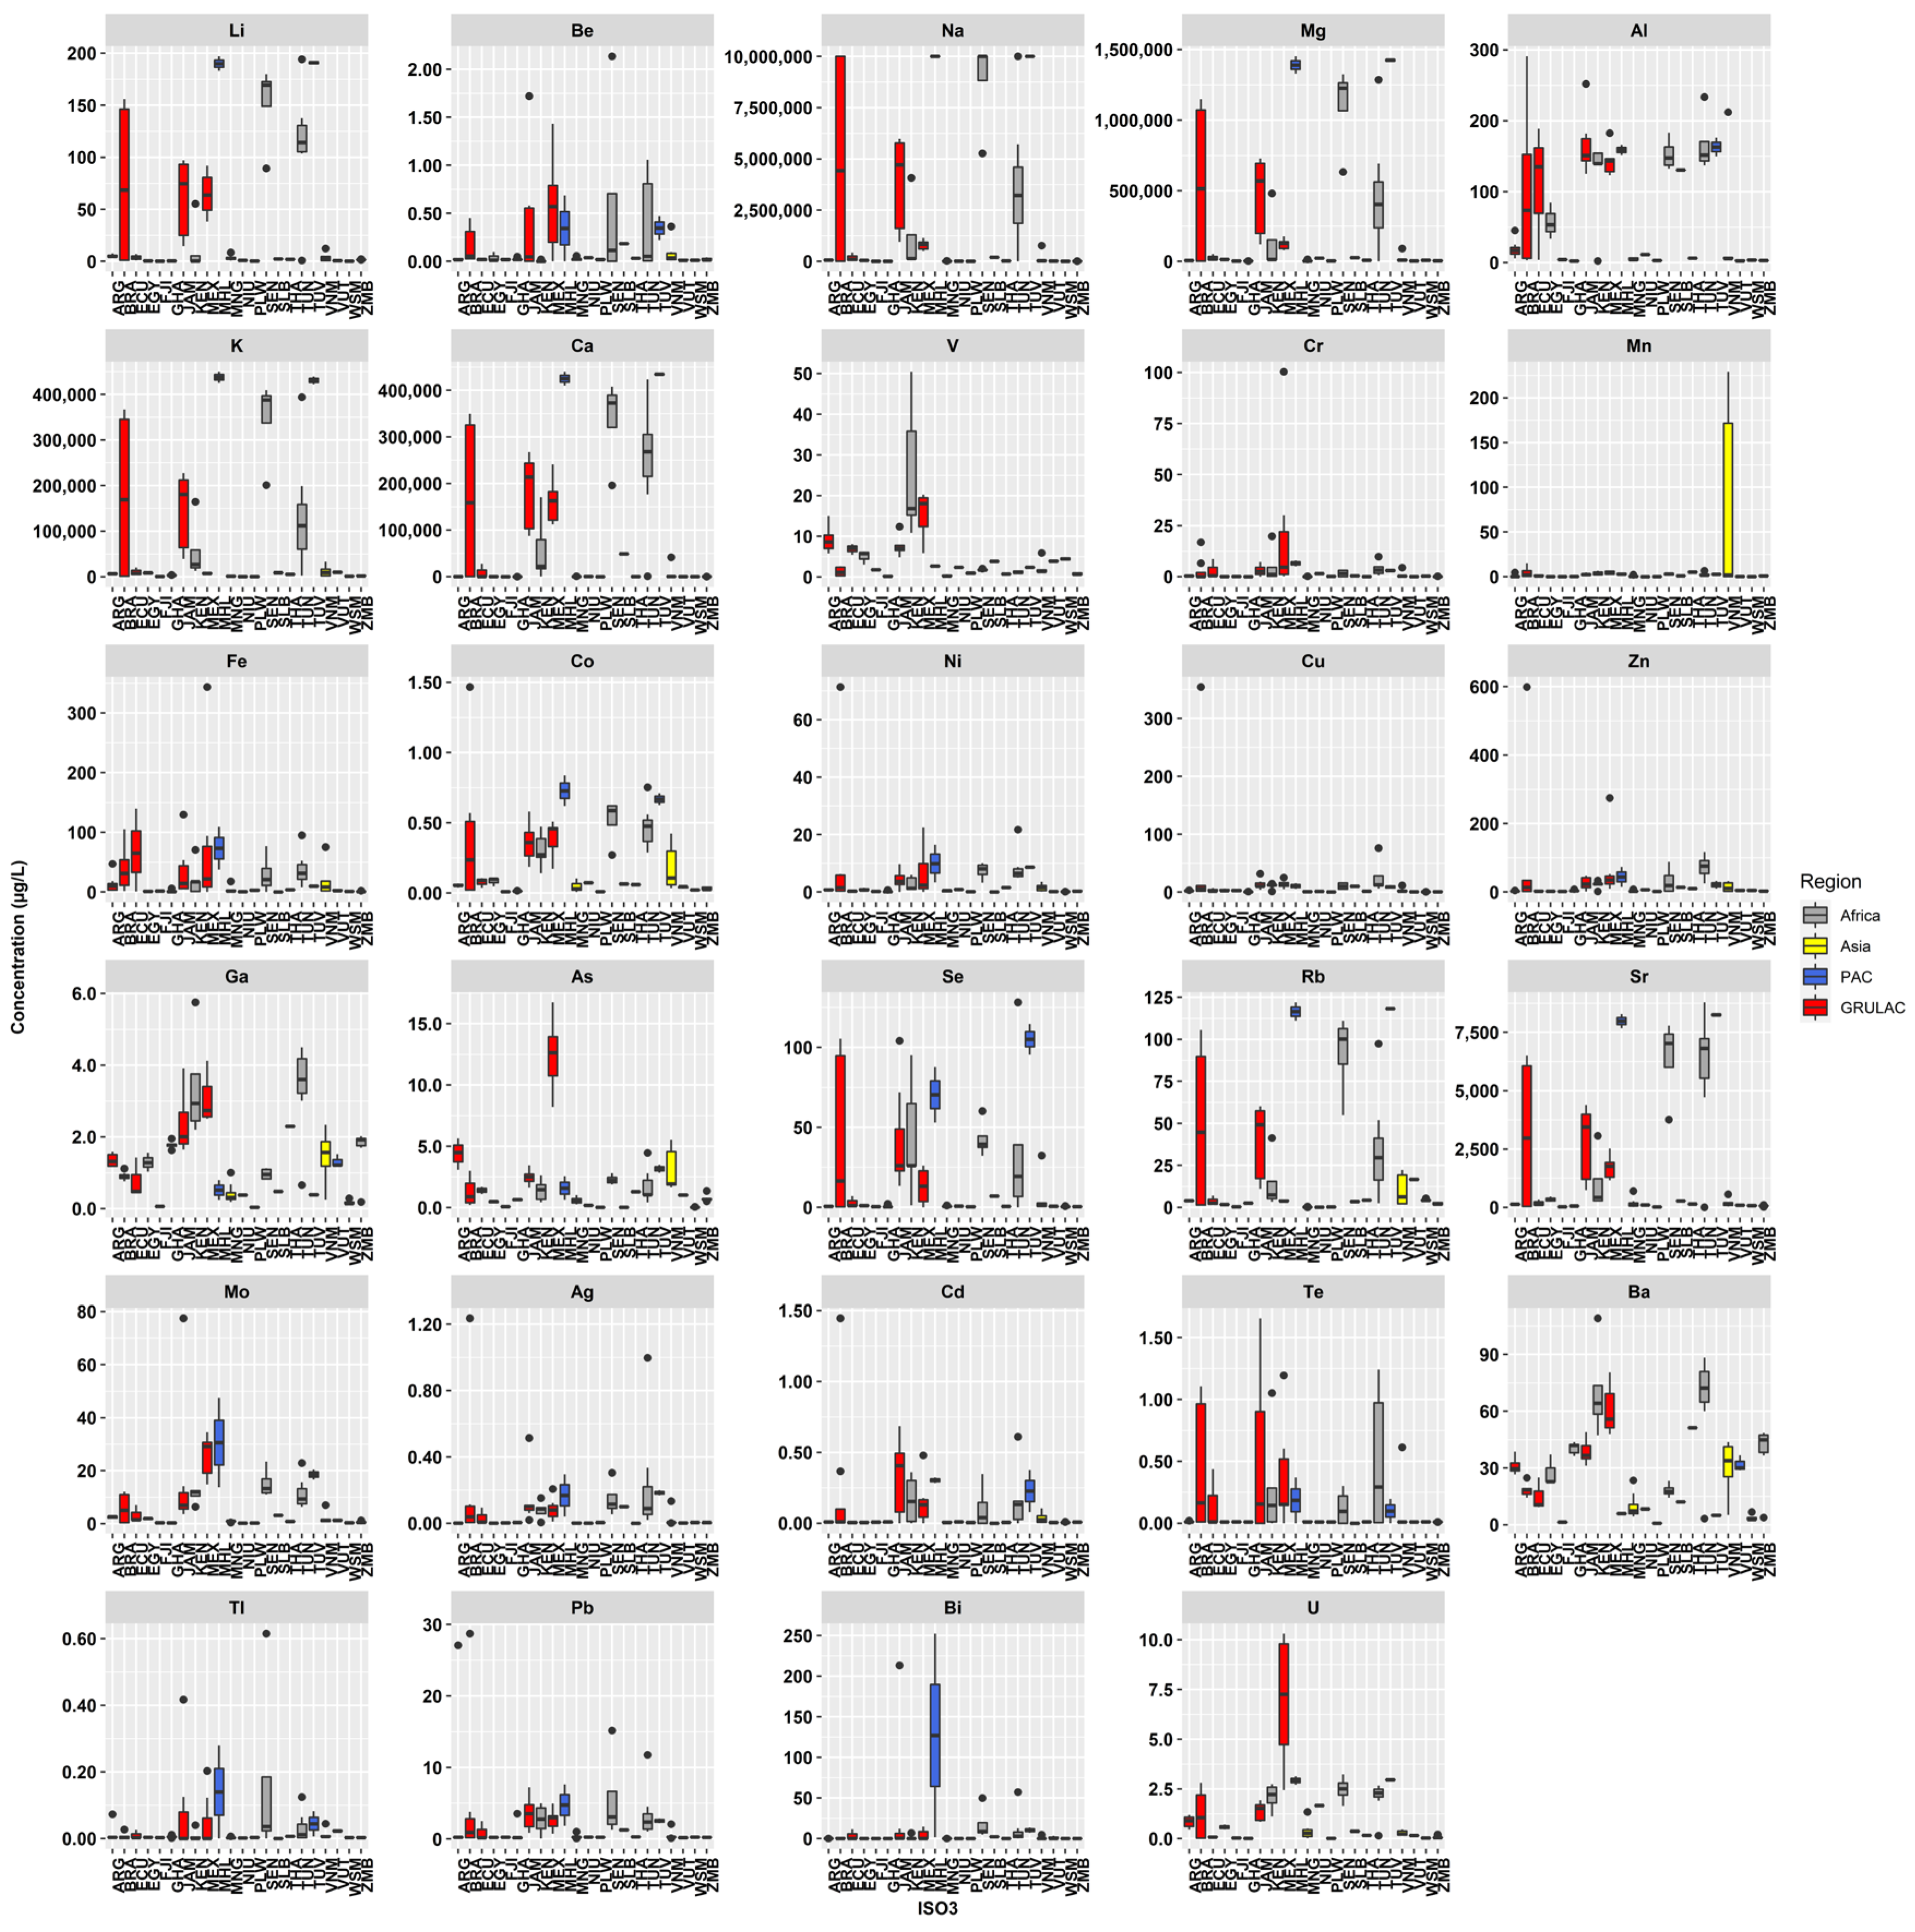
The results of the chemical analysis are visualized as box whisker plots in Figure 2 and Figure 3 for different regions and countries, respectively. The scale for the results differs widely in both cases: highest numbers were obtained for sodium (Na), magnesium (Mg), and potassium (K), indicating salt water.
The results of the Kruskal–Wallis test gave chi-squared = 50.977 and a p-value of 4.949 × 10⁻¹¹; thus, they showed statistically significant differences between regions. The pairwise comparison, however, showed that Asia was not significantly different from the Pacific region. The respective p-values are: Asia/Africa 0.0021; PAC/Africa 0.0033; PAC/Asia 0.7801; GRULAC/Africa 0.0022; GRULAC/Asia 1.9 × 10⁻⁸; GRULAC/PAC 2.3 × 10⁻⁸.
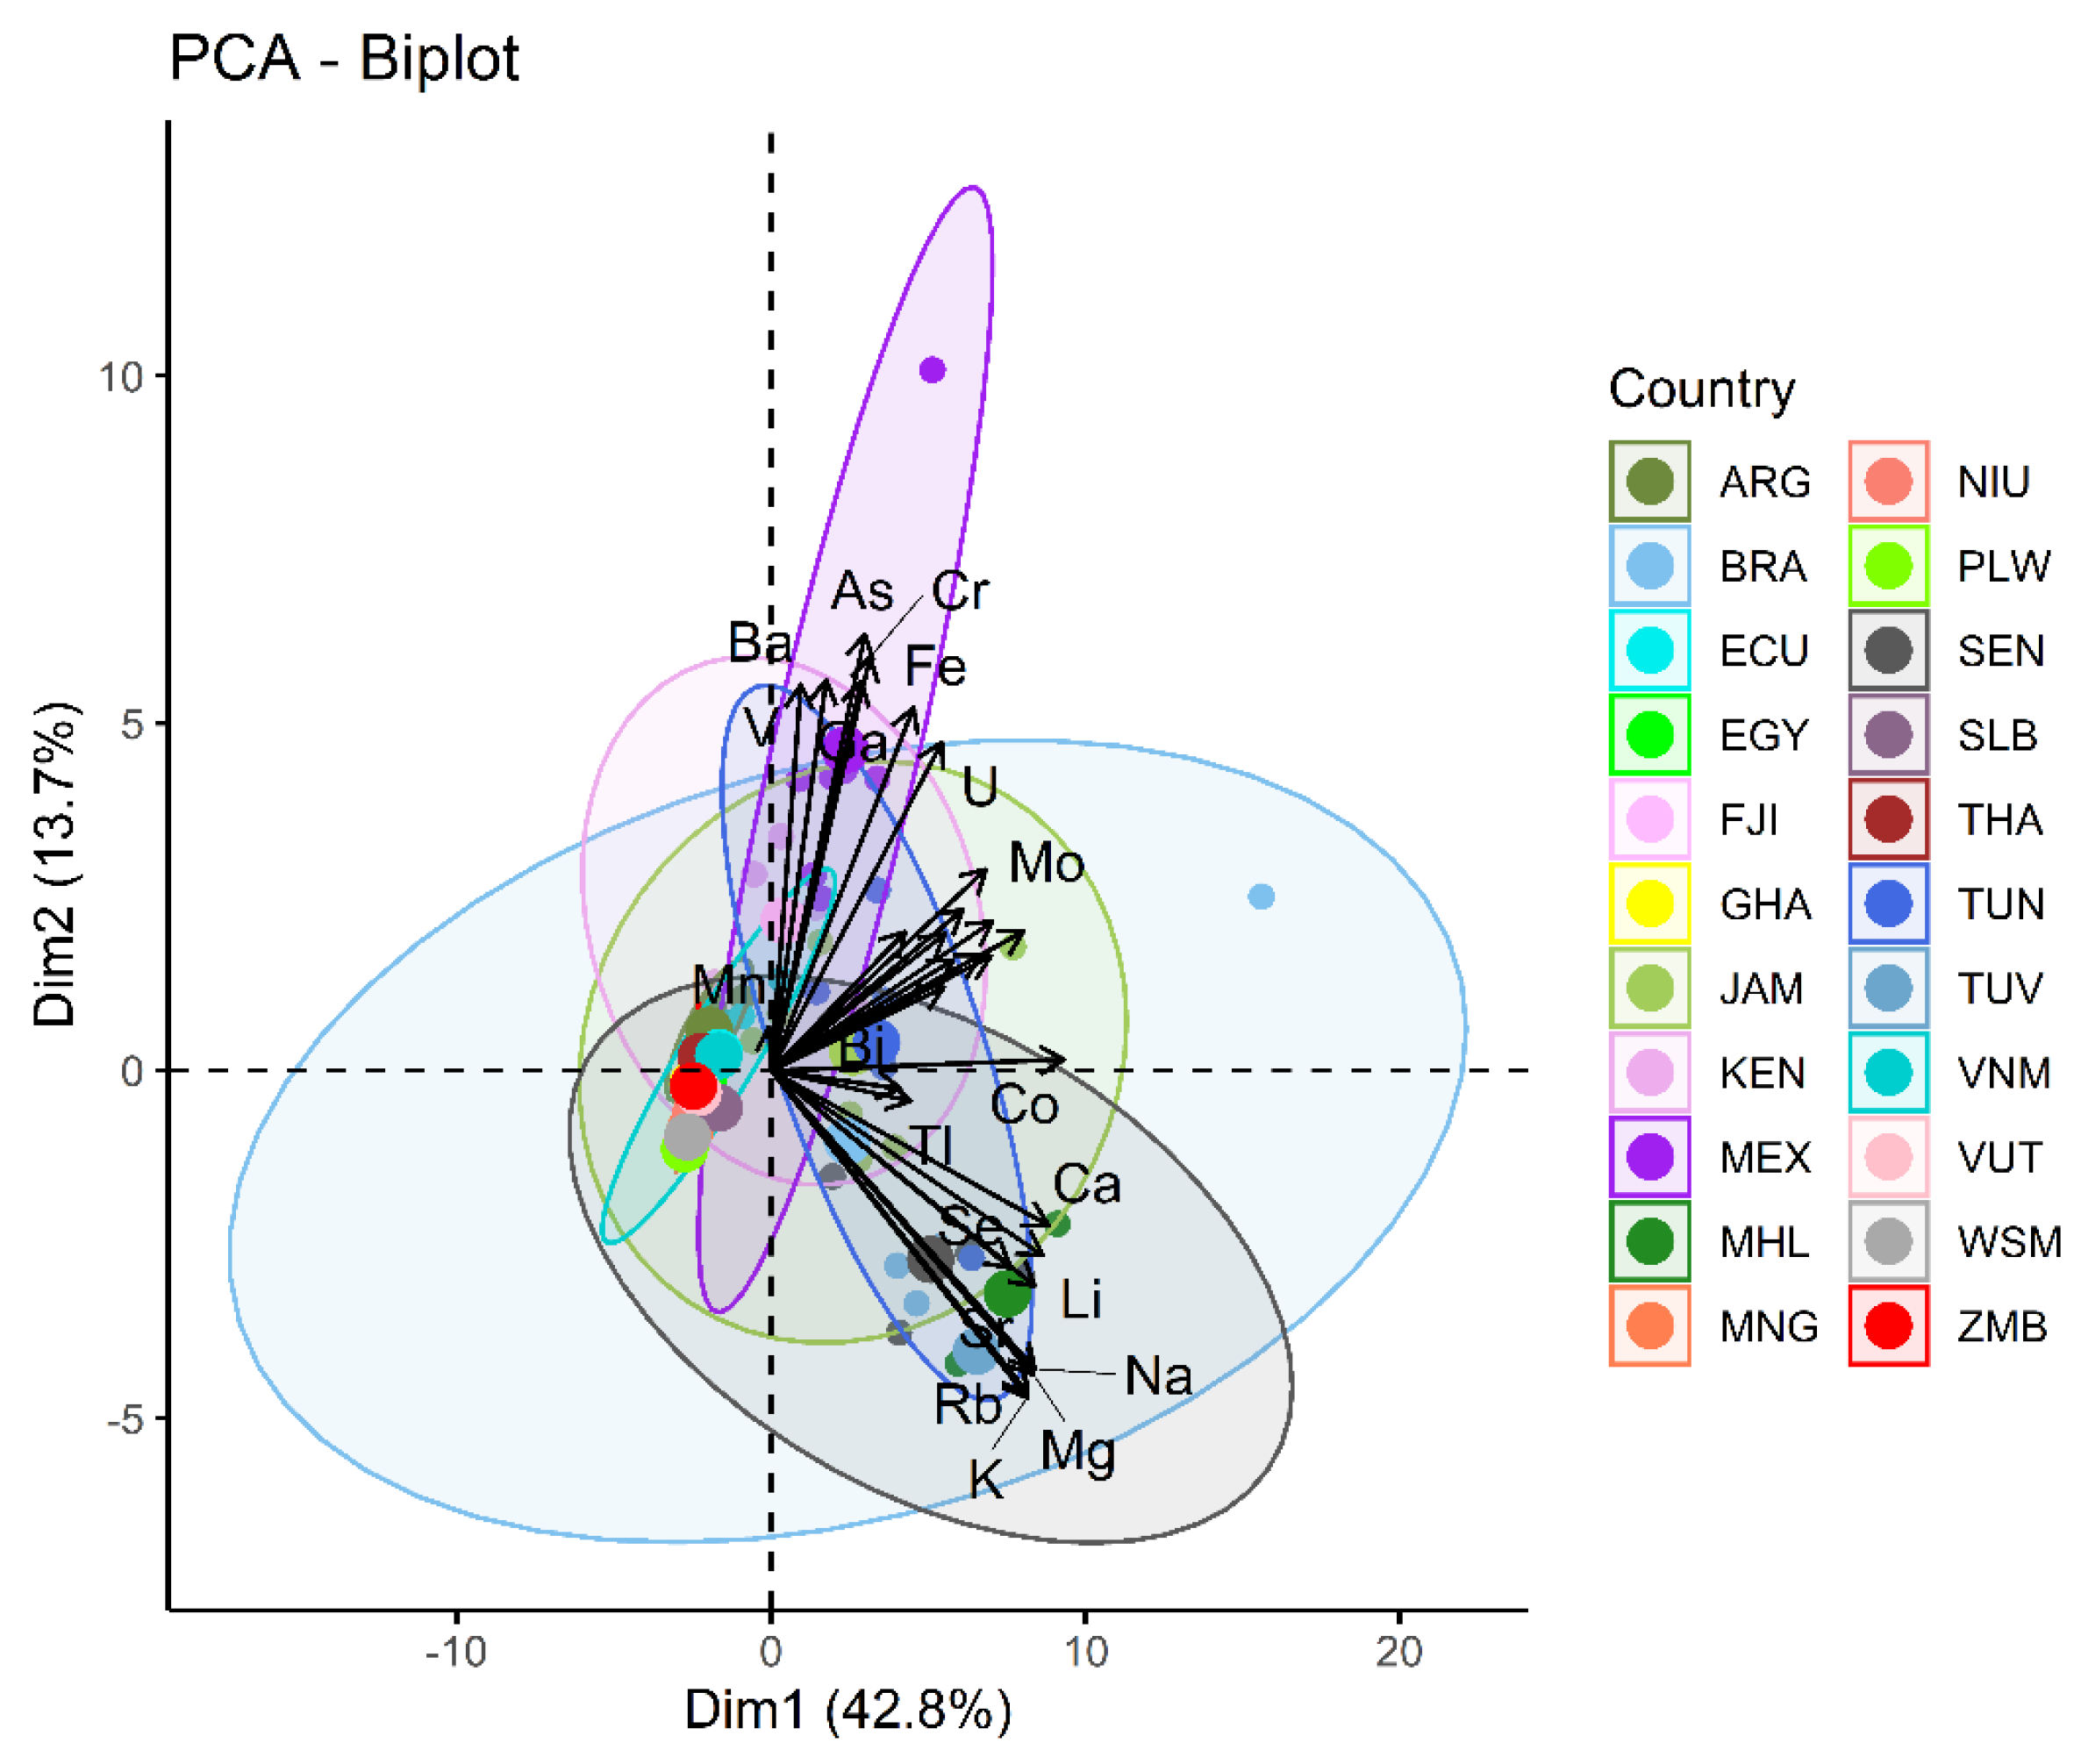
The biplot in Figure 4 explains 56% of the samples and has most samples located in the 1st quartile and close to the y-axis. This 2nd dimension is driven by As, Cr, Ba, and Fe. The samples in the 4th quartile are driven by alkali and alkaline earth metals, e.g., Na, Mg, K, and Li. The ellipses, where possible, are wrapping the countries, thus highlighting the influence of the sampling site on the elemental composition of the waters. The identity of the samples is displayed in Figure A1 in the Appendix A.

3.3. Results Based on Water Type

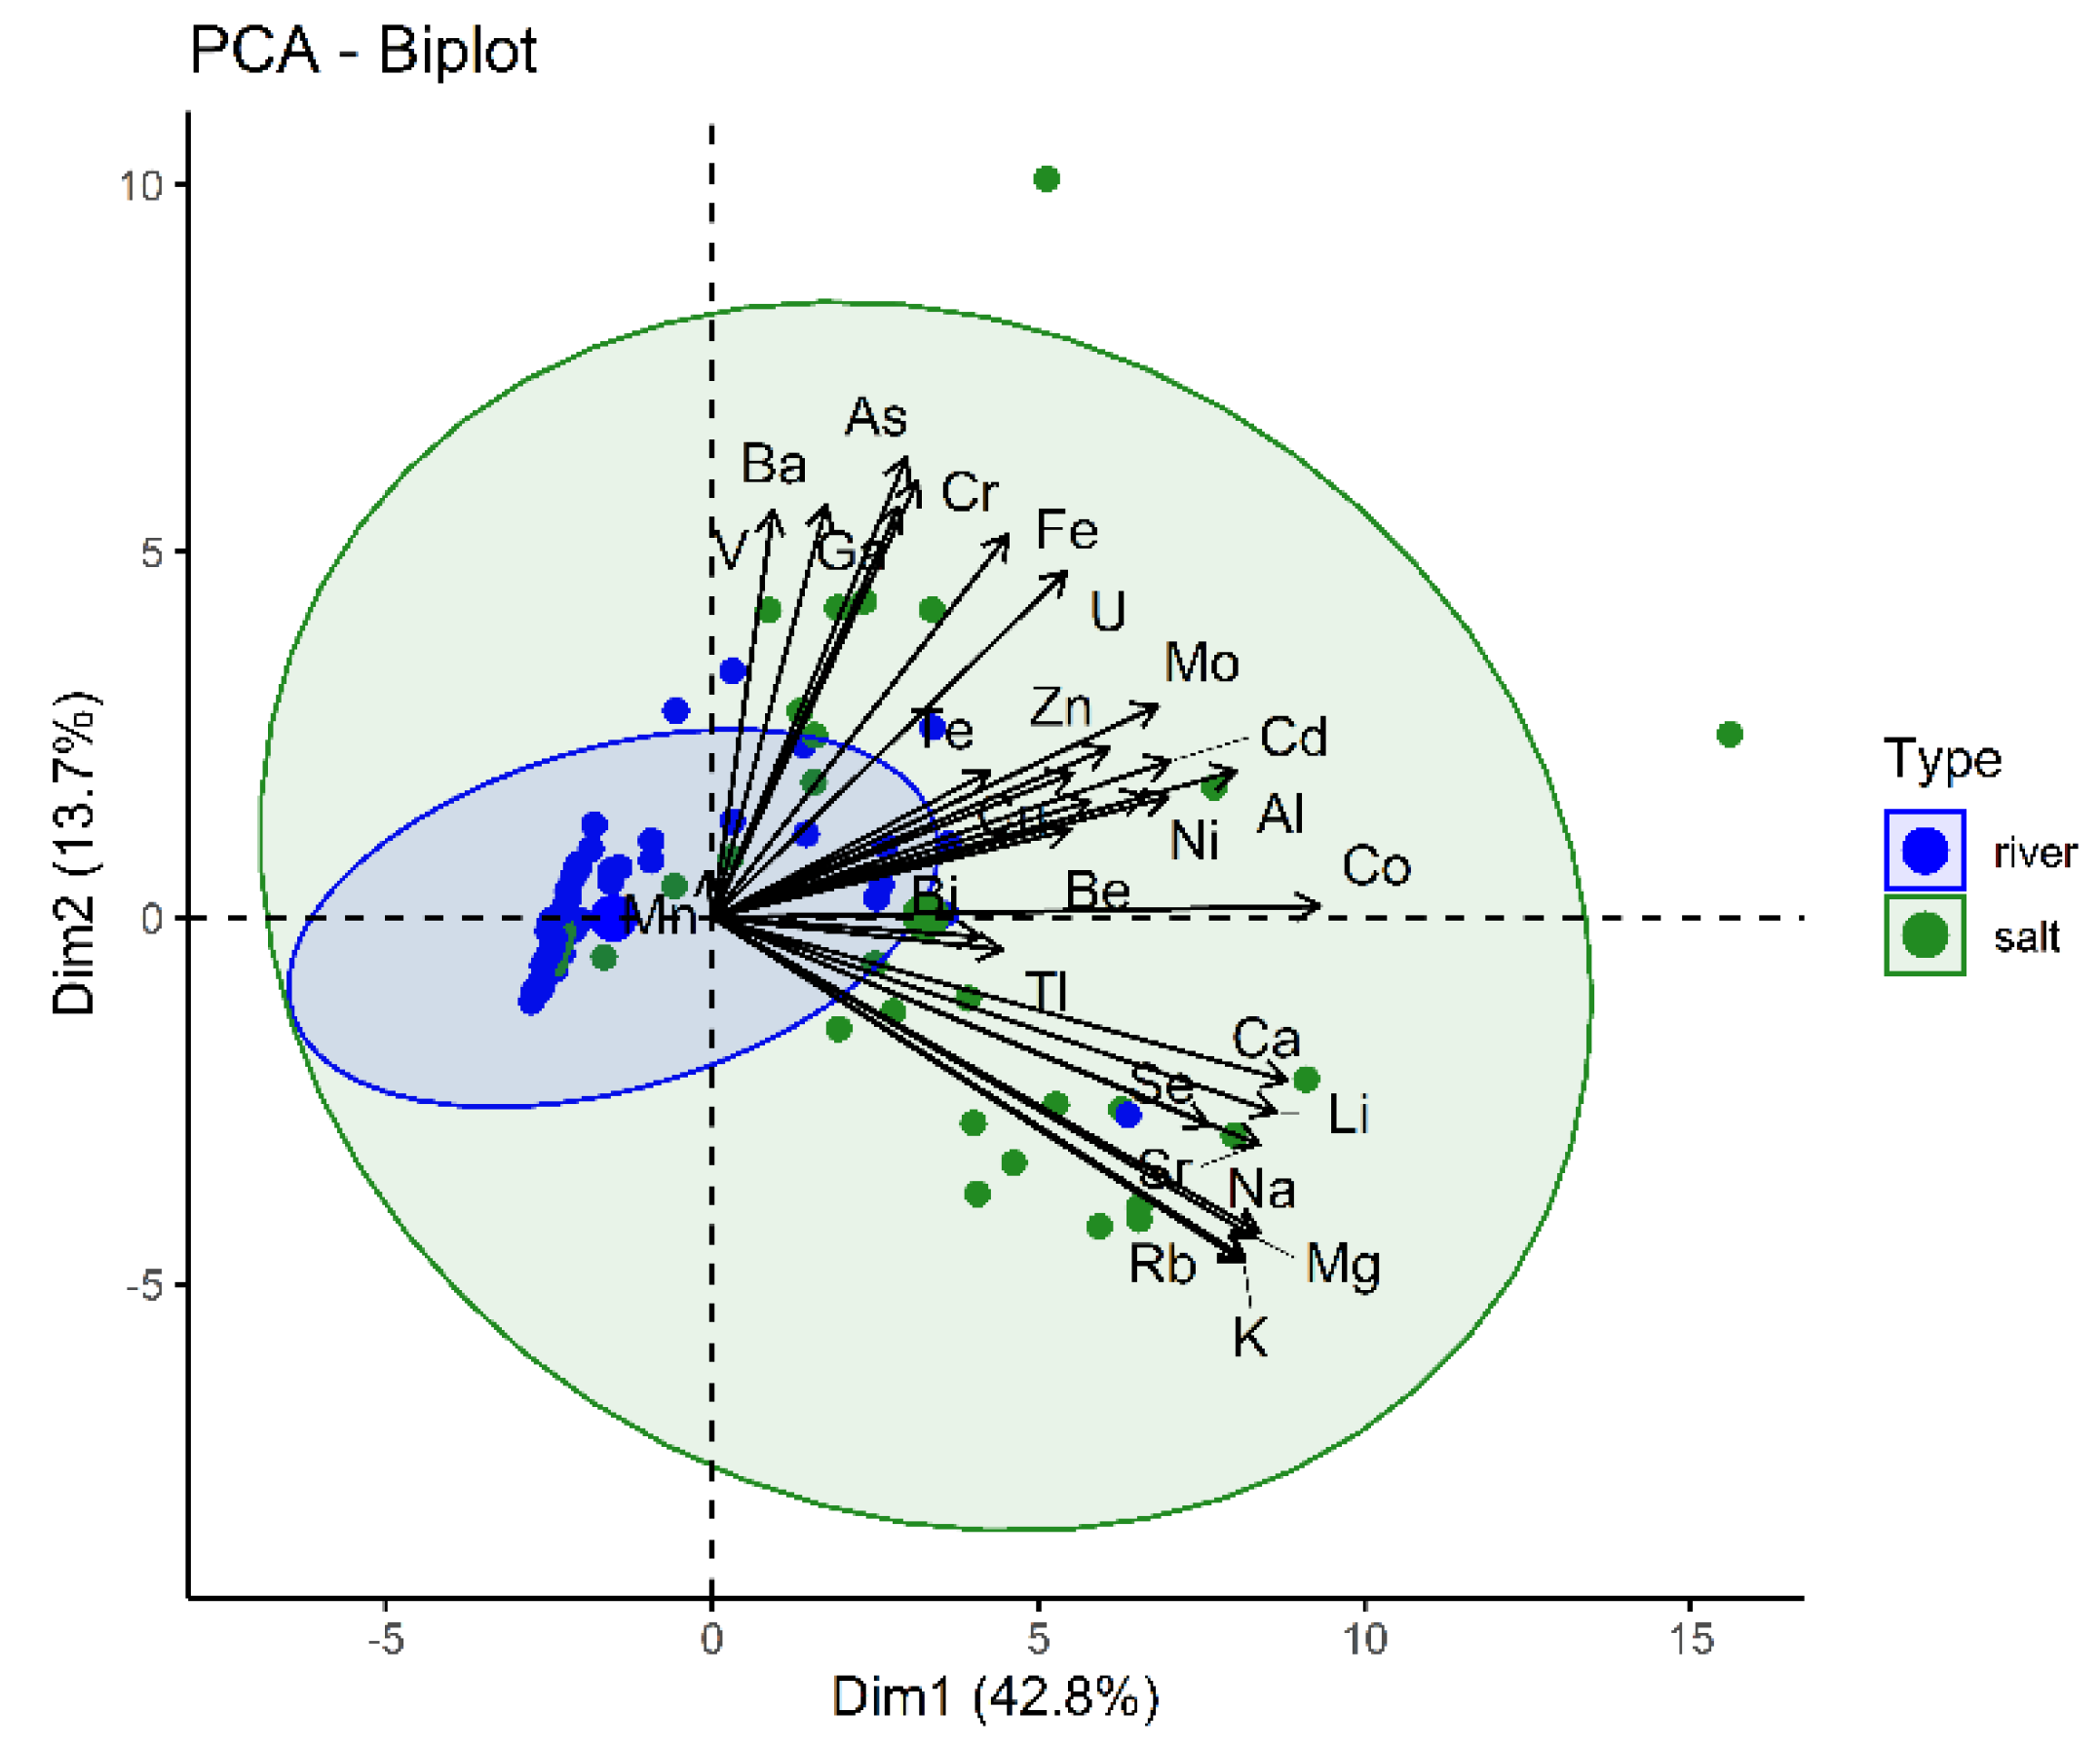
Figure 5 shows the box-and-whisker-plot for all analytes regarding water types. With respect to all analytes, the river samples are statistically significantly different from the saltwater and freshwater samples. In all cases, p was calculated to be ≤0.001, thus below the decision criterion of 0.05. This finding is also clearly visible in the respective PCA-biplot (Figure 6). Glacial lakes sampled in Romania, as a special case of surface waters, contain fewer alkaline and earth alkaline elements, but the trace elements Al, As, Cd, Cu, Fe, Mn, Se, and Zn were present in similar ranges. Conversely, Pb was found in a similar concentration, but higher in the glacial lakes [23].
The whiskers represent the minimum and maximum concentrations without the outliers. The lower border of the box represents the first quartile (25%), and the line inside the box the median and the upper border is the third quartile (75%). The dots outside the whiskers are outliers, which were defined as all concentrations greater or smaller than the interquartile range multiplied by 1.5.

3.4. Correlation of Analytes

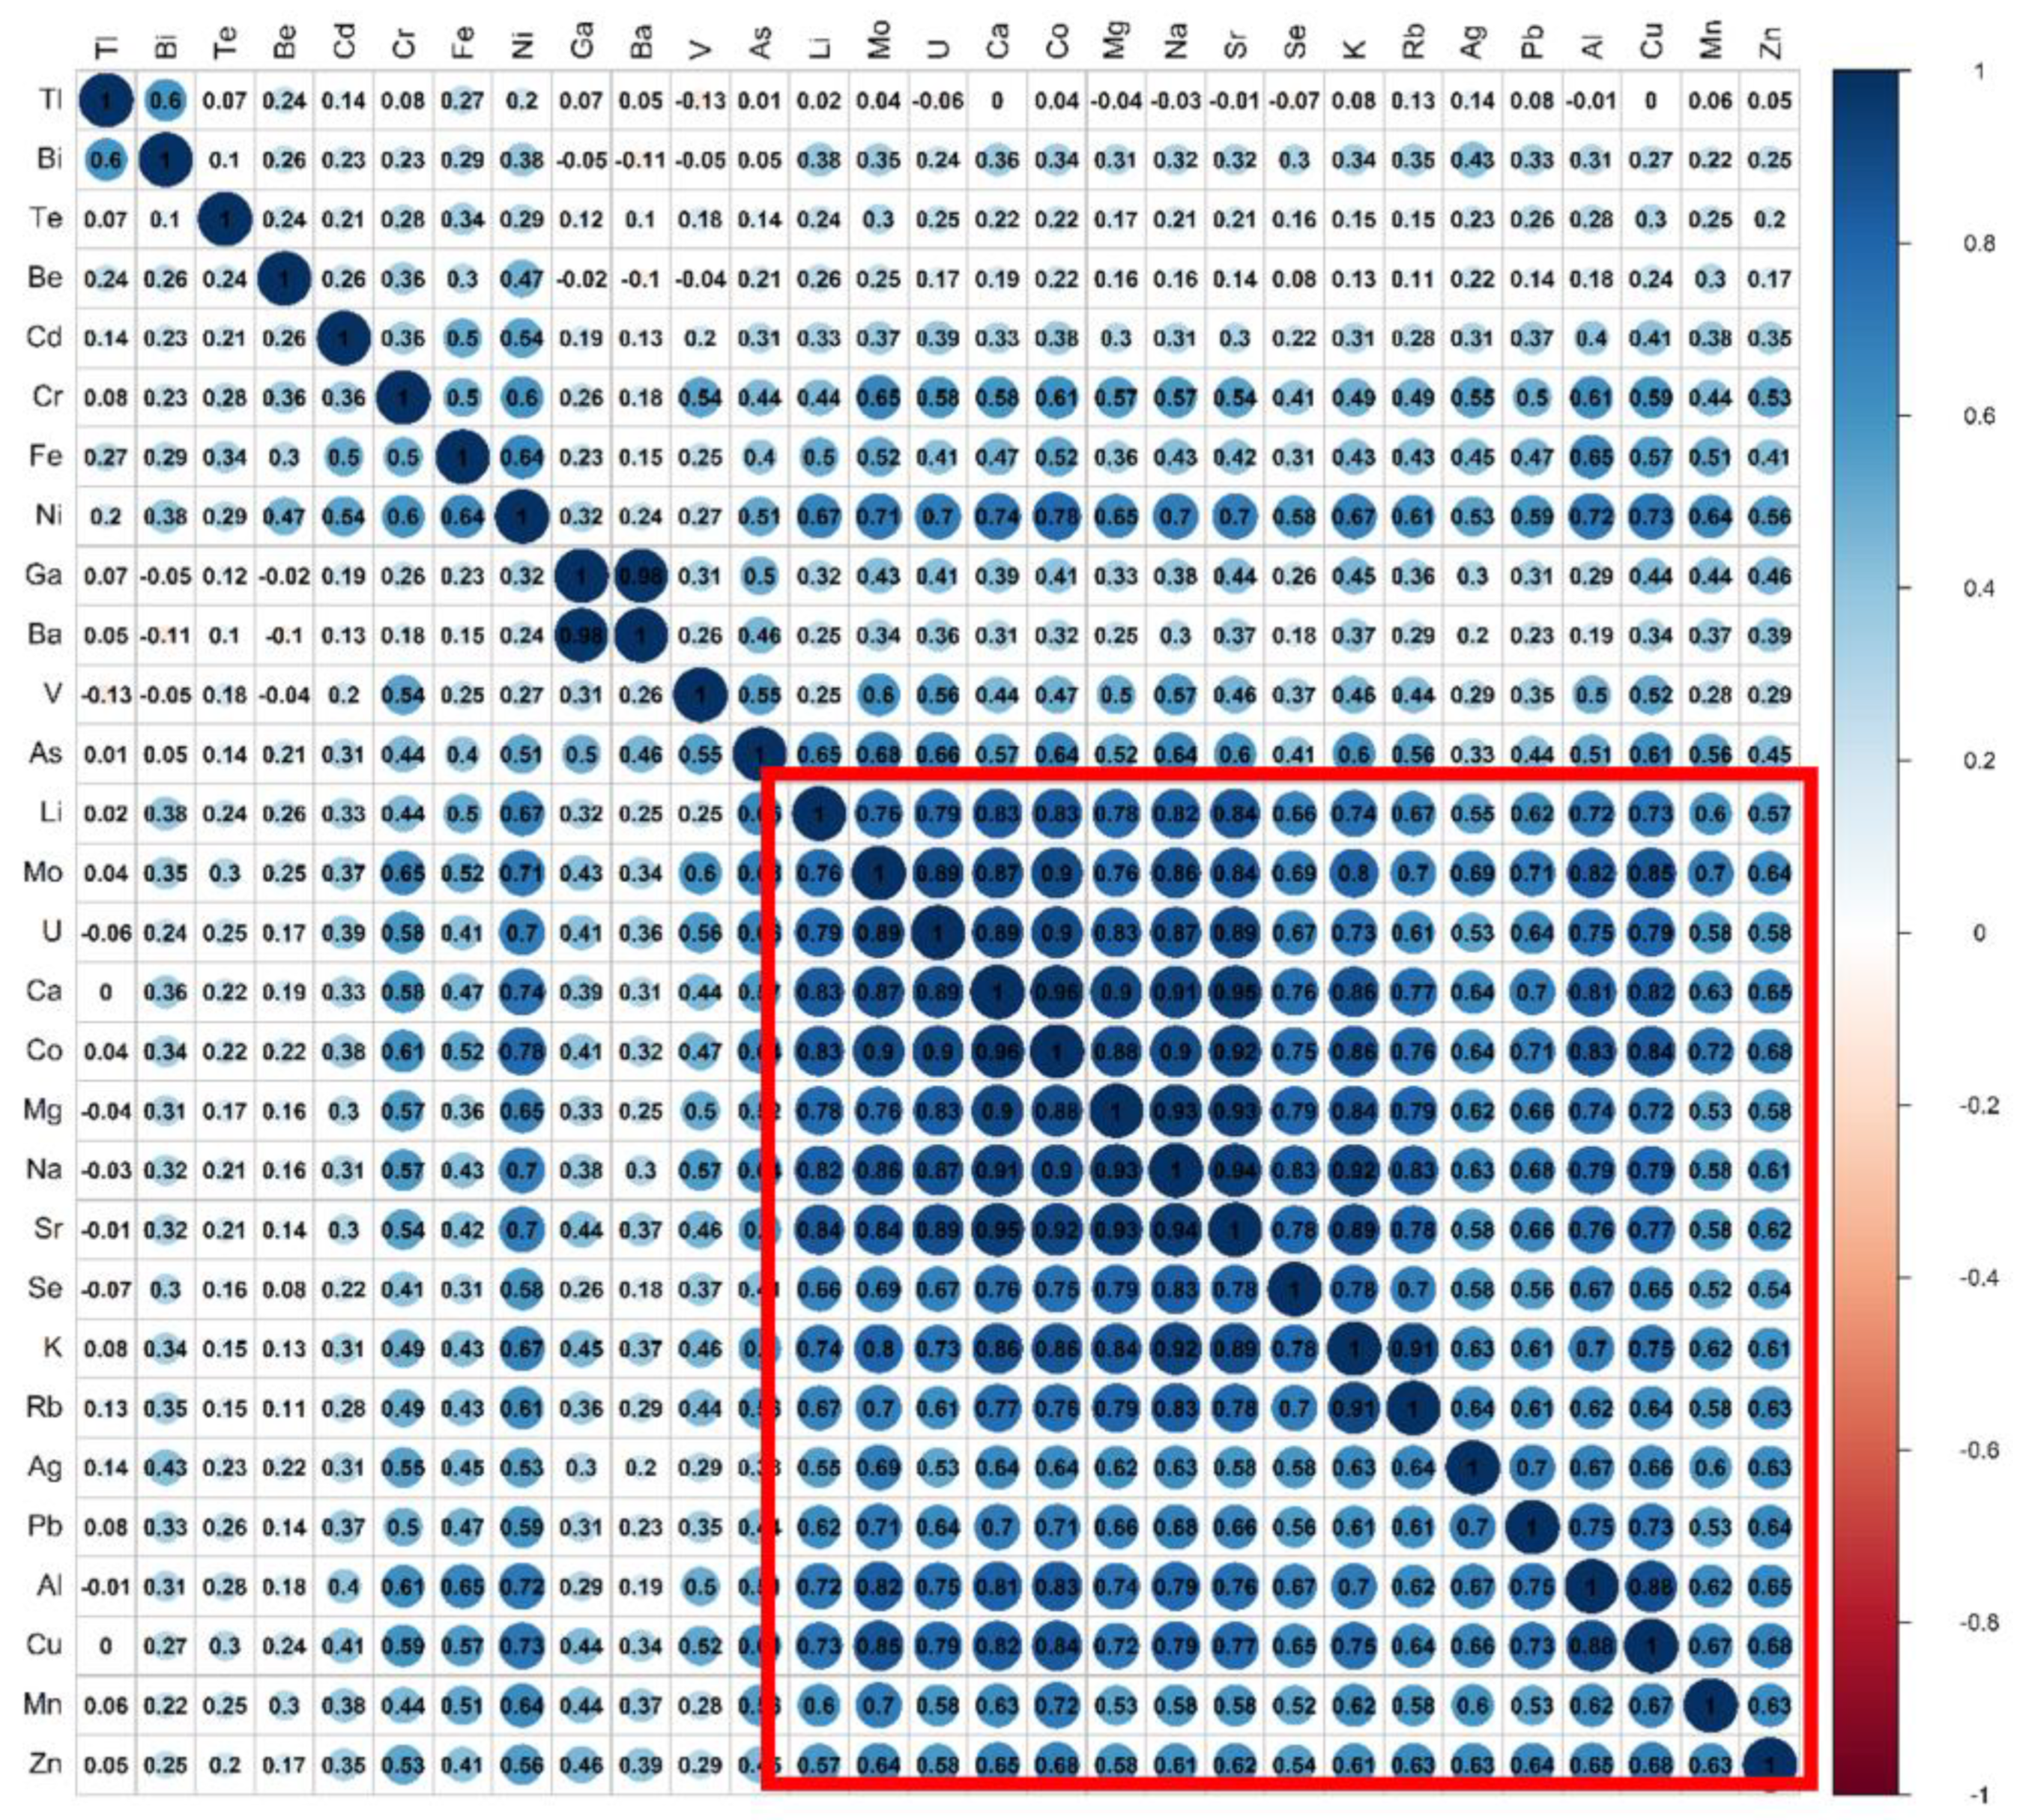
The correlation coefficients of all quantified elements are presented in Figure 7. It can be seen that the elements from Li to Zn, i.e., Li, Mo, Ca, Co, Mg, Na, Sr, Se, K, Rb, Ag, Al, Cu, Mn, and Zn are moderately correlated (r > 0.50). The strongest correlation was found between Ga and Ba with r = 0.98, followed by Co and Ca (r = 0.96), Sr and Ca (r = 0.95), with Ca and Sr being common elements in the geological background as part of mother rock.
In addition, Ni is highly correlated to these elements (r > 0.70). This evaluation confirms the above list of significant elements for regional allocation. A cluster analysis performed on selected potentially toxic elements in surface water in the Dexing area in Jiangxi Province, China, showed correlation between As and Cr as well as between Cu and Zn, but also connected to Cd and Pb [20], which is in agreement with the data of the present study.

4. Discussion

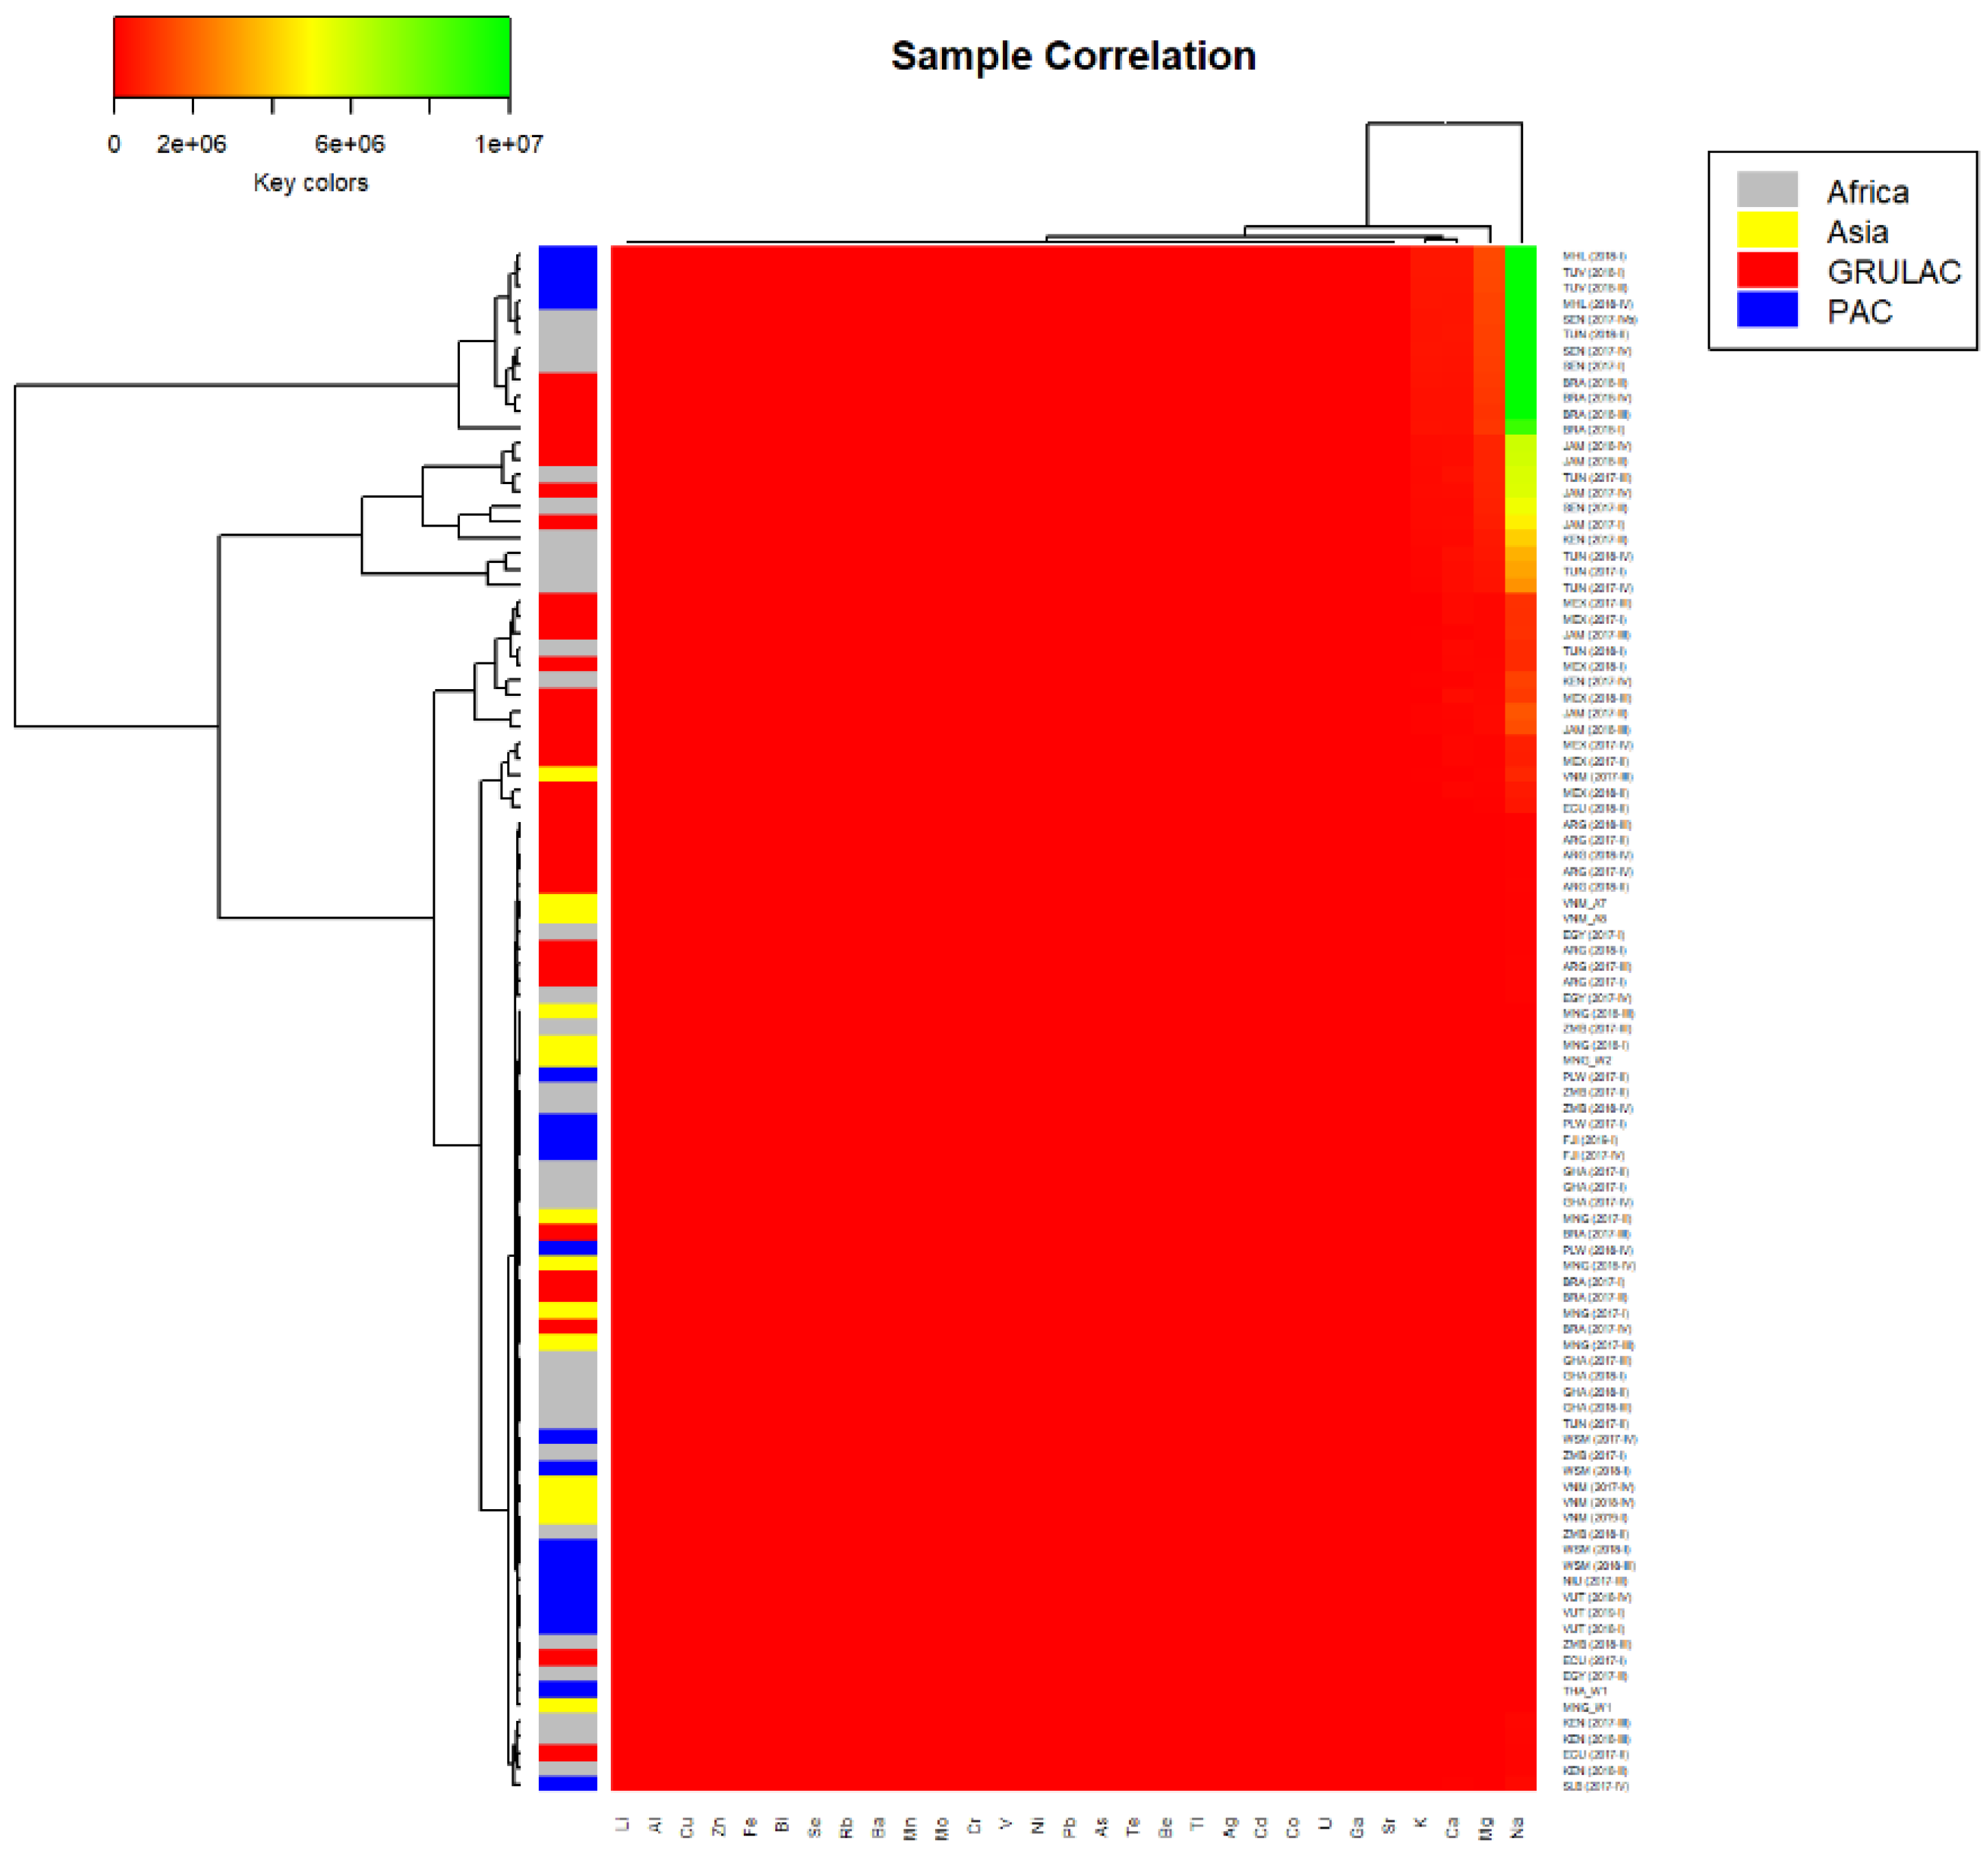
As expected, Na, Mg, Ca, and K are the major elements in all water samples. The Na-concentration can be used as an indicator for salinity, especially for mixed waters resulting from rivers (fresh water) and seawater (high salinity) found in estuary regions. The impact was especially seen in the samples from Argentina, Ecuador, Senegal, and Tunisia. The heatmap (Figure A2) in the Appendix A shows the correlation of all analytes with the sampling site.
However, not only the concentration of the major elements is specific for the water type, but it was found that the metal pattern in general differs significantly per water type (compare Figure 6).
The order of elements in decreasing concentration reported for surface water in remote areas, namely Ca, Na, Mg, K, Pb, Co, Cu, Zn, Mn, Cr, Fe, Cd, and Li [16], was not found in the present study, which gave the following (only considering the same analytes): Na, Mg, Ca, K, Li, Zn, Fe, Cu, Mn, Cr, Pb, Co, and Cd. This indicates different anthropological as well as natural sources of the elements investigated and highlights the difficulty of establishing globally applicable natural background levels for surface water. The fact, however, that statistically significant differences in the water composition were found for the four different geographical regions investigated shows that at least some elements or the pattern of selected metals and metalloids is specific for certain regions. The main contributing elements are Na, Mg, K, Rb, Co, Ca, Li, Sr, Al, Se, Mo, Cd, U, Ni, and As. Thus, limiting studies to those significant analytes can be a starting point for regional reference concentration ranges. The reduction of analytes furthermore reduces analysis as well as data evaluation time, especially when using a single element method, such as atomic absorption spectrometry.
Some potentially toxic elements are listed in the Environmental Quality Standards for Surface Water published by the Ministry of Ecology and Environment of the People’s Republic of China [24] with maximum values depending on the intended use of the respective water. The concentrations of As, Cd, Pb, Zn, and Cu in the 98 samples analyzed were below the respective limits for category III, and only one sample contained more Cr than the stated 50 µg/L.
Due to the different outlay of the present study and the majority of the research articles published so far, comparison of data is limited. However, similarities were found for regions without high pollution. For example, As, Pb, Cd, Cr, Cu, and Zn determined in a long-time investigation in the Wen-Rui Tang River, China, showed similar values for all analytes, except for Cd, which Qu and colleagues found in higher concentrations [18]. Samples from the Kelantan River basin of Malaysia had lower concentrations of Cu, but similar ones of Zn, Cd, and Fe [8]. A clear difference can be seen in highly polluted surface water, such as in the surroundings of the Sidi Kamber Mine, NE Algeria, where concentrations of Fe, Zn, Mn, Cd, and Pb in the mg/L-range were reported [9]. The Mahrut River, Diyala, Iraq is another polluted surface water body with high concentrations of Cr, Ni, and Pb [25]. Regarding evaluation of pollution levels of water bodies, the total amount of water is important for the determined concentration, which is of concern in regions with monsoons. Significant differences in metal concentrations are found in the Kalingarayan Canal before and after monsoon [26].
Besides this metal analysis, 500 mL of the 1 L samples were used for analysis of perfluorinated substances (PFAS) in the organic chemistry laboratory of Örebro University. The results are reported in the published literature with an emphasis on the three PFAS that are regulated by the Stockholm Convention on Persistent Organic Pollutants (POPs) [27,28]. Figure A3 reproduces Figure 7 amended by the three PFAS measured in the same samples. These PFAS’s are highly correlated among themselves (r > 0.8) and have moderate correlation with the following elements: V, As, Ga, and Ba (between r = 0.44 and r = 0.69) but not with the saline elements (Na, K, Mg). As with PFAS, the occurrence of V in the environment is considered a result of anthropogenic processes, and this element has high anthropogenic enrichment factors in the atmosphere as well as in rivers compared to other trace elements [29,30].

5. Conclusions

With the broad geographical coverage and wide range of metals and metalloids, this study was not designed to provide a detailed investigate, but rather to provide a starting point for countries where no data existed or without laboratory capacity. Various types of water from different geographical regions showed that distinctions are correlated to the concentration of certain metals and metalloids. Regarding water type, alkali metals and earth alkaline metals contributed most to the observed differences. In addition to those elements, Al, As, Cd, Co, Mo, Ni, Se, Ni, and U have been found to be correlated to the geographical origin of the water. Thus, a smaller number of analytes is sufficient to draw conclusions regarding water type and provenience, resulting in reduced analysis and data evaluation time. This preliminary study should be continued by increasing the number of sampling sites around the world and focusing on different water types. Sampling the same sites over years might show annual or even seasonal differences, which may provide insight into the consequences of climate change. The concentrations of metals and metalloids in surface waters might be a measurable indicator for global warming effects. Since such impact needs to be proven, enlarging the investigation is limited by variations in scale and lack of knowledge of local contamination backgrounds. Further local sources and single events make interpretation of data even more complex and might lead to misleading correlations and missing causation.

Author Contributions

M.Z.: Conceptualization, methodology, writing—original draft preparation. V.S.: Formal analysis, method optimization; validation. H.F.: Sampling, visualization, data curation, writing—review and editing. All authors have read and agreed to the published version of the manuscript.

Funding

This research received no external funding.

Data Availability Statement

All data will be available on request.

Acknowledgments

We thank the national staff responsible for the water network of the four UNEP projects for collecting the samples and making them available for analysis at Örebro University.

Conflicts of Interest

The authors declare no conflict of interest. The funders had no role in the design of the study; in the collection, analyses, or interpretation of data; in the writing of the manuscript; or in the decision to publish the results.

Appendix A

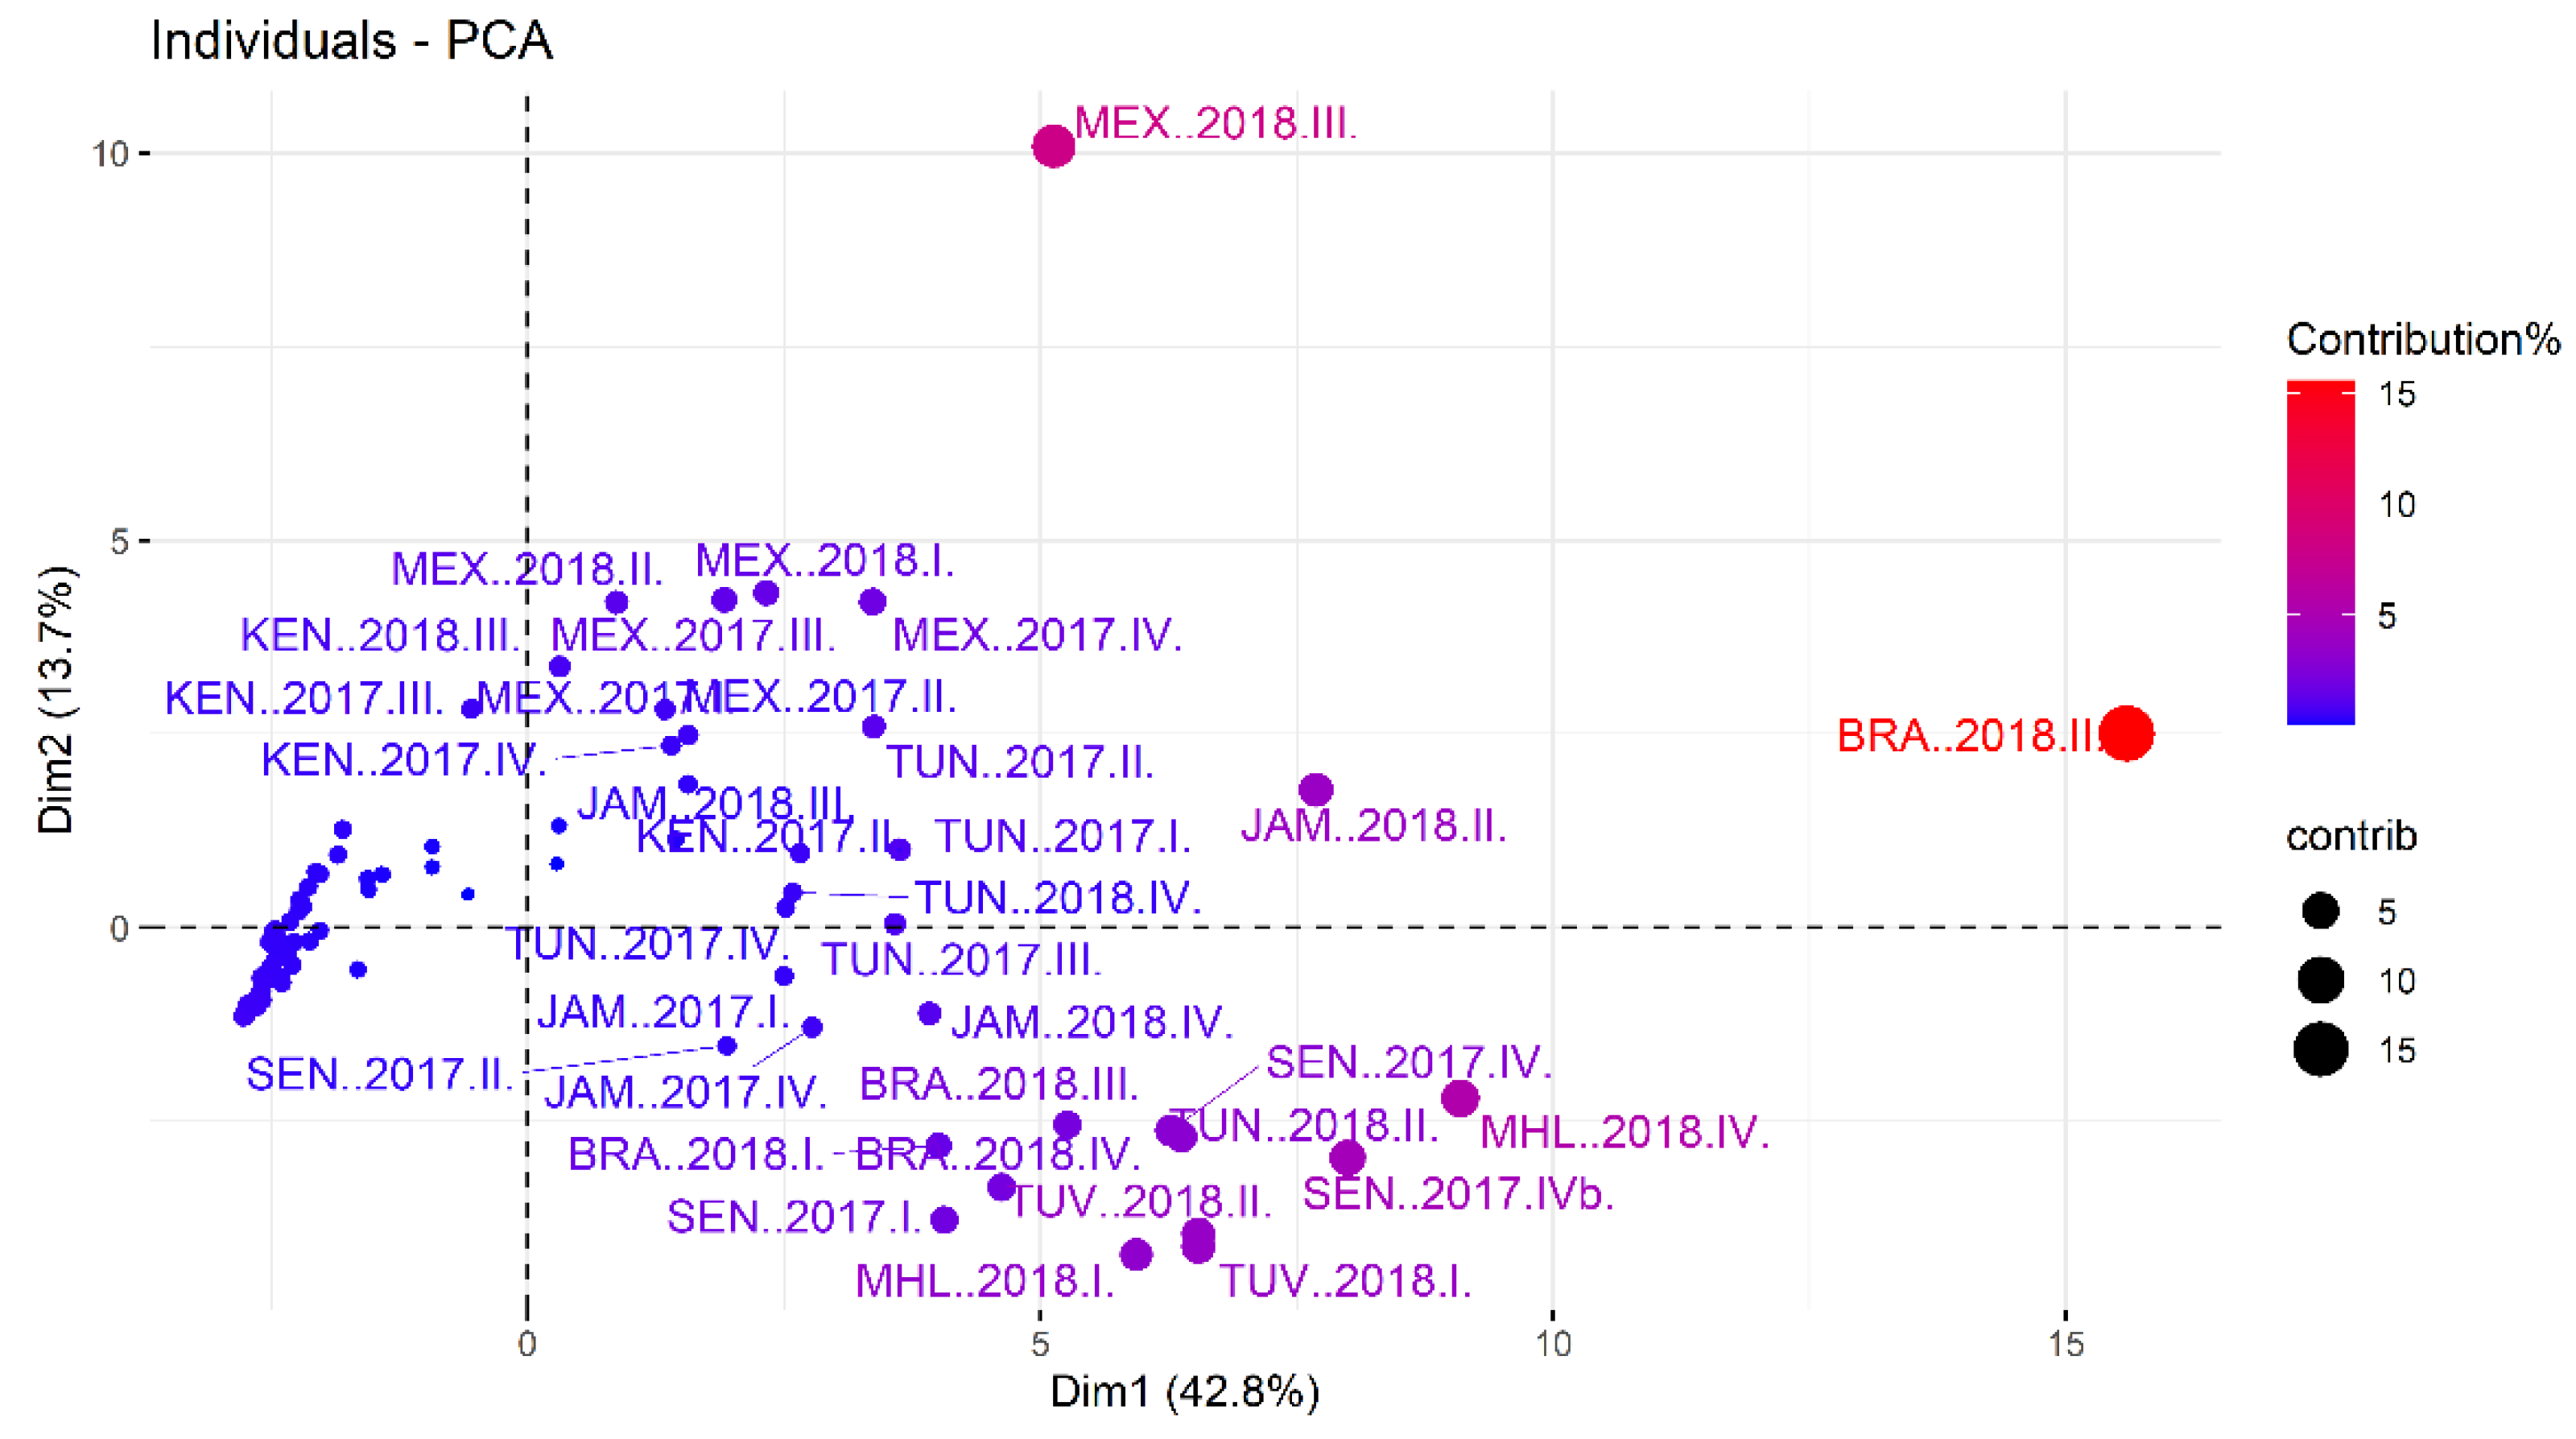
Figure A1. Location of the samples as to their contribution to the individuals in the PCA plot.
Sustainability 14 16934 g0a1
Figure A2. Heatmap with dendrogram for 29 analytes using Euclidian distances colored according to region (sample ID at right).
Sustainability 14 16934 g0a2
Figure A3. Spearman correlation between variables (all elements and three perfluorinated compounds). Moderately correlated elements Li to Zn within the red square.
Sustainability 14 16934 g0a3

References

  1. Heinze, I.; Gross, R.; Stehle, P.; Dillon, D. Assessment of lead exposure in schoolchildren from Jakarta. Environ. Health Perspect. 1998, 106, 499–501. [Google Scholar] [CrossRef]
  2. Rodriguez Martin, J.A.; De Arana, C.; Ramos-Miras, J.J.; Gil, C.; Boluda, R. Impact of 70 years urban growth associated with heavy metal pollution. Environ. Pollut. 2015, 196, 156–163. [Google Scholar] [CrossRef] [PubMed]
  3. Záray, G.; Óvári, M.; Salma, I.; Steffan, I.; Zeiner, M.; Caroli, S. Determination of platinum in urine and airborne particulate matter from Budapest and Vienna. Microchem. J. 2004, 76, 31–34. [Google Scholar] [CrossRef]
  4. Islam, M.S.; Ahmed, M.K.; Habibullah-Al-Mamun, M.; Islam, K.N.; Ibrahim, M.; Masunaga, S. Arsenic and lead in foods: A potential threat to human health in Bangladesh. Food Addit. Contam. Part A Chem. Anal. Control. Expo. Risk Assess 2014, 31, 1982–1992. [Google Scholar] [CrossRef] [PubMed]
  5. Bhuyan, M.S.; Bakar, M.A.; Akhtar, A.; Hossain, M.B.; Ali, M.M.; Islam, M.S. Heavy metal contamination in surface water and sediment of the Meghna River, Bangladesh. Environ. Nanotechnol. Monit. Manag. 2017, 8, 273–279. [Google Scholar] [CrossRef]
  6. Zaman, M.; Shahid, S.A.; Heng, L. Guideline for Salinity Assessment, Mitigation and Adaptation Using Nuclear and Related Techniques; Springer Nature: Berlin/Heidelberg, Germany, 2018. [Google Scholar]
  7. Hadzi, G.Y.; Essumang, D.K.; Adjei, J.K. Distribution and Risk Assessment of Heavy Metals in Surface Water from Pristine Environments and Major Mining Areas in Ghana. J. Health Pollut. 2015, 5, 86–99. [Google Scholar] [CrossRef] [Green Version]
  8. Hee, Y.Y.; Suratman, S.; Aziz, A.A. Water Quality and Heavy Metals Distribution in Surface Water of the Kelantan River basin of Malaysia. Orient. J. Chem. 2019, 35, 1254–1264. [Google Scholar] [CrossRef] [Green Version]
  9. Khelfaoui, M.; Benaissa, A.; Kherraf, S.; Madjram, M.S.; Bouras, I.; Mehri, k. Assessment of groundwater and surface water pollution by hazardous metals, using multivariate analysis and metal pollution index around the old Sidi Kamber mine, NE Algeria. Pollution 2022, 8, 889–903. [Google Scholar] [CrossRef]
  10. Liu, Y.; Yu, H.; Sun, Y.; Chen, J. Novel assessment method of heavy metal pollution in surface water: A case study of Yangping River in Lingbao City, China. Environ. Eng. Res. 2016, 22, 31–39. [Google Scholar] [CrossRef] [Green Version]
  11. Luo, P.; Xu, C.; Kang, S.; Huo, A.; Lyu, J.; Zhou, M.; Nover, D. Heavy metals in water and surface sediments of the Fenghe River Basin, China: Assessment and source analysis. Water Sci. Technol. 2021, 84, 3072–3090. [Google Scholar] [CrossRef]
  12. Luo, Y.; Rao, J.; Jia, Q. Heavy metal pollution and environmental risks in the water of Rongna River caused by natural AMD around Tiegelongnan copper deposit, Northern Tibet, China. PLoS ONE 2022, 17, e0266700. [Google Scholar] [CrossRef]
  13. Radeva, K.; Seymenov, K. Surface water pollution with nutrient components, trace metals and metalloidsin agricultural and mining-affected river catchments: A case study for three tributaries of the Maritsa River, Southern Bulgaria. Geogr. Pannonica 2021, 25, 214–225. [Google Scholar] [CrossRef]
  14. Rima, S.A.; Rahman, M.; Saha, S.K.; Saima, J.; Hossain, M.S.; Tanni, T.N.; Bakar, M.A.; Siddique, M.A.M. Pollution Evaluation and Health Risk Assessment of Heavy Metals in The Surface Water of A Remote Island Nijhum Dweep, Northern Bay of Benga. Environ. Nanotechnol. Monit. Manag. 2021, 18, 100706. [Google Scholar] [CrossRef]
  15. Saha, N.; Rahman, M.S. Multivariate statistical analysis of metal contamination in surface water around Dhaka export processing industrial zone, Bangladesh. Environ. Nanotechnol. Monit. Manag. 2018, 10, 206–211. [Google Scholar] [CrossRef]
  16. Shah, M.H.; Iqbal, J.; Shaheen, N.; Khan, N.; Choudhary, M.A.; Akhter, G. Assessment of background levels of trace metals in water and soil from a remote region of Himalaya. Environ. Monit. Assess. 2012, 184, 1243–1252. [Google Scholar] [CrossRef]
  17. Turhan, Ş.; Duran, C.; Kurnaz, A.; Hançerlioğulları, A.; Metin, O.; Altıkulaç, A. Impact of toxic metal pollution on surface water pollution: A case study of Tohma stream in Sivas, Turkey. Int. J. Environ. Anal. Chem. 2021, 1–11. [Google Scholar] [CrossRef]
  18. Qu, L.; Huang, H.; Xia, F.; Liu, Y.; Dahlgren, R.A.; Zhang, M.; Mei, K. Risk analysis of heavy metal concentration in surface waters across the rural-urban interface of the Wen-Rui Tang River, China. Environ. Pollut. 2018, 237, 639–649. [Google Scholar] [CrossRef] [Green Version]
  19. Withanachchi, S.S.; Ghambashidze, G.; Kunchulia, I.; Urushadze, T.; Ploeger, A. Water quality in surface water: A preliminary assessment of heavy metal contamination of the Mashavera River, Georgia. Int. J. Environ. Res. Public Health 2018, 15, 621. [Google Scholar] [CrossRef] [Green Version]
  20. Pan, H.; Zhou, G.; Yang, R.; Cheng, Z.; Sun, B. Heavy Metals and As in Ground Water, Surface Water, and Sediments of Dexing Giant Cu-Polymetallic Ore Cluster, East China. Water 2022, 14, 352. [Google Scholar] [CrossRef]
  21. ISO 3166; Country Codes. ISO: Geneva, Switzerland, 2022.
  22. United Nations (UN). Regional Groups of Member States. UN, Department for General Assembly and Conference Management. Available online: https://www.un.org/dgacm/en/content/regional-groups (accessed on 24 October 2022).
  23. Roșca, O.M.; Dippong, T.; Marian, M.; Mihali, C.; Mihalescu, L.; Hoaghia, M.-A.; Jelea, M. Impact of anthropogenic activities on water quality parameters of glacial lakes from Rodnei mountains, Romania. Environ. Res. 2020, 182, 109136. [Google Scholar] [CrossRef]
  24. GB 3838-2002; China (MEE). Environmental Quality Standards for Surface Water. MEE: Beijing, China, 2002.
  25. Al Obaidy, A.; Al Mashhady, A.A.; Awad, E.S.; Kadhem, A.J. Heavy metals pollution in surface water of Mahrut River, Diyala, Iraq. Int. J. Adv. Res. 2014, 2, 1039–1044. [Google Scholar]
  26. Mohanakavitha, T.; Divahar, R.; Meenambal, T.; Shankar, K.; Rawat, V.S.; Haile, T.D.; Gadafa, C. Dataset on the assessment of water quality of surface water in Kalingarayan Canal for heavy metal pollution, Tamil Nadu. Data Brief 2019, 22, 878–884. [Google Scholar] [CrossRef] [PubMed]
  27. Baabish, A.; Sobhanei, S.; Fiedler, H. Priority perfluoroalkyl substances in surface waters—A snapshot survey from 22 developing countries. Chemosphere 2021, 273, 129612. [Google Scholar] [CrossRef] [PubMed]
  28. Fiedler, H.; Sadia, M.; Baabish, A.; Sobhanei, S. Perfluoroalkane substances in national samples from global monitoring plan projects (2017–2019). Chemosphere 2022, 307, 136038. [Google Scholar] [CrossRef]
  29. Schlesinger, W.H.; Klein, E.M.; Vengosh, A. Global biogeochemical cycle of vanadium. Proc. Natl. Acad. Sci. USA 2017, 114, E11092–E11100. [Google Scholar] [CrossRef] [Green Version]
  30. Viers, J.; Dupré, B.; Gaillardet, J. Chemical composition of suspended sediments in World Rivers: New insights from a new database. Sci. Total Environ. 2009, 407, 853–868. [Google Scholar] [CrossRef]
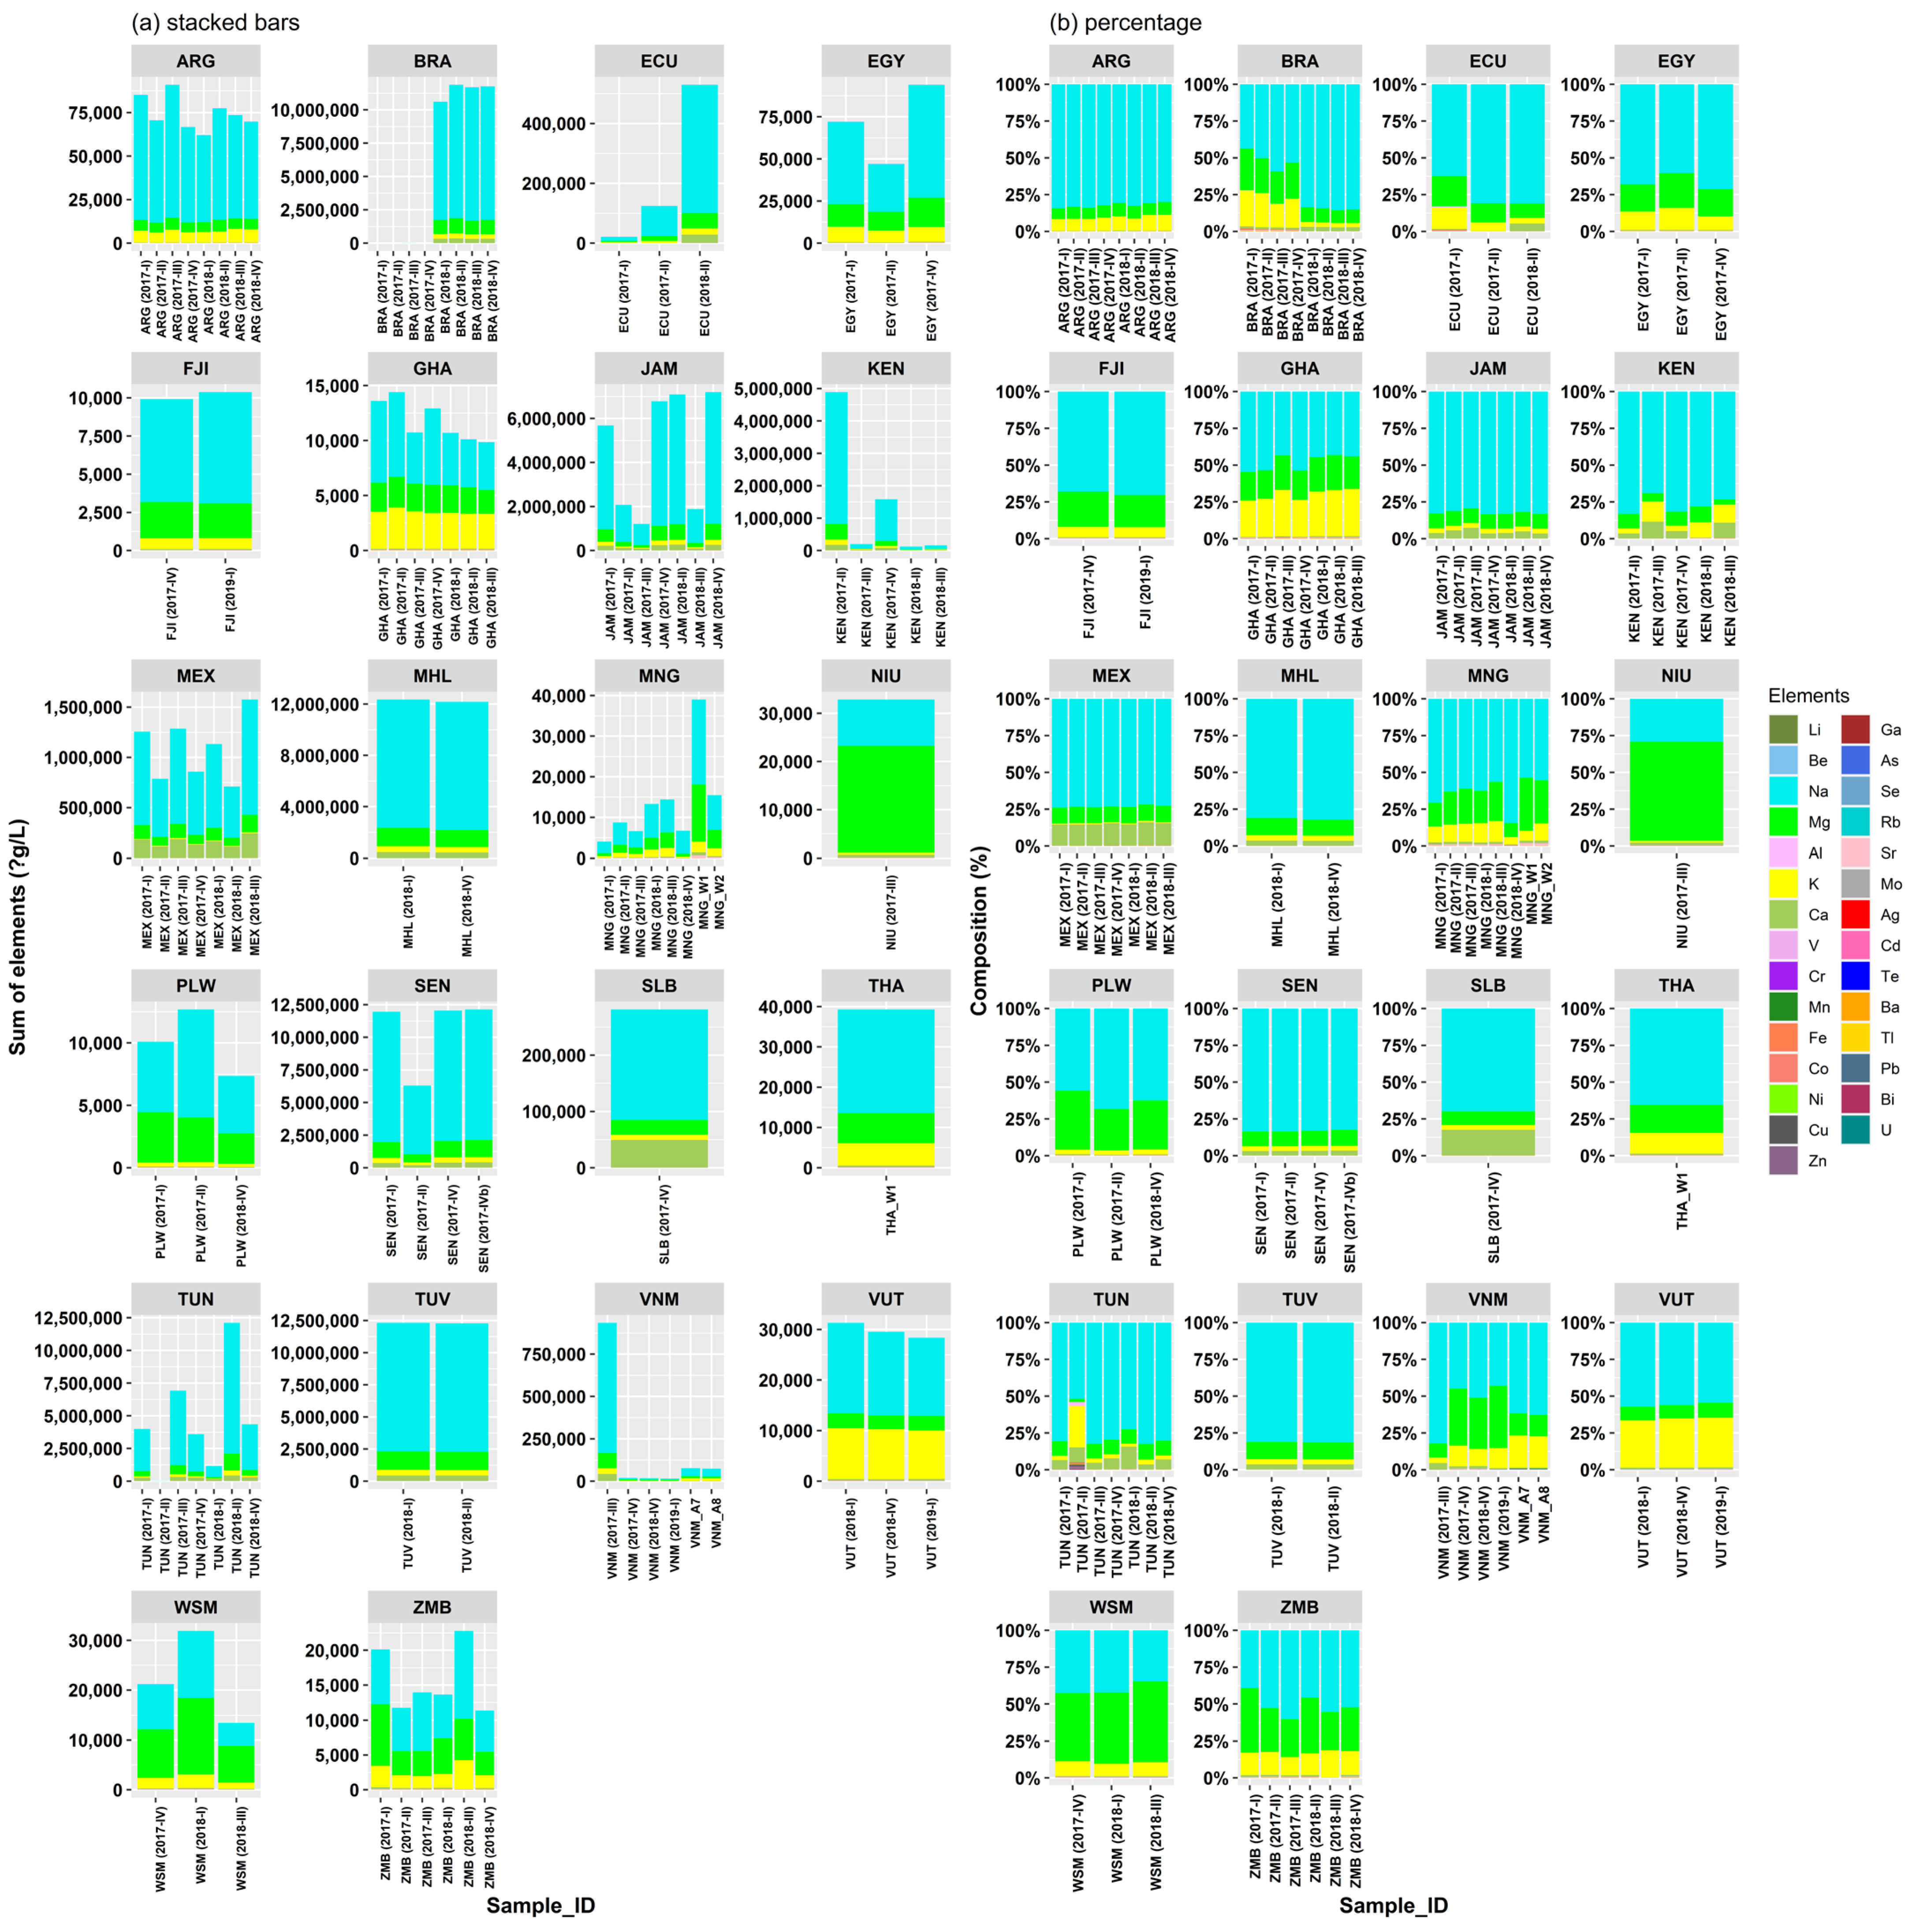
Figure 1. Sum of all elemental concentrations (left side—(a)) and percentage of elements found per sample (right side—(b)).
Sustainability 14 16934 g001
Figure 2. Box whisker plots by region (log10 scale on y-axis). The whiskers represent the minimum and maximum concentrations without the outliers. The lower border of the box represents the first quartile (25%), the line inside the box the median and the upper border is the third quartile (75%). The dots outside the whiskers are outliers, which were defined as all concentrations greater or smaller the interquartile range multiplied by 1.5.
Sustainability 14 16934 g002
Figure 3. Box whisker plots by country. The whiskers represent the minimum and maximum concentrations without the outliers. The lower border of the box represents the first quartile (25%), the line inside the box the median and the upper border is the third quartile (75%). The dots outside the whiskers are outliers, which were defined as all concentrations greater or smaller the interquartile range multiplied by 1.5.
Sustainability 14 16934 g003
Figure 4. PCA biplot for country-based analysis.
Sustainability 14 16934 g004
Figure 5. Box whisker plots by water type (log10 scale on y-axis).
Sustainability 14 16934 g005
Figure 6. PCA biplot for water type-based analysis.
Sustainability 14 16934 g006
Figure 7. Spearman correlation between all quantified elements. Moderately correlated elements Li to Zn within the red square.
Sustainability 14 16934 g007
Table 1. Overview of samples according to geography and type (number and percentage).
UN Region/Country (ISO3)Water Type River (n = 67)Water Type Salt (n = 31)Subtotal
(n = 98)
Africa28 (41.8%)4 (12.9%)32 (32.7%)
Egypt (EGY)3 (4.5%) 3 (3.1%)
Ghana (GHA)7 (10.4%) 7 (7.1%)
Kenya (KEN)5 (7.5%) 5 (5.1%)
Senegal (SEN) 4 (12.9%)4 (4.1%)
Tunisia (TUN)7 (10.4%) 7 (7.1%)
Zambia (ZMB)6 (9.0%) 6 (6.1%)
Asia14 (20.9%) 14 (14.3%)
Mongolia (MNG)8 (11.9%) 8 (8.2%)
Thailand (THA)1 (1.5%) 1 (1.0%)
Vietnam (VNM)6 (9.0%) 6 (6.1%)
PAC10 (14.9%)9 (29.0%)19 (19.4%)
Fiji (FJI)2 (3.0%) 2 (2.0%)
Marshall Islands (MHL) 2 (6.5%)2 (2.0%)
Niue (NIU) 1 (3.2%)1 (1.0%)
Palau (PLW)3 (4.5%) 3 (3.1%)
Solomon Islands (SLB) 1 (3.2%)1 (1.0%)
Tuvalu (TUV) 2 (6.5%)2 (2.0%)
Vanuatu (VUT) 3 (9.7%)3 (3.1%)
Samoa (WSM)4 (6.0%) 4 (4.1%)
GRULAC15 (22.4%)18 (58.1%)33 (33.7%)
Argentina (ARG)8 (11.9%) 8 (8.2%)
Brazil (BRA)4 (6.0%)4 (12.9%)8 (8.2%)
Ecuador (ECU)3 (4.5%) 3 (3.1%)
Jamaica (JAM) 7 (22.6%)7 (7.1%)
Mexico (MEX) 7 (22.6%)7 (7.1%)
Grand total67 (68.4%)31 (31.6%)98 (100%)
Publisher’s Note: MDPI stays neutral with regard to jurisdictional claims in published maps and institutional affiliations.