Article

Hydrological Response of Tropical Catchments to Climate Change as Modeled by the GR2M Model: A Case Study in Costa Rica

by
Maikel Mendez
1,*,
Luis-Alexander Calvo-Valverde
2,
Pablo Imbach
3,
Ben Maathuis
4,
David Hein-Grigg
5,
Jorge-Andrés Hidalgo-Madriz
6 and
Luis-Fernando Alvarado-Gamboa
7
1
Escuela de Ingeniería en Construcción, Instituto Tecnológico de Costa Rica, Cartago 30101, Costa Rica
2
Escuela de Ingeniería en Computación, Instituto Tecnológico de Costa Rica, Cartago 30101, Costa Rica
3
Tropical Agricultural Research and Higher Education Center, Turrialba 30501, Costa Rica
4
Department of Water Resources, Faculty of Geo-Information Science and Earth Observation (ITC), University of Twente, Hengelosestraat 99, 7514 AE Enschede, The Netherlands
5
Department of Geography, University of Exeter, Exeter EX4 4PS, UK
6
Gerencia Ambiental, Investigación y Desarrollo, Instituto Costarricense de Acueductos y Alcantarillados, San José 10109, Costa Rica
7
Unidad de Climatología, Departamento de Desarrollo, Instituto Meteorológico Nacional (IMN), Ministerio del Ambiente y Energía (MINAE), San José 10109, Costa Rica
*
Author to whom correspondence should be addressed.
Sustainability 2022, 14(24), 16938; https://doi.org/10.3390/su142416938
Submission received: 9 November 2022 / Revised: 7 December 2022 / Accepted: 8 December 2022 / Published: 16 December 2022
(This article belongs to the Section Air, Climate Change and Sustainability)

Abstract

:
This study aimed to assess the impacts of climate change on streamflow characteristics of five tropical catchments located in Costa Rica. An ensemble of five General Circulation Models (GCMs), namely HadGEM2-ES, CanESM2, EC-EARTH, MIROC5, MPI-ESM-LR dynamically downscaled by two Regional Climate Models (RCMs), specifically HadRM3P and RCA4, was selected to provide an overview of the impacts of different climate change scenarios under Representative Concentration Pathways (RCPs) 2.6, 4.5 and 8.5 using the 1961–1990 baseline period. The GR2M hydrological model was used to reproduce the historical monthly surface runoff patterns of each catchment. Following calibration and validation of the GRM2 model, the projected impact of climate change on streamflow was simulated for a near-future (2011–2040), mid-future (2041–2070) and far-future (2071–2100) for each catchment using the bias-corrected GCM-RCM multimodel ensemble-mean (MEM). Results anticipate wetter conditions for all catchments in the near-future and mid-future periods under RCPs 2.6 and 4.5, whereas dryer conditions are expected for the far-future period under RCP 8.5. Projected temperature trends indicate consistently warmer conditions with increasing radiative forcing and future periods. Streamflow changes across all catchments however are dominated by variations in projected precipitation. Wetter conditions for the near-future and mid-future horizons under RCPs 2.6 and 4.5 would result in higher runoff volumes, particularly during the late wet season (LWS). Conversely, dryer conditions for the far-future period under RCP8.5 would result in considerably lower runoff volumes during the early wet season (EWS) and the Mid-Summer Drought (MSD). In consequence, projected seasonal changes on streamflow across all catchments may result in more frequent flooding, droughts, and water supply shortage compared to historical hydrological regimes.

1. Introduction

Anthropogenic climate change affects the energy and mass balance of fundamental hydrological processes [1]. The water cycle is expected to be intensified and hydrological patterns are very likely to be different under different climate scenarios [2].
Climate change represents an additional factor to existing water management challenges, contributing to an increased vulnerability of water supply systems [3]. A common approach to assessing the potential impacts of climate change on hydrological systems is to drive hydrological models with climate projections derived through forcing General Circulation Models (GCMs) and Regional Climate Models (RCMs) with various greenhouse gas emissions scenarios [4,5].
General Circulation Models (GCMs) are one of the most powerful tools for building future climate change projections [6]. However, information coming from GCMs exhibits a relatively low spatial resolution (100–300 km), which in many cases is too coarse for impact assessment studies at local levels, particularly over complex terrain [7]. Consequently, a subsequent downscaling step, often through the application of higher resolution Regional Climate Models (RCMs) over limited areas becomes necessary [8]. RCMs use large scale atmospheric conditions as determined by GCMs for the lateral boundary conditions. Higher resolution topography and land-sea distribution are incorporated to generate more realistic climate information at a much finer spatial resolution (10–50 km) [9]. Climate models output are nevertheless stacked with uncertainties that arise due to systematic, random and parameterization biases relative to long-term historical observed datasets [10]. Large uncertainties in GCM-RCM projections introduce important biases in precipitation and other climatic variables, making the direct use of such outputs unreliable in impact assessment studies [11,12,13]. Moreover, GCM-RCM projections frequently show better performance in regions with temperate climate conditions when compared to tropical regions, whose precipitation is largely convective in nature and insufficiently represented by climate models [14,15]. Therefore, the application of appropriate bias correction (BC) methods to GCM-RCM simulations becomes necessary to better match observed variances and distributions [16]. Bias correction involves the adjustment of biased simulated data to observations [17,18]. There are various BC methods that have been put into practice, ranging from relatively simple perturbation approaches such as the delta-change method to more sophisticated distribution mapping [19,20,21,22]. Although BC methods in general can significantly improve performance of simulations, assumptions of stationarity in future scenarios will still remain a cause for uncertainty in impact assessment studies and their applications [23].
The spatio-temporal patterns that characterize the hydrological response of a watershed may be altered due to climate change. Hydrological models have become standard tools to address many practical questions in water resources management including flood prediction and design, drought assessment, water quantity and quality assessment and hydrological responses under climate change scenarios [24]. Hydrological models are simplified descriptions of real-world hydrological systems intended to produce plausible hydrological simulations from input variables regardless of the climatic characteristics of the simulation period [25]. Thus, hydrological models are expected to be transferable to periods with climatic conditions that are not encountered during the calibration-validation phases [26]. Hydrological models can broadly be classified into physically-based and conceptual approaches. The former, uses a mathematical framework based on mass, momentum and energy conservation equations in a spatially distributed model domain, where parameter values are directly related to catchment characteristics at the cell level [27]. Physically-based models suffer from drawbacks due to the complexity of the rainfall-runoff transformation process, which includes substantial data requirements, large computational demands, over-parameterization and parameter redundancy [28]. Conceptual models in contrast, approximate the general physical mechanisms governing hydrological processes through simplified equations, where input variables and parameters are aggregated into semi-distributed or lumped homogenous entities. Conceptual hydrological models are widely used in the assessment of water resources based on the application of water budget simulations [29]. These models approximate the general physical mechanisms governing hydrological processes through simplified equations and most commonly consider the catchment as an undivided entity, using spatially and temporally lumped values of input variables and parameters [30].
The conceptual structure of these models is based on the interaction of various storage compartments, approximating the various physical processes through mathematical functions to describe fluxes between compartments, which make them less demanding of inputs [31]. Furthermore, conceptual models are generally less time consuming, their data and definition requirements are significantly lower and frequently exhibit better performance compared to physically-based models, thus achieving higher efficiencies in calibration and validation processes [32].
Conceptual hydrological models are intended to be parsimonious, meaning that their mathematical structures are defined by fewer parameters when compared to physically-based models [33]. The concept of parsimony is desirable as long as it does not impair the ability of the model to properly simulate flow dynamics [34]. Nonetheless, as parameters of conceptual hydrological models commonly have no direct physical meaning, they must be estimated through inverse calibration using time series of observed historical data [35]. The equifinality dilemma, a situation where different sets of optimum parameters may yield equivalent model outputs, is considerably less significant in conceptual hydrological models due to their reduced dimensionality [36]. This ultimately improves parameter identifiability during the calibration process and therefore makes it solvable by existing optimization algorithms [37]. In consequence, the selection of the proper optimization algorithm in the calibration of hydrological models is equally important, mainly due to the associated computational costs [38].
A wide range of conceptual hydrological models have been used to obtain detailed assessments of water balance components in river catchments including surface runoff, groundwater flows and parameter transferability under contrasting climate change scenarios including: AWBM, ABCD, SIMHYD, HBV, Témez and GR2M [39,40,41,42,43,44].
The GR2M hydrological model [45] has been widely adopted due to its high parsimony. Its semi-empirical approach has demonstrated to perform adequately when compared to similar monthly-based hydrological models [46,47]. Sensitivity analyses have determined that GR2M is sensitive to errors in precipitation data but comparatively robust to random errors in potential evapotranspiration data demonstrated that the GR2M model parameters are robust to non-stationary precipitation series and that the optimized parameter values are highly correlated with land use [48,49]. The GR2M has extensively been used to study the impact of climate change on water resource availability as well [50,51,52]. However, the performance of any conceptual hydrological model under changing climatic conditions could significantly vary depending on the region they are applied [53,54].
The Central America region, for example, has been identified as the main emerging tropical “hot-spot” due to expected reductions in total precipitation and an increase in its variability by the end of the 21st century due to climate change [55,56,57,58,59]. Historical trends from observations already show a significant increase in temperatures and intensity of precipitation events [60,61]. Mean annual precipitation and precipitation variability in Central America are particularly sensitive to global climate change [62]. Precipitation during the rainy season is projected to decrease throughout most of the region, whereas precipitation during the dry season is projected to decrease in the areas where orographic precipitation dominates [63]. Furthermore, intensification of the mid-summer drought, a relative minimum between two rainfall maxima, shows high agreement across models under future scenarios [64]. However, future precipitation trends over southern parts of Central America, including Costa Rica, show less agreement across climate models and warming levels highlighting the need to assess climate change impacts [65].
Costa Rica, located in the Central American region is particularly vulnerable to climate change due to its strong dependence on the availability and distribution of water resources for crucial issues such as hydropower generation, agriculture, drinking water supply and biodiversity [66,67,68]. Moreover, Costa Rica has reported the greatest number of both intensive and extensive risks in Central America [69]. Thus, predicting future water resources in Costa Rica under diverse scenarios is essential to accurately evaluate and rapidly adapt to climate change extremes and its consequences. The objective of this study is to assess future changes on the streamflow characteristics of five tropical catchments located in the Pacific region of Costa Rica, using a GCM-RCM multimodel ensemble to force a conceptual hydrological model under multiple climate change scenarios. For this study, the GR2M model was selected based on its low data requirements, simplified structure, high performance and low computational cost. This will allow local authorities to make informed and rational decisions to overcome water challenges and plan water resources management at a catchment scale in the context of climate change.
In the following sections, first, the research methodology; then the study area is described; later, the datasets and relevant methods are presented; the hydrological model is introduced and finally, the historical and future results associated with multiple climate change scenarios are discussed.

2. Materials and Methods

2.1. Research Methodology

In this study, the research methodology (Figure 1) consisted of four main steps: (1) selection of reference catchments including spatial data processing, observational and hydrological datasets (2) selection of climate change datasets including bias correction; (3) parameter optimization and performance assessment of the GR2M hydrological model and (4) assessment of future hydrological response per catchment. Details on the methodology applied are described further below.

2.2. Research Methodology

Costa Rica is located along the southern Central American isthmus occupying an area of approximately 51,000 km2. It is bordered by the Caribbean Sea to the east and the Pacific Ocean to the west (Figure 2a). The country is divided from north-west to south-east by cordilleras of high complexity which rise above 3820 masl (Figure 2b), promoting oceanic climatological influences from both oceans [70].
Orientation of the major cordilleras in addition to elevation, are the most important modifiers of local precipitation patterns, featuring a wide range of local and regional climates [71]. The country possesses a bimodal distribution of precipitation with two pronounced peaks, the early wet season (EWS) (May–June) and the late wet season (LWS) (September–October), which coincides with convergence of seasonal latitudinal migration of the Intertropical Convergence Zone (ITCZ) and trade winds. This results in extended low-pressure zones, which coupled with constant solar radiation throughout the year, causes humid air to rise in the area, triggering thunderstorms and precipitation along the Caribbean and Pacific coastlines [72]. The relative minimum in July–August during the Mid-Summer Drought (MSD), considered one of the most important regional climate variability mechanisms in the region [73]. In addition, the spatial and temporaldistribution of precipitation in Costa Rica also depends on factors such as El Niño-Southern Oscillation (ENSO), the Mid-Summer Drought (MSD) the Caribbean Low-Level Jet (CLLJ), northeast trade winds, cold fronts, and tropical cyclones [74,75,76]. To assess the potential effects of climate change on surface runoff in Costa Rica, five reference catchments across the Pacific watershed namely Tempisque, Morote, Bebedero, Barrancas and Chirripó Pacífico were selected based on their different climatic and geographical characteristics (Figure 2b). The catchments exhibit strong altitudinal gradients ranging from slightly above sea level to as high as 3820 masl, with distinct differences in topography having roughly similar mean slopes steepness of around 30% and catchment areas ranging from 130 to 929 km2 (Table 1).
Mean temperatures range from 17 °C to 27 °C depending on changes in elevation within each catchment, with generally positive gradients towards the Northwest Pacific. The catchments were also selected based on their significance to the country in terms of water supply, agriculture, power generation and forestry, as well as data availability in terms of long-term series of flow measurements. For the reference catchments, the highest mean annual precipitation occurs in the Chirripó Pacífico catchment (Southern Pacific) with 3376 mm/year and the lowest in the Tempisque catchment (Northwest Pacific) with 1991 mm/year (Table 1). Mean annual potential evaporation on the other hand, varies from 1162 mm/year to 1090 mm/year for these two catchments respectively. Contrastingly, the mean annual cycle of temperature in the region is described as a monsoon type, with the highest temperatures just before the beginning of the rainy season and a minimum in December-January mainly associated to strong trade winds. The March-April temperature maximum is mostly associated with a decrease in the magnitude of the trade winds and low values in cloud cover and therefore radiation incidence [77].

2.3. Observational and Hydrological Datasets

Gridded monthly precipitation and temperature time series available for Costa Rica for the 1961–1990 baseline were used for continuous simulation of climate change and hydrological modeling. The high resolution 1 × 1 km gridded datasets were developed using deterministic and geostatistical interpolation methods from more than 416 rain-gauge stations spread over Costa Rica provided by the Instituto Meteorológico Nacional (IMN) [78,79]. Potential evapotranspiration (PET) values for each catchment were estimated using the Priestley-Taylor (PT) equation based on the work of Rojas (1985) [80]. All catchments were delineated using topographic information derived from the ALOS World 3D-30m (AW3D30) Digital Elevation Model (DEM) resampled to a 1 × 1 km spatial resolution using the bilinear resampling method [81]. Available Streamflow daily data within the baseline period and used in calibration/validation were collected bythe Instituto Costarricense de Electricidad (ICE) and Instituto Costarricense de Acueductos y Alcantarillados (AyA) and subsequentially aggregated to a monthly scale. Some missing values in the observed streamflow time series for the Tempisque and Chirripó Pacífico catchments were identified and isolated. These data gaps were excluded from the calibration-validation processes and therefore do not affect the performance of the selected metrics.

2.4. Climate Change Datasets

Gridded Monthly precipitation and temperature gridded series from four General Circulation Models (EC-EARTH, HadGEM2-ES, MPI-ESM-LR and MIROC5), dynamically downscaled by the RCA4 Regional Climate Model [82] available in the context of the Coordinated Regional Climate Downscaling Experiment (CORDEX) over the Central America domain (CA) were used in this study. CORDEX-CA data [83] cover the period 1950–2100 and have a 0.44° × 0.44° (~50 km) spatial resolution (Table 2). In addition, monthly precipitation and temperature totals from the HadGEM2-ES General Circulation Model were dynamically downscaled over the Central America domain using the Met Office Hadley Centre Regional Climate Model PRECIS (HadRM3P) [84] executed at a 0.22° × 0.22° (~25 km) spatial resolution over the Central America domain (CA) covering the period 1950–2100. Three AR5 emission scenarios, RCPs 2.6, 4.5 and 8.5 were selected to explore the range of possible climate change impacts over the coming century [85].

2.5. Bias Correction of Climate Change Datasets

Based on a previous analysis of eight different bias correction-methods over the entire Costa Rican territory [68], the delta-change method was applied to correct GCM-RCM outputs and correlate them with the observational datasets on a monthly temporal resolution. The delta-change method generates climate scenarios by adding the future change signal (anomalies) from GCM-RCM simulations for a perturbation of the observational datasets rather than using the GCM-RCM outputs directly [86]. In the delta-change method, observational time series are used as baseline, which makes it a robust method capable of correcting the mean values. Nonetheless, standard deviation (variance), wet frequencies and intensities are not corrected [87]. The delta-change method has been extensively applied in the evaluation of climate change impacts as it does not rely on any stationarity hypothesis [88]. For future forecast scenarios, the GCM-RCM-simulated anomalies between control and scenario runs are superimposed upon the observational time series, which is done on a monthly basis using a multiplicative correction for precipitation according to:
P contr BC t = P obs t
P frc BC t = P obs t μ m P frc t μ m P contr t
where P is precipitation, contr is GCM-RCM simulated time series during the control period, obs is the observational time series during the control period, frc is the future forecast time series to be corrected, BC is the final bias-corrected time series, t is the time step and µm is the long-term monthly mean.
In the case of temperature, an additional factor is used according to:
T contr BC t = T obs t
T frc BC t = T obs t + μ m T frc t μ m T contr t
where T is temperature.
The delta-change method was applied to correct the biases of precipitation and temperature projections from each GCM-RCM pair. Bias correction parameters were generated and applied separately for each month of the year for each of the GCM-RCMs using the 30-year control period 1961–1990. As demonstrated by Mendez et al., (2009) [68], only marginal differences were found between the delta-method and more complex bias correction-methods, including various quintile mapping techniques. Therefore, the delta-method method was selected based on lower computational cost.

2.6. The GR2M Hydrological Model

The spatially-lumped conceptual rainfall-runoff GR2M model was used in this study for hydrological modeling purposes of all reference catchments. The GR2M model uses monthly time-step precipitation P and potential evapotranspiration (PET) as input and produces actual evapotranspiration E and total runoff Q based on exchanges from a two-reservoir structure, featuring an upper-production soil moisture store S and a lower-routing groundwater storage G (Figure 3). Soil moisture storage is calculated based on the soil moisture accounting principles; where available moisture S1 is initially increased due to precipitation P from the actual soil water S according to a non-linear function Equation (5).
S 1 , i = f 1 S i 1 , P i , X 1
Reservoir S has a maximum capacity of soil storage controlled by parameter X1, which is positive and given in mm. Soil moisture store S is then decreased due to actual evapotranspiration E using a similar nonlinear function and becoming S2 Equation (6).
S 2 , i = f 2 S i , 1 , PET i , X 1
Excess precipitation is given by P1 Equation (7).
P 1 , i = P i + S i 1 S 1 , i
Release from soil moisture storage is given by percolation P2 Equation (8).
P 2 , i = S 2 , i S i
where Si is the updated value of soil moisture storage by another non-linear function Equation (9).
S i = f 3 S 2 , i , X 1
The net precipitation entering the lower routing storage P3 is given as the sum of P1 and P2 Equation (10).
P 3 , 1 = P 1 , i + P 2 , i
The level in the lower routing storage G then increases to G1 Equation (11).
G 1 , i = G i 1 + P 3 , i
Available water in the routing storage G2 is then calculated using a linear reservoir approach controlled by water exchange parameter X2, which dictates the proportion of runoff that is released from groundwater storage Equation (12).
G 2 , 1 = X 2 × G 1 , i
Parameter X2 is positive and has no dimension. The maximum storage of the lower reservoir is fixed at 60 mm by default [45].
Total runoff Q is then obtained as a rational function of G2 Equation (13).
Q i = G 2 , i 2 G 2 , i + 60
Groundwater storage for the next month is then updated Equation (14).
G i = G 2 , i Q i
The GR2M hydrological model has been widely adopted due to its high parsimony. Its semi-empirical approach has demonstrated to perform adequately when compared to similar monthly-based hydrological models [46,47].

2.7. Parameter Optimization and Performance Assessment

The GR2M hydrological model as implemented through the R programming language package airGR (v 1.4.3.65) developed by IRSTEA (Institut national de recherche en sciences et technologies pour l’environnement et l’agriculture) [89] was used in the present work. The Michel optimization algorithm [90] was used to optimize X1 and X2 model parameter values (Figure 3) based on available monthly streamflow observed data at each catchment (Table 1). Two different steps are executed during the optimization procedure: (1) a systematic inspection of the parameter space is performed to determine the most likely zone of convergence. This is done either by direct grid screening or by constrained sampling based on empirical parameter databases and (2) a steepest descent local search procedure is carried out to find an estimate of the optimum parameter set. The split sample test (SST) for stationary climatic conditions [91] was adopted for calibration and validation by dividing the observational dataset into two non-overlapping periods of approximately equal length (Table 1), with a 1-year lag at the beginning of the calibration period for warming-up purposes [92]. Parameter optimization was executed to maximize the Nash and Sutcliffe efficiency criteria (NSE). Initial parameter ranges were defined according to Perrin et al., (2007) [93]. The GR2M model performance was also assessed in terms of three additional metrics namely; the Kling-Gupta efficiency (KGE) criteria [94], the percentage bias (PBIAS) and the Pearson correlation coefficient (R) according:
NSE = 100 1 i = 1 n Q i obs Q i sim 2 i = 1 n Q i obs Q m 2
PBIAS = 100 i = 1 n Q i obs Q i sim i = 1 n Q i obs
R = i = 1 n Q i obs Q i sim 1 n i = 1 n Q i obs i = 1 n Q i sim   i = 1 n Q i obs 1 n i = 1 n Q i obs 2 0.5 i = 1 n Q i sim 1 n i = 1 n Q i sim 2 0.5
where i is the timestep, n is the total number of time-steps, Q is the runoff and subscripts obs and sim refer to observed and simulated correspondingly.
The KGE is defined as:
KGE = 1 r 1 2 + σ sim σ obs 1 2 + μ sim μ obs 1 2 0.5
where r, σ and μ are the Pearson correlation coefficient, standard deviation and the mean of the observed and simulated flows.
The NSE is a normalized statistic that determines the relative magnitude of the residual variance compared to the observed data variance, so it is related to the model capacity to simulate the general shape of the hydrograph. The NSE assigns more weight to high flows (simulated runoff and observed runoff expressed as Qsim and Qobs, respectively). Perfect agreement between the observed and simulated discharge yields a NSE efficiency of 1. The NSE is the most commonly used metric for reflecting the overall fit of a hydrograph, which provides extensive information on reported values. The KGE is a weighted combination of the three components appearing in the NSE formulation that improves flow variability estimates, given that in watersheds with high discharge variability the bias component will have a smaller contribution to the optimization of the NSE objective function possibly leading to model simulations having large volume errors [54]. The PBIAS is defined as the balance between the accumulated simulated discharge (Qsim) and the accumulated observed discharge (Qobs) over an evaluation period of n-months. The PBIAS is commonly used to quantify water balance errors, where a negative value indicates underestimation whereas a positive value indicates overestimation. In general, PBIAS values tend to vary more, among different optimization methods, during dry years than during wet years [95]. The Pearson correlation coefficient (R) measures the correlation between simulated and observed discharges. It could be considered a measure of potential skill and linear dependence between the two variables, with the best value equal to 1 and the worst value equal to 0 [96]. Based on Moriasi et al., 2007 [96], for the purpose of this study, GR2M model outputs are considered “very good” when NSE, KGE and R values range from 0.75 to 1.00 and PBIAS ± 10%; “good” when NSE, KGE and R values range from 0.65 to 0.75 and PBIAS range from ±10% to ±15% and “satisfactory” when NSE, KGE and R values range from 0.50 to 0.65 and PBIAS range from ±15% to ±25% over both calibration and validation periods.

2.8. Future Climate Change Scenarios

Once calibrated and validated, the GR2M hydrological model was used to assess the impacts of precipitation and temperature changes on water resources availability for the five catchments based on future climate change scenarios (Figure 1). As implemented in similar studies [15,16,97,98], after the application of the delta-change method on GCM-RCMs outputs, a multimodel ensemble-mean (MEM) was calculated based on the total number of available members (Table 2). Future projections were assessed in three 30-year time periods: near-future (2011–2040), mid-future (2041–2070) and far-future (2071–2100) using the 30-year control period 1961–1990 [99]. For future projections, the monthly averaged precipitation anomalies between the mean values of the observed control period (1961–1990) and the bias-corrected multimodel ensemble-mean (MEM) were calculated and expressed as percentage-change (PC). In the case of temperature, changes were expressed as absolute anomalies in Celsius (°C). These future bias corrected scenarios were used as inputs for the GR2M model to simulate the future runoff. To simulate future runoff, the precipitation/runoff relationship established from observational time-series and obtained from calibration/validation was assumed to be stable regardless of land use changes. As suggested by Ardoin-Bardin (2009) [50], this was done to investigate future impacts concerning changes in climate variables while keeping all other factors constant. The R programming language package hyfo (v1.4.3) was used to execute bias correction independently for each 25 × 25 km grid cell within the selected catchments. Spatial data processing, which includes interpolation, resampling, re-projecting, raster manipulation, dating and masking was performed using the R programming language [100] by combining capabilities of the gstat (v2.0.9), sp (v1.5.0), raster (v3.5.21), ncdf4 (v1.19.0) rgdal (v1.5.32) and rgeos (v0.5.9) packages. The official Costa-Rica Transverse-Mercator (CRTM05) spatial reference system (Figure 1) was used to reproject from WGS84 resulting in raster products with a 25 km cell size.

3. Results and Discussion

3.1. GR2M Performance Evaluation

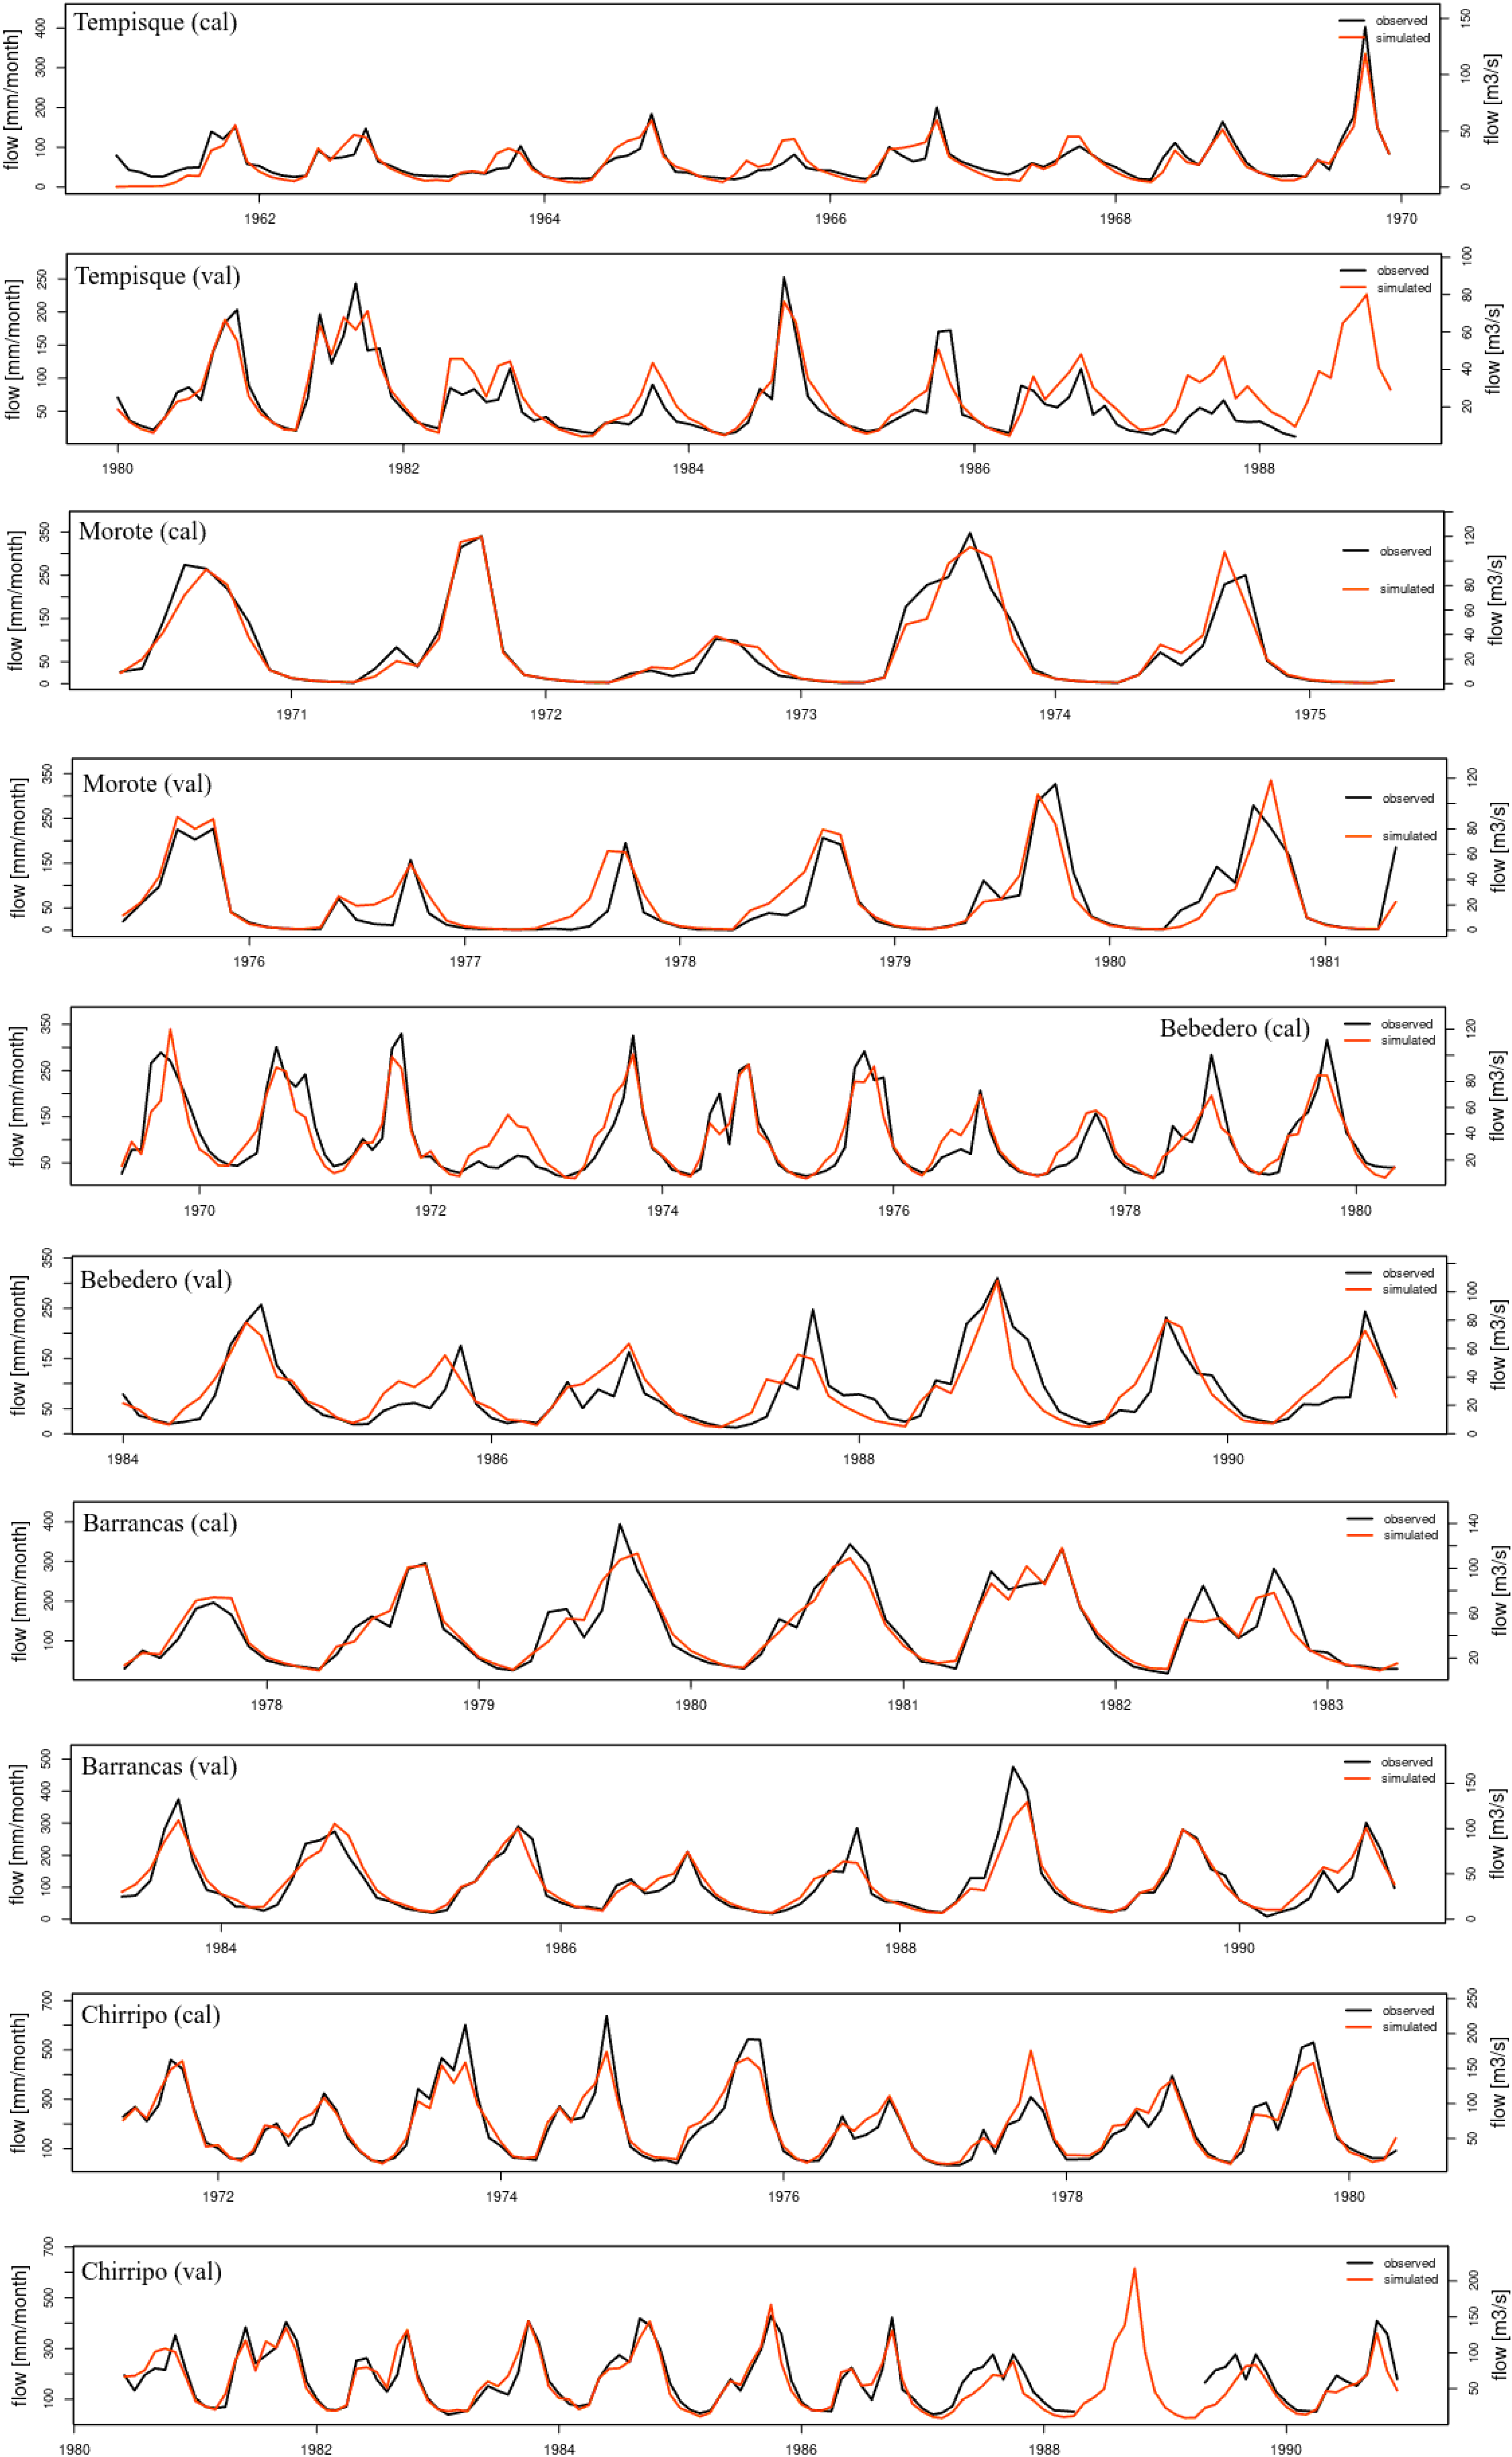
As suggested by Moriasi et al., 2007 [96] visual inspection of simulated and measured hydrographs are useful in identifying model bias and can point out differences in timing and magnitude of peak flows and the general shape of recession curves. In this study, simulated and observed monthly streamflow hydrographs prove the suitability of the GR2M model to properly simulate the monthly and seasonal hydrological cycle of all reference catchments, as simulated values and their temporal variability acceptably match observations during the calibration and validation (Figure 4).
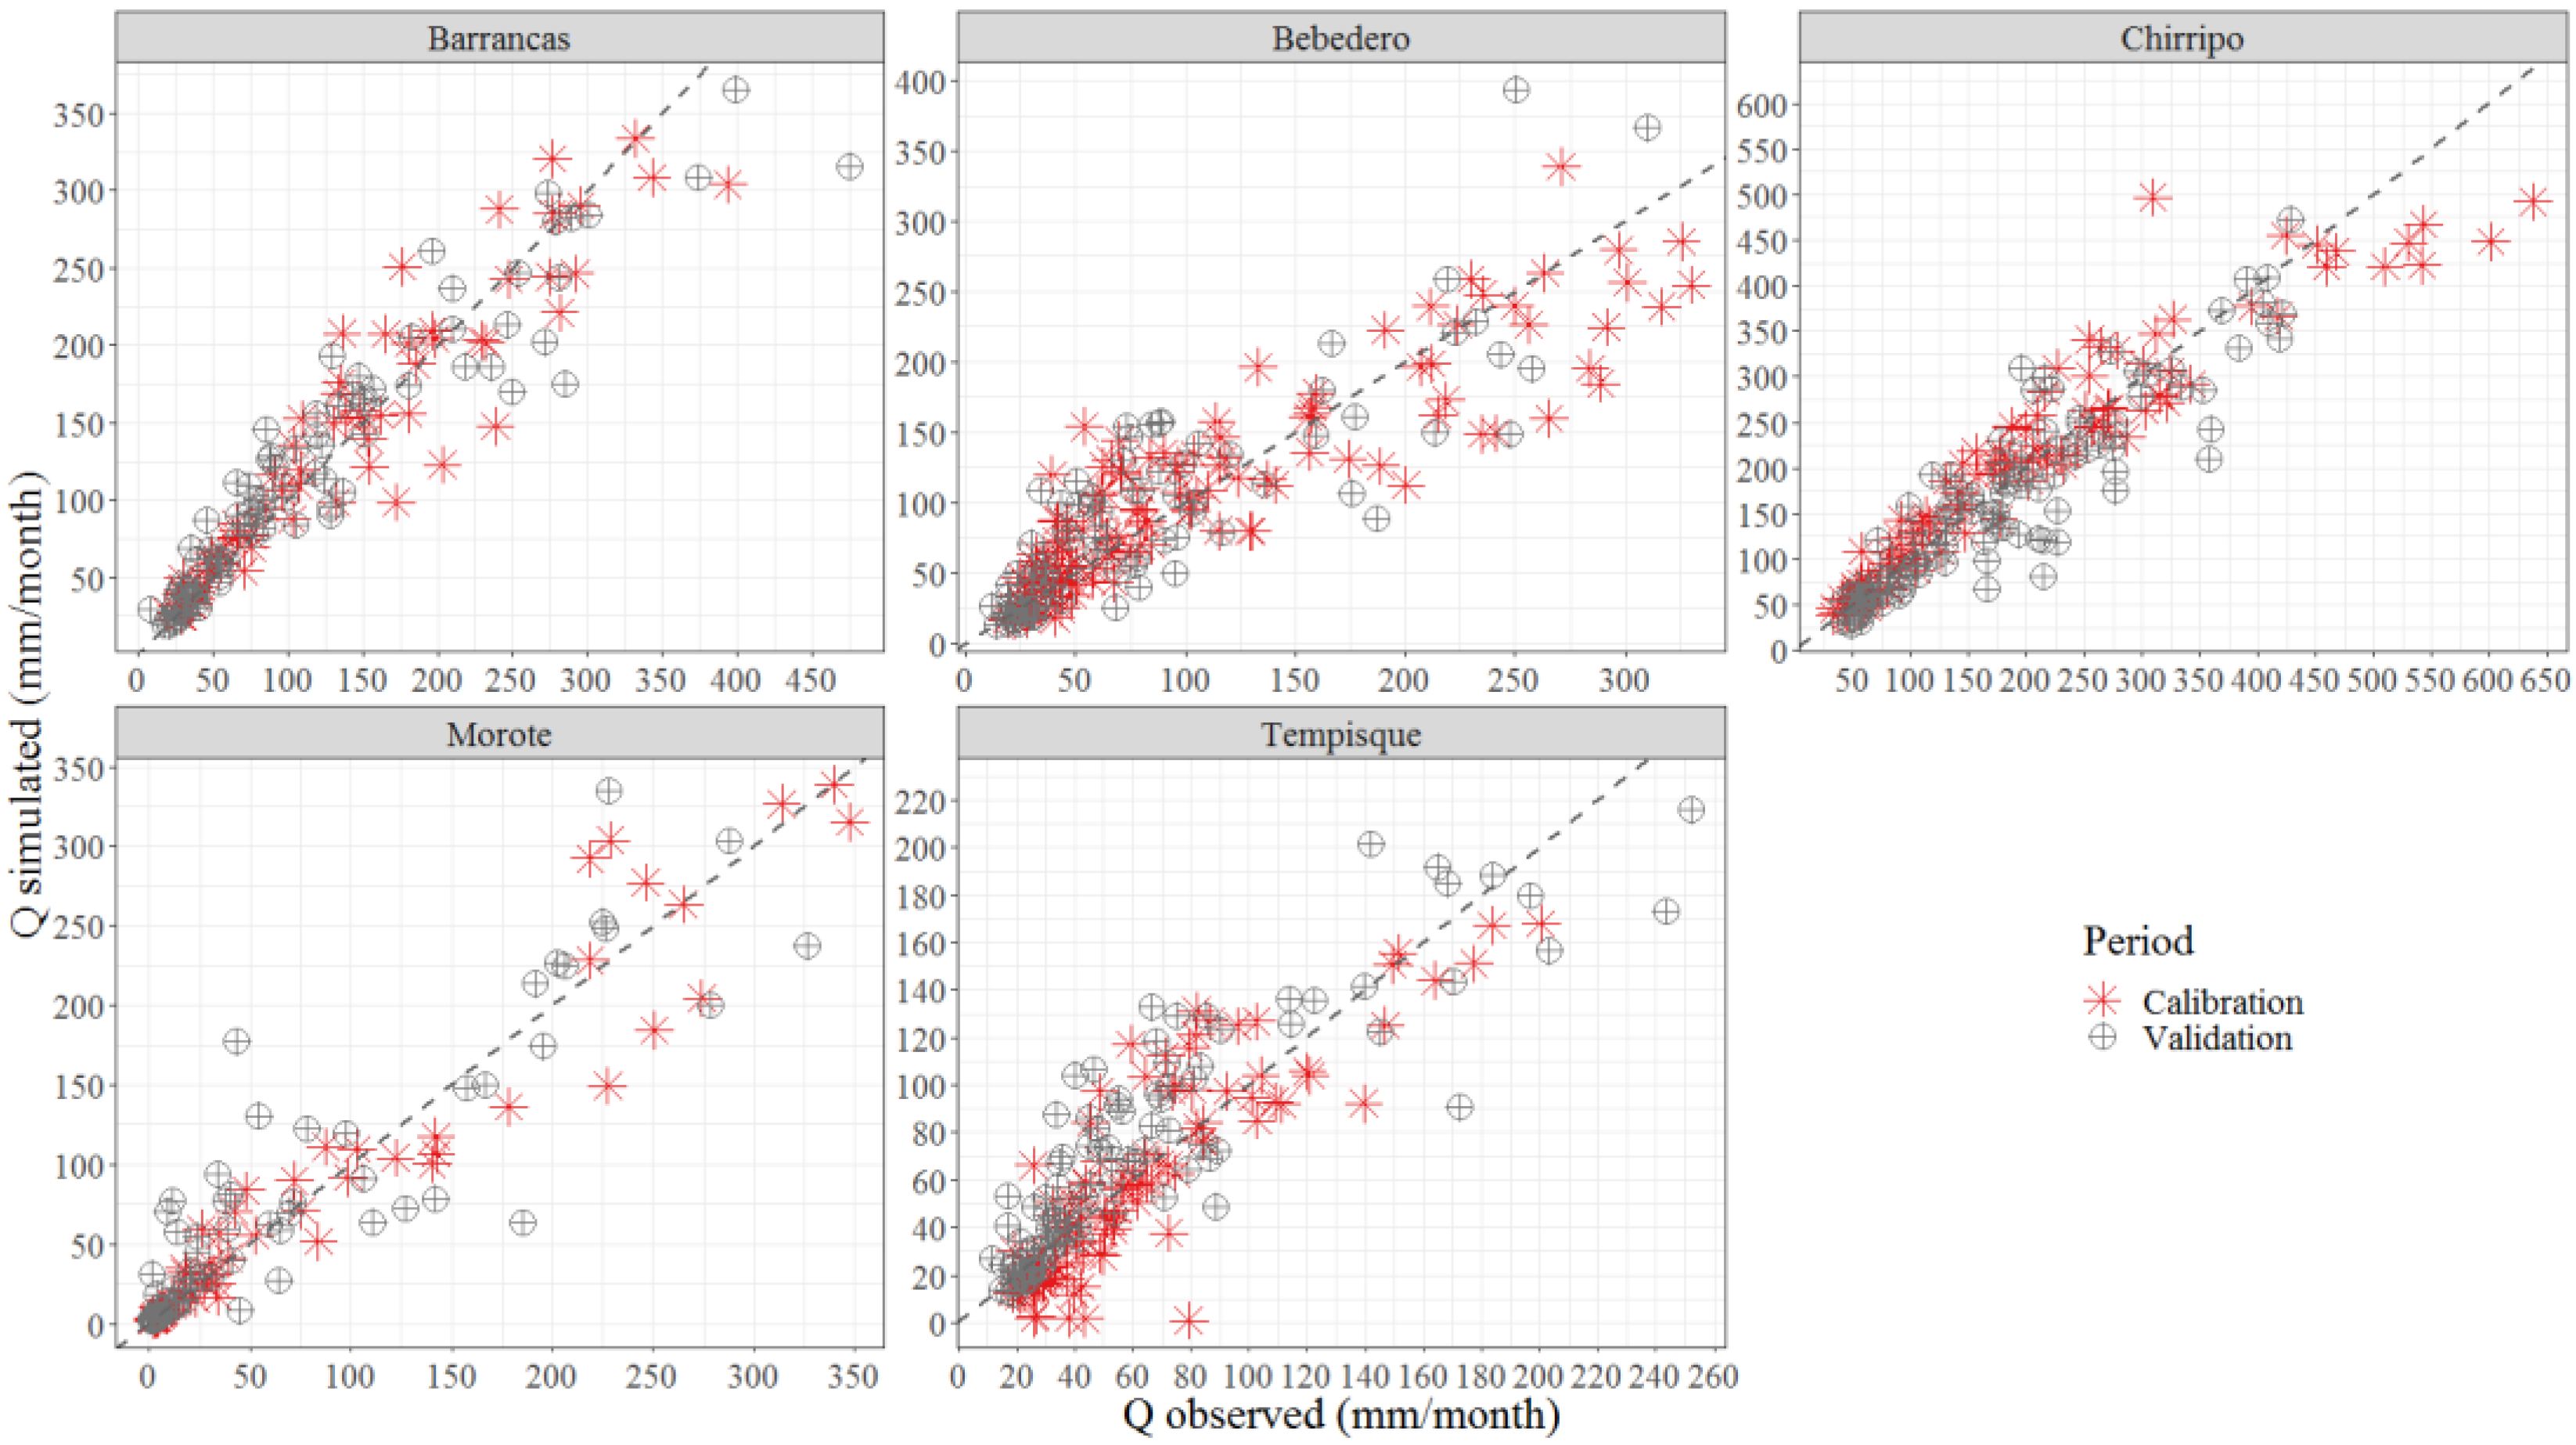
No considerable mismatches can be found in terms of peak flows, baseflow or timing for any of the catchments. This is also supported by individual scatter plots (Figure 5), where deviations are somehow higher for peak flows, an outcome to be expected since NSE was the optimized objective function. The average magnitude of simulated monthly streamflow values is within the “very good” range across all metrics considered for all catchments during the calibration period (Table 3), which are in agreement with graphical results (Figure 4).
As expected, all metrics suggest that GR2M performance slightly decreases in validation. This drop in performance has been repeatedly emphasized in literature [47,101,102] and it is most likely related to model dependence on specific hydroclimatic and seasonality conditions during the calibration/validation periods, poor parameter identifiability and changes in land use and data acquisition errors.
Simulated values fall within the “good” range during the validation period for the Tempisque and Bebedero rivers in terms of NSE and PBIAS only. Even when NSE and KGE values are not directly comparable, the first is known to be more sensitive to peak flows, whereas the second was specifically conceived to overcome this shortcoming. It can be noted that in the case of the Tempisque River (Table 1), the validation period exhibits considerably more peaks when compared to the calibration period (Figure 4). This translates into a lower NSE value (0.737) which once again does not dramatically affects its KGE counterpart, which follows into the “very good” range (0.801). The same reasoning is extensive to the Bebedero River, as NSE falls within the “good” range but the KGE remains in the “very good” range.
Conversely, PBIAS values in validation are proportionally higher than their calibration counterparts for all reference catchments but still the “very good” to “good” range, particularly for the Tempisque and Chirripo catchments where an overestimation of +15.18% and an underestimation of −6.76% can be observed (Table 3).
In terms of R, all reference catchments fall within the “very good” category, as values range from 0.825 to 0.965 during both calibration and validation, meaning that in all cases, the GR2M model is capable of describing over 80% of the variance. Some discontinuities in the observed streamflow time series can be observed during the validation period for the Tempisque and Chirripó Pacífico catchments. However, these data gaps were excluded from the validation process and therefore do not affect metrics performance. The relatively high performance of the GR2M model led to determining representative parameters for the five reference catchments and simulating robust streamflows for future projections under stationary and changing conditions. The X2 parameter, which is in control of the baseflow/slow runoff from the lower-routing groundwater storage G (Figure 3), shows a fairly stable behavior around 1 (from 0.888 to 0.993), which is within the theoretical value range (0.2 to 1.3) identified by Perrin et al., (2007) [93]. On the other hand, the X1 parameter which is in control of the upper-production soil moisture store S shows somewhat high values (above 2000 mm) corresponding to tropical humid characteristics over the five catchments, except for the Morote catchment which exhibits a particularly low value of around 773 mm. Since the Morote catchment has the shortest calibration/validation period, the results could indicate that GR2M model components related to soil moisture and percolation are likely sensitive to the length of the calibration period. Additionally, it should be noted that the capacity of the groundwater storage in GR2M is set by default to 60 mm, so its sensitivity to the calibration period is not analyzed here. The limited number of parameters of the GR2M model could be of great advantage for ungauged catchments with comparable characteristics within the study area, since optimal parameter values (X1 and X2) exhibit moderately low variability across the calibration periods, indicating that they could be transferable to other catchments. One of the major obstacles in estimating water resources availability is data scarcity associated with a lack of gauging stations [53].
Applying the GR2M model over sufficiently large catchment samples would allow the repeated use of its optimum global parameters to ungauged catchments within a particular region [103]. Hence, it is advisable to evaluate the modeling robustness and transposability of GR2M calibrated parameters to contrasted climate or anthropogenic conditions. Even when all catchments exhibit steep slopes and high elevation gradients (Table 1, Figure 1), streamflows are measured at the lowest elevation areas in unstable river beds, which cross sections are most likely sensitive to geometric changes, as strong precipitation events occur during the rainy season. This reality should imply frequent updating of streamflow rating curves, which could not always be achievable and therefore propagates uncertainty into historical observed records. Changes in hydraulic sections over time are just one of several sources of uncertainties affecting any hydrological model, which also includes data acquisition errors, changes in land use and land cover among others [96].
While the selected metrics are satisfactory in both calibration and validation (Table 3), these results are derived from only one sets of optimal parameters found by the Michel algorithm, which should not suggest that they are unique. Nonetheless, the GR2M is highly a parsimonious model with only 2 sensitive parameters, where the equifinality problem is less relevant as compared to more complex models [33]. Increasing the complexity of the model by adding more parameters could only result in more variance be added to the model itself [37]. Significant trade-offs in the ability of any hydrological model to simulate all aspects of a catchment dynamics will always exist, since no single unique set of parameter can be identified.
Biases both systematic and random in nature, are expected to propagate to further model simulations. However, model parameters are also expected to be transferable to periods with climatic conditions that are not encountered during the calibration-validation phases if satisfactory metric values are reached during the optimization process [25,26].

3.2. Historical Simulation of Precipitation and Temperature

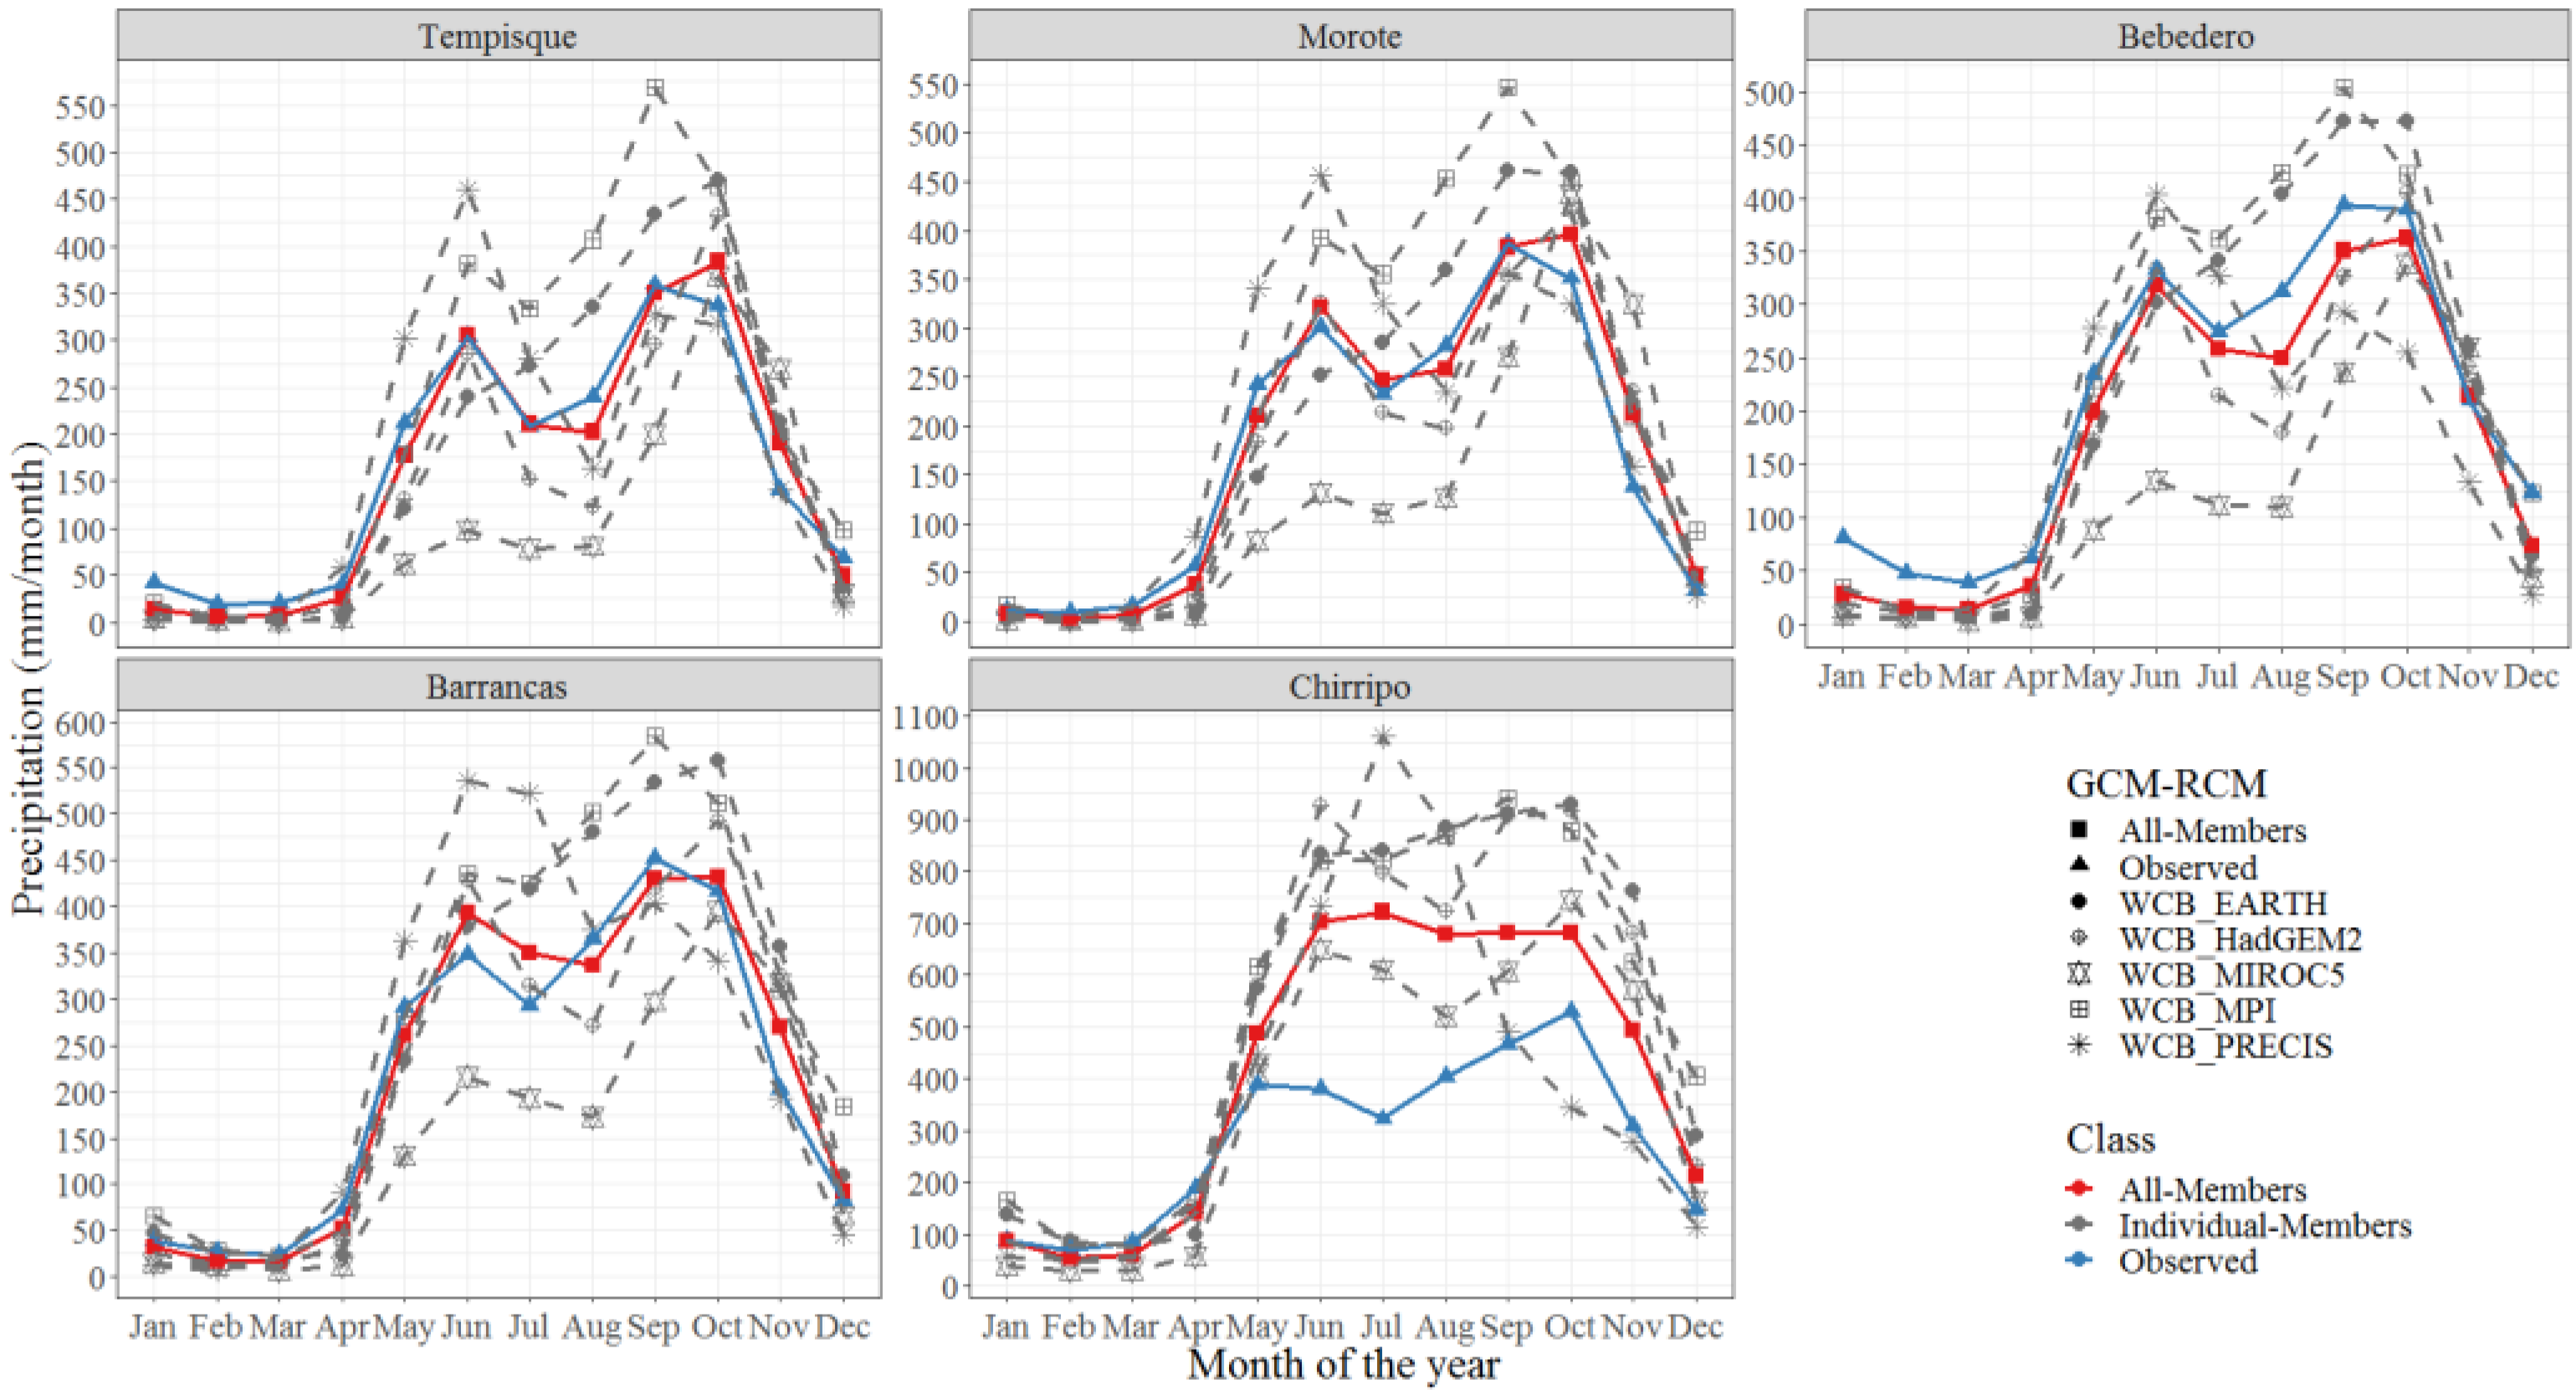
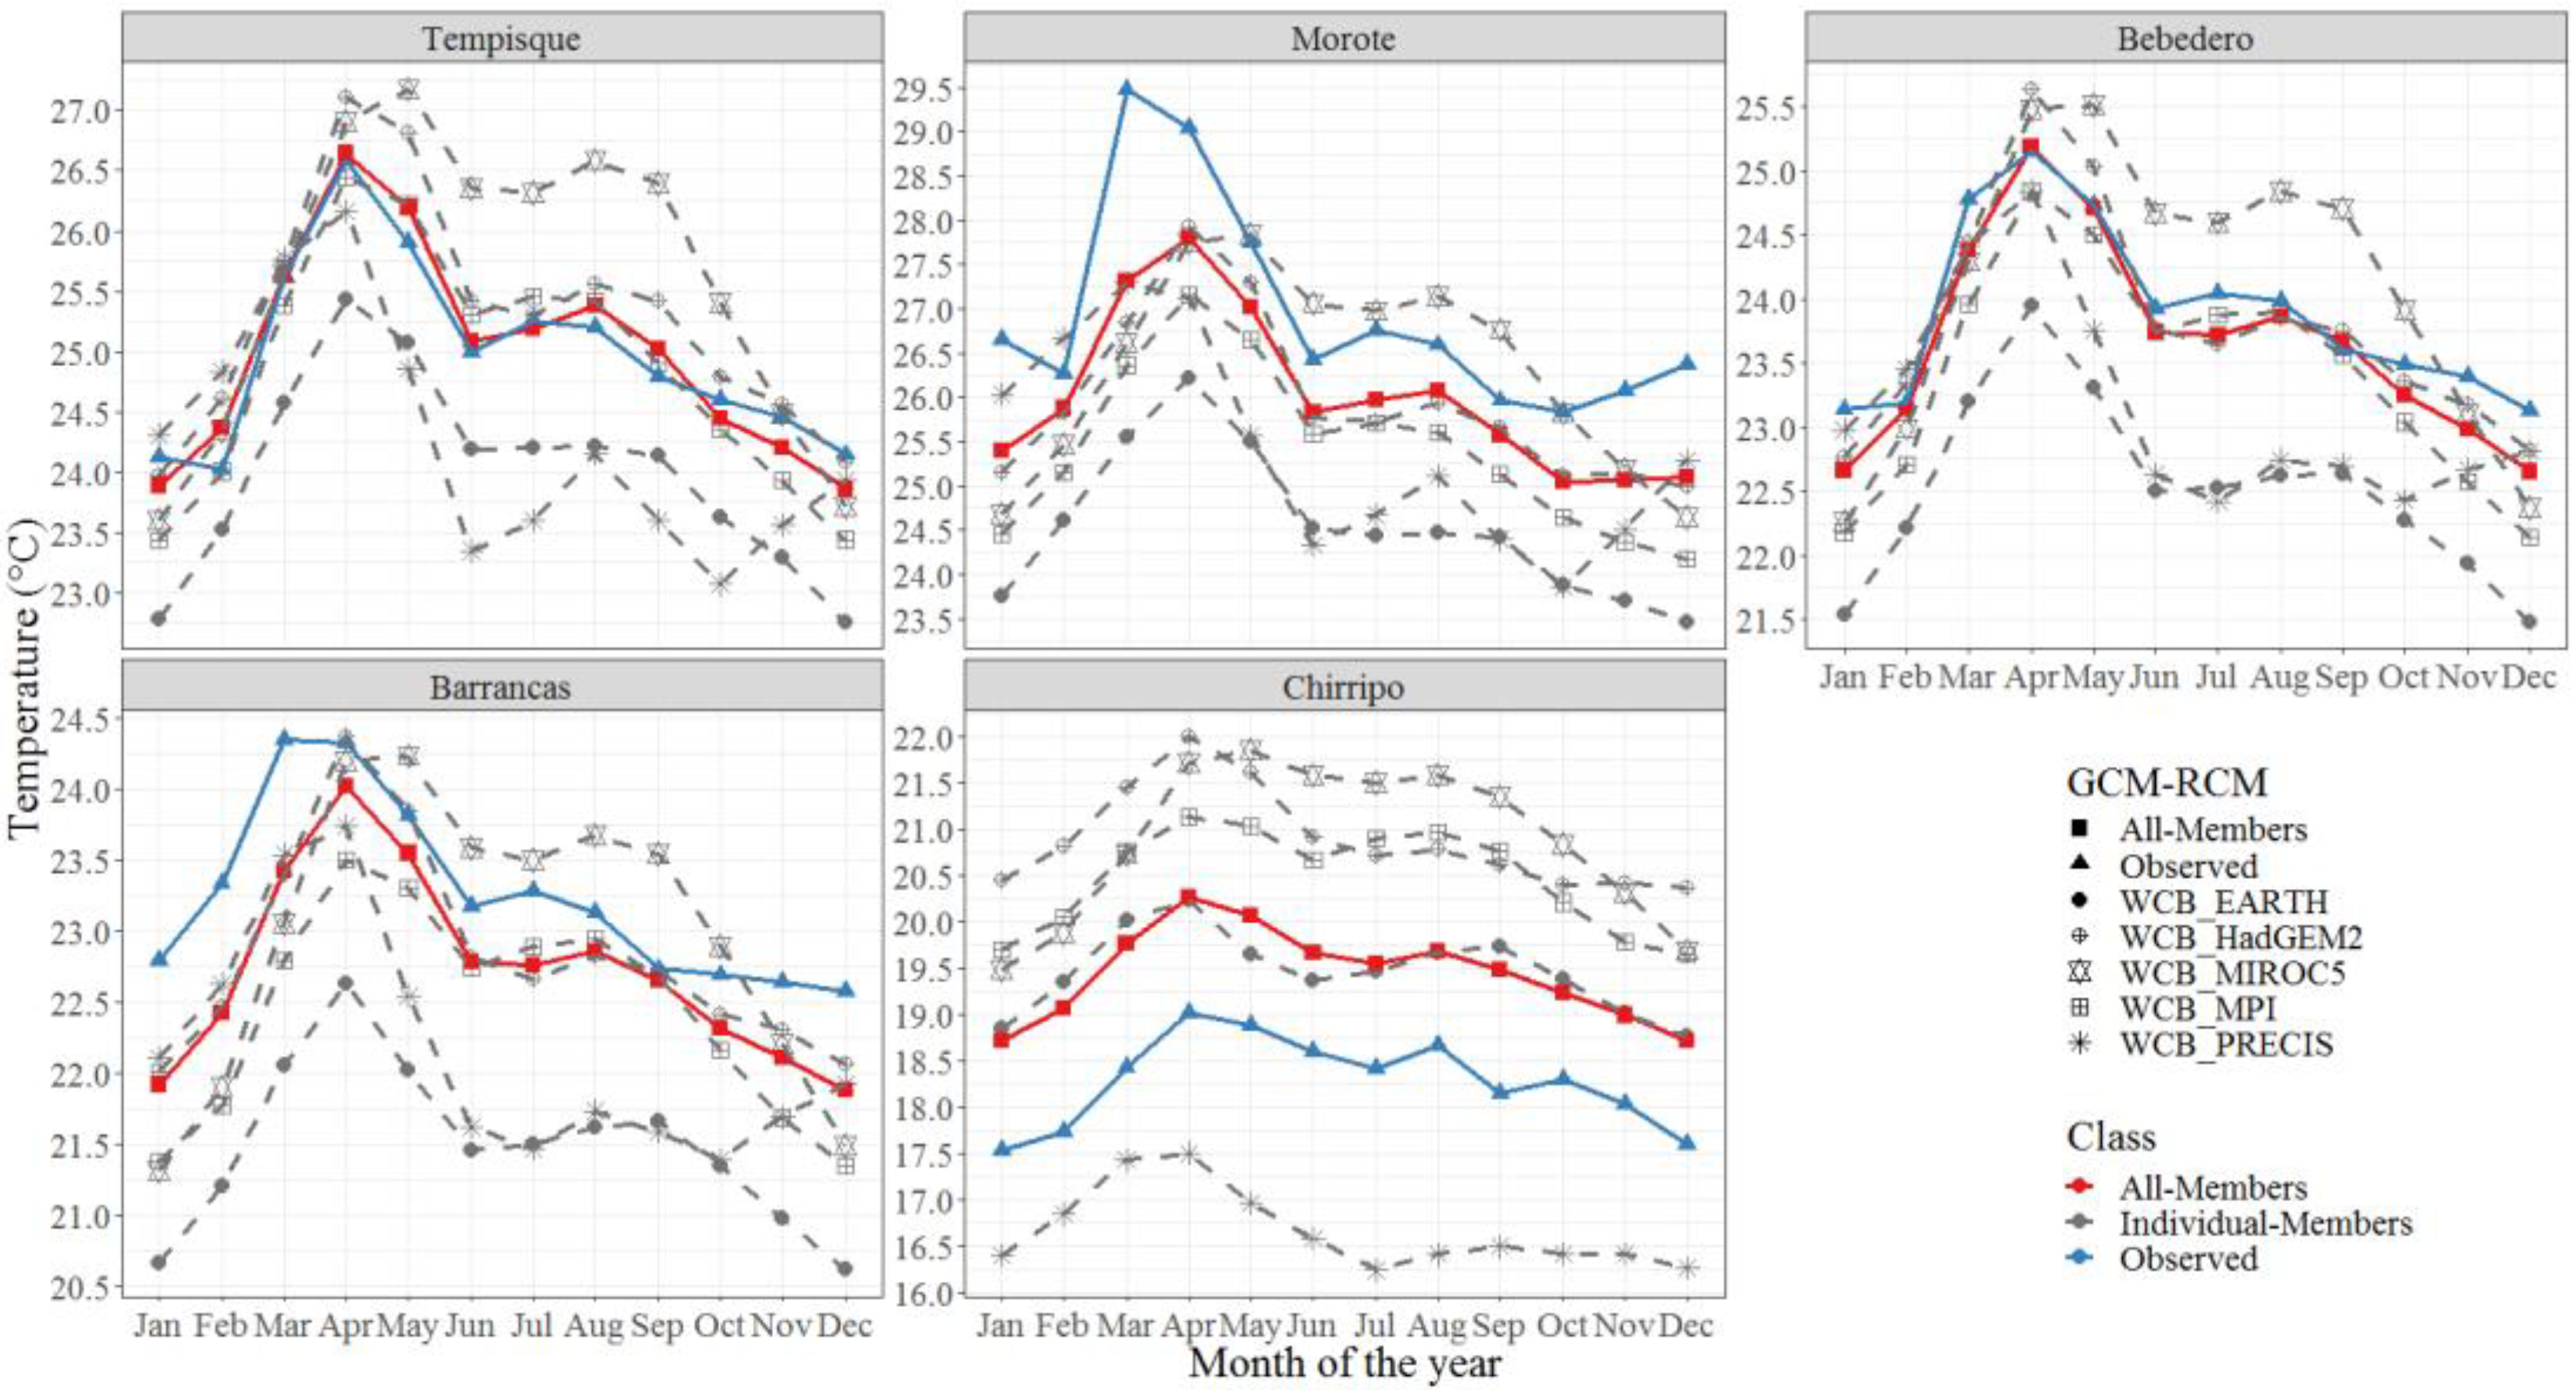
To assess the performance of each GCM-RCM configuration relative to the baseline (1961–1990), the spatially-averaged mean cycles of precipitation and temperature were obtained for all reference catchments on a monthly scale. In terms of precipitation, spatially-averaged monthly observations show the expected bimodal annual precipitation cycle including the early wet season (EWS) peak (May-June), the late wet season (LWS) peak (September–October) a relative minimum in July-August associated with the Mid-Summer Drought (MSD) and the general minimum during boreal winter (December–February) (Figure 6 and Figure 7).
The ability of each GCM-RCM member to reproduce these climate features substantially depends on catchment domain and seasonality since biases of various magnitudes between uncorrected GCM-RCM outputs and historical observations are clearly distinguishable.
PRECIS and MPI correctly locate the EWS peak in June but heavily overestimate precipitation across all catchments. The opposite behavior is shown by MIROC5, which exhibits a systematic dry bias across all catchments even when it can properly locate the EWS peak in most cases. The remaining members, HadGEM2 and EC-EARTH performed better as simulations get closer to observations from January to June. The Chirripó Pacífico river catchment is an exception, as a considerable wet bias can be observed for all GCM-RCM members. PRECIS however, fails to properly reproduce the bimodal precipitation cycle for this catchment, locating the EWS peak in July rather than in June and completely missing the LWS peak in October.
The summer precipitation peak in the Pacific region, intensively convective in nature, is mostly associated with an intensification and westward shift of the North Atlantic Subtropical high (NASH) along with higher SSTs within the ITCZ. [75,104,105]. The majority of RCMs have evidenced significant difficulties in modeling convective processes in complex terrain, showing a diminished accuracy in representing summer precipitation, which in most cases reflects unrealistic monthly precipitation accumulation, particularly during the summer peak across all reference catchments [22,106]. These biases are most likely related to factors such as space-time variability in mean precipitation averaging, model structure and non-inclusion of local features. The Mid-Summer Drought (MSD), associated with fluctuations in intensity and location of the Intertropical Convergence Zone (ITCZ) and the Caribbean Low-Level Jet (CLLJ) is well represented by all GCM-RCM members exception for EARTH, which fails to capture the observed July-August minimum across all catchments [73,107].
Systematic wet biases however, can be observed for MPI and EARTH indistinctly of catchment domain. Wet biases prevail for EARTH, MPI and HadGEM2 for most catchments during the LWS peak, which coincides with the period of increased activity in terms of tropical cyclones in the Atlantic Ocean (September-November) [76]. At the same time, MIROC5 adequately captures the LWS peak even when it shows predominantly dry biases from May to October across all reference catchments. GCM members dynamically downscaled by RCA4 exhibit substantial variations in terms of wet-dry biases across all catchment domains, indicating that local processes and initial model parameterizations are important in determining the model response to boundary forcing. Moreover, this also suggests that the performance of individual configurations depends mostly on GCMs simulations themselves, rather than the conceptualization or parameterization of the regional climate model (RCA4) [15,97,108]. Precipitation along the Pacific coast sharply decreases during boreal winter, reaching a minimum between December and February, when surrounding SSTs are lowest and trade winds are stronger. This feature is properly reproduced by most GCM-RCM configurations across all reference catchments even when a slight wet bias can be observed. MIROC5 and HadGEM2 nonetheless, exhibit a systematic dry bias throughout most of the year regardless of the catchment, with MIROC5 barely reproducing the EWS peak. The uncorrected multimodel ensemble-mean (MEM), accounting for all GCM-RCM configurations (Table 2), in most cases, performed better than individual members. This is most likely because the different configurations are characterized by different biases, which partially counterbalance the ensemble average. The magnitude of seasonal variation in terms of dry-wet suggests that a multimodel ensemble approach encompassing all available GCM-RCM members may result in a better evaluation of climate change across all reference catchments. Once again, the only exception is the Chirripó Pacífico river catchment, where the uncorrected model ensemble-mean greatly overestimates precipitation during the rainy season and underestimates precipitation during the dry season, indicating that all GCM-RCM configurations are incapable of properly capturing the true nature of spatial precipitation patterns over this catchment.
With respect to temperature, all GCM-RCMs configurations adequately reproduce the general shape of the observed annual temperature pattern on a monthly scale, where the warmest month is either March or April and the coolest month is January. Nevertheless, relatively large biases can be observed depending on catchment domain and model configuration. MIROC5 exhibits mostly warm biases (1 to 2 °C) for all catchments from January to October, but a cold bias during boreal winter (November–February). The opposite can be seen for PRECIS and EARTH, with cold biases year-round regardless of catchment domain (1 to 2 °C). MPI and HADGEM2 better define temperature patterns including the April maximum and the December minimum across all catchments as simulated values are closer to observations. The opposite behavior is shown by the Chirripó Pacífico catchment, where a considerably warm bias is produced by most models. The magnitudes of these cold-warm biases however, remain relatively stable throughout most of the year. These biases are most likely dependent on grid elevation-averaging applied by RCMs at their particular spatial resolutions (either 50 or 25 km), as no distinction can be made between climates in the Pacific and Caribbean slopes or their respective sources of moisture, which highlights the difficulty of most GCM-RCMs members to accurately describe temperature variations in narrow mountainous regions such as Costa Rica. [56,66,109].
Similar to precipitation, the multimodel ensemble-mean (MEM) reproduces more accurately the seasonal mean temperature pattern across all catchments except for the Morote River, where almost all models produce a substantial cold bias. Furthermore, none of the GCM-RCMs is capable of properly capture the March peak for the Morote catchment, exhibiting a cold bias of nearly 2 °C. Clearly, the magnitudes of precipitation and temperature biases introduce large uncertainties in climate change projections across all reference catchments, which could limit their applicability in climate impact studies [110,111]. As GCM-RCM outputs are not considered sufficiently accurate to directly drive hydrological models, a priori bias correction method was be applied. Furthermore, since the multimodel ensemble-mean (MEM) generally outperforms individual GCM-RCM configurations regardless of catchment domain, the delta-change method was applied to correct the MEM precipitation and temperature biases for three 30-year future periods; near-future (2011–2040), mid-future (2041–2070) and far-future (2071–2100) under IPCC Representative Concentration Pathways (RCPs) 2.6, 4.5 and 8.5 using the 30-year control period 1961–1990. Consequently, only the bias-corrected multimodel ensemble-mean (MEM) was further used for evaluating future changes in precipitation and temperature across all catchments.

3.3. Future Changes in Precipitation and Temperature

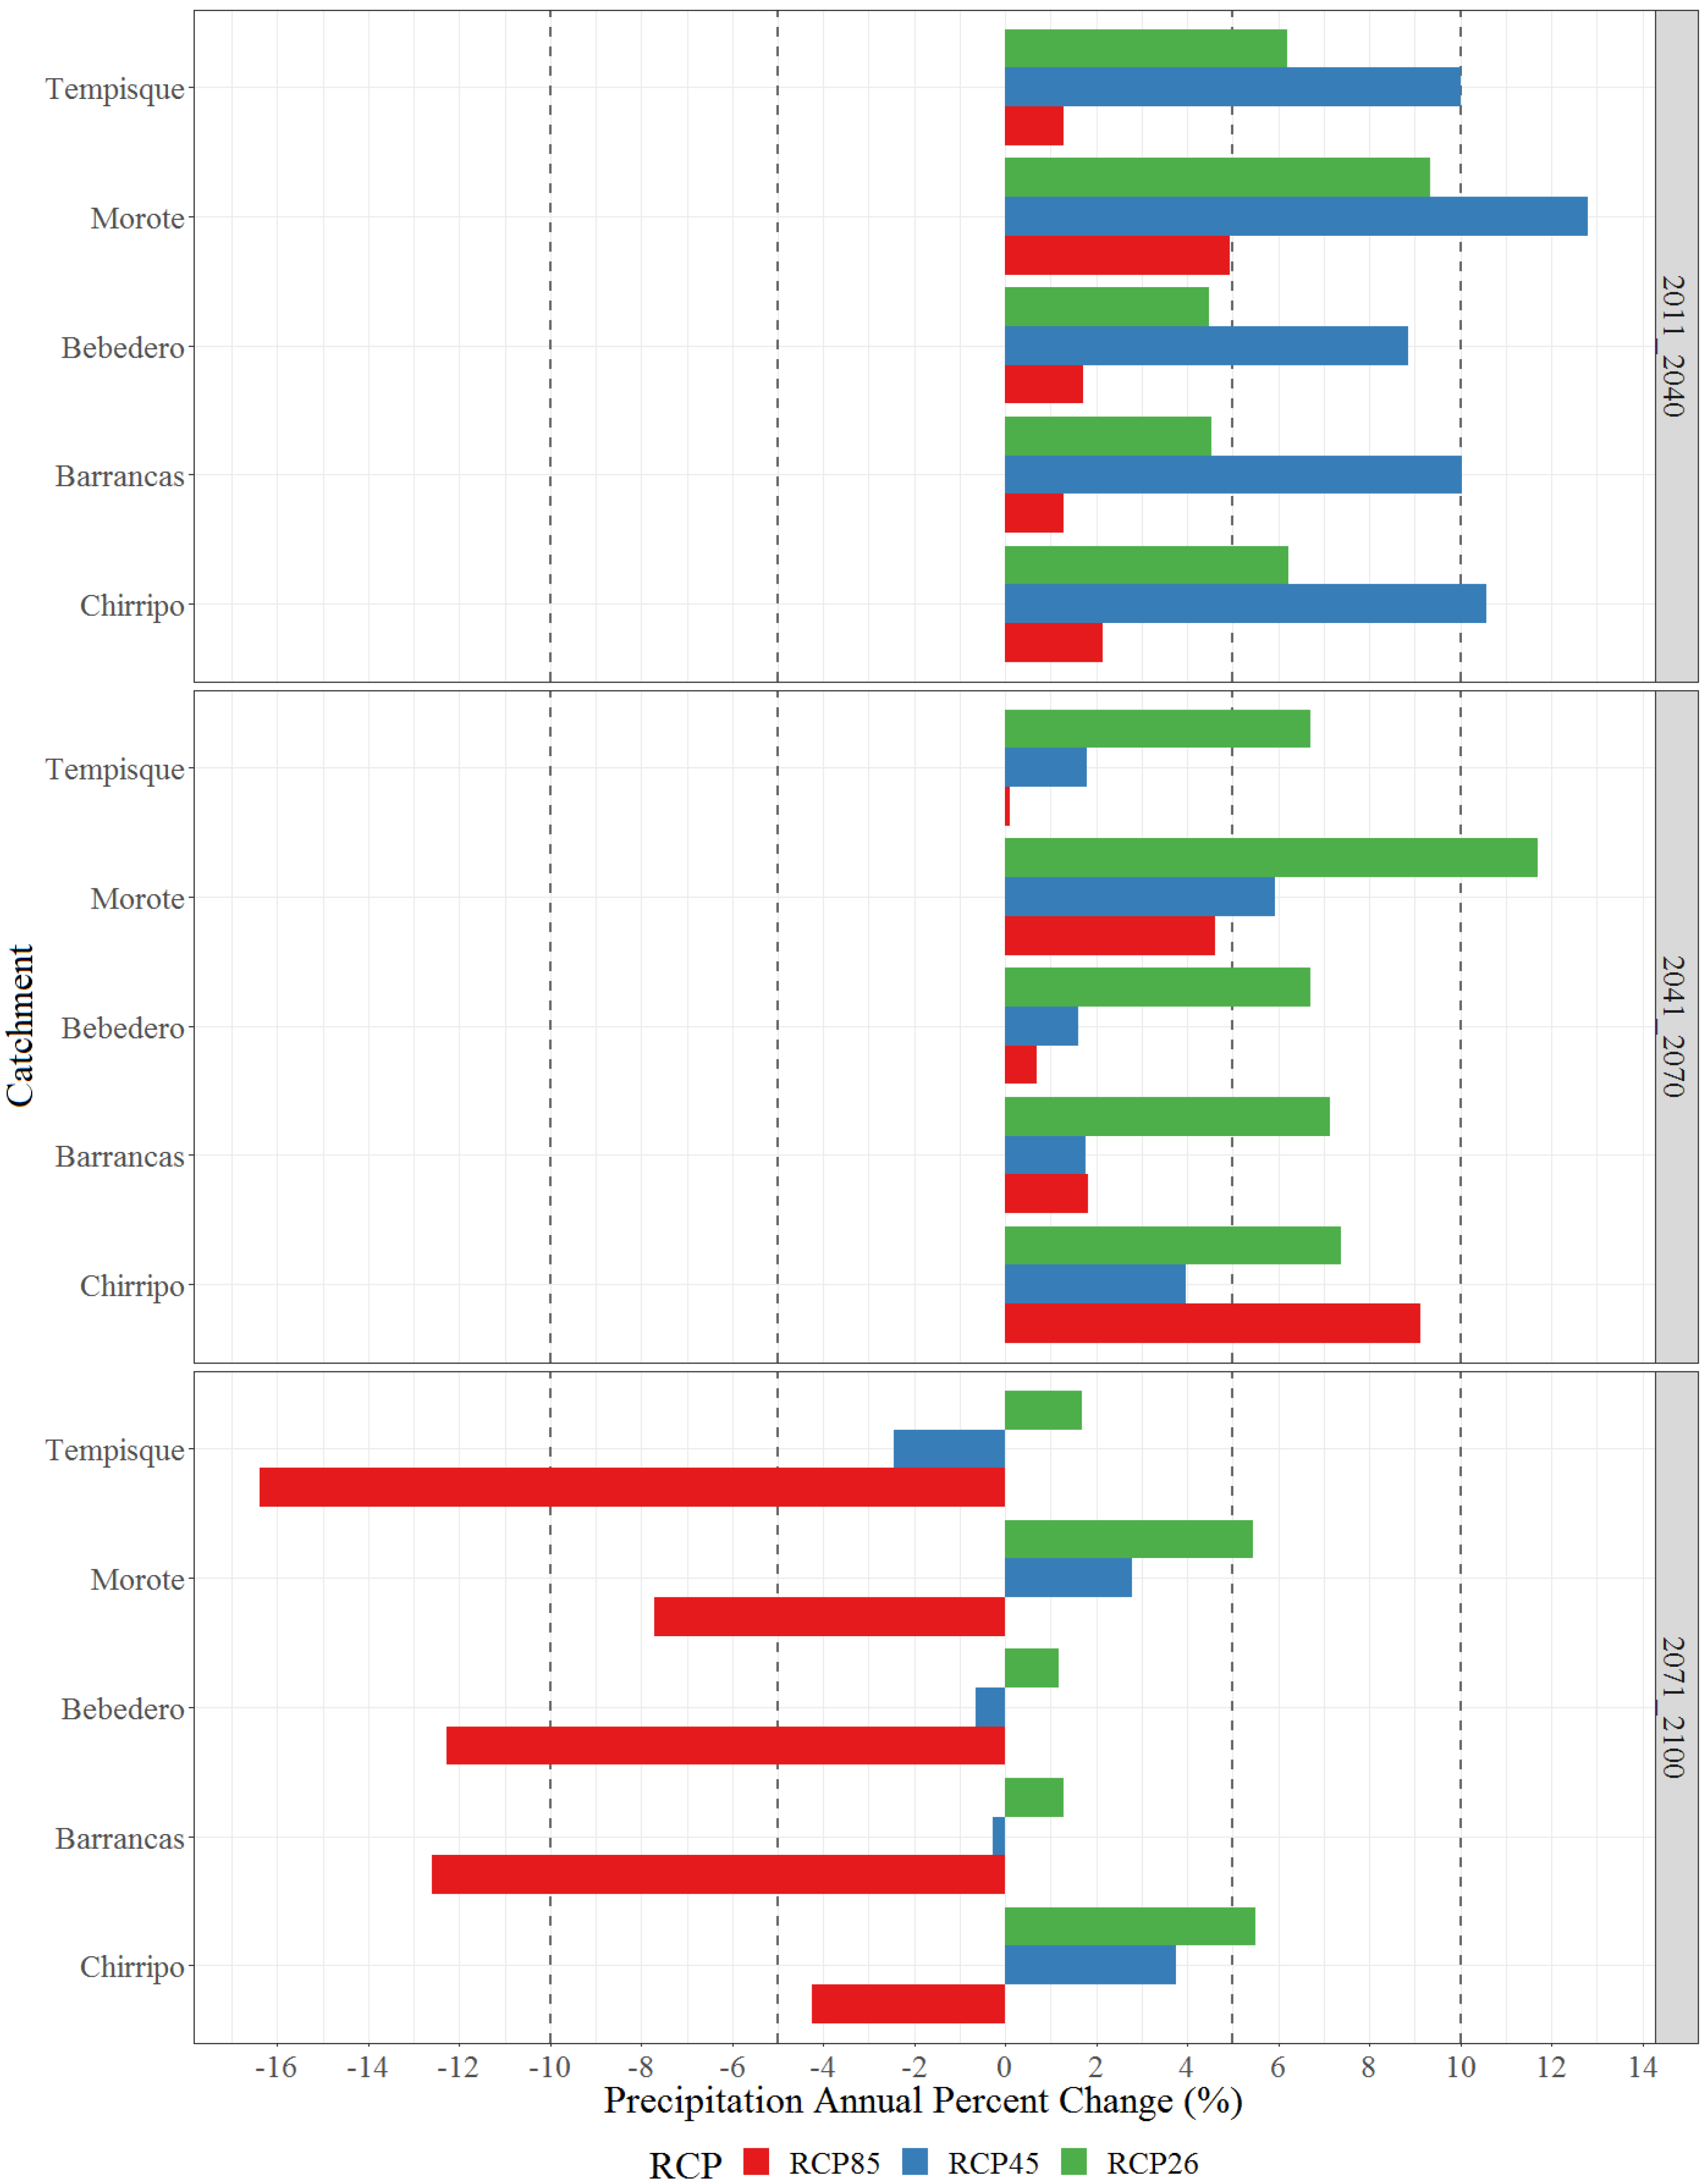
On a monthly scale, even when the bimodal precipitation distribution pattern of all reference catchments remains essentially the same, precipitation volumes are expected to increase in the near (2011–2040) and mid-future (2041–2070) periods (Figure 8).
However, there are significant differences in the magnitude of such changes depending on catchment domain and RCPs. These differences reflect the uncertainty associated with the application of different GCM-RCMs configurations and emissions scenarios [112]. Consistently, wetter conditions during the EWS peak, Mid-Summer Drought (MSD) and LWS peak are expected across all catchments in the near-future period (2011–2040) under RCP 4.5 when compared to RCP 2.6, displaying interannual percentage-change (PC) values between +8% and +12% for RCP 4.5 and between +4% and +9% for RCP 2.6 respectively (Figure 9).
Slight decreases in precipitation (PC around −5%) can be observed for all catchments during the EWS peak under RCP 8.5, which are ultimately compensated by marginally wetter conditions during the LWS peak and the transition towards the dry season (November to December). For the mid-future (2041–2070) period, RCPs 4.5 and 8.5 show evidence of a consistently decreasing trend in summer precipitation (varying from −10% to −20% in July) and an increase in autumn precipitation (varying from +10% to +20% in October), which also extends to a wetter boreal winter. Likewise, interannual PC values for RCPs 4.5 and 8.5 remain mostly positive for all catchments (below +5%), with the Chirripó Pacífico river reaching approximately +9%.
RCP 2.6 nonetheless, shows persistent year-round wetter conditions for the mid-future period regardless of catchment domain, with PC values around from 7% to nearly 12% for the Morote river. For the far-future (2071–2100) period however, considerably dryer conditions with increasing radiative forcing are expected for all reference catchments during the EWS peak and the Mid-Summer Drought (MSD), with considerably more pronounced reductions for RCP 8.5 (varying from −40% to −55% in July), making this the worst-case scenario when compared to the 1961–1990 baseline. On the other hand, a marked increase in precipitation is expected for the LWS peak, exerting influence on the commonly drier months of November and December particularly under RCP 8.5 (varying from +10% to +30% in October). It is worth noting that even when future changes in interannual precipitation are relevant for water balance purposes, the monthly and seasonal distribution changes are expected to be more drastic, which could lead to an increasing frequency of floods and droughts and therefore, should be individually considered for each catchment. Furthermore, flood risk has been identified to be higher in regions located along the extensive flatlands, medium to large areas in both the Pacific and Caribbean catchments, as well as borderlands and coastal regions of Costa Rica [113,114]. These results also indicate a possible seasonal shift in precipitation, with increases from October to April resulting in a shorter dry season and less seasonality. These projected changes in precipitation are consistent with similar results in separate studies over Central America and the Caribbean using various combinations of GCM-RCM configurations and radiative forcings [65,66,68,105,109,112,115,116,117,118]. These studies show a general consensus that reductions in precipitation along the Central American region are expected during the rainy season, with values ranging from −15% to −30%. These changes are most likely associated to the following mechanisms: (a) an intensification and early onset of the Mid-Summer Drought (MSD) over the region driven by regional variations in SST over the surrounding equatorial ocean areas, (b) a southward shift of the Intertropical Convergence Zone (ITCZ) that alters trade winds magnitudes and directions, which prevents moisture from the Pacific Ocean to enter the continent and (c) greater warming of the of the Tropical North-eastern Pacific (TNP) compared to the Tropical North Atlantic (TNA), which causes stronger wind fluxes from the TNA to the TNP through the Caribbean Low Level Jet. Additionally, an increase of the LWS peak is also expected, largely associated to more frequent and intense tropical cyclones in the Caribbean, which favors heavy rainfall along the Pacific and Atlantic coasts and precipitation increases between +10% and +30%.
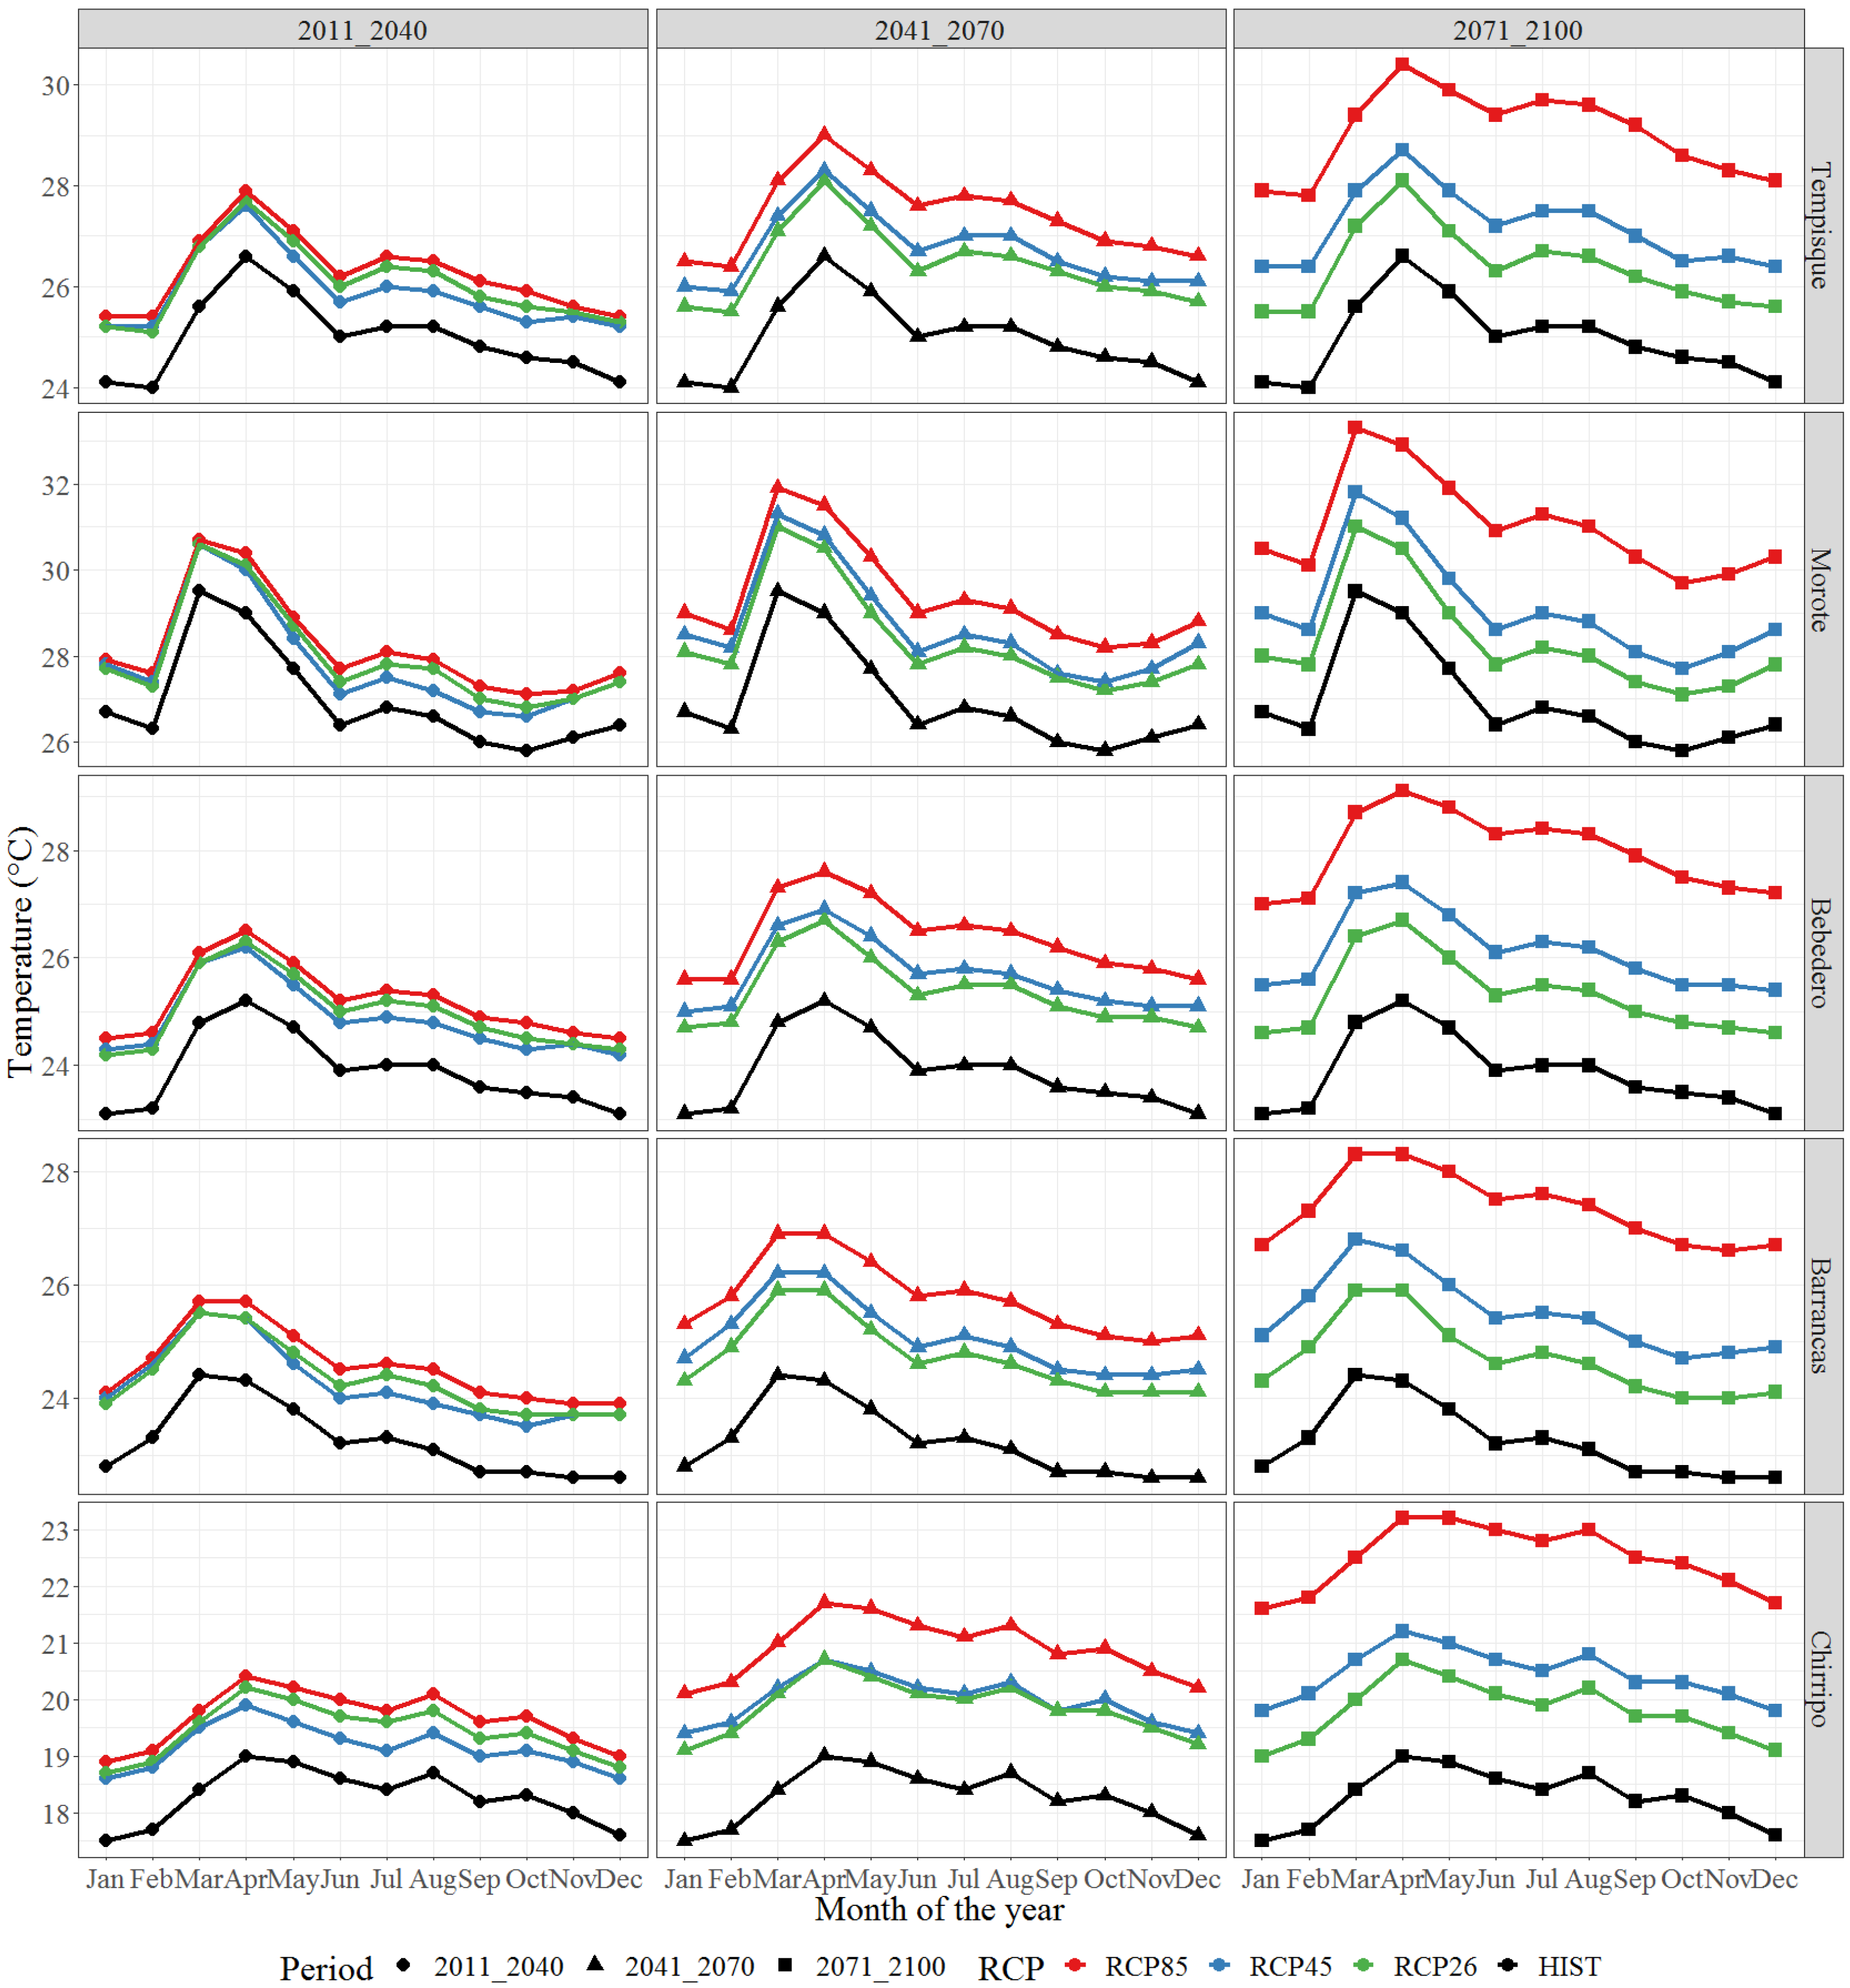
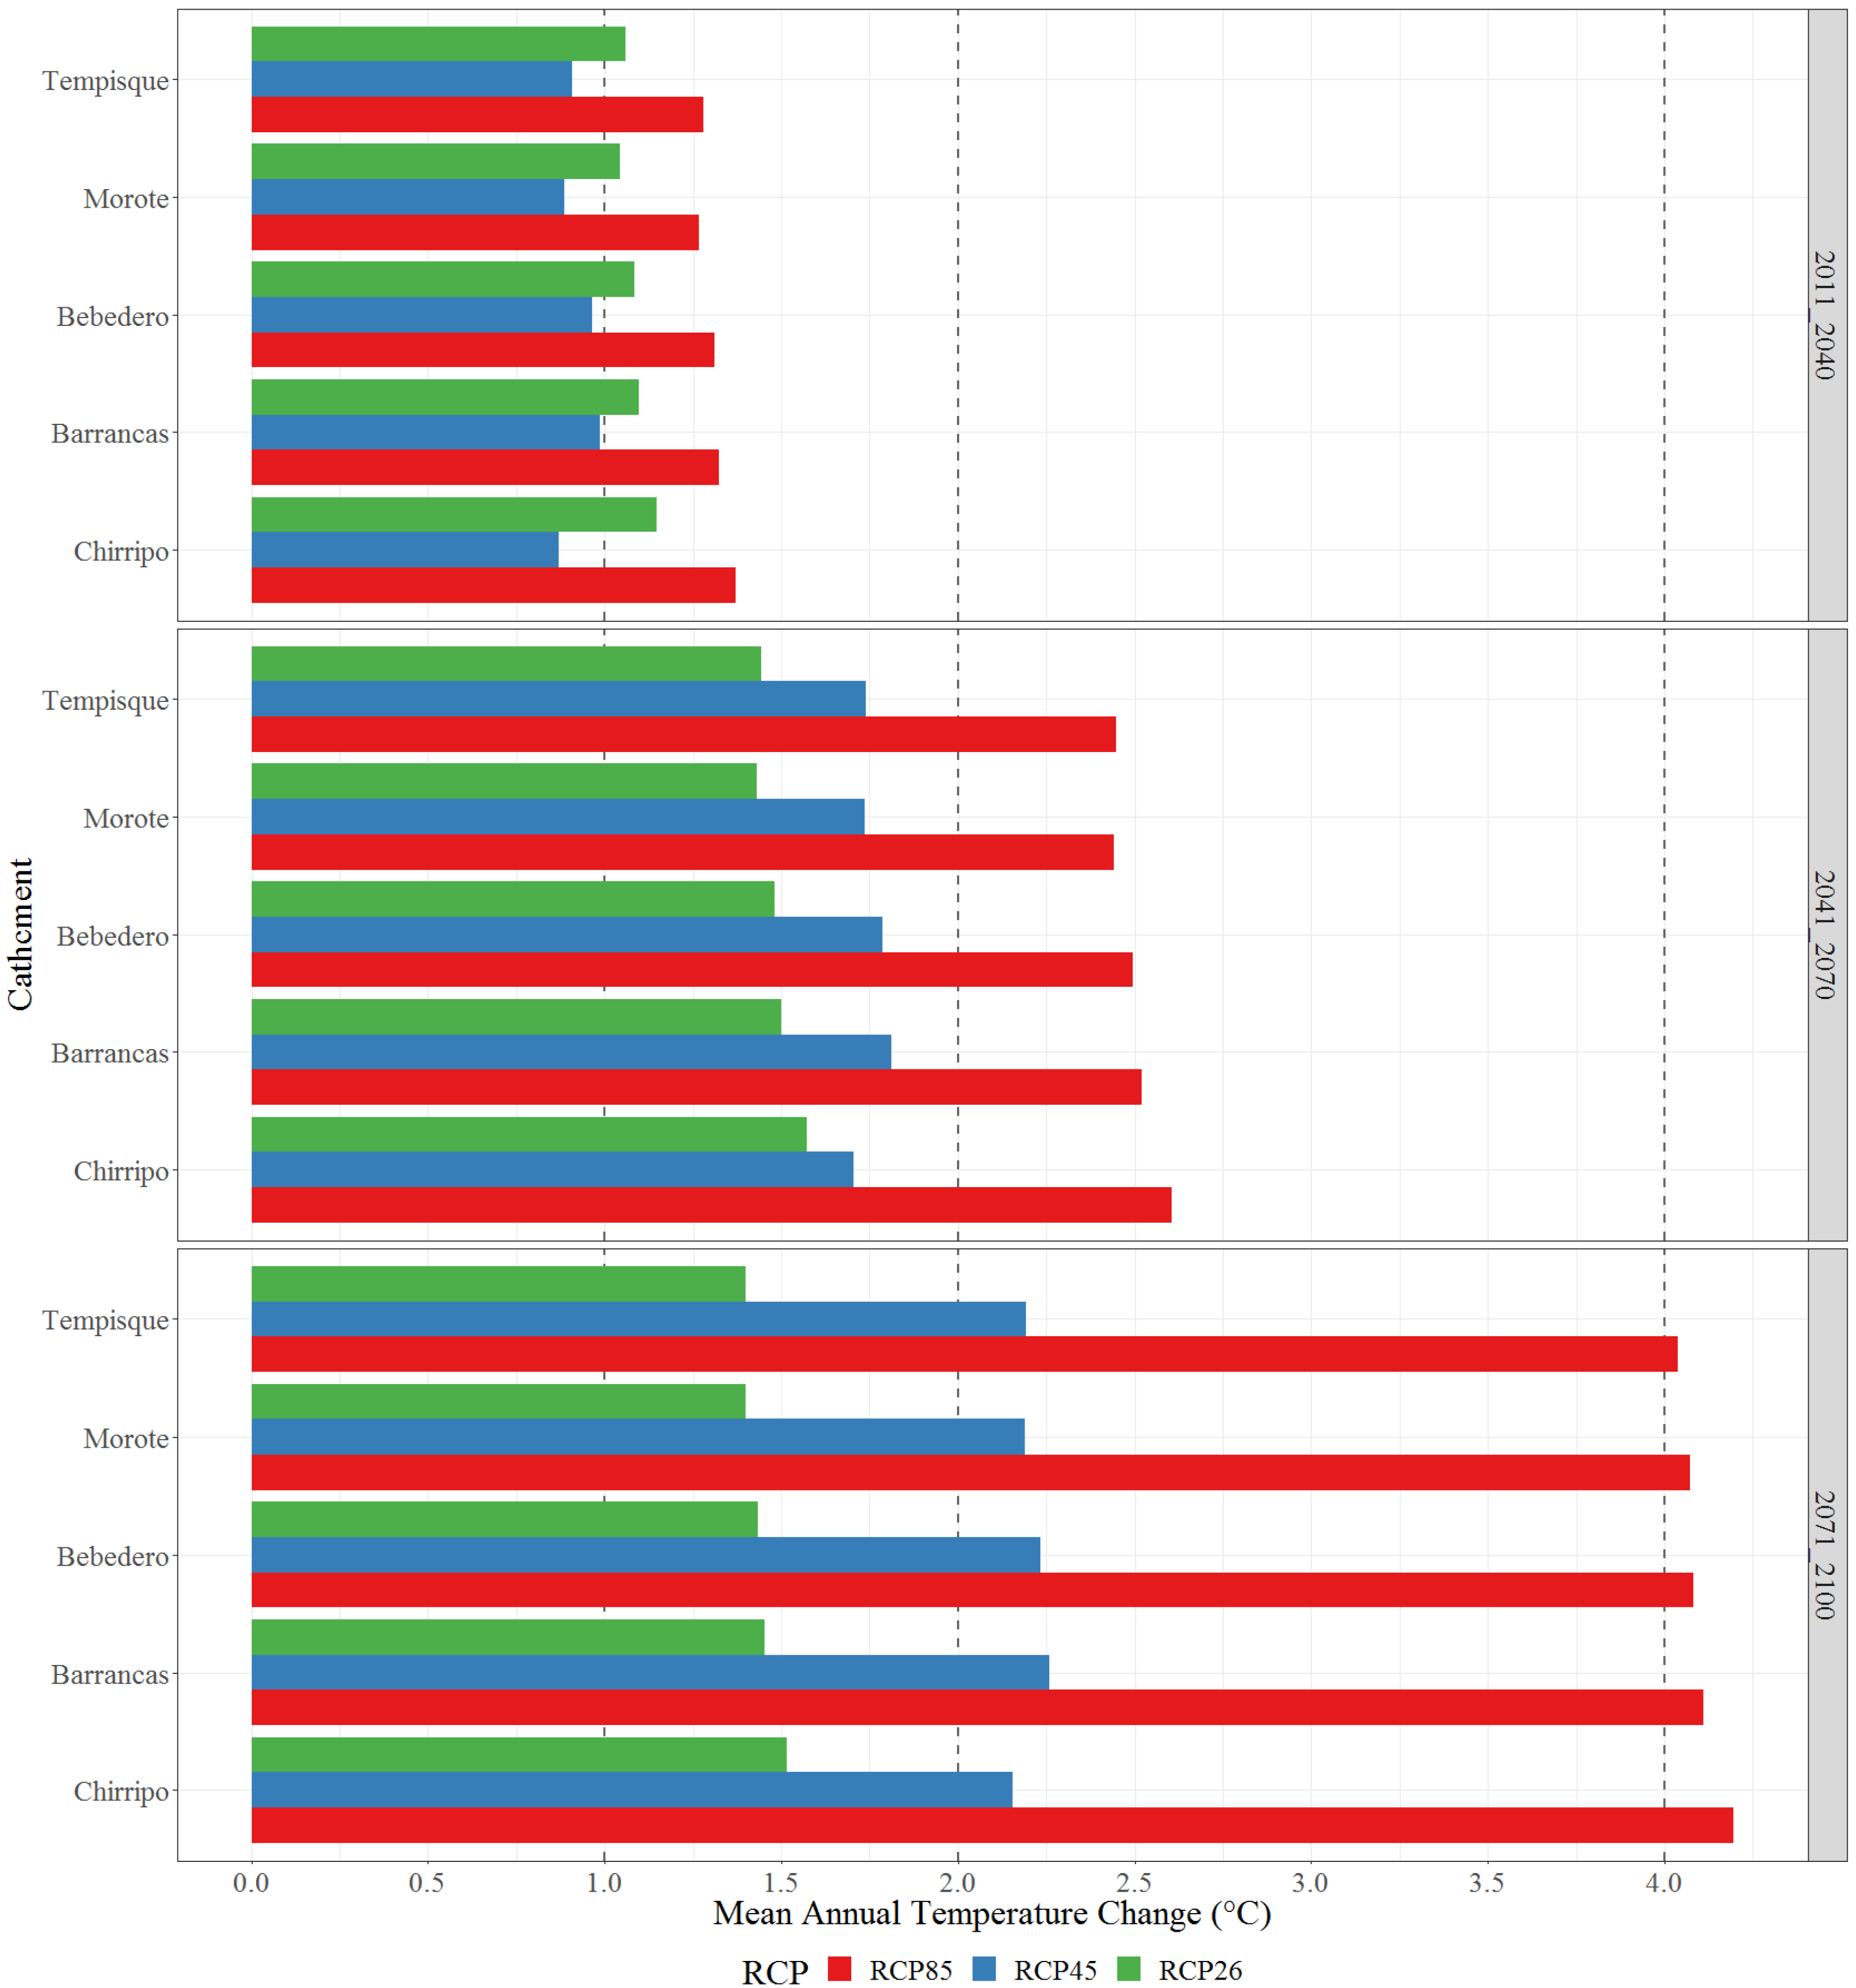
Projected temperature trends show that the monsoonal mean annual cycle of temperature will likely experience warmer conditions with increasing radiative forcing and future period across all catchments located in the Pacific region of Costa Rica (Figure 10). For the near-future (2011–2040) period, all catchments are expected to experience a consistent temperature rise between +1.1 °C and +1.2 °C under RCPs 2.6/4.5 throughout the year, with a slightly larger increase of around +1.3 °C under RCP 8.5 (Figure 11).
In comparison to precipitation, temperature changes are relatively uniform throughout the year, with a larger increase in the March-April peak. A more pronounced increase in temperature is expected in all catchments for the mid-future (2041–2070), with a temperature rise of about +1.6 °C under RCP 2.6 and +1.8 °C under RCP 4.5, both surpassing the IPCC goal of +1.5 °C. RCP 8.5 on the other hand, would considerably exceed the +2.0 °C IPCC threshold by reaching temperature values above +2.6 °C.
An unprecedented increase is expected for the far-future (2071–2100) period under RPC 8.5, as temperature rises will be higher than +4.0 °C across all reference catchments. These results are supported by a consensus among several regional studies regarding strong temperature increases from +1.0 °C to +6.0 °C for different emissions scenarios by the end of the century across the Central America region [57,63,65,116].

3.4. Future Hydrological Response

Once the future GCM-RCM multimodel ensemble-mean (MEM) precipitation and temperature projections were bias-corrected using the delta-change method, the resulting perturbed time series were used as inputs in the previously optimized GR2M hydrological model in order to assess future impacts of climate change on surface streamflow across all reference catchments. A comparison of projected future monthly hydrographs against those of the control period 1961–1990 shows that the general annual hydrological pattern of all catchments remains essentially unchanged, regardless of radiative forcing or future horizon (Figure 12). In essence, both historical and projected streamflows follow the mean annual cycle of precipitation on all reference catchments, as runoff gradually increases from a minimum in March-April to a maximum in October, with a sharp decrease at the beginning of the dry season in November-December, coinciding with the LWS precipitation pattern.
Future changes in precipitation (Figure 9) and temperature (Figure 11) however, do affect runoff volumes across all catchments, which trends significantly vary in terms of future period and radiate forcing. A relative streamflow minimum during July can be observed in most catchments, which is closely related to the MSD. Increases in temperature and solar radiation would consequently result in increases in actual evapotranspiration. When combined with a consistent decrease in precipitation during the MSD, an overall effect would be a consistent decrease in runoff volumes. On an interannual basis, streamflow is expected to increase in all catchments for the near-future (2011–2040) and mid-future (2041–2070) periods under RCPs 2.6 and 4.5 (Table 4). Interannual streamflow increases for the near-future horizon are generally higher under RCP 4.5 (varying from +15.6% to +24.6%) than under RCP 2.6 (varying from +7.8% to +17.7%), but considerably lower under RCP8.5 (varying from +0.6% to 9.0%).. In contrast, increases for the mid-future period under RCP 4.5 (varying from +2.3% to +14.2%) are commonly lower than those of RCP 2.6 (varying from 8.6% to 18.8%).
Interannual streamflow increases for the near-future horizon are generally higher under RCP 4.5 (varying from +15.6% to +24.6%) than under RCP 2.6 (varying from +7.8% to +17.7%), but considerably lower under RCP8.5 (varying from +0.6% to 9.0%). In contrast, increases for the mid-future period under RCP 4.5 (varying from +2.3% to +14.2%) are commonly lower than those of RCP 2.6 (varying from 8.6% to 18.8%). Overall, streamflow increases are considerably lower under RCP 8.5, except for the Chirripó Pacífico River which exhibits an increase of +19.2%. The Tempisque River on the other hand, shows a slight decrease of −2.5%.
Positive interannual streamflow increases are noticeably less significant during the far-future period under RCP2.6 and 4.5 for all catchments except for the Chirripó Pacífico river, where RCP2.6 and 4.5 reach values of +13.1% and +9.5% respectively. Substantial annual runoff decreases are expected for the far-future period (2071–2100) under RCP 8.5. In the case of the Tempisque River, such decrease reaches in average −32.65% (−6.3% under RCP4.5). The Morote, Bebedero and Barrancas rivers show runoff decreases varying from −12.0% to −16.7%. The less significant runoff decrease nevertheless, is related to the Chirripó Pacífico River (−3.2%), which coincides with finding by Veas-Ayala et al., (2018), where only marginal changes were observed in terms of precipitation under RCPs 4.5 and 8.5 [119] Furthermore, significant seasonal changes in monthly runoff volumes are expected during the EWS and LWS peaks, exhibiting a wider range of impacts across all catchments (Figure 12). The MSD streamflow minimum will likely experience marked decreases for all reference catchments during the mid-future period under RCP 8.5, varying from −8.7% to −23.2% with the exception of the Chirripó Pacífico river, that shows an increase of +15.1% (Table 4). Higher differences on the MSD streamflow minimum are expected for the far-future period (2071–2100) as radiative forcing increases, with RPC 8.5 showing runoff decreases between −44.6% and −59.8% for the Bebedero and Tempisque rivers respectively. In contrast, the LWS streamflow peak will likely experience considerable runoff increases in the near-future horizon, with values ranging from +9.6% to +15.9% under RCP 2.6 and from +18.7% to +21.9% under RCP 4.5 depending on the catchment. As expected, October runoff peaks are considerably lower under RCP 8.5, with values ranging from +3.2% to 12.0%. For the mid-future period on the other hand, positive increases on the October peak are also expected across all reference catchments under RCPs 2.6 and 4.5, with increasing importance under RCP 8.5 (varying from +3.8% to +23.9%). Slightly less significant, but still positive streamflow increases are expected under RCP 8.5 during the far-future period (2071–2100) except for the Tempisque, Barrancas and Bebedero rivers where decreases of −21.1%, −3.8% and −0.2% are anticipated. Overall, streamflow projections are consistent with future changes in precipitation. Wetter conditions due to increasing precipitation for the near-future and mid-future horizons under RCPs 2.6 and 4.5 would result in higher interannual runoff volumes across all reference catchments. On the contrary, dryer conditions during the far-future period under RCP 8.5 would result in considerably lower runoff volumes. Consistently, a significant decline in EWS runoff and a considerable increase in LWS runoff are expected in all reference catchments under RCP 8.5 towards the end of the century. Surprisingly, both extreme negative and positive runoff changes are predicted under RCP 8.5. This phenomenon is due to the strong precipitation-runoff relationship on all catchments. Indeed, an increase in precipitation would lead to an increase in runoff and vice versa. Furthermore, responses in runoff volumes highlight that precipitation is the main process influencing upward/downward runoff shifts across all reference catchments.
Streamflow increases as those projected under RCP 2.6 and 4.5 might be beneficial for the agricultural but could potentially have adverse consequences in downstream catchment infrastructure including bridges, roads, drainage systems and agriculture assets [120]. It may also cause increases in the frequency of overflows, which would likely result in potential flooding and higher sediment volumes being transported towards the downstream parts of each catchment, especially for the near-future (2011–2040) and mid-future (2041–2070) horizons, which potential impacts should be further analyzed by means of fully-distributed two-dimensional (2D) hydrodynamic models [38,121]. On the other hand, extreme low flows during the Mid-Summer Drought towards the end of the century under RCP 8.5, could lead to earlier and more extended droughts. Under this scenario, streamflow in the dry season could be too low to fulfill requirements for drinking water supply, crops irrigation and livestock activities. Lastly, it must be acknowledged that variances in projected streamflows do exist and are the combinations of the uncertainties associated to the GCM-RCM ensemble itself, the various RCPs considered and the inherent biases derived from the historical optimization of the GR2M model.

4. Conclusions

In the present study, the impacts of climate change on the streamflow characteristics of five tropical catchments located in the Pacific region of Costa Rica namely Tempisque, Morote, Bebedero, Barrancas and Chirripó Pacífico were analyzed. These catchments were selected based on their significance to the country in terms of water supply, agriculture, power generation and forestry, as well as data availability in terms of long-term series of discharge measurements.
Historical and futures projections from an ensemble of four General Circulation Models (EC-EARTH, HadGEM2-ES, MPI-ESM-LR and MIROC5) dynamically downscaled by two Regional Climate Models (RCA4 and PRECIS) for a total of five different GCM-RCM configurations, were considered to evaluate future changes in precipitation and temperature for a near-future (2011–2040), mid-future (2041–2070) and far-future (2071–2100) period under emission scenarios RCPs 2.6, 4.5 and 8.5 using the control period 1961–1990.
The conceptual spatially-lumped GR2M hydrological model was used to reproduce the historical monthly surface runoff patterns of each catchment. Based on the results from five performance metrics, namely the Nash and Sutcliffe efficiency criteria (NSE), the Kling-Gupta efficiency (KGE), the percentage bias (PBIAS) and the Pearson correlation coefficient (R), it can be concluded that the GR2M hydrological model is suitable in properly reproducing monthly and seasonal streamflow dynamics of the five reference catchments, as satisfactory values for all metrics were achieved in both calibration and validation periods. Accordingly, the GR2M model was confidently used for the evaluation of future climate change scenarios across all reference catchments. It is worth noting that all catchments considered have positive gradients towards the Northwest Pacific region of Costa Rica, which suggests that the performance of the GR2M model might significantly vary for catchments located along the Southeast Pacific of the Caribbean regions of the country.
Concerning historical results from the GCM-RCM model ensemble, most configurations were able to correctly simulate the dynamics of precipitation and temperature annual cycles across all catchments during the baseline period 1961–1990. However, considerable biases do exist between uncorrected GCM-RCM outputs and observations. The uncorrected multimodel ensemble-mean (MEM) on the other hand, generally exhibits better performance when compared to individual members for both precipitation and temperature. In consequence, the delta-change method was applied to correct the biases of future precipitation and temperature projections of GCM-RCM members before forcing climatic data into the GR2M hydrological model.
Results from the bias-corrected multimodel ensemble-mean (MEM) anticipate significant changes in the seasonal distribution of precipitation and temperature for all reference catchments. In terms of precipitation, even when the bimodal distribution pattern remains essentially the same, precipitation volumes are expected to increase in the near future period (2011–2040) for all reference catchments under RCP 2.6 and 4.5, with slightly wetter conditions under RCP 4.5.
For the mid-future (2041–2070) period, RCPs 4.5 and 8.5 show evidence of a consistently decreasing trend in summer precipitation during the early wet season (EWS), but an increase in autumn precipitation during the late wet season (LWS), with RCP 2.6 showing persistently wetter conditions throughout the year regardless of catchment domain.
In contrast, markedly dryer conditions with increasing radiative forcing are expected across all reference catchments during the far-future (2041–2070) period, especially during the Mid-Summer Drought (MSD), with more pronounced reductions for RCP 8.5. At the same time, a significant increase in precipitation for the autumn peak (SON) is also expected regardless of RCP. In comparison, projected temperature trends show that the monsoonal mean annual cycle of temperature will experience consistently warmer conditions with increasing radiative forcing and future period, with unprecedented increases for the far-future (2071–2100) period under RPC 8.5 as temperature rises will be higher than +4.0 °C in all reference catchments.
Using the future bias-corrected multimodel ensemble-mean (MEM) simulations to force the GR2M hydrological model revealed that future surface streamflow responses would significantly vary in terms of future period, radiative forcing and catchment domain. These responses however, are mainly dominated by variations in projected precipitation. On the whole, runoff projections are consistent with future changes in precipitation. Wetter conditions due to increasing precipitation for the near-future and mid-future horizons under RCPs 2.6 and 4.5 would result in higher interannual runoff volumes for all reference catchments. On the contrary, dryer conditions during the far-future period under RCP8.5 would result in considerably lower runoff volumes. More importantly, a significant decline in summer runoff and a considerable increase in autumn runoff is expected across all reference catchments under RCP 8.5 towards the end of the century.
Streamflow increases as those projected under RCP 2.6 and 4.5 could have adverse consequences in downstream catchment infrastructure including bridges, roads, drainage systems and agriculture assets. Conversely, extreme low flows during the Mid-Summer Drought towards the end of the century under RCP 8.5, could lead to earlier and more extended droughts. Under this scenario, streamflow in the dry season could be too low to fulfill requirements for drinking water supply, power generation, crop irrigation and livestock activities. Altogether, these results suggest that surface runoff responses for all reference catchments could be significantly impacted in the future, particularly at the end of the 21st century and therefore, policies should be developed to properly adapt to climate change.
Accordingly, these findings will provide local water management authorities useful information to support decision-making about the potential impacts of climate change on surface runoff to ensure environmental and economic sustainability. Even when the findings of this study are specific to the studied catchments, the methodology followed could be applied in other climatic regions with similar characteristics. Nevertheless, these results need to be complemented by additional studies comparing: (a) different hydrological models of higher temporal resolution depending on forecasting needs (lumped, semi-distributed and fully-distributed two-dimensional (2D)), (b) contrasting local and global parameter optimization techniques for better parameter identifiability, (c) inclusion of more specific performance metrics, (d) regionalization and transferability of optimum parameters, (e) incorporation of improved higher resolution GCM-RCM configurations, and (f) implementation of water conservation measures.

Author Contributions

M.M., L.-A.C.-V. and J.-A.H.-M. designed the project and drafted the manuscript. M.M. coded the entire R software. B.M., P.I., D.H.-G. and L.-F.A.-G. provided writing ideas and supervised the study. M.M., P.I., B.M. and D.H.-G. edited and finalized the manuscript. M.M. and L.-F.A.-G. collected and curated the observed data. All authors have read and agreed to the published version of the manuscript.

Funding

This research received no external funding.

Institutional Review Board Statement

Not applicable.

Informed Consent Statement

Not applicable.

Data Availability Statement

The data presented in this study (R-code, raw-data, results and ggplot2 graphic-code) are available in GitHub at: https://github.com/maikelonu/Research_Future_Precipitation_Ensemble_GCM_RCM_RCP; https://github.com/maikelonu/Research_Temperature_ET0_Climatologies_Machine_Learning; https://github.com/maikelonu/Research_Precipitation_Climatologies_Costa_Rica.

Acknowledgments

This research was supported by Vicerrectoría de Investigación & Extensión, Instituto Tecnológico de Costa Rica (TEC) specifically for the research project entitled “Evaluación del impacto del Cambio Climático futuro sobre cuencas hidrológicas destinadas al abastecimiento de agua potable en Costa Rica”.

Conflicts of Interest

The authors declare no conflict of interest.

References

  1. Huntington, T.G. Evidence for intensification of the global water cycle: Review and synthesis. J. Hydrol. 2006, 319, 83–95. [Google Scholar] [CrossRef]
  2. Thompson, J.R.; Iravani, H.; Clilverd, H.M.; Sayer, C.D.; Heppell, C.M.; Axmacher, J.C. Simulation of the Hydrological Impacts of Climate Change on a Restored Floodplain. Hydrol. Earth Syst. Sci. 2017, 62, 2482–2510. [Google Scholar] [CrossRef] [Green Version]
  3. Donevska, K.; Panov, A. Climate Change Impact on Water Supply Demands: Case Study of the City of Skopje. Water Supply. 2019, 7, 2172–2178. [Google Scholar] [CrossRef]
  4. Olsson, J.; Arheimer, B.; Borris, M.; Donnelly, C.; Foster, K.; Nikulin, G.; Persson, M.; Perttu, A.-M.; Uvo, C.; Viklander, M.; et al. Hydrological Climate Change Impact Assessment at Small and Large Scales: Key Messages from Recent Progress in Sweden. Climate 2016, 4, 39. [Google Scholar] [CrossRef] [Green Version]
  5. Saha, G.C.; Quinn, M. Integrated Surface Water and Groundwater Analysis under the Effects of Climate Change, Hydraulic Fracturing and Its Associated Activities: A Case Study from Northwestern Alberta, Canada. Hydrology 2020, 7, 70. [Google Scholar] [CrossRef]
  6. Quesada-Chacón, D.; Barfus, K.; Bernhofer, C. Climate Change Projections and Extremes for Costa Rica Using Tailored Predictors from CORDEX Model Output through Statistical Downscaling with Artificial Neural Networks. Int. J. Climatol. 2021, 41, 211–232. [Google Scholar] [CrossRef]
  7. Zubler, E.M.; Fischer, A.M.; Fröb, F.; Liniger, M.A. Climate Change Signals of CMIP5 General Circulation Models over the Alps–Impact of Model Selection. Int. J. Climatol. 2016, 36, 3088–3104. [Google Scholar] [CrossRef]
  8. Teutschbein, C.; Seibert, J. Bias correction of regional climate model simulations for hydrological climate-change impact studies: Review and evaluation of different methods. J. Hydrol. 2012, 456, 12–29. [Google Scholar] [CrossRef]
  9. Tran Anh, Q.; Taniguchi, K. Coupling Dynamical and Statistical Downscaling for High-Resolution Rainfall Forecasting: Case Study of the Red River Delta, Vietnam. Prog. Earth. Planet. Sci. 2018, 5, 28. [Google Scholar] [CrossRef]
  10. Piani, C.; Haerter, J.O.; Coppala, E. Statistical bias correction for daily precipitation in regional climate models over Europe. Theor. Appl. Climatol. 2010, 99, 187–192. [Google Scholar] [CrossRef]
  11. Ayugi, B.; Tan, G.; Ruoyun, N.; Babaousmail, H.; Ojara, M.; Wido, H.; Mumo, L.; Ngoma, N.H.; Nooni, I.K.; Ongoma, V. Quantile Mapping Bias Correction on Rossby Centre Regional Climate Models for Precipitation Analysis over Kenya, East Africa. Water 2020, 12, 801. [Google Scholar] [CrossRef] [Green Version]
  12. Wilcke, R.; Mendlik, T.; Gobiet, A. Multi-variable error correction of regional climate Models. Clim. Change 2013, 120, 871–887. [Google Scholar] [CrossRef] [Green Version]
  13. Themeßl, M.J.; Gobiet, A.; Heinrich, G. Empirical-statistical downscaling and error correction of regional climate models and its impact on the climate change signal. Clim. Change 2012, 112, 449–468. [Google Scholar] [CrossRef]
  14. Maraun, D.; Wetterhall, F.; Ireson, A.M.; Chandler, R.E.; Kendon, E.J.; Widmann, M.; Brienen, S.; Rust, H.W.; Sauter, T.; Themeßl, M.; et al. Precipitation downscaling under climate change: Recent developments to bridge the gap between dynamical models and the end user. Rev. Geophys. 2010, 48, RRG3003. [Google Scholar] [CrossRef] [Green Version]
  15. Kotlarski, S.; Keuler, K.; Christensen, O.B.; Colette, A.; Déqué, M.; Gobiet, A.; Goergen, K.; Jacob, D.; Lüthi, D.; van Meijgaard, E.; et al. Regional climate modeling on European scales: A joint standard evaluation of the EURO CORDEX RCM ensemble. Geosci. Model. Dev. 2014, 7, 1297–1333. [Google Scholar] [CrossRef] [Green Version]
  16. Maraun, D. Bias correction, quantile mapping, and downscaling: Revisiting the inflation issue. J. Climate 2013, 26, 2137–2143. [Google Scholar] [CrossRef] [Green Version]
  17. Reiter, P.; Gutjahr, O.; Schefczyk, L.; Heinemann, G.; Casper, M. Bias correction of 332 ENSEMBLES precipitation data with focus on the effect of the length of the calibration period. Meteorol. Z. 2016, 25, 85–96. [Google Scholar] [CrossRef]
  18. Halmstad, A.; Najafi, M.R.; Moradkhani, H. Analysis of precipitation extremes with the assessment of regional climate models over the Willamette River Basin, USA. Hydrol. Processes 2013, 27, 2579–2590. [Google Scholar] [CrossRef]
  19. Gudmundsson, L.; Bremnes, J.; Haugen, J.; Engen-Skaugen, T. Technical Note: Downscaling RCM precipitation to the station scale using statistical transformations—A comparison of methods. Hydrol. Earth Syst. Sci. 2012, 16, 3383–3390. [Google Scholar] [CrossRef] [Green Version]
  20. Teutschbein, C.; Seibert, J. Is bias correction of Regional Climate Model (RCM) simulations possible for non-stationary conditions? Hydrol. Earth. Syst. Sci. 2013, 17, 5061–5077. [Google Scholar] [CrossRef]
  21. Yang, X.; Wood, E.F.; Sheffield, J.; Ren, L.; Zhang, M.; Wang, Y. Bias Correction of Historical and Future Simulations of Precipitation and Temperature for China from CMIP5 Models. J. Hydrometeor. 2018, 19, 609–623. [Google Scholar] [CrossRef]
  22. Luo, M.; Liu, T.; Meng, F.; Duan, Y.; Bao, A.; Xing, W. Identifying climate change impacts on water resources in Xinjiang, China. Sci. Total Environ. 2019, 676, 613–626. [Google Scholar] [CrossRef] [PubMed]
  23. Ghimire, U.; Srinivasan, G.; Agarwal, A. Assessment of rainfall bias correction techniques for improved hydrological simulation. Int. J. Climatol. 2019, 39, 2386–2399. [Google Scholar] [CrossRef]
  24. Sood, A.; Smakhtin, V. Global hydrological models: A review. Hydrol. Sci. J. 2015, 60, 549–565. [Google Scholar] [CrossRef]
  25. Moradkhani, H.; Sorooshian, S. General Review of Rainfall-Runoff Modeling: Model Calibration, Data Assimilation, and Uncertainty Analysis. In Hydrological Modelling and the Water Cycle; Water Science and Technology Library; Sorooshian, S., Hsu, KL., Coppola, E., Tomassetti, B., Verdecchia, M., Visconti, G., Eds.; Springer: Berlin/Heidelberg, Germany, 2018; Volume 63. [Google Scholar] [CrossRef] [Green Version]
  26. Fowler, K.; Coxon, G.; Freer, J.; Peel, M.; Wagener, T.; Western, A.; Woods, R.; Zhang, L. Simulating Runoff Under Changing Climatic Conditions: A Framework for Model Improvement. Water Resour. Res. 2018, 54, 9812–9832. [Google Scholar] [CrossRef] [Green Version]
  27. Beven, K.J. How far can we go in distributed hydrological modelling? Hydrol. Earth Syst. Sci. 2001, 5, 1–12. [Google Scholar] [CrossRef]
  28. de Vos, N.J.; Rientjes, T.H.M. Constraints of artificial neural networks for rainfall-runoff modelling: Trade-offs in hydrological state representation and model evaluation. Hydrol. Earth Syst. Sci. 2005, 9, 111–126. [Google Scholar] [CrossRef] [Green Version]
  29. Parajka, J.; Merz, R.; Blöschl, G. Uncertainty and Multiple Objective Calibration in Regional Water Balance Modelling: Case Study in 320 Austrian Catchments. Hydrol. Processes 2007, 21, 435–446. [Google Scholar] [CrossRef]
  30. Duan, Q.; Sorooshian, S.; Gupta, V.K. Effective and efficient global optimization for conceptual rainfall runoff models. Water Resour. Res. 1992, 24, 1163–1173. [Google Scholar] [CrossRef]
  31. Donigan, A.; Bicknell, B.; Imhoff, J.C. Hydrological Simulation Program—FORTRAN (HSPF). In Computer Models of Watershed Hydrology; Singh, V.P., Ed.; Water Resources Publications Highlands Ranch: Littleton, CO, USA, 1995; pp. 395–442. [Google Scholar]
  32. Pulido-Velazquez, D.; Collados-Lara, A.J.; Pérez-Sánchez, J.; Segura-Méndez, F.J.; Senent-Aparicio, J. Climate Change Impacts on the Streamflow in Spanish Basins Monitored under Near-Natural Conditions. J. Hydrol. Reg. Stud. 2021, 38, 100937. [Google Scholar] [CrossRef]
  33. Seibert, J.; Vis, M.J.P. Teaching hydrological modeling with a user-friendly catchment-runoff-model software package. Hydrol. Earth Syst. Sci. 2012, 16, 3315–3325. [Google Scholar] [CrossRef] [Green Version]
  34. Perrin, C.; Michel, C.; Andréassian, V. Does a large number of parameters enhance model performance? Comparative assessment of common catchment model structures on 429 catchments. J. Hydrol. 2001, 242, 275–301. [Google Scholar] [CrossRef]
  35. Gupta, H.V.; Sorooshian, S.; Yapo, P.O. Toward improved calibration of hydrologic models: Multiple and noncommensurable measures of information. Water Resour. Res. 1998, 34, 751–763. [Google Scholar] [CrossRef] [Green Version]
  36. Beven, K.J. Towards integrated environmental models of everywhere: Uncertainty, data and modelling as a learning process. Hydrol. Earth Syst. Sci. 2007, 11, 460–467. [Google Scholar] [CrossRef]
  37. Beven, K.J.; Binley, A. The future of distributed models: Model calibration and uncertainty prediction. Hydrol. Processes 1992, 6, 279–298. [Google Scholar] [CrossRef]
  38. Mendez, M.; Calvo-Valverde, L. Comparison of global and local optimization methods for the calibration and sensitivity analysis of a conceptual hydrological model. Tecnol. Marcha. 2019, 32, 24–36. [Google Scholar] [CrossRef]
  39. Jones, R.N.; Chiew, F.H.S.; Boughton, W.C.; Zhang, L. Estimating the Sensitivity of Mean Annual Runoff to Climate Change Using Selected Hydrological Models. Adv. Water Resour. 2006, 29, 1419–1429. [Google Scholar] [CrossRef] [Green Version]
  40. Block, P.J.; Souza Filho, F.A.; Sun, L.; Kwon, H.-H. A Streamflow Forecasting Framework Using Multiple Climate and Hydrological Models. J. Am. Water Resour. Assoc. 2009, 45, 828–843. [Google Scholar] [CrossRef]
  41. Alamou, E.A.; Obada, E.; Afouda, A. Assessment of Future Water Resources Availability under Climate Change Scenarios in the Mékrou Basin, Benin. Hydrology 2017, 4, 51. [Google Scholar] [CrossRef]
  42. Pérez-Sánchez, J.; Senent-Aparicio, J.; Segura-Méndez, F.; Pulido-Velazquez, D.; Srinivasan, R. Evaluating Hydrological Models for Deriving Water Resources in Peninsular Spain. Sustainability 2019, 11, 2872. [Google Scholar] [CrossRef] [Green Version]
  43. Jaiswal, R.K.; Ali, S.; Bharti, B. Comparative Evaluation of Conceptual and Physical Rainfall–Runoff Models. Appl. Water Sci. 2020, 10, 48. [Google Scholar] [CrossRef] [Green Version]
  44. Ditthakit, P.; Pinthong, S.; Salaeh, N.; Binnui, F.; Khwanchum, L.; Kuriqi, A.; Khedher, K.M.; Pham, Q.B. Performance Evaluation of a Two-Parameters Monthly Rainfall-Runoff Model in the Southern Basin of Thailand. Water 2021, 13, 1226. [Google Scholar] [CrossRef]
  45. Mouelhi, S.; Michel, C.; Perrin, C.; Andréassian, V. Stepwise development of a two parameter monthly water balance model. J. Hydrol. 2006, 318, 200–214. [Google Scholar] [CrossRef]
  46. Ibrahim, B.; Wisser, D.; Barry, B.; Fowe, T.; Aduna, A. Hydrological Predictions for Small Ungauged Watersheds in the Sudanian Zone of the Volta Basin in West Africa. J. Hydrol. 2015, 4, 386–397. [Google Scholar] [CrossRef] [Green Version]
  47. Topalović, Ž.; Todorović, A.; Plavšić, J. Evaluating the Transferability of Monthly Water Balance Models under Changing Climate Conditions. Hydrol. Sci. J. 2020, 65, 928–950. [Google Scholar] [CrossRef]
  48. Huard, D.; Mailhot, A. Calibration of hydrological model GR2M using Bayesian uncertainty analysis. Water Resour. Res. 2008, 44, W02424. [Google Scholar] [CrossRef] [Green Version]
  49. Nief, H.; Paturel, J.E.; Servat, E. Study of parameter stability of a lumped hydrologic model in a context of climatic variability. J. Hydrol. 2003, 278, 213–230. [Google Scholar] [CrossRef]
  50. Ardoin-Bardin, S.; Dezetter, A.; Servat, E.; Paturel, J.E.; Mahé, G.; Niel, H.; Dieulin, C. Using General Circulation Model Outputs to Assess Impacts of Climate Change on Runoff for Large Hydrological Catchments in West Africa. Hydrol. Sci. J. 2009, 54, 77–89. [Google Scholar] [CrossRef]
  51. Soro, G.; Yao, A.; Kouame, Y.; Bi, T. Climate Change and Its Impacts on Water Resources in the Bandama Basin, Côte D’ivoire. Hydrology 2017, 4, 18. [Google Scholar] [CrossRef]
  52. Bouabdelli, S.; Meddi, M.; Zeroual, A.; Alkama, R. Hydrological Drought Risk Recurrence under Climate Change in the Karst Area of Northwestern Algeria. J. Water Clim. Change 2020, 11, 164–188. [Google Scholar] [CrossRef]
  53. Rau, P.; Bourrel, L.; Labat, D.; Ruelland, D.; Frappart, F.; Lavado, W.; Dewitte, B.; Felipe, O. Assessing Multidecadal Runoff (1970-2010) Using Regional Hydrological Modelling under Data and Water Scarcity Conditions in Peruvian Pacific Catchments. Hydrol. Processes 2019, 33, 20–35. [Google Scholar] [CrossRef] [Green Version]
  54. Marchane, A.; Tramblay, Y.; Hanich, L.; Ruelland, D.; Jarlan, L. Climate Change Impacts on Surface Water Resources in the Rheraya Catchment (High Atlas, Morocco). Hydrol. Sci. J. 2017, 62, 979–995. [Google Scholar] [CrossRef]
  55. Giorgi, F. Climate change hot-spots. Geophys. Res. Lett. 2006, 33, L08707. [Google Scholar] [CrossRef]
  56. Amador, J.A.; Alfaro, E.J.; Rivera, E.R.; Calderon, B. Climatic features and their relationship with tropical cyclones over the Intra-Americas seas. In Hurricanes and Climate Change; Springer: Dordrecht, The Netherlands, 2010; pp. 149–173. [Google Scholar] [CrossRef]
  57. IPCC. Contribution of Working Groups I, II and III to the Fifth Assessment Report of the Intergovernmental Panel on Climate Change; Climate Change 2014: Synthesis Report; IPCC: Geneva, Switzerland, 2014; 151p, ISBN 978-92-9169-143-2. [Google Scholar]
  58. Cabos, W.; Sein, D.V.; Duran-Quesada, A.; Liguori, G.; Koldunov, N.V.; Martínez-López, B.; Alvarez, F.; Sieck, K.; Limareva, N.; Pinto, J.G. Dynamical downscaling of historical climate over CORDEX Central America domain with a regionally coupled atmosphere–ocean model. Clim. Dyn. 2019, 52, 4305. [Google Scholar] [CrossRef] [Green Version]
  59. Neelin, J.D.; Münnich, M.; Su, Hu.; Meyerson, J.E.; Holloway, C.E. Tropical drying trends in global warming models and observations. Proc. Natl. Acad. Sci. USA 2006, 103, 6110–6115. [Google Scholar] [CrossRef] [Green Version]
  60. Aguilar, E.; Peterson, T.C.; Obando, P.R.; Frutos, R.; Retana, J.A.; Solera, M.; Soley, J.; García, I.G.; Araujo, R.M.; Santos, A.R.; et al. Changes in precipitation and temperature extremes in Central America and northern South America, 1961–2003. J. Geophys. Res. 2006, 110, D23107. [Google Scholar] [CrossRef]
  61. Biasutti, M.; Sobel, A.H.; Camargo, S.J.; Creyts, T.T. Projected changes in the physical climate of the Gulf Coast and Caribbean. Clim. Change 2011, 112, 819–845. [Google Scholar] [CrossRef] [Green Version]
  62. Nakaegawa, T.; Kitoh, A.; Murakami, H.; Kusunoki, S. Annual maximum 5-day rainfall total and maximum number of consecutive dry days over Central America and the Caribbean in the late twenty-first century projected by an atmospheric general circulation model with three different horizontal resolutions. Theor. Appl. Climatol. 2014, 116, 155–168. [Google Scholar] [CrossRef]
  63. Karmalkar, A.V.; Taylor, M.A.; Campbell, J.; Stephenson, T.; New, M.; Centella, A.; Charlery, J.A. Review of observed and projected changes in climate for the islands in the Caribbean. Atmosfera 2013, 26, 283–309. [Google Scholar] [CrossRef] [Green Version]
  64. Rauscher, S.A.; Giorgi, F.; Diffenbaugh, N.S.; Seth, A. Extension and Intensification of the Meso-American mid-summer drought in the twenty-first century. Clim. Dyn. 2008, 31, 551–571. [Google Scholar] [CrossRef]
  65. Imbach, P.; Molina, L.; Locatelli, B.; Roupsard, O.; Mahé, G.; Neilson, R.; Corrales, L.; Scholze, M.; Ciais, P. Modeling Potential Equilibrium States of Vegetation and Terrestrial Water Cycle of Mesoamerica under Climate Change Scenarios. J. Hydrometeorol. 2012, 13, 665–680. [Google Scholar] [CrossRef] [Green Version]
  66. Hidalgo, H.G.; Amador, J.A.; Alfaro, E.J.; Quesada, B. Hydrological Climate Change Projections for Central America. J. Hydrol. 2013, 495, 94–112. [Google Scholar] [CrossRef]
  67. Imbach, P.; Chou, S.C.; Lyra, A.; Rodrigues, D.; Latinovic, D.; Siqueira, G.; Silva, A.; Garofolo, L.; Georgiou, S. Future climate change scenarios in Central America at high spatial resolution. PLoS ONE 2018, 13, e0193570. [Google Scholar] [CrossRef] [Green Version]
  68. Mendez, M.; Maathuis, B.; Hein-Griggs, D.; Alvarado-Gamboa, L.-F. Performance Evaluation of Bias Correction Methods for Climate Change Monthly Precipitation Projections over Costa Rica. Water 2020, 12, 482. [Google Scholar] [CrossRef] [Green Version]
  69. Quesada-Román, A.; Campos-Durán, D. Natural Disaster Risk Inequalities in Central America. Pap. Appl. Geogr. 2022. [Google Scholar] [CrossRef]
  70. Waylen, P.R.; Harrison, M. The coincidence of daily rainfall events in Liberia, Costa Rica and tropical cyclones in the Caribbean basin. Int. J. Climatol. 2005, 25, 1665–1674. [Google Scholar] [CrossRef]
  71. Amador, J.A. The Intra-Americas Sea Low-level Jet. Ann. N. Y. Acad. Sci. 2008, 1146, 153–188. [Google Scholar] [CrossRef] [Green Version]
  72. Magaña, V.; Amador, J.A.; Medina, S. The midsummer drought over Mexico and Central America. J. Climate. 1999, 12, 1577–1588. [Google Scholar] [CrossRef]
  73. Quesada-Román, A. Landslide Risk Index Map at the Municipal Scale for Costa Rica. Int. J. Disaster. Risk. Reduct. 2021, 56, 102144. [Google Scholar] [CrossRef]
  74. Wang, C.; Lee, S.K. Atlantic warm pool, Caribbean low-level jet, and their potential impact on Atlantic hurricanes. Geophys. Res. Lett. 2007, 34, L02703. [Google Scholar] [CrossRef] [Green Version]
  75. Vargas, A.B.; Trejos, V.F.S. Changes in the general circulation and its influences on precipitation trends in Central America: Costa Rica. Ambio 1994, 23, 87–90. [Google Scholar]
  76. Alfaro, E.J. Response of Air Surface Temperatures over Central America to Oceanic Climate Variability Indices. Investig. Mar. 2002, 30. [Google Scholar] [CrossRef]
  77. Mendez, M.; Calvo-Valverde, L.-A.; Maathuis, B.; Alvarado-Gamboa, L.-F. Generation of Monthly Precipitation Climatologies for Costa Rica Using Irregular Rain-Gauge Observational Networks. Water 2019, 11, 70. [Google Scholar] [CrossRef] [Green Version]
  78. Méndez, M.; Calvo-Valverde, L.A. Comparison Performance of Machine Learning and Geostatistical Methods for the Interpolation of Monthly Air Temperature over Costa Rica. IOP Conf. Ser. Earth Environ. Sci. 2020, 432, 012011. [Google Scholar] [CrossRef]
  79. Rojas, O.E. Estudio agroclimático de Costa Rica; Proyecto de Agroclimatología; IICA: San José, Costa Rica, 1985; p. 177. ISSN 05345301. [Google Scholar]
  80. JAXA, ALOS Global Digital Surface Model “ALOS World 3D-30m” (AW3D30). Japan Aerospace Exploration Agency. 2015. Available online: https://www.eorc.jaxa.jp/ALOS/en/aw3d30/aw3d30v31_product_e_a.pdf (accessed on 1 January 2022).
  81. Jones, R.G.; Nouger, M.; Hassell, D.C.; Hassell, D.; Wilson, S.S.; Jenkins, G.J.; Mitchell, J.F.B. Generating High Resolution Climate Change Scenarios Using PRECIS; Met Office Hadley Centre Report; Met Office Hadley Centre: Exeter, UK, 2004; p. 40. [Google Scholar]
  82. Gutowski, W.J.; Giorgi, F.; Timbal, B.; Frigon, A.; Jacob, D.; Kang, H.-S.; Raghavan, K.; Lee, B.; Lennard, C.; Nikulin, G.; et al. WCRP Coordinated Regional Downscaling EXperiment (CORDEX): A diagnostic MIP for CMIP6. Geosci. Model Dev. 2016, 9, 4087–4095. [Google Scholar] [CrossRef] [Green Version]
  83. Massey, N.; Jones, R.; Otto, F.E.L.; Aina, T.; Wilson, S.; Murphy, J.M.; Hassell, D.; Yamazaki, Y.H.; Allen, M.R. weather@home—development and validation of a very large ensemble modelling system for probabilistic event attribution. Q.J.R. Meteorol. Soc. 2015, 141, 1528–1545. [Google Scholar] [CrossRef]
  84. Jones, C.; Giorgi, F.; Asrar, G. The coordinated regional downscaling experiment: CORDEX—An international downscaling link to CMIP5. Clivar Exch. 2011, 56, 34–49. [Google Scholar]
  85. Räty, O.; Räisänen, J.; Ylhäisi, J.S. Evaluation of delta change and bias correction methods for future daily precipitation: Intermodel cross-validation using ENSEMBLES simulations. Clim. Dyn. 2014, 42, 2287–2303. [Google Scholar] [CrossRef]
  86. Shrestha, M.; Acharya, S.C.; Shrestha, P.K. Bias correction of climate models for hydrological modelling–are simple methods still useful. Meteorol. Appl. 2017, 24, 531–539. [Google Scholar] [CrossRef] [Green Version]
  87. Dobler, C.; Hagemann, S.; Wilby, R.L.; Stötter, J. Quantifying different sources of uncertainty in hydrological projections in an Alpine watershed. Hydrol. Earth Syst. Sci. 2012, 16, 4343–4360. [Google Scholar] [CrossRef]
  88. Coron, L.; Thirel, G.; Delaigue, O.; Perrin, C.; Andréassian, V. The Suite of Lumped GR Hydrological Models in an R Package. Environ. Model. Softw. 2017, 94, 166–171. [Google Scholar] [CrossRef]
  89. Michel, C. Hydrologie appliquée aux petits bassins ruraux. In Hydrology Handbook; CEMAGREF: Antony, France, 1991. (In French) [Google Scholar]
  90. Klemeš, V. Operational testing of hydrological simulation models. Hydrolog. Sci J. 1986, 31, 13–24. [Google Scholar] [CrossRef]
  91. Mendez, M.; Calvo-Valverde, L. Development of the HBV-TEC Hydrological Model. Procedia Eng. 2016, 154, 1116–1123. [Google Scholar] [CrossRef] [Green Version]
  92. Perrin, C.; Michel, C.; Andreassian, V. Modèles hydrologiques du Génie Rural (GR); Cemagref, UR Hydrosystèmes et Bioprocédés Parc de Tourvoie; Cemagref: Paris, France, 2007; 16p. [Google Scholar]
  93. Gupta, H.V.; Kling, H.; Yilmaz, K.K.; Martinez, G.F. Decomposition of the mean squared error and NSE performance criteria: Implications for improving hydrological modelling. J. Hydrol. 2009, 377, 80–91. [Google Scholar] [CrossRef] [Green Version]
  94. Gupta, H.V.; Sorooshian, S.; Yapo, P.O. Status of automatic calibration for hydrologic models: Comparison with multilevel expert calibration. J. Hydrol. Eng. 1999, 4, 135–143. [Google Scholar] [CrossRef]
  95. Camera, C.; Bruggeman, A.; Hadjinicolaou, P.; Pashiardis, S.; Lange, M.A. Evaluation of Interpolation Techniques for the Creation of Gridded Daily Precipitation (1 × 1 Km2); Cyprus, 1980-2010: Gridded Daily Precipitation. J. Geophys. Res. Atmos. 2014, 119, 693–712. [Google Scholar] [CrossRef]
  96. Moriasi, D.N.; Arnold, J.G.; Van Liew, M.W.; Bingner, R.L.; Harmel, R.D.; Veith, T.L. Model evaluation guidelines for systematic quantification of accuracy in watershed simulations. Trans. ASABE. 2007, 50, 885–900. [Google Scholar] [CrossRef]
  97. Trinh-Tuan, L.; Matsumoto, J.; Tangang, F.T. Application of Quantile Mapping Bias Correction for Mid-Future Precipitation Projections over Vietnam. Sola 2019, 15, 1–6. [Google Scholar] [CrossRef] [Green Version]
  98. WMO. Guidelines on the Calculation of Climate Normals; No. 1203; WMO Publisher: Geneva, Switzerland, 2017; ISBN 978-92-63-11203-3. [Google Scholar]
  99. R Core Team. R: A Language and Environment For Statistical Computing; R Foundation for Statistical Computing: Vienna, Austria, 2022; Available online: https://www.r-project.org (accessed on 1 January 2022).
  100. Seibert, J.; Beven, K.J. Gauging the ungauged basin: How many discharge measurements are needed? Hydrol. Earth Syst. Sci. 2009, 13, 883–892. [Google Scholar] [CrossRef] [Green Version]
  101. Campbell, J.D.; Taylor, M.A.; Stephenson, T.S.; Watson, R.A.; Whyte, F.S. Future climate of the Caribbean from a regional climate model. Int. J. Climatol. 2011, 31, 1866–1878. [Google Scholar] [CrossRef]
  102. Magaña, V.; Caetano, E. Temporal evolution of summer convective activity over the Americas warm pools. Geophys. Res. Lett. 2005, 32, L02803. [Google Scholar] [CrossRef]
  103. Seibert, J. Reliability of model predictions outside calibration conditions. Hydrol. Res. 2003, 34, 477–492. [Google Scholar] [CrossRef] [Green Version]
  104. Rapp, A.D.; Peterson, A.G.; Frauenfeld, O.W.; Quiring, S.M.; Roark, E.B. Climatology of Storm Characteristics in Costa Rica using the TRMM Precipitation Radar. J. Hydrometeorol. 2014, 15, 2615–2633. [Google Scholar] [CrossRef]
  105. Chen, J.; Brissette, F.P.; Chaumont, D.; Braun, M. Finding appropriate bias correction methods in downscaling precipitation for hydrologic impact studies over North America. Water Resour. Res. 2013, 49, 4187–4205. [Google Scholar] [CrossRef]
  106. Martínez-Castro, D.; Vichot-Llano, A.; Bezanilla-Morlot, A.; Centella-Artola, A.; Campbell, J.; Giorgi, F.; Viloria-Holguin, C.C. The Performance of RegCM4 over the Central America and Caribbean Region Using Different Cumulus Parameterizations. Clim. Dyn. 2018, 50, 4103–4126. [Google Scholar] [CrossRef]
  107. Karmalkar, A.V.; Bradley, R.S.; Diaz, H.F. Climate change in Central America and Mexico: Regional climate model validation and climate change projections. Clim. Dyn. 2011, 37, 605–629. [Google Scholar] [CrossRef] [Green Version]
  108. Diallo, I.; Sylla, M.B.; Giorgi, F.; Gaye, A.T.; Camara, M. Multimodel GCM-RCM Ensemble-Based Projections of Temperature and Precipitation over West Africa for the Early 21st Century. Int. J. Geophys. 2012, 2012, 972896. [Google Scholar] [CrossRef] [Green Version]
  109. Tramblay, Y.; Ruelland, D.; Somot, S.; Bouaicha, R.; Servat, E. High-resolution Med-CORDEX regional climate model simulations for hydrological impact studies: A first evaluation of the ALADIN-Climate model in Morocco. Hydrol. Earth Syst. Sci. 2013, 17, 3721–3739. [Google Scholar] [CrossRef] [Green Version]
  110. Angelina, A.; Gado Djibo, A.; Seidou, O.; Seidou Sanda, I.; Sittichok, K. Changes to Flow Regime on the Niger River at Koulikoro under a Changing Climate. Hydrol. Sci. J. 2015, 60, 1709–1723. [Google Scholar] [CrossRef]
  111. Hawkins, E.; Sutton, R. The potential to narrow uncertainty in projections of regional precipitation change. Clim. Dyn. 2011, 37, 407–418. [Google Scholar] [CrossRef]
  112. Lafon, T.; Dadson, S.; Buys, G.; Prudhomme, C. Bias correction of daily precipitation simulated by a regional climate model: A comparison of methods. Int. J. Climatol. 2013, 33, 1367–1381. [Google Scholar] [CrossRef] [Green Version]
  113. Quesada-Román, A. Flood Risk Index Development at the Municipal Level in Costa Rica: A Methodological Framework. Environ. Sci. Policy. 2022, 133, 98–106. [Google Scholar] [CrossRef]
  114. Quesada-Román, A.; Ballesteros-Cánovas, J.A.; Granados-Bolaños, S.; Birkel, C.; Stoffel, M. Improving Regional Flood Risk Assessment Using Flood Frequency and Dendrogeomorphic Analyses in Mountain Catchments Impacted by Tropical Cyclones. Geomorphology 2022, 396, 108000. [Google Scholar] [CrossRef]
  115. Fuentes-Franco, R.; Giorgi, F.; Coppola, E.; Kucharski, F. The role of ENSO and PDO in variability of winter precipitation over North America from twenty first century CMIP5 projections. Clim. Dyn. 2016, 46, 3259–3277. [Google Scholar] [CrossRef]
  116. Blanco-Gómez, P.; Jimeno-Sáez, P.; Senent-Aparicio, J.; Pérez-Sánchez, J. Impact of Climate Change on Water Balance Components and Droughts in the Guajoyo River Basin (El Salvador). Water 2019, 11, 2360. [Google Scholar] [CrossRef] [Green Version]
  117. Jiménez-Rodríguez, C.D.; Calvo-Alvarado, J.C.; Jackson, J.K. Performance of Two Hydrological Models in Predicting Daily Flow under a Climate Change Scenario for Mountainous Catchments in Northwestern Costa Rica. Mt. Res. Dev. 2015, 35, 240–253. [Google Scholar] [CrossRef]
  118. Vichot-Llano, A.; Martinez-Castro, D.; Bezanilla-Morlot, A.; Centella-Artola, A.; Gil-Reyes, L.; Torres-Alavez, J.A.; Corrales-Suastegui, A.; Giorgi, F. Caribbean Low-Level Jet Future Projections Using a Multiparameter Ensemble of RegCM4 Configurations. Int. J. Climatol. 2022, 42, 1544–1559. [Google Scholar] [CrossRef]
  119. Veas-Ayala, N.; Quesada-Román, A.; Hidalgo, H.G.; Alfaro, E.J. Humedales del Parque Nacional Chirripó, Costa Rica: Características, relaciones geomorfológicas y escenarios de cambio climático. Rev. Biol. Trop. 2018, 66, 1436. [Google Scholar] [CrossRef]
  120. Tolentino, P.L.M.; Poortinga, A.; Kanamaru, H.; Keesstra, S.; Maroulis, J.; David, C.P.C.; Ritsema, C.J. Projected Impact of Climate Change on Hydrological Regimes in the Philippines. PLoS ONE 2016, 11, e0163941. [Google Scholar] [CrossRef] [Green Version]
  121. Quesada-Román, A.; Ballesteros-Cánovas, J.A.; Granados-Bolaños, S.; Birkel, C.; Stoffel, M. Dendrogeomorphic Reconstruction of Floods in a Dynamic Tropical River. Geomorphology 2020, 359, 107133. [Google Scholar] [CrossRef]
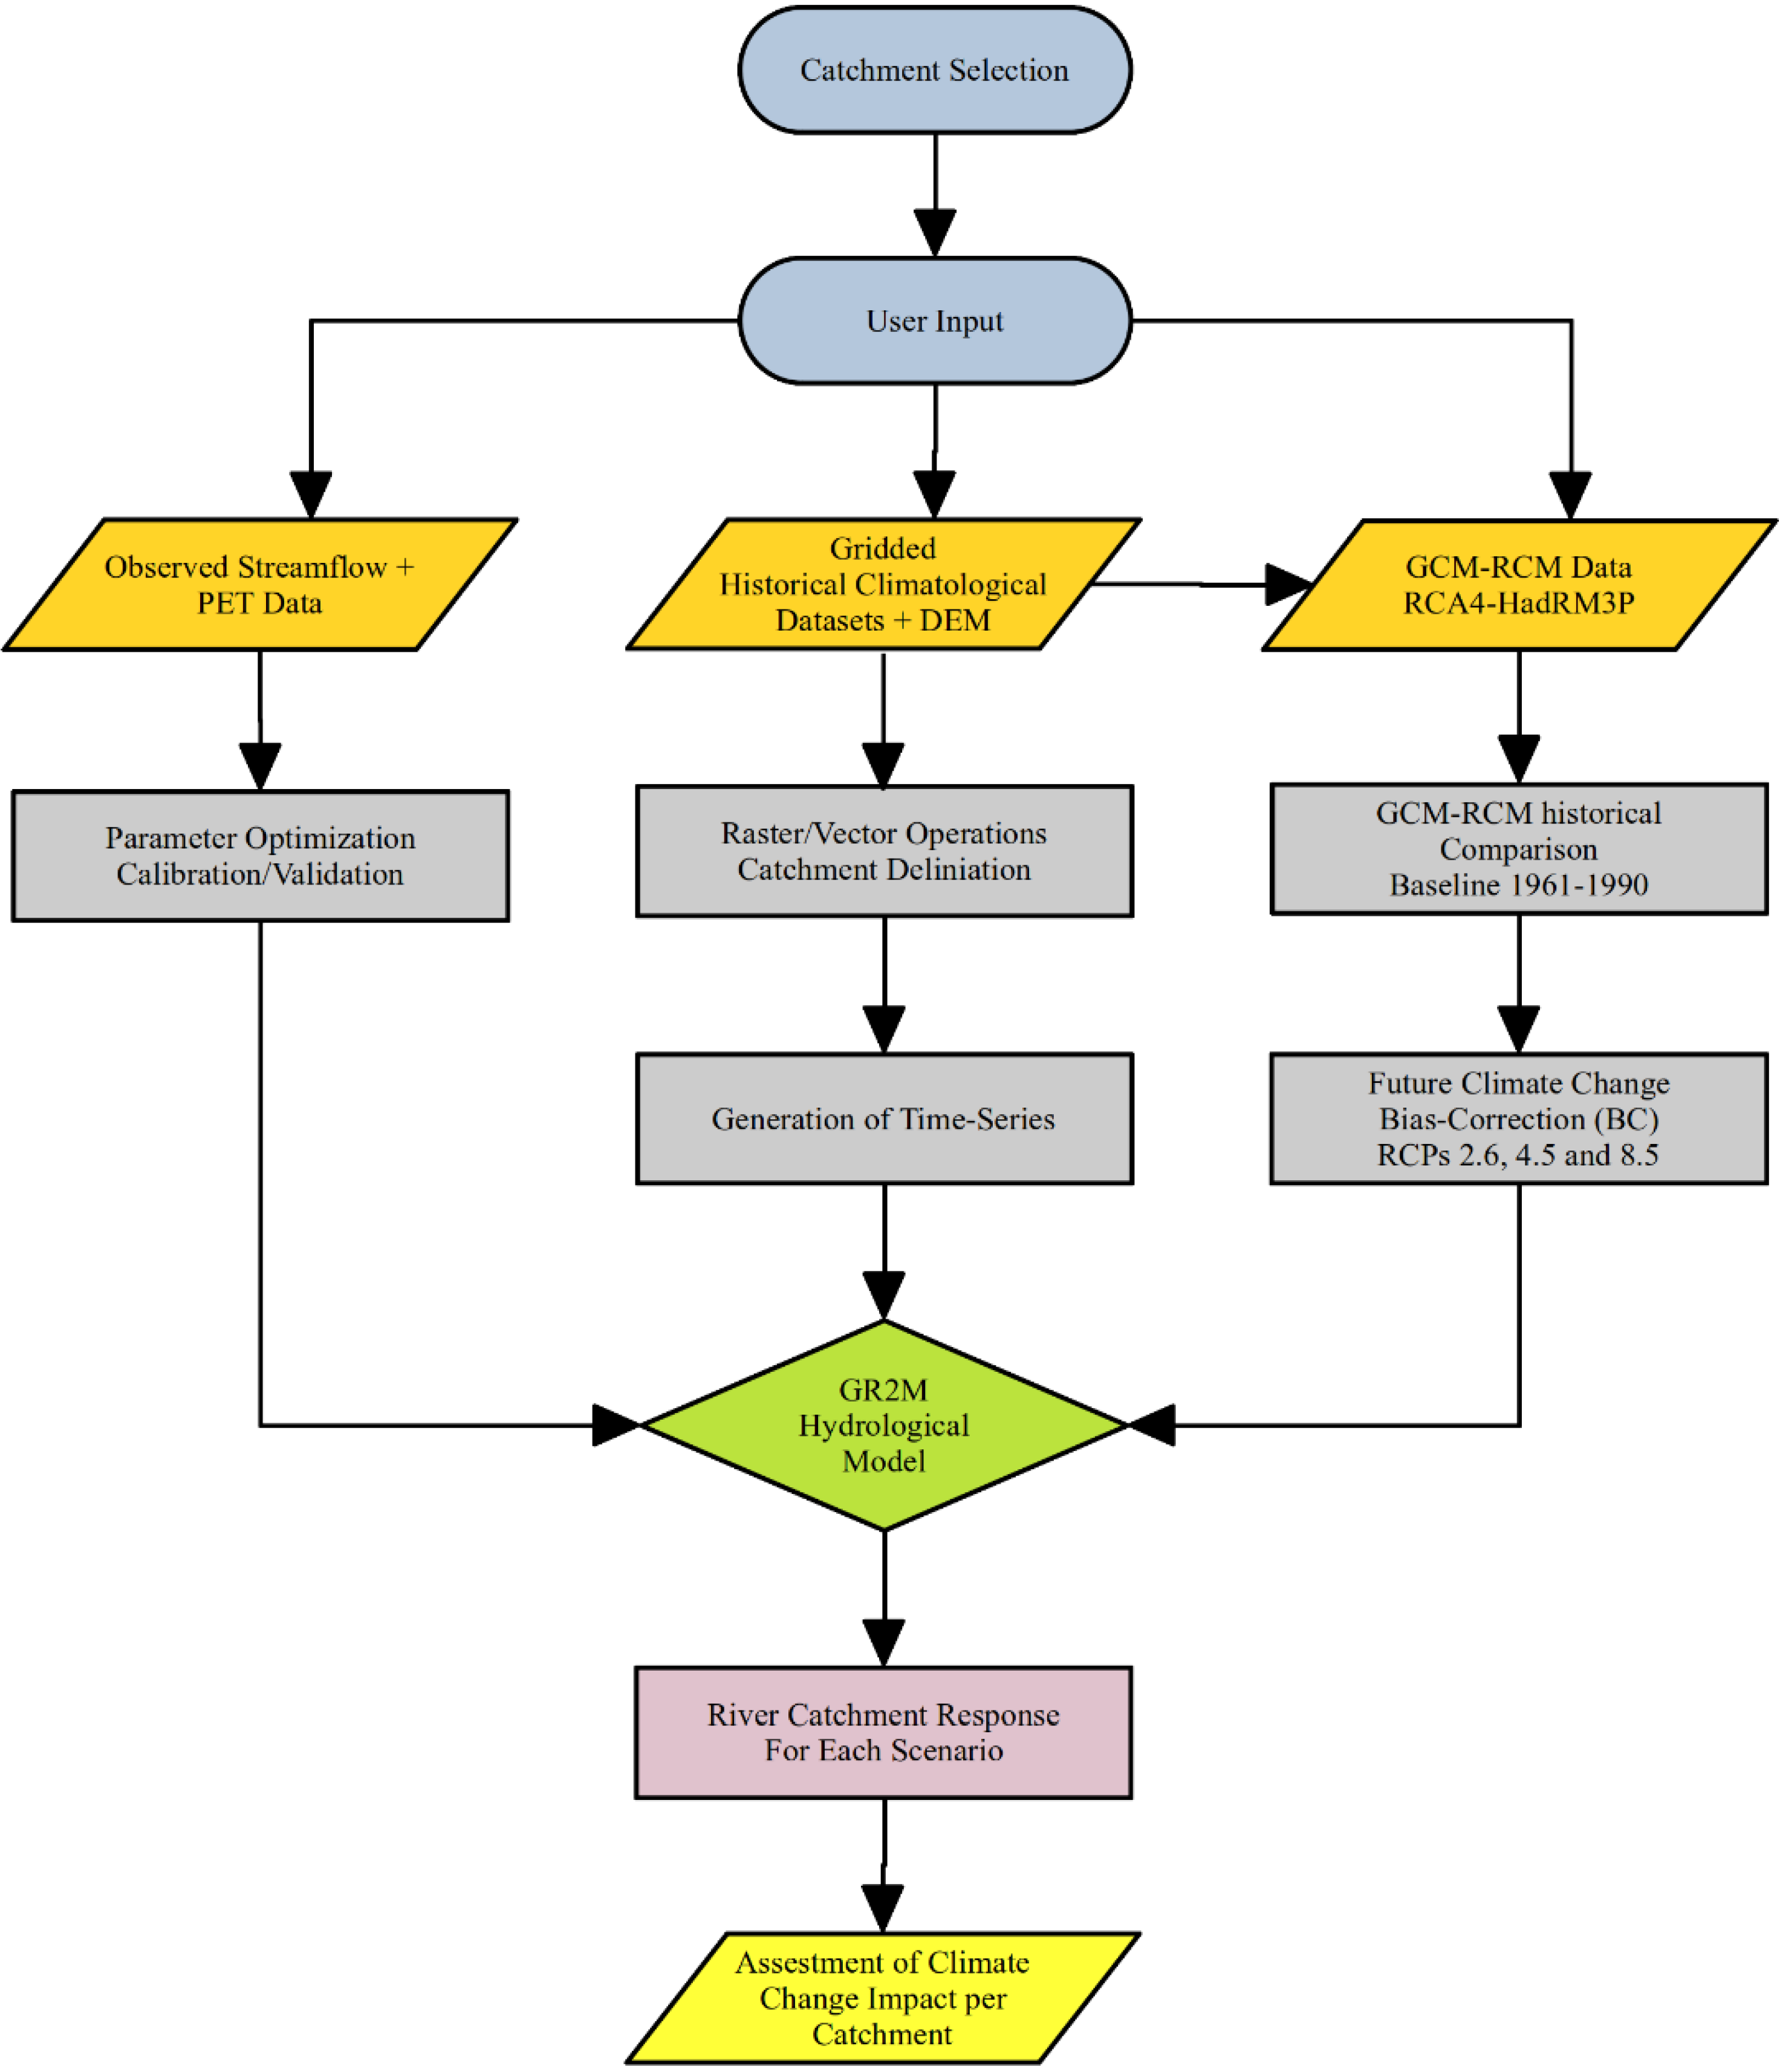
Figure 1. Flowchart of the methodology adopted in this study.
Sustainability 14 16938 g001
Figure 2. (a) Position and location of catchments and Digital Elevation Model (DEM) in Costa Rica (abbreviations refer to catchments codes) and (b) Position of the Costa Rica within the Central American isthmus.
Sustainability 14 16938 g002
Figure 3. Structure schematics of the GR2M hydrological model [45].
Sustainability 14 16938 g003
Figure 4. Monthly observed and simulated hydrographs for the five reference catchments during the calibration and validation periods.
Sustainability 14 16938 g004
Figure 5. Monthly observed and simulated scatter plots for the five reference catchments for the calibration and validation periods.
Sustainability 14 16938 g005
Figure 6. Spatially-averaged observed and uncorrected GCM-RCM mean annual cycle of precipitation during the baseline period 1961–1990 for the five reference catchments.
Sustainability 14 16938 g006
Figure 7. Spatially-averaged observed and uncorrected GCM-RCM mean annual cycle of temperature during the baseline period 1961–1990 for the five reference catchments.
Sustainability 14 16938 g007
Figure 8. Comparison of monthly spatially-averaged precipitation between baseline period (1961–1990) and near-future (2011–2040), mid-future (2041–2070) and far-future (2071–2100) periods under RCPs 2.6, 4.5 and 8.5 for the GCM-RCM multimodel ensemble-mean (MEM) for the five reference catchments.
Sustainability 14 16938 g008
Figure 9. Interannual spatially-averaged percentage-change (PC) in precipitation between baseline period (1961–1990) and near-future (2011–2040), mid-future (2041–2070) and far-future (2071–2100) periods under RCPs 2.6, 4.5 and 8.5 for the GCM-RCM multimodel ensemble-mean (MEM) for the five reference catchments.
Sustainability 14 16938 g009
Figure 10. Comparison of monthly spatially-averaged temperature between baseline period (1961–1990) and near-future (2011–2040), mid-future (2041–2070) and far-future (2071–2100) periods under RCPs 2.6, 4.5 and 8.5 for the GCM-RCM multimodel ensemble-mean (MEM) for the five reference catchments.
Sustainability 14 16938 g010
Figure 11. Interannual spatially-averaged absolute change in temperature between baseline period (1961–1990) and near-future (2011–2040), mid-future (2041–2070) and far-future (2071–2100) periods under RCPs 2.6, 4.5 and 8.5 for the GCM-RCM multimodel ensemble-mean (MEM) for the five reference catchments.
Sustainability 14 16938 g011
Figure 12. Projected changes in runoff GCM-RCM multimodel ensemble-mean (MEM) between baseline period (1961–1990) and near-future (2011–2040), mid-future (2041–2070) and far-future (2071–2100) periods under RCPs 2.6, 4.5 and 8.5 for the GCM-RCM multimodel ensemble-mean (MEM) for the five reference catchments.
Sustainability 14 16938 g012
Table 1. Summary of catchments characteristics. Where: A: drainage area; P: perimeter; Min Alt: minimum altitude; Max Alt: maximum altitude; S: mean slope; P: mean annual precipitation; T: mean daily temperature PET: mean annual potential evapotranspiration; Cal: calibration period; Val: validation period.
CatchAPMin AltMax AltSPTPETCalVal
Tempisque92923213190630.47199125.610901961–19691980–1988
Morote2691061684828.86205726.910981970–19751976–1981
Bebedero13061192154327.85250223.911351969–19801984–1990
Barrancas21212023028630.10261423.211231977–19831984–1990
Chirripó Pacífico32281790380032.19337618.211621971–19801980–1990
Table 2. General Circulation Models (GCMs) and Regional Climate Models (RCMs) configuration. Where: X: available dataset; O: unavailable dataset.
Driving GCM-ModelCountryGCM Model-CenterRCMRCM Model-CenterRCM ResolutionSourceRCP2.6RCP4.5RCP8.5
HadGEM2-ESUKMet Office Hadley CentreHadRM3PMet Office Hadley Centre0.22° × 0.22°ITCRXXX
CanESM2CanadaCanadian Centre for Climate Modelling and AnalysisRCA4Swedish (SHMI)0.44° × 0.44°CORDEXOOX
EC-EARTHIrelandIrish Centre For High-End ComputingRCA4Swedish (SHMI)0.44° × 0.44°CORDEXXXX
HadGEM2-ESUKMet Office Hadley CentreRCA4Swedish (SHMI)0.44° × 0.44°CORDEXXXX
MIROC5JapanThe University of Tokyo Center for Climate System ResearchRCA4Swedish (SHMI)0.44° × 0.44°CORDEXXOX
MPI-ESM-LRGermanyMax Planck Institute for MeteorologyRCA4Swedish (SHMI)0.44° × 0.44°CORDEXXXX
Table 3. Range of GR2M model performance in calibration and validation.
OptimizationCalibrationValidation
CatchmentX1X2NSEKGERPBIASNSEKGERPBIAS
Tempisque2980.9580.9630.812 (very good)0.893 (very good)0.907 (very good)−4.810 (very good)0.737 (good)0.801 (very good)0.881 (very good)15.180 (good)
Morote772.7840.9680.931 (very good)0.958 (very good)0.965 (very good)−1.230 (very good)0.792 (very good)0.864 (very good)0.897 (very good)8.880 (very good)
Bebedero2298.4720.8880.811 (very good)0.825 (very good)0.902 (very good)1.680 (very good)0.710 (good)0.806 (very good)0.845 (very good)3.720 (very good)
Barrancas2951.2970.9930.894 (very good)0.913 (very good)0.946 (very good)0.630 (very good)0.882 (very good)0.842 (very good)0.944 (very good)1.790 (very good)
Chirripó Pacífico2368.4710.9680.899 (very good)0.876 (very good)0.951 (very good)2.480 (very good)0.816 (very good)0.885 (very good)0.912
Table 4. Interannual and monthly (July and October) projected changes in runoff GCM-RCM multimodel ensemble-mean (MEM) between baseline period (1961–1990) and near-future (2011–2040), mid-future (2041–2070) and far-future (2071–2100) periods under RCPs 2.6, 4.5 and 8.5 for the GCM-RCM multimodel ensemble-mean (MEM) for the five reference catchments.
July Mass-Balance-Change [%]
RCP2011-20402041-20702071-2100Catchment
RCP268.42.2−5.6Tempisque
RCP4515.6−10.8−23.7Tempisque
RCP85−9.1−23.2−59.8Tempisque
RCP2625.119.24.3Morote
RCP4538.05.9−10.3Morote
RCP855.9−12.9−56.4Morote
RCP267.59.6−2.5Bebedero
RCP4521.1−2.8−8.2Bebedero
RCP85−0.9−13.5−44.6Bebedero
RCP2610.415.41.0Barrancas
RCP4529.2−4.1−10.7Barrancas
RCP851.5−8.7−46.6Barrancas
RCP2617.527.619.9Chirripó Pacífico
RCP4541.6−9.8−10.7Chirripó Pacífico
RCP854.815.1−45.2Chirripó Pacífico
October Mass-Balance-Change [%]
RCP2011-20402041-20702071-2100Catchment
RCP2610.99.54.7Tempisque
RCP4521.913.58.3Tempisque
RCP853.23.8−21.1Tempisque
RCP2615.914.113.3Morote
RCP4519.827.427.0Morote
RCP8512.018.421.8Morote
RCP269.68.65.0Bebedero
RCP4518.716.617.8Bebedero
RCP855.911.3−0.2Bebedero
RCP2610.18.15.1Barrancas
RCP4520.514.813.6Barrancas
RCP855.111.4−3.8Barrancas
RCP2615.69.013.3Chirripó Pacífico
RCP4520.419.921.6Chirripó Pacífico
RCP8510.923.923.1Chirripó Pacífico
Future Annual Mass-Balance-Change [%]
RCP2011_20402041_20702071_2100Catchment
RCP2610.28.61.1Tempisque
RCP4517.82.3−6.3Tempisque
RCP850.6−2.5−32.6Tempisque
RCP2617.718.88.8Morote
RCP4524.614.27.4Morote
RCP859.08.7−12.0Morote
RCP267.89.62.2Bebedero
RCP4515.67.15.0Bebedero
RCP853.53.8−13.3Bebedero
RCP269.312.23.9Barrancas
RCP4518.56.53.0Barrancas
RCP854.25.8−16.7Barrancas
RCP2614.415.713.1Chirripó Pacífico
RCP4521.010.99.5Chirripó Pacífico
RCP858.219.2−3.2Chirripó Pacífico
Publisher’s Note: MDPI stays neutral with regard to jurisdictional claims in published maps and institutional affiliations.