Abstract
Taiwan’s electronics industry usually outsources most of its important components for production to enhance market competitiveness and operational flexibility. The quality of all component products is important to ensure the quality of the final product. In electronic assembly, printed circuit boards (PCBs) are key components that carry other electronic components to provide a stable circuit working environment. Surface Mounted Technology (SMT) is the mainstream technology in electronic assembly plants. Obviously, good SMT process quality is relatively important to the final product quality. The process capability index (PCI) is the most widely used process quality evaluation tool in the industry. Therefore, this paper used the PCI representing quality as the green outsourcer selection tool for the SMT process, derived the confidence interval of PCI to develop a quality evaluation model of green outsourcers, and considered the model as the green outsourcer selection model. Meanwhile, this model can be provided to enterprises, outsourcers, or suppliers to evaluate and improve the process quality of components to ensure the quality of components and final products. Since the selection model is based on confidence intervals, it can reduce the risk of misjudgment due to sampling error.
1. Introduction
Some studies believe that with the development and rapid evolution of emerging technologies, such as the Internet of Things (IOT), innovation in various industries around the world is being pushed forward, and the manufacturing industry is also moving toward the goal of smart manufacturing by integrating and applying related technologies [1,2,3]. In addition, some studies have pointed out that in order to enhance market competitiveness and operational flexibility, enterprises usually outsource most of their components for production or procurement, except for some of the important components that they are good at manufacturing [4,5,6,7]. In fact, the quality of all component products is relatively important, and the quality of all component products must meet the required quality level to ensure the quality of the final product. According to this concept, Lin et al. [8] and Besseris [9] believe that through the information and communication technology (ICT) and the production data analysis model, a cloud platform for the evaluation and analysis of production data and process quality can be constructed, providing enterprises, outsourcers, or suppliers with a tool to evaluate, analyze, and improve the process quality evaluation of component products [1,2]. At the same time, enterprises can also collect and integrate relevant production data offered to the design and production of next-generation products for reference. Furthermore, they can help outsourcers or suppliers improve their processes, form partnerships, and grow together. The cooperation between enterprises and outsourcers or suppliers can assist in moving toward the goal of smart manufacturing and smart management [10,11].
In addition, driven by a strong clustering effect, Taiwan’s electronics industry has established an important position in the global electronics industry. With respect to wafer foundry or IC packaging and testing, their output values and market shares rank among the best in the world [3,12]. According to some studies, making electronic products thin and light has become the trend of the future [13,14,15]. In order to achieve the goal of making products thinner and lighter, the miniaturization of chips and other electronic components is bound to develop rapidly, and the material technologies needed are constantly innovated. Therefore, the easiest way to achieve the goal of miniaturizing electronic products is to use smaller electronic components. In electronic assembly, printed circuit boards (PCBs) are key components that carry other electronic components to provide a stable circuit working environment [16]. In SMT, the electronic parts are welded on the surface of PCBs and can greatly reduce the volume of electronic products and render them lighter, thinner, shorter, and smaller [17,18]. Due to the volume and lightweight after assembly, they provide good technical support for subsequent processes [19].
According to the above, if the evaluation model of production data and process quality constructed by the cloud platform can be used directly as a selection tool for outsourcers or suppliers, it will help promote the process quality of the entire industry chain, including the enterprise itself and all outsourcers or suppliers. As noted by some studies, when the quality level of the outsourcer’s process is raised, it can lower the ratio of process scrap and rework and reduce the social losses of environmental pollution, such as carbon emissions caused by breakdown maintenance after the product is sold [3,7]. For example, Chen et al. [11] pointed out that for every 10,000 products, 668 products were reworked or scrapped, fewer than ever. As a result, the outsourcer becomes the so-called green outsourcer forming a green sustainable industry chain. Therefore, according to this concept, this paper proposes a quality-based green outsourcer selection model for the surface-mounted technology process in the electronics industry. Since the process capability index (PCI) is a unitless numerical quantification method adopted to present the process quality performance, it is generally regarded as a tool to evaluate whether the process quality meets customer requirements [20,21]. Consequently, this paper will use the PCI to represent quality and view it as a green outsourcer selection tool of the surface-mounted technology process. Since the index has unknown parameters, if the index is selected directly based on the point estimate of the index, the risk of misjudgment due to sampling error will increase [22,23,24]. Hence, this paper will develop a quality evaluation model of green outsourcers based on the confidence interval of the index, serving as a green outsourcer selection model at the same time. Since the applied evaluation tool is the PCI widely used in the industry, the outsourcer selection model is highly likely to be adopted and promoted by the industry. The outsourcer selection method is a statistical testing model, so the risk of misjudgment caused by sampling error can be reduced. In addition to the evaluation of the outsourcer selection, the PCI can also evaluate the process capabilities of outsourcers, in order to help them improve their process capabilities, reduce the cost loss of rework and scrap for poor process quality, diminish pollution caused by maintenance or failure, and become green outsourcers.
The remainder of this paper is organized as follows. Section 2 is the literature review. Section 3 is the research method, deriving the 100 (1 – α)% confidence interval of the outsourcer selection index. Then, based on this confidence interval of the outsourcer selection index, the selection model is constructed. In Section 4, this paper will take the green outsourcer selection of the surface-mounted technology process as an example to demonstrate the applicability of the proposed approach. Finally, Section 5 provides conclusions.
2. Literature Review
Some studies have pointed out that third-party logistics (3PL) service providers are critical and important to achieving the sustainable development of enterprises. A large number of theoretical model studies have applications in real-world situations. Many of the developed theoretical selection models are applicable to survey studies in the automotive industry, agricultural industry, aquatic products, etc. [25,26]. Different from the above outsourcer or supplier investigation and research model, the green outsourcer selection model proposed in this paper is based on the relevant literature viewpoints concerning the quality of energy-saving and carbon-reducing green manufacturing [3,7]. In addition, based on the actual production data, the selection rules established by the theoretical model of statistical testing can lower the risk of poor selections [11,27,28,29]. Thus, this paper aims to discuss the green outsourcer selection model, which can develop energy-saving and carbon reduction based on the electronics industry. Many studies have pointed out that improving product quality can not only enhance the value and competitiveness of products but also reduce the proportion of rework and scrap to achieve energy saving and carbon reduction [30,31,32]. Therefore, this paper adopted the quality tool most widely used in the industry, that is, the confidence interval of the process capability index, to develop the green outsourcer selection model. Then, we will review and discuss the relevant literature.
As mentioned earlier, miniaturization, making electronic products smaller, thinner and lighter, has become a future trend, and using smaller electronic parts is the easiest way to achieve miniaturization [16,33]. Many studies have indicated that Taiwan’s electronics industry has established an important position in the global electronics industry [34,35]. Enterprises in the industrial chain pay more and more attention to their core technologies. Accordingly, they outsource non-core processes, at which they are less proficient. The future trend of business models is that enterprises moderately obtain appropriate resources from the outside to jointly participate in production and services [36]. Some studies believe that moderately outsourcing non-core processes can make companies more flexible in using their internal resources and make the entire industry chain develop its specialization [4,5,12]. The outsourcer selection process is based on various kinds of performance metrics of outsourcers. Many research studies point out that the quality of the production process is one of the important indicators in the outsourcer selection [37,38]. Some studies have also suggested that when enterprises choose good outsourcers, the quality performance of raw materials, components, services, and equipment used by outsourcers is very important because it will affect the quality or function of the final product [39,40,41]. Good process quality can lower the ratio of rework and scrap as well as prolonging the time intervals between product failures according to the concept of the Taguchi loss function. Furthermore, it can increase product lifetime as well as reducing total carbon emissions [27].
Obviously, process quality is an important selection indicator for process outsourcing. According to numerous studies, PCIs can provide unitless quantitative values to evaluate outsourcers’ manufacturing capability and performance [42,43]. Let random variable X represent the normal process distribution. Then, the mean of random variable X is , and the standard deviation is , denoted as . Kane [44] proposed the process capability index , which not only can reflect process capability and process yield but is also the most widely used process quality evaluation tool in the industry nowadays [45,46,47]. The index is defined as follows:
where USL and LSL are the upper and lower specification limits, respectively. Let the random variable be:
where T = (USL + LSL)/2 is target value and d = (USL − LSL)/2. Then, Y is normally distributed with mean and standard deviation , denoted by , where is the precision index and is the accuracy index. When the accuracy index is a positive value, it represents a right deviation of the process; when it is a negative value, it represents a left deviation of the process. The ratios of the values deviated from the target values to the upper and lower specification limits are displayed as follows:
and
According to the above-stated, the process capability index is defined as follows:
where
and
In addition, since the index has unknown parameters, the chance of misjudgment will be caused by sampling error if an outsourcer’s process capability is evaluated directly by its point estimate [22,23,24]. Accordingly, many scholars deduced the confidence interval of to evaluate the process capability of the product [48,49]. In addition, some scholars applied the confidence interval of to the verification model developed for process improvement [50,51,52,53]. Moreover, based on the difference and ratio of two values of , Wu and Pear [54] and Wu et al. [55] employed four double-sampling methods so that lower confidence limits were constructed, a simulation analysis was conducted, and performances of all models were compared; meanwhile, these four methods were regarded as the supplier selection rules. Then, this paper will develop the research method based on the literature review on the process capability index. We will derive the confidence interval of process capability indices for statistical testing.
3. Research Method
This study first derived the 100 % confidence interval of the outsourcer selection index. Next, a selection model was constructed based on this confidence interval of the outsourcer selection index. Therefore, Section 3 consists of two subsections. Section 3.1 details the confidence interval of the outsourcer selection index, and Section 3.2 constructs the selection model based on the confidence interval of the outsourcer selection index.
3.1. Confidence Interval of Outsourcer Selection Index
As noted above, the SMT process is currently the mainstream technology in electronic assembly plants. There are 5 measurement points (one point in each of the four corners and one point in the center) for solder paste film thickness in PCBs, as shown in Figure 1.
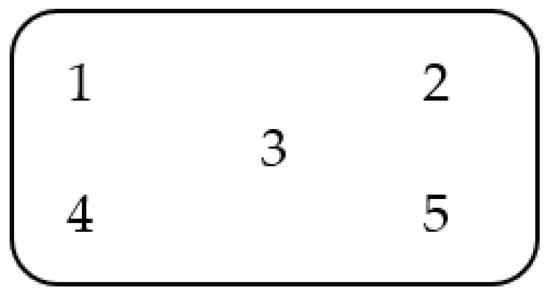
Figure 1.
Five measurement points in PCBs.
In the production control plan of the SMT process, when the thickness of the solder paste film is abnormal, then it cannot effectively prevent the occurrence of short circuits caused by less tin or more tin in the solder joints. Therefore, the thickness of the solder paste film is one of the most important quality characteristics in the SMT process, which belongs to the nominal-the-best quality characteristic. Generally speaking, the tolerance of the solder paste film thickness is , where T represents the thickness of the steel plate and . Let random variable X represent the solder paste film thickness. Based on some studies, random variable X is distributed as , and is distributed as [11,55]. As noted above, the process capability index proposed by Kane [44] can reflect process capability and process yield. Thus, this paper used this indicator as the outsourcer selection indicator for the SMT process. The selection indicator for the hth outsourcer evaluation is displayed as follows:
Let 1, 2, 3, 4, 5 indicate the sample data of outsourcer h for five measurement points of solder paste film thickness, and let the sample size be n. According to Chen et al. [11], the maximum likelihood estimators (MLEs) of and for outsourcer h can be shown as follows:
and
Therefore, the estimator of the process capability index can be shown as follows:
Let random variables be and K, expressed as follows:
and
Based on Chen et al. [56], the random variables and K are distributed as and , respectively. Thus,
and
where is the upper a quantile of , is the lower a quantile of , where is a standard normal distribution. Under the assumption of normality, since and are mutually independent, then and K are also mutually independent. From these relationships, we can further obtain the following equations:
Similarly, let random variable ; then, and K are also mutually independent. We can further obtain the following equation:
Furthermore, let event A and event B be:
and
Then, and , where an event is the complement of event A and an event is the complement of event B. Based on De Morgan’s rule and Boole’s inequality [3,7], we have:
Then, we have
where is the estimator of the index for outsourcer h. That is, is the 100% confidence interval of the index , where
and
3.2. Constructing the Selection Model Based on Confidence Interval
Let represent the observed values of 1, 2, 3, 4, 5; then, observed values of and can be shown as follows:
and
Therefore, is the observed value of 100% confidence interval , where is the observed value of lower confidence limit of and is the observed value of upper confidence limit of for outsourcer h as follows:
and
which is the observed value of the estimator . According to green outsourcer selection rules, three outsourcers share the pairwise comparison statistics test based on the confidence interval of PCI for the SMT process. Subsequently, the outsourcer selection model is established according to Equations (28) and (29). Based on Chen et al. [12], for any two outsourcers a and b, , pairwise comparison test rules for the outsourcer selection are listed below:
- (1)
- If , then outsourcer b is chosen because it ranks higher than outsourcer a;
- (2)
- If , then outsourcer a and outsourcer b are both selected in equal order;
- (3)
- If , then outsourcer a is chosen because it ranks higher than outsourcer b.
Based on statistical test rule (2) with , then we have . Let , then we have
- (1)
- If , then
- (2)
- If then,
In fact, where represents the difference in the quality of the two outsourcers. Obviously, the value of l will be affected by sample size n and D. Next, a sensitivity analysis is performed according to different n and D, as shown in the Table 1 below:

Table 1.
Sensitivity analysis based on sample size n and D.
When the quality difference D of the two outsourcers is fixed, the larger the sample size, the better the difference between the two outsourcers can be distinguished. When the quality difference D of the two outsourcers is larger, the sample size does not need to be too large to distinguish the difference between the two outsourcers.
Based on the pairwise comparison test rules for the outsourcer selection model, we can list the selection ranking of all outsourcers for selection reference. Based on the above, the selection procedure of SMT outsourcers is as follows:
Step 1: Decide sample size n and then collect sample data of all outsourcers;
Step 2: Calculate observed values of , , , and for all outsourcers below:
Step 3: Perform a pairwise comparison statistic test for all outsourcers;
Step 4: Select excellent outsourcers based on pairwise comparison test rules.
4. Results and Discussions: Application Example
An electronics factory located in central Taiwan would like to outsource its SMT process. Assuming that a total of three outsourcers would be selected, this paper explains the selection process based on the outsourcer selection model proposed in Section 3. First, the sample data of the three outsourcers with sample size and were collected. According to the research method proposed in Section 3, there are some relevant statistics that were calculated by Equations (26)–(30) as follows:
Outsourcer 1: Based on the sample data of Outsourcer 1, we can calculate the observed values of some relevant statistics (estimators), including , , , and UCPK10 as follows:
Outsourcer 2: Based on the sample data of Outsourcer 2, we can calculate the observed values of some relevant statistics (estimators), including , , , and as follows:
- 1.49
- 1.49
Outsourcer 3: Based on the sample data of Outsourcer 3, this paper can calculate the observed values of some relevant statistics (estimators), including , , , and as follows:
The summary of the above-mentioned outsourcer evaluation data is shown in Table 2 below:
Table 2.
Outsourcer evaluation data.
As noted above, there is a pairwise comparison statistic test based on the confidence interval of the process capability index for the SMT Process, where = 3. These three pairwise comparisons test rules for the outsourcer selection are illustrated as follows:
Outsourcer 1 vs. Outsourcer 2:
Since , then Outsourcer 2 is chosen because it ranks higher than Outsourcer 1.
Outsourcer 1 vs. Outsourcer 3:
Since , then Outsourcer 3 is chosen because it ranks higher than Outsourcer 1.
Outsourcer 2 vs. Outsourcer 3:
Since , then Outsourcer 2 and Outsourcer 3 are both selected in equal order.
According to the above results, the selection ranking of Outsourcer 2 and Outsourcer 3 is equal, whereas that of Outsourcer 1 is the lowest. According to the principle of statistical hypothesis testing and based on the 300 sample data formed by these three outsourcers’ 60 samples, after the statistical test, there is no significant difference in the quality of Outsourcer 2 and Outsourcer 3. In contrast, the quality level of Outsourcer 2 is significantly higher than that of Outsourcer 1. The quality level of Outsourcer 3 is also significantly higher than that of Outsourcer 1. Therefore, either Outsourcer 2 or Outsourcer 3 can be considered, instead of Outsourcer 1, according to decision rules based on statistical tests. When the number of outsourcers is small, one of the two outsourcers can be chosen for its lower cost; when the number of outsourcers is large, both outsourcers can be considered.
As noted by Chen et al. [3], as global warming becomes increasingly serious, improving product quality can not only reduce carbon emissions during production but also reduce environmental pollution caused by product maintenance or failure, which is very beneficial to the sustainable operation of enterprises and the environment. Although numerous studies have indicated that quality, price, and delivery date are three important indicators for the selection of outsourcers [10,11,12,41], this paper still developed the green outsourcer selection model based on quality, hoping to help enterprises and the environment achieve the goal of sustainable management.
Additionally, this paper adopted the index , most widely used in the industry, as the quality evaluation tool of outsourcers. Therefore, the developed outsourcer selection model is easily understood and adopted by the industry [3,6,7,11,12], so that it can contribute to enhancing the product quality of the industry and outsourcers as well as achieving the goal of fulfilling social responsibility, energy saving, and carbon reduction. Furthermore, the selection method developed by this paper is based on the confidence interval of the index, and the confidence interval is used as a testing tool for selection. Thus, the risk of evaluation misjudgment can be diminished [3,7,12,27,40].
5. Conclusions
Driven by a strong clustering effect, Taiwan’s electronics industry has established an important position in the global electronics industry. To enhance market competitiveness and operational flexibility, companies usually outsource most components for production or procurement, except for some of the important components they are good at manufacturing. The quality of the component products manufactured by outsourcers is relatively important, and the quality of all component products must meet the required quality level so that the quality of the final product can be guaranteed. In addition, PCBs are key components of electronic assembly. SMT is currently the mainstream technology in electronic assembly plants. Therefore, this paper applied the most widely used index in the industry as the quality evaluation tool for outsourcers. The developed outsourcer selection model is easily understood and adopted by the industry. Furthermore, this paper established pairwise statistical comparison test rules for the outsourcer selection with the confidence interval of . This model can also be provided to enterprises and outsourcers or suppliers to evaluate, analyze, and improve the process quality (process capability) of component products in order to ensure the quality of green outsourcers’ components. Since the selection model is based on the confidence interval of the process capability index of outsourcers, it can reduce the risk of misjudgment caused by sampling error.
The quality-based green outsourcer selection model proposed by this paper helps enterprises and outsourcers enhance their quality to reduce the increase in carbon emissions and environmental pollution caused by rework or scrap in production. At the same time, carbon emissions and various losses caused by maintenance can also be cut down. These carbon emissions and losses have not been actuarially calculated. Hence, future research can focus on the benefit evaluation of carbon reduction, contributing to the carbon reduction in global warming.
Author Contributions
Conceptualization, K.-S.C. and K.-K.L.; methodology, K.-S.C., F.-C.L. and K.-K.L.; software, J.-M.L.; validation, J.-M.L.; formal analysis, K.-S.C., F.-C.L. and K.-K.L.; investigation, J.-M.L.; resources, J.-M.L.; data curation, F.-C.L.; writing—original draft preparation, K.-S.C., F.-C.L., K.-K.L. and J.-M.L.; writing—review and editing, K.-S.C. and K.-K.L.; visualization, J.-M.L.; supervision, K.-S.C.; project administration, K.-K.L. All authors have read and agreed to the published version of the manuscript.
Funding
This research received no external funding.
Institutional Review Board Statement
Not applicable.
Informed Consent Statement
Not applicable.
Data Availability Statement
Not applicable.
Conflicts of Interest
The authors declare no conflict of interest.
References
- Gopalakrishnan, S.; Kumaran, M.S. Iiot framework based ml model to improve automobile industry product. Intell. Autom. Soft Comput. 2022, 31, 1435–1449. [Google Scholar] [CrossRef]
- Liu, J.; Ma, C.; Gui, H.; Wang, S. A four-terminal-architecture cloud-edge-based digital twin system for thermal error control of key machining equipment in production lines. Mech. Syst. Signal Proc. 2022, 166, 108488. [Google Scholar] [CrossRef]
- Chen, K.S.; Wang, C.H.; Tan, K.H. Developing a fuzzy green supplier selection model using Six Sigma quality indices. Int. J. Prod. Econ. 2019, 212, 1–7. [Google Scholar] [CrossRef]
- Chu, C.Y.; Park, K.; Kremer, G.E. A global supply chain risk management framework: An application of text-mining to identify region-specific supply chain risks. Adv. Eng. Inform. 2020, 45, 101053. [Google Scholar] [CrossRef]
- Leng, J.; Jiang, P.; Zheng, M. Outsourcer-Supplier Coordination for Parts Machining Outsourcing under Social Manufacturing. Proc. Inst. Mech. Eng. Part B J. Eng. Manuf. 2017, 231, 1078–1090. [Google Scholar] [CrossRef]
- Chang, T.C.; Chen, K.S. Statistical test of two Taguchi Six-Sigma quality indices to select the supplier with optimal processing quality. J. Test. Eval. 2022, 50, 674–688. [Google Scholar] [CrossRef]
- Chen, K.S.; Yu, C.M. Dual dimensional fuzzy testing based on the upper confidence limits for supplier selection. J. Intell. Fuzzy Syst. 2021, 40, 11145–11158. [Google Scholar] [CrossRef]
- Lin, K.P.; Yu, C.M.; Chen, K.S. Production data analysis system using novel process capability indices-based circular economy. Ind. Manag. Data Syst. 2019, 119, 1655–1668. [Google Scholar] [CrossRef]
- Besseris, G.J. Evaluation of robust scale estimators for modified Weibull process capability indices and their bootstrap confidence intervals. Comput. Ind. Eng. 2019, 128, 135–149. [Google Scholar] [CrossRef]
- Lin, C.T.; Hung, K.P.; Hu, S.H. Construction of a supplier evaluation model in the aerospace sector. J. Test. Eval. 2019, 47, 4223–4238. [Google Scholar] [CrossRef]
- Chen, K.S.; Huang, M.C.; Yu, C.M.; Chen, H.Y. Quality-based supplier selection model for products with multi-quality characteristics. Sustainability 2022, 14, 8532. [Google Scholar] [CrossRef]
- Chen, K.S.; Yu, C.M.; Huang, M.L. Fuzzy selection model for quality-based IC packaging process outsourcers. IEEE Trans. Semicond. Manuf. 2022, 35, 102–109. [Google Scholar] [CrossRef]
- Beltrão, M.; Duarte, F.M.; Viana, J.C.; Paulo, V. A review on in-mold electronics technology. Polym. Eng. Sci. 2022, 62, 967–990. [Google Scholar] [CrossRef]
- Buga, C.S.; Viana, J.C. The role of printed electronics and related technologies in the development of smart connected products. Flex. Print. Electron. 2022, 7, 043001. [Google Scholar] [CrossRef]
- Hong, F.; Tendera, L.; Myant, C.; Boyle, D. Vacuum-formed 3D printed electronics: Fabrication of thin, rigid and free-form interactive surfaces. SN Comput. Sci. 2022, 3, 275. [Google Scholar] [CrossRef]
- Wu, C.H.; Hsu, Y.C.; Pearn, W.L. An improved measure of quality loss for notching processes. Qual. Reliab. Eng. Int. 2021, 37, 108–122. [Google Scholar] [CrossRef]
- Schipfer, C.; Gschwandl, M.; Fuchs, P.; Antretter, T.; Feuchter, M.; Morak, M.; Tao, Q.; Schingale, A. Towards virtually optimized curing cycles for polymeric encapsulations in microelectronics. Microelectron. Reliab. 2022, 139, 114799. [Google Scholar] [CrossRef]
- Liu, W.; Zhang, Y.; Yu, X. A novel subpixel industrial chip detection method based on the dual-edge model for surface mount equipment. IEEE Trans Ind. Inform. 2023, 19, 232–242. [Google Scholar] [CrossRef]
- Jager, J.; Buschkamp, S.; Werum, K.; Glaser, K.; Grozinger, T.; Eberhardt, W.; Zimmermann, A. Contacting inkjet-printed silver structures and SMD by ICA and solder. IEEE Trans. Compon. Pack. Manuf. Technol. 2022, 12, 1232–1240. [Google Scholar] [CrossRef]
- Nikzad, E.; Amiri, A.; Amirkhani, F. Estimating total and specific process capability indices in three-stage processes with measurement errors. J. Stat. Comput. Simul. 2018, 88, 3033–3064. [Google Scholar] [CrossRef]
- de-Felipe, D.; Benedito, E. Monitoring high complex production processes using process capability indices. Int. J. Adv. Manuf. Technol. 2017, 93, 1257–1267. [Google Scholar] [CrossRef]
- Yu, C.M.; Lai, K.K.; Chen, K.S.; Chang, T.C. Process-quality evaluation for wire bonding with multiple gold wires. IEEE Access 2020, 8, 106075–106082. [Google Scholar] [CrossRef]
- Chen, K.S. Fuzzy testing of operating performance index based on confidence intervals. Ann. Oper. Res. 2022, 311, 19–33. [Google Scholar] [CrossRef]
- Wang, C.H.; Chen, K.S. New process yield index of asymmetric tolerances for bootstrap method and six sigma approach. Int. J. Prod. Econ. 2020, 219, 216–223. [Google Scholar] [CrossRef]
- Qureshi, M.R.N.M. A bibliometric analysis of third-party logistics services providers (3PLSP) selection for supply chain strategic advantage. Sustainability 2022, 14, 11836. [Google Scholar] [CrossRef]
- Reyes, B.O.V.; Colmenero, J.C. A fuzzy decision-making methodology for third-party logistics selection in the existence of the company’s policy priorities: Case of household appliance manufacturer. Int. J. Logist. Syst. Manag. 2022, 43, 193–237. [Google Scholar] [CrossRef]
- Chen, H.Y.; Lin, K.P. Fuzzy supplier selection model based on lifetime performance index. Expert Syst. Appl. 2022, 208, 118135. [Google Scholar] [CrossRef]
- Wu, C.W.; Liao, M.Y.; Yang, T.T. Efficient methods for comparing two process yields—Strategies on supplier selection. Int. J. Prod. Res. 2013, 51, 1587–1602. [Google Scholar] [CrossRef]
- Wu, Y.; Chen, K.; Zeng, B.; Xu, H.; Yang, Y. Supplier selection in nuclear power industry with extended VIKOR method under linguistic information. Appl. Soft Comput. 2016, 48, 444–457. [Google Scholar] [CrossRef]
- Ertz, M.; Sun, S.; Boily, E.; Kubiat, P.; Quenum, G.G.Y. How transitioning to industry 4.0 promotes circular product lifetimes. Ind. Mark. Manag. 2022, 101, 125–140. [Google Scholar] [CrossRef]
- Feng, Y.; Hong, Z.; Tian, G.; Li, Z.; Tan, J.; Hu, H. Environmentally friendly MCDM of reliability-based product optimisation combining DEMATEL-based ANP, interval uncertainty and vlse kriterijumska optimizacija kompromisno resenje (VIKOR). Inf. Sci. 2018, 442–443, 128–144. [Google Scholar] [CrossRef]
- Roul, J.N.; Maity, K.; Kar, S.; Maiti, M. Multi-item reliability dependent imperfect production inventory optimal control models with dynamic demand under uncertain resource constraint. Int. J. Prod. Res. 2015, 53, 4993–5016. [Google Scholar] [CrossRef]
- Lee, J.R.; Aziz, M.S.A.; Ishak, M.H.H.; Khor, C.Y. A review on numerical approach of reflow soldering process for copper pillar technology. Int. J. Adv. Manuf. Technol. 2022, 121, 4325–4353. [Google Scholar] [CrossRef]
- Kao, F.C.; Huang, S.C.; Lo, H.W. A rough-fermatean DEMATEL approach for sustainable development evaluation for the manufacturing industry. Int. J. Fuzzy Syst. 2022, 24, 3244–3264. [Google Scholar] [CrossRef]
- Suppipat, S.; Hu, A.H. Achieving sustainable industrial ecosystems by design: A study of the ICT and electronics industry in Taiwan. J. Clean. Prod. 2022, 369, 133393. [Google Scholar] [CrossRef]
- Wetzstein, A.; Hartmann, E.; Benton, W.C., Jr.; Hohenstein, N.O. A systematic assessment of supplier selection literature—State-of-the-art and future scope. Int. J. Prod. Econ. 2016, 182, 304–323. [Google Scholar] [CrossRef]
- Thevenin, S.; Ben-Ammar, O.; Brahimi, N. Robust optimization approaches for purchase planning with supplier selection under lead time uncertainty. Eur. J. Oper. Res. 2022, 303, 1199–1215. [Google Scholar] [CrossRef]
- Tsai, C.K.; Phumchusri, N. Fuzzy analytical hierarchy process for supplier selection: A case study in an electronic component manufacturer. Eng. J. Thail. 2021, 25, 73–86. [Google Scholar] [CrossRef]
- Awasthi, A. Supplier quality evaluation using a fuzzy multi criteria decision making approach. Stud. Fuzziness Soft Comput. 2015, 319, 195–219. [Google Scholar]
- Liao, M.Y. Assessing process incapability when collecting data from multiple batches. Int. J. Prod. Res. 2015, 53, 2041–2054. [Google Scholar] [CrossRef]
- Alkahtani, M.; Kaid, H. Supplier selection in supply chain management: A review study. Int. J. Bus. Perform. Supply Chain Model. 2018, 10, 107–130. [Google Scholar] [CrossRef]
- Sardesai, S.; Klingebiel, K. Maintaining viability by rapid supply chain adaptation using a process capability index. Omega 2023, 115, 102778. [Google Scholar] [CrossRef]
- Chatterjee, M. Two-phase multivariate supplier selection for symmetric specification region and correlated quality characteristics. Qual. Reliab. Eng. Int. 2022, 38, 3291–3303. [Google Scholar] [CrossRef]
- Kane, V.E. Process capability indices. J. Qual. Technol. 1986, 18, 41–52. [Google Scholar] [CrossRef]
- Yalçın, S.; Kaya, I. Analyzing of process capability indices based on neutrosophic sets. Comput. Appl. Math. 2022, 41, 287. [Google Scholar] [CrossRef]
- Barreto, R.; Roberto, H.A. Application of a proposed reliability analysis multivariate capability index on manufacturing processes. Qual. Eng. 2022, 34, 1–15. [Google Scholar] [CrossRef]
- Aslam, M.; Rao, G.S.; Ahmad, L.; Jun, C.H. A new control chart using GINI CPK. Commun. Stat. Theory Methods 2022, 51, 197–211. [Google Scholar] [CrossRef]
- Somkhuean, R.; Wongkhao, A. Confidence intervals for the common process capability index cp of normal distributions. J. Stat. Appl. Probab. 2022, 11, 175–185. [Google Scholar]
- Yang, J.; Meng, F.; Huang, S.; Cui, Y. Process capability analysis for manufacturing processes based on the truncated data from supplier products. Int. J. Prod. Res. 2020, 58, 6235–6251. [Google Scholar] [CrossRef]
- Wu, C.H.; Pearn, W.L. Yield assessment for dynamic etching processes with variance change. IEEE Trans. Compon. Pack. Manuf. Technol. 2020, 10, 1745–1753. [Google Scholar] [CrossRef]
- Park, C.; Dey, S.; Ouyang, L.; Byun, J.H.; Leeds, M. Improved bootstrap confidence intervals for the process capability index cpk. Commun. Stat. Simul. Comput. 2020, 49, 2583–2603. [Google Scholar] [CrossRef]
- Meng, F.; Yang, J.; Huang, S. Hypothesis testing of process capability index cpk from the perspective of generalized fiducial inference. Qual. Reliab. Eng. Int. 2021, 37, 1578–1598. [Google Scholar] [CrossRef]
- Khamkanya, A.; Cho, B.R.; Goethals, P.L. The development of target-based posterior process capability indices and confidence intervals. Int. J. Qual. Eng. Technol. 2017, 6, 269–301. [Google Scholar] [CrossRef]
- Wu, C.W.; Pearn, W.L. A variables sampling plan based on cpmk for product acceptance determination. Eur. J. Oper. Res. 2008, 184, 549–560. [Google Scholar] [CrossRef]
- Yu, C.M.; Huang, T.H.; Chen, K.S.; Huang, T.Y. Construct Six Sigma DMAIC improvement model for manufacturing process quality of multi-characteristic products. Mathematics 2022, 10, 814. [Google Scholar] [CrossRef]
- Chen, K.S.; Yu, C.M. Fuzzy decision-making model for process quality improvement of macine tool industry chain. J. Intell. Fuzzy Syst. 2022, 42, 1547–1558. [Google Scholar] [CrossRef]
Publisher’s Note: MDPI stays neutral with regard to jurisdictional claims in published maps and institutional affiliations. |
© 2022 by the authors. Licensee MDPI, Basel, Switzerland. This article is an open access article distributed under the terms and conditions of the Creative Commons Attribution (CC BY) license (https://creativecommons.org/licenses/by/4.0/).