1. Introduction
After more than 40 years of reform and opening up, China has experienced not only rapid economic growth, but also a sharp rise in energy consumption and carbon emissions. China has become the world’s largest carbon emitter. In order to achieve the "double carbon" goal, China has adopted a series of emission reduction measures. The 2022 government work report also proposes that the government must introduce a carbon peak action plan to actively address climate change. How to effectively reduce carbon emissions and achieve low-carbon urban transformation has become an urgent research topic. In November of the same year, the 27th United Nations Climate Change Conference (COP27) was held in Egypt, which discussed the current difficulties and progress of global climate action. The meeting pointed out that in order to properly cope with the impact of climate change on the global environment, developed countries should strengthen their support for developing countries to solve ecological security problems. At the same time, countries should work together to control the global average temperature rise within the range of 1.5 degrees Celsius. As an industrial power, China should shoulder the responsibility of a big country and put energy security, global warming, and other ecological and environmental issues on the agenda.
At the end of 2021, the National Development and Reform Commission issued a notice on "Implementing Carbon Peak and Carbon Neutralization Goals to Promote Green and Quality Development of Data Centers and New Infrastructures such as 5G" (hereinafter referred to as the “Implementation Plan”), which clearly stated that the construction of digital infrastructure represented by 5G should be used as the data center to play the role of the digital economy, play the effect of “one industry, one hundred industries”, and promote the high-quality development of the green economy. With the continuous construction of China’s digital technology infrastructure, the scale of digital economy development has expanded year by year, information and communication technology has been continuously improved, and the development of the digital economy has advanced by leaps and bounds. As a more sustainable economic development model, the digital economy is gradually becoming a new engine of economic development.
However, in the practical application process, the use of the digital economy to drive the low-carbon transformation of cities is still in the exploratory stage, and China wants to ensure that carbon dioxide emissions do not rise anymore, and to achieve the goals of carbon peaking and carbon neutralization, it must give full play to the key role of the new development model of the digital economy in energy conservation and emission reduction. In this context, this paper studies the impact of the digital economy on urban low-carbon transformation and its spatial spillover effects. At the same time, with the increasing yearning of residents for a better life, the low-carbon development model has gradually become one of the topics of public concern. Therefore, this paper innovatively incorporates the public attention index into the overall estimation of the model and regards it as an important exogenous variable in the low-carbon transformation of cities driven by the digital economy, so as to explore whether it alleviates the energy rebound effect brought by the development of the digital economy or strengthens the clean development model of the digital economy.
2. Literature Review
2.1. Research on Influential Factors of Urban Low-Carbon Transformation
The concept of the low-carbon economy can be traced back to “the spacecraft theory” proposed by Boulding [
1] in 1966, that is, the earth is the same as a spacecraft, and no resource has unlimited reserves. He believed that a circular economy must be established to replace the traditional unitary planned economy. The concept of the urban low-carbon transformation is developed from this, and most of them are committed to exploring the influential factors of urban low-carbon transformation. From the perspective of local government expenditure, Lin and Zhu found that the educational and scientific research expenditure in fiscal expenditure could effectively promote the urban low-carbon transformation [
2]. From the perspective of environmental regulation, Li and Wu found that in city groups with high political attributes, environmental regulation had a significant impact on the urban low-carbon transformation [
3]. Wu [
4] (2019) investigated the impact of the power substitution policy on energy savings and emissions reduction and found that the promulgation of this policy could effectively promote the low-carbon transformation of Chinese cities. However, under the current power generation structure, it was not enough to rely on the power substitution policy to reduce the dependence on fossil fuel energy, and it still needed to increase the proportion of renewable energy in energy consumption. In addition, there are also scholars that studied its impact on the transformation of the low-carbon economy from the perspective of low-carbon cities and low-carbon pilots in China. Wang [
5] (2020) evaluated the impact of China’s policy of the pilot of low-carbon cities on the transformation of the urban low-carbon economy and found that low-carbon pilot policies could help the transformation of the urban low-carbon economy.
2.2. Research on Public Attention
There has been research on public environmental attention and environment governance at home and abroad. Most studies take micro data of questionnaires carried out in a certain area or local public data such as the number of visits and letters from environmental pollution prevention and control departments, the number of suggestions of the National People’s Congress, and the number of proposals of the CPPCC as the measurement indicators of public demands to analyze the impact of public environment participation on environment governance. Environment governance with public participation was first proposed by Pargal [
6] (1995); it was believed that such informal environmental regulation was due to certain defects or a low intensity of formal environmental regulation—achieving the goal of environment protection through the communication of some social organizations and the government. Christian [
7] (2010) found that as an informal form of environmental regulation, public participation could effectively improve the effect of water pollution treatment, but to a certain extent it would have a crowding effect on government law enforcement. Michael [
8] (2014) found that public environmental participation could promote air pollution reduction, even under weak environmental regulation based on India’s environmental air pollution data, thereby improving air quality. In fact, Amartya Sen, a Nobel Prize winner, also wrote in his book: “Citizens must have the opportunity to decide how the government should develop the economy, instead of holding this power in the hands of a few local elites and culture experts” [
9].
2.3. Research on the Digital Economy and Urban Low Carbon Transformation
In the era of the digital economy, how to use the Internet platform and digital technology to achieve the sustainable development of the economy and society and urban low-carbon transformation has become an important issue in energy economics [
10]. There are three views from the research on the relationship between the digital economy and the urban low-carbon transformation at home and abroad. (1) The development of the digital economy can promote the low-carbon transformation of cities. Liu [
11] (2021) analyzed the mechanism of digital technology promoting the transformation and upgrading of cities in the Yangtze River Economic Belt from the two dimensions of digital industrialization and industrial digitalization. The research showed that digital technology is an important influential factor that drives the low-carbon transformation of cities. Based on the panel data of 30 provinces in China from 2006 to 2018, Zhang et al. found that in the post-epidemic era, the digital economy promoted the transformation of China’s sustainable development by improving the level of economic growth, urbanization, and human capital. Tleppayev [
12] (2019) evaluated the impact of digital technology on the energy intensity of Kazakhstan. The study found that the development of the digital economy represented by Internet applications can effectively reduce energy consumption and energy intensity, thereby promoting cities’ low-carbon transformation. (2) Although most scholars believe that the development of the digital economy can promote the low-carbon transformation of cities through methods such as the upgrading of industrial structure and the promotion of the energy efficiency. Due to the existence of the rebound effect, some scholars believe that the continued in-depth development of the digital economy is not conducive to the low-carbon transformation of cities. Sadorsky [
13] (2012) used the number of Internet connections, mobile phones, and personal computers to measure information and communication technologies; studied the impact of the digital economy represented by information and communication technology on 19 emerging countries on power consumption; and found that there was a positive correlation with power consumption. Saidi [
14] (2015) also found that the higher the level of digital communication technology represented by Internet access and the number of mobile phone users was, the higher the level of power consumption would be, and this effect was significant among 67 panel data. (3) As a new type of productive factor, the digital economy may be a non-linear mechanism for the transformation of the urban low-carbon economy. Cheng [
15] (2021) used the DDF model to measure the Green Total Factor Productivity of Chinese industry and analyzed the impact of the digital economy on it. Studies have found that the digital economy and the Green Total Factor Productivity of Chinese industry, which takes the industry scale and the institutional environment as the threshold, has a non-linear characteristic. Based on the panel data of 277 prefecture-level cities in China from 2003 to 2018, Li [
16] (2021) built the Internet Development Index and the Green Economic Efficiency Index. The empirical inspection concluded that as the use of the Internet gradually deepens, it will have a greater impact on the efficiency of the green economy.
As far as the existing research results are concerned, in the related research on the digital economy, some scholars have analyzed the emission reduction effects of the digital economy, the energy rebound effect, and related calculation methods of regional digital economy development and have discussed the influencing factors and calculation methods of urban low-carbon transformation. In the research related to public attention, scholars have been paying attention to the auxiliary influence of public attention on environmental pollution control and resource allocation. However, these studies only focus on the direct impact of the digital economy or public attention on urban low-carbon development, but no research has ever considered public attention as an important variable of the economy. This paper innovatively incorporates public attention as an indicator of the overall estimation of the model and uses public participation theory to solve the problems with and obstacles to the development of the digital economy. At the same time, no scholars have included the three into the same framework for research and analysis, which is also the main innovation of this paper and the academic gap to be filled.
3. The Emission Reduction Mechanism of the Digital Economy in Promoting the Urban Low-Carbon Transformation
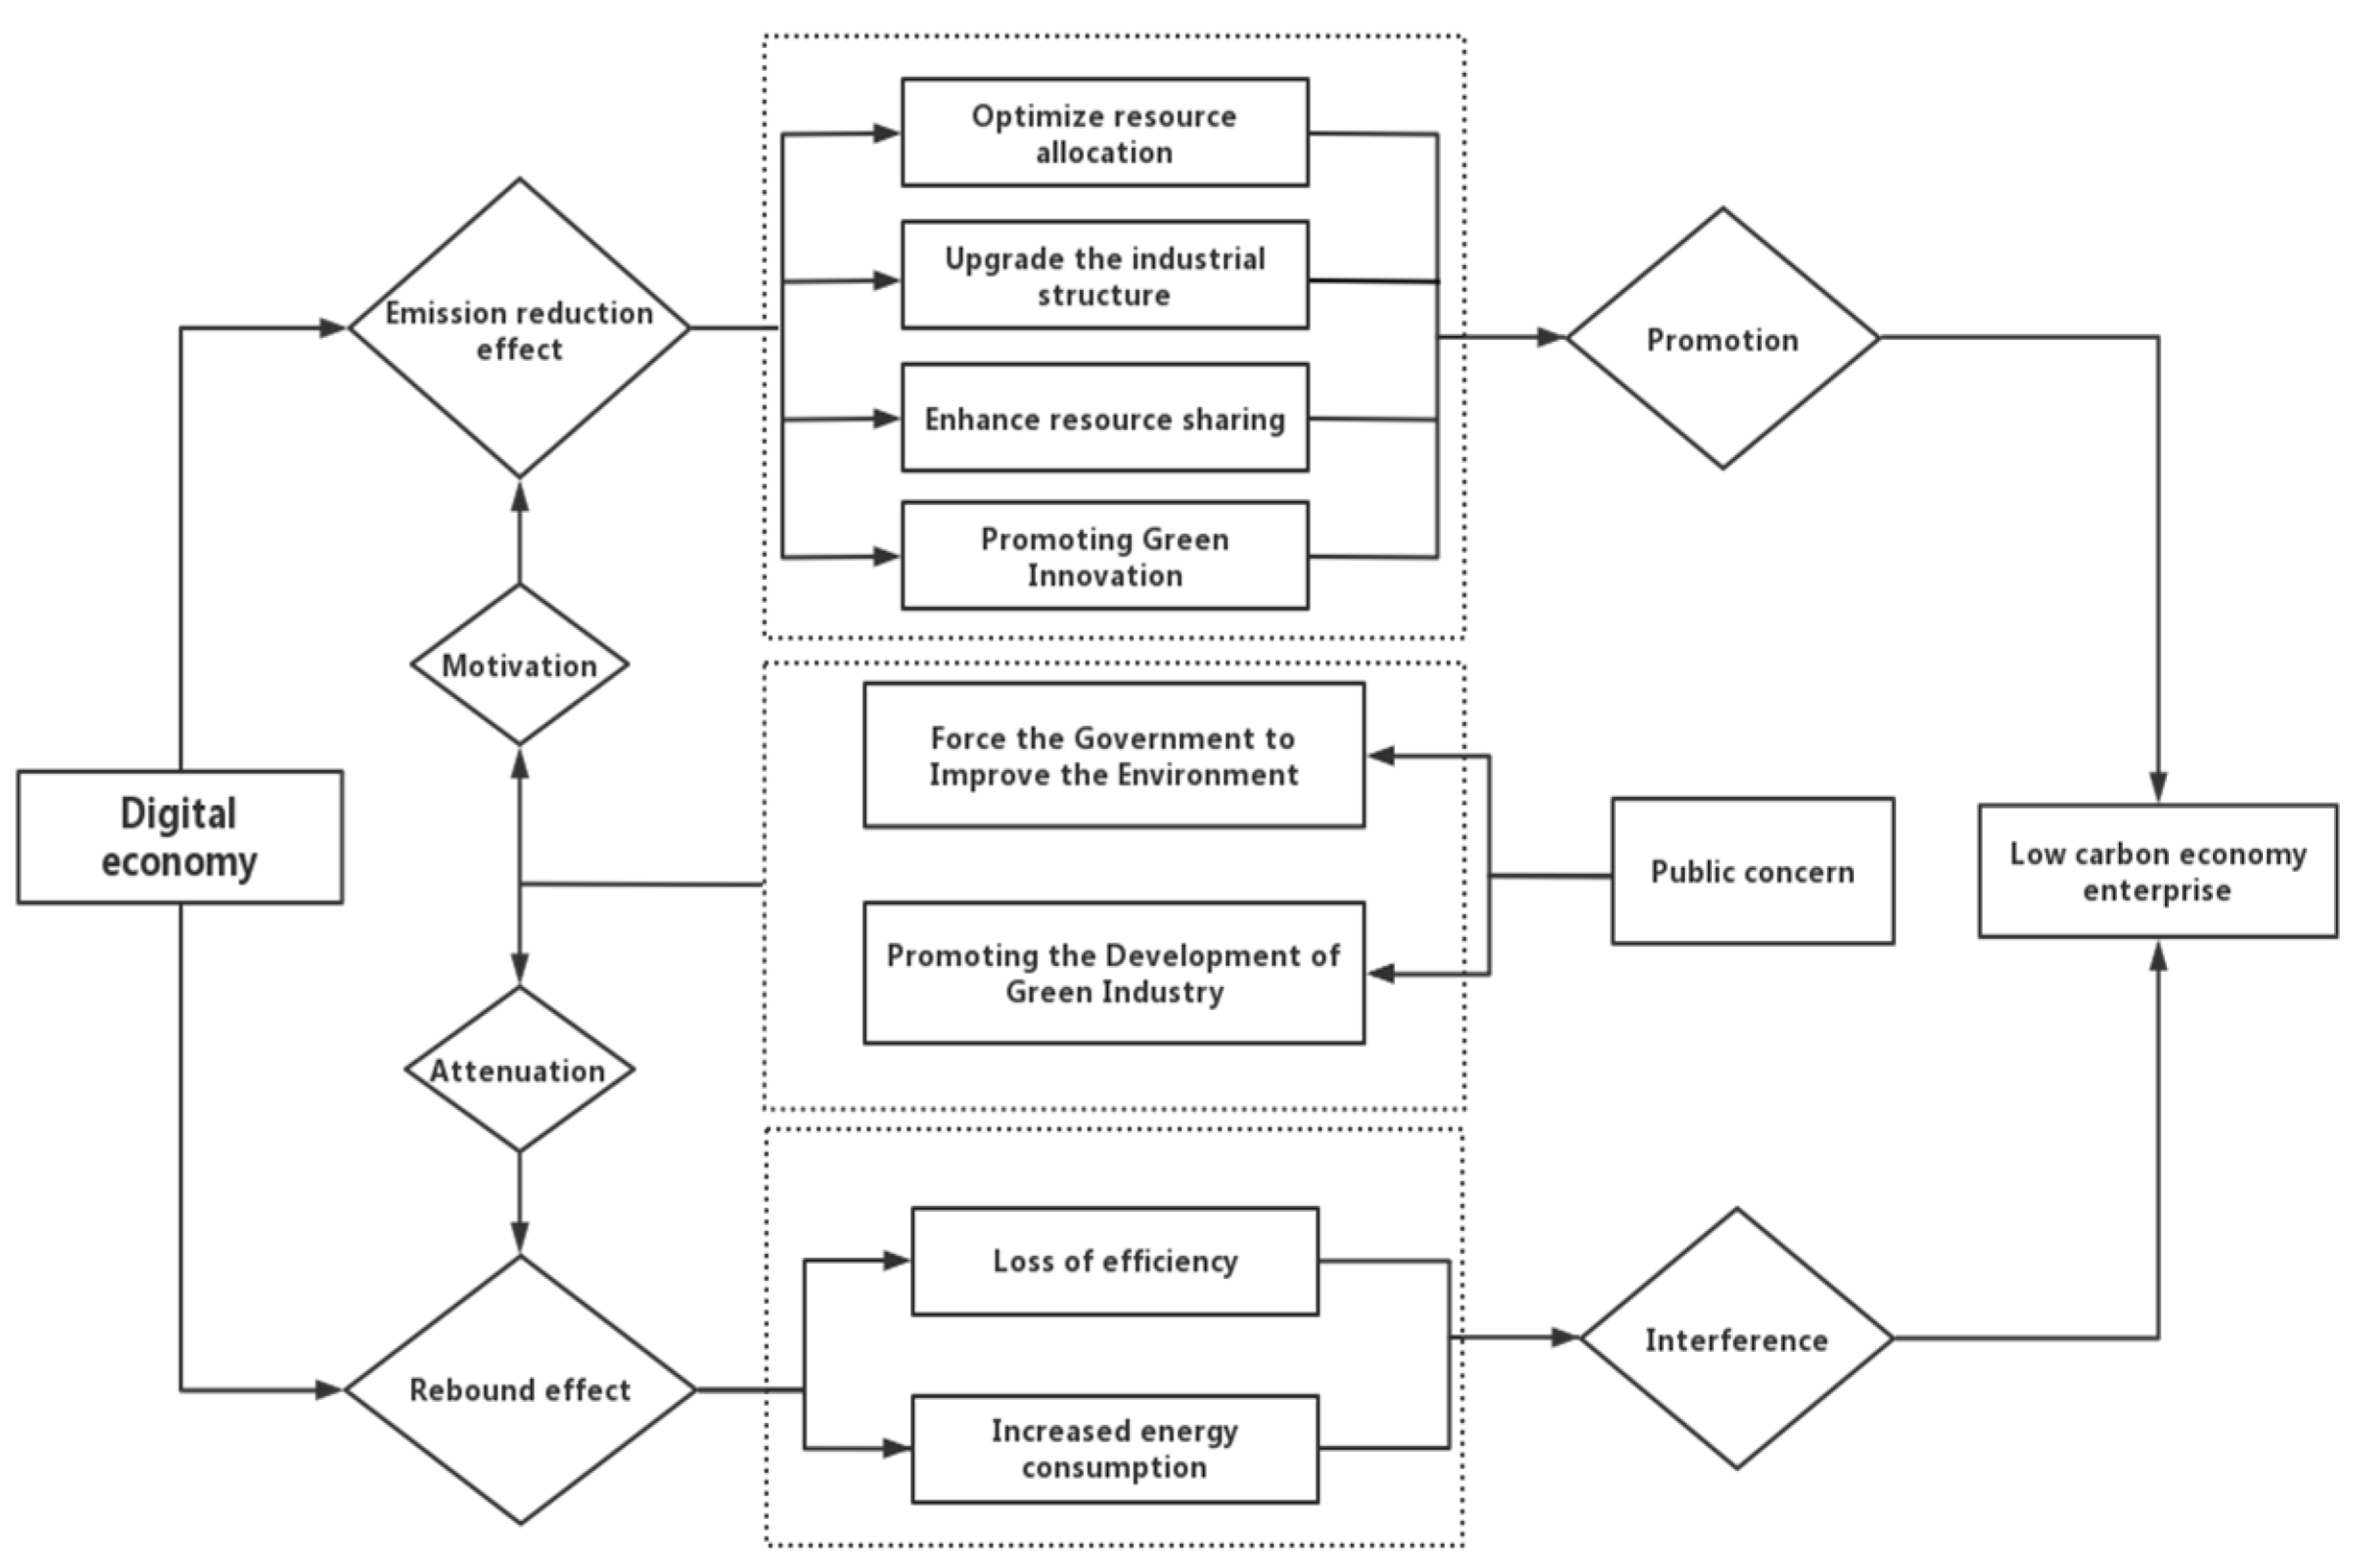
This paper argues that the digital economy has both an emissions reduction effect and a rebound effect on the low-carbon transformation of cities. On the one hand, the digital economy can promote the low-carbon transformation of cities by optimizing resource allocation, upgrading the industrial structure, improving resource sharing, and promoting green technology innovation. On the other hand, the digital economy also has a rebound effect that hinders the low-carbon transformation of cities; that is, the rapid development of the digital economy not only increases the availability of natural resources for production-side enterprises but also increases the demand for energy consumption and use at the consumer end. In reality, the integration of the digital economy into the field of production and consumption is extremely uneven, and there is an increase in energy demand and a loss of total factor productivity at the production end, and the penetration of the digital economy at the consumer end has greatly led to an increase in energy consumption at the consumer end. In addition, this paper also believes that public attention can bring about the effect of government political incentives and the upgrading effect of the industrial structure, which in turn will play a regulatory role in the digital economy to promote the low-carbon transformation of cities, the mechanism of action is shown in
Figure 1.
4. Indicator Selection and Model Building
4.1. Index Selection and Data Collection
The data for this study are from the 2011–2019 China Urban Statistical Yearbook, the China Regional Statistical Yearbook, the Baidu Index website (
https://index.baidu.com/v2/index.html/, accessed on 30 December 2020), the Peking University Digital Financial Inclusion Index, and the CNRDS database. The study used Stata 16.0 Python software.
- (1)
The level of urban low-carbon transformation. Referring to Liu [
17] (2021) for the measurement method of the urban green transformation, the entropy weight assignment method was used to measure the level of urban low-carbon transformation, and the specific measurement method is shown in
Table 1.
- (2)
The development level of the digital economy. Based on the practice of Cheng [
18] (2010), this paper selected the five indicators of Internet penetration rate, Internet-related practitioners, Internet output, mobile Internet users, and digital inclusive financial development, and it used the entropy weight method to measure the development level of the regional digital economy. The specific indicators evaluation system is shown in
Table 2.
The calculation method of the entropy weighting method draws on the practice of Liu [
19] (2105). The specific calculation process is as follows:
The first step is to standardize the original data; in this paper, the minimum maximum method was used to standardize the data. The formula is as follows:
Positive Indicator: , Negative Indicator:
Step 2. Establish the weight matrix of data
Y =
Step 3. Calculate the index entropy
and differentiation coefficient
:
Step 4. Calculate the evaluation index weight
:
Step 5. Weigh the comprehensive evaluation of the digital economy
U:
The final calculated U value is taken as the final comprehensive index.
- (3)
Public environmental concern. In view of the fact that government statistical indicators belong to structured data, while Internet search behavior data belongs to unstructured data, Internet search behavior is more representative information in online big data [
20]. This paper used Python Crawler technology to crawl the daily search volume of each region on the official website of the Baidu Index and process it to obtain the public environment attention of each city.
- (4)
The remaining control variables include:
- ①
Regional economic development level. Use per capita GDP as an indicator to measure regional economic development.
- ②
Population size. Use the urban resident population number as a measure of regional population size.
- ③
Urbanization rate. The urbanization rate is measured by the urban population proportion of the total population of the region.
- ④
Innovation level. Use the number of regional patent applications as an indicator to measure the level of regional innovation.
- ⑤
Education level. Draw on the practice of Yuan [
21] (2020), where the proportion of the number of students in higher education (including undergraduate and junior college and above) in the region is used to measure the level of education.
- ⑥
Industrial structure. The industrial structure is measured by the proportion of the added value of the tertiary industry to GDP.
In the processing of variable data, due to the existence of extreme values, the variable data in the main part of this paper are processed by 1% Winsor tail reduction. At the same time, some numerical data are logarithmically processed, and the descriptive statistical analysis of the data is shown in
Table 3.
4.2. Model Construction
- (1)
Benchmark model construction
On the basis of the related literature review, this paper explored the linear and nonlinear relationship between the digital economy and urban low-carbon transformation by constructing a benchmark model of the digital economy and urban low-carbon economic transformation. Based on the benchmark regression model, the subsequent econometric model was constructed. In this paper, the Hausman test method was used to test if the fixed effects model is better than the random effects model. The benchmark model is shown in Equations (6) and (7).
where
represents the region,
represents the time,
represents the constant term,
represents the individual fixed effect,
represents the time fixed effect,
represents the error term in the model, and represents other factors that affect the low-carbon transformation of cities and are not considered in the model. The meanings of the remaining relevant variables are described in the descriptive analysis of the data (
Table 3).
- (2)
Construction of the spatial econometric model
At present, the more common spatial econometric models are ① the spatial error model (SEM); ② the spatial lag model (SAR); ③ the spatial Durbin model (SDM), etc. [
22]. The spatial error model (SEM) assumes that the interaction between regions is realized by the error term; that is, the spatial spillover effect of variables is caused by the random impact of the error term. The spatial lag model (SAR) includes the spatial lag term of the dependent variable and examines the influence of the independent variables in the surrounding areas on the local dependent variables. The spatial Durbin model (SDM) contains both the spatial term of the dependent variable and the independent variable, which can simultaneously analyze the spatial spillover effect of the dependent variable and the independent variable [
23]. In view of the comparative advantages of the spatial Durbin model (SDM), this paper initially chose it as the basic model of empirical analysis and then judged whether it was the optimal model through the LM test, LR test, and Wald test. The general form of spatial Durbin model (SDM) is:
When
= 0, the spatial Dubin model can be transformed into a spatial lag model (SAR), which is in the form of:
When
, the spatial Dubin model can be transformed into a spatial error model (SEM) in the form of:
- (3)
Construction of the panel threshold regression model
In order to test the moderating role of public attention in the low-carbon transformation of cities driven by the digital economy, this paper draws on the research methods of Housman to construct a panel threshold model and introduces public attention as a moderating variable into the threshold model. The model is as follows:
where
is the threshold value,
and
are coefficients, and
is the indicative function.
5. Empirical Analyses
5.1. Regression Analysis of Benchmark Model
This paper used the Husman test to determine that the
p value was significant at the level of 1%, indicating that the model should choose a fixed effect model rather than a random effect. On this basis, according to Formula (6), panel fixed effects regression was used. The regression results are shown in
Table 4.
In order to make the regression results of the model more credible, this study adopted the method of gradually adding control variables to ensure the robustness of the coefficients of the core explained variables. With the gradual addition of control variables, the fitting parameters of the model were also increasing. As can be seen from the results, under the sample data of 274 prefecture-level cities nationwide, the impact of the digital economy on urban low-carbon transformation was always positive and significant at the 1% level. The digital economy not only has the role of improving production efficiency and stimulating economic growth, but it also plays a huge role in low-carbon environmental protection. It has become the kinetic energy of China’s new economic growth under the background of "lucid waters and lush mountains are invaluable assets" in the new era.
Secondly, on the basis of benchmark regression, the nonlinear relationship between the digital economy and urban low-carbon transformation (Formula (7)) was investigated, and the heterogeneity among cities in the eastern, central, and western regions of China was compared and analyzed. The specific regression results are shown in
Table 5.
According to the regression results in
Table 5, the impact of the digital economy on urban low-carbon transformation presented a U-shaped relationship. That is, before the inflection point, the development of the digital economy did not have a positive impact on urban low-carbon transformation. After crossing the inflection point, the development level of the digital economy had a positive effect on urban low-carbon transformation. In the early stage, the development of the digital economy was in the stage of deepening the use of the Internet. The lagging characteristics of large infrastructure investments and innovation achievement transformation caused the development of the digital economy to fail to bring about improvements of the urban low-carbon transformation and may even have caused a substitution effect to a certain extent. The early development of the digital economy will hinder the low-carbon transformation of cities to a certain extent. However, with the continuous emergence of new forms and new models of the network economy such as "Internet + green ecology", "Internet + environmental protection", and "Internet + smart energy", the development of Internet digital economy has an important positive impact on urban low-carbon transformation. At the same time, from the analysis of regional heterogeneity, it can be seen that most regions of the country crossed the inflection point, making the regression results of all regions of the country show a positive effect. From the comparison of the size of the coefficient, the influence coefficient of the digital economy in the eastern region on the low-carbon transformation of the city was greater than that in the western region and the central region. The reason may be that the digital economy in the eastern region of China developed earlier and at a higher level than that in the central and western regions, making the development dividend of the digital economy more fully released.
5.2. Regression Analysis of Spatial Econometric Model
- (1)
Construction of spatial weight matrix and spatial autocorrelation test
In the autocorrelation test of the spatial model, the autocorrelation problem of the model was tested according to the Moran index. According to the overall and local characteristics of the spatial subject, the global Moran index and the local Moran index were used for self-tests, respectively. The difference between the two is that the global Moran index has advantages in terms of whether the vehicle has spatial agglomeration and spatial divergence, but it cannot point out the specific deviation value, and the local Moran index just makes up for this defect. Therefore, according to the mainstream practice, this paper first used the global Moran index and then the local Moran index to test the autocorrelation of the spatial econometric regression model. The Moran index values of the main variables are as follows:
According to the results of
Table 6, whether it is the inverse distance spatial weight matrix, the inverse distance square spatial weight matrix, or the economic–geographical nested spatial weight matrix, the global Moran index of the digital economy and the low-carbon transformation of cities was significant from 2011 to 2019, passing the global spatial autocorrelation test.
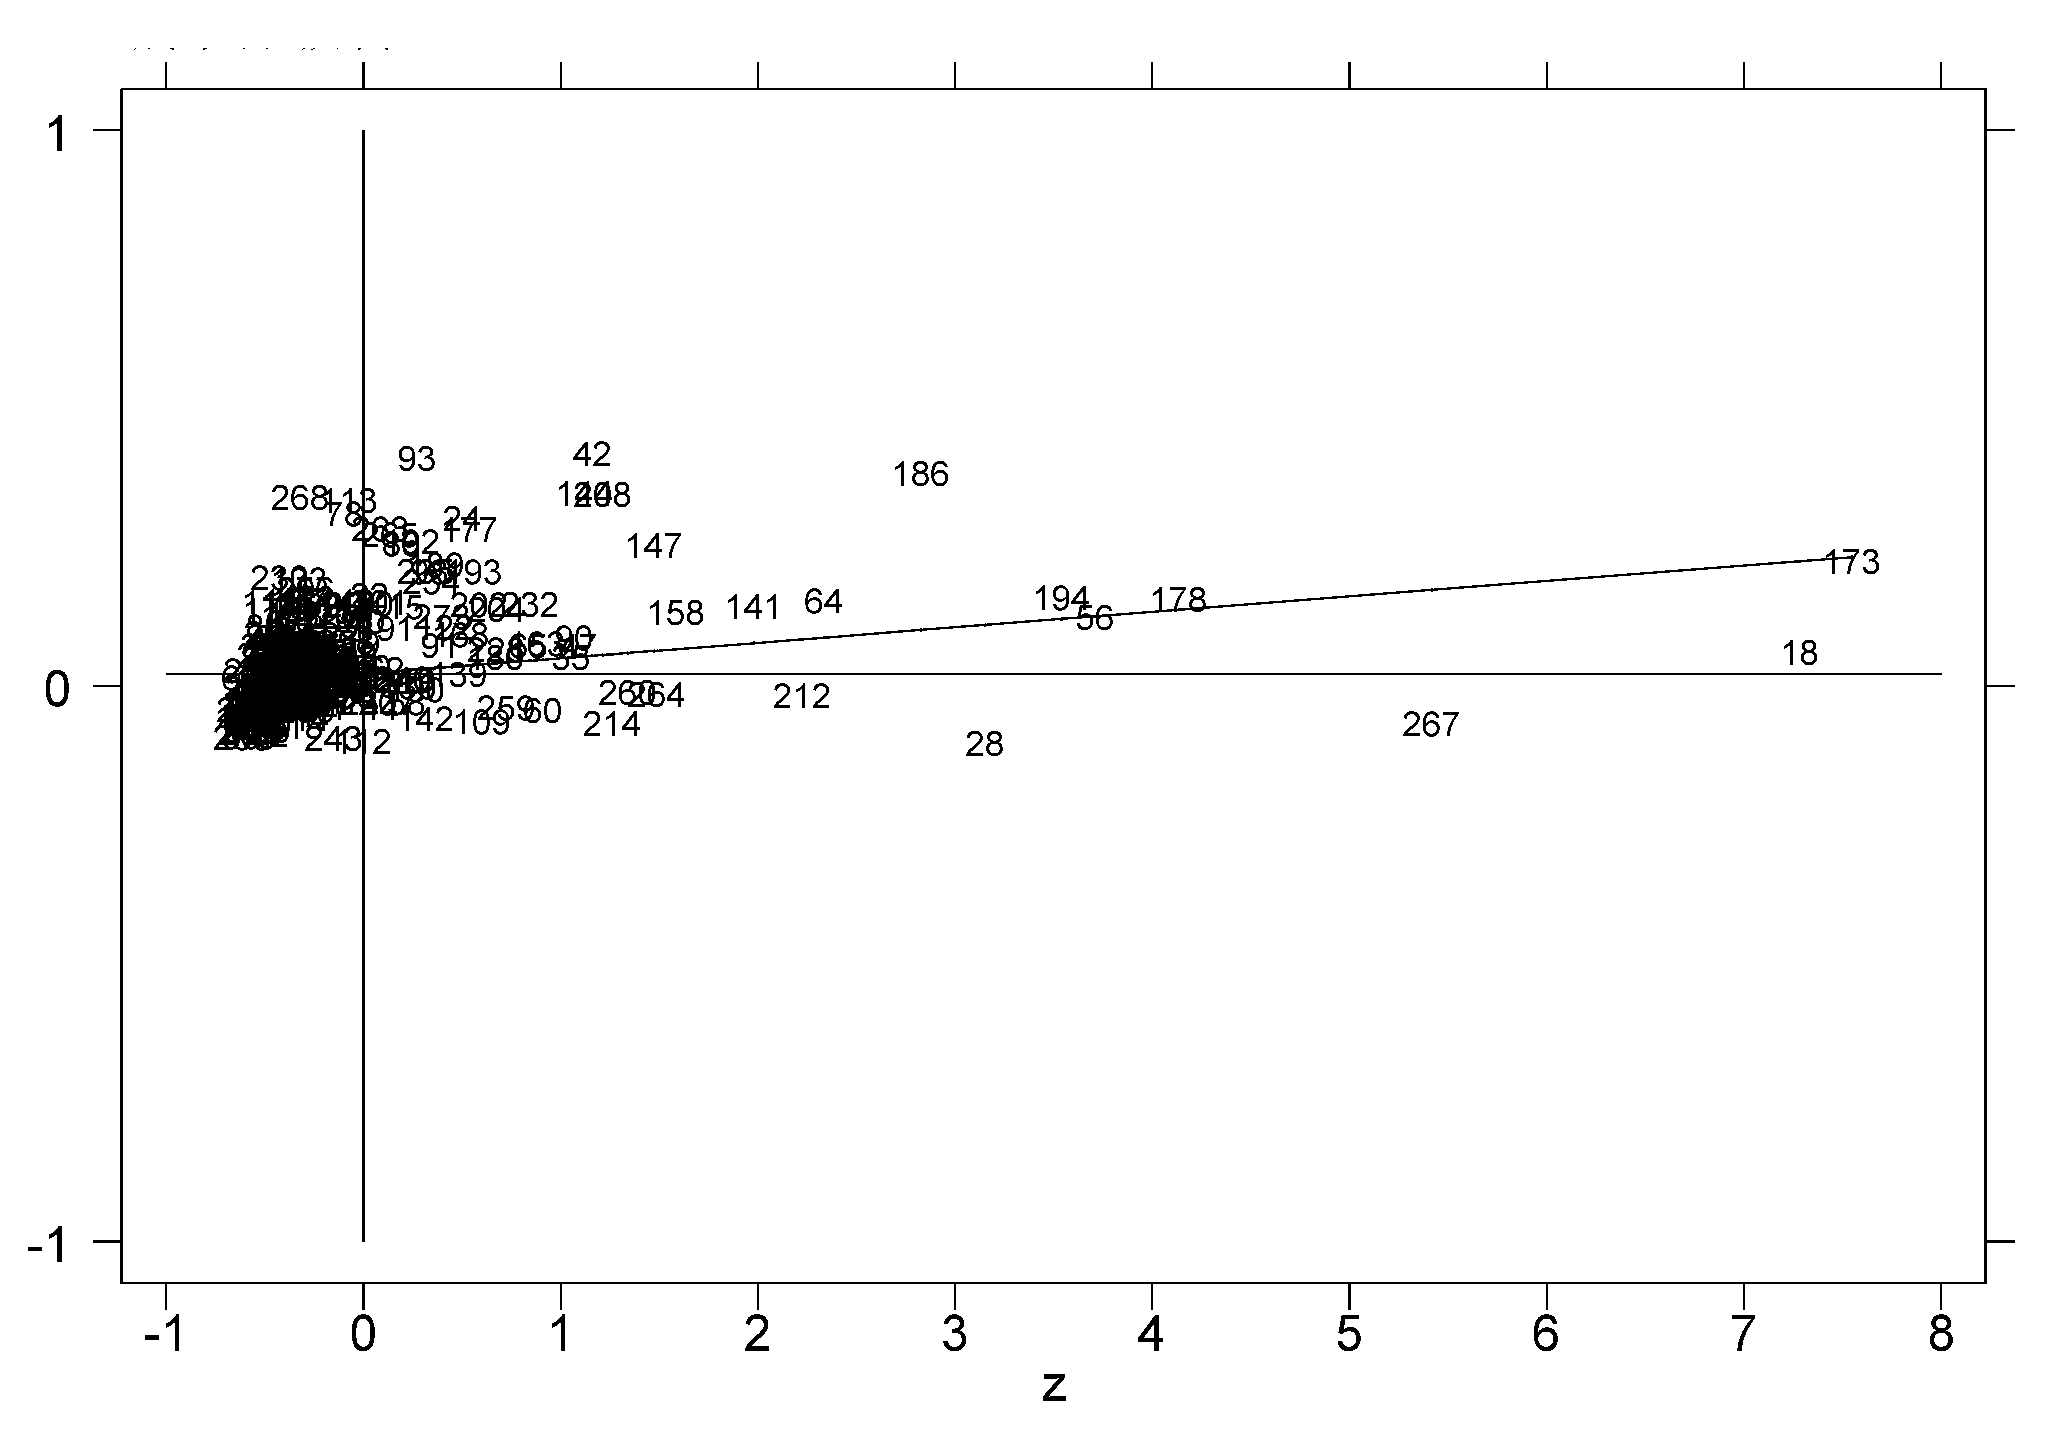
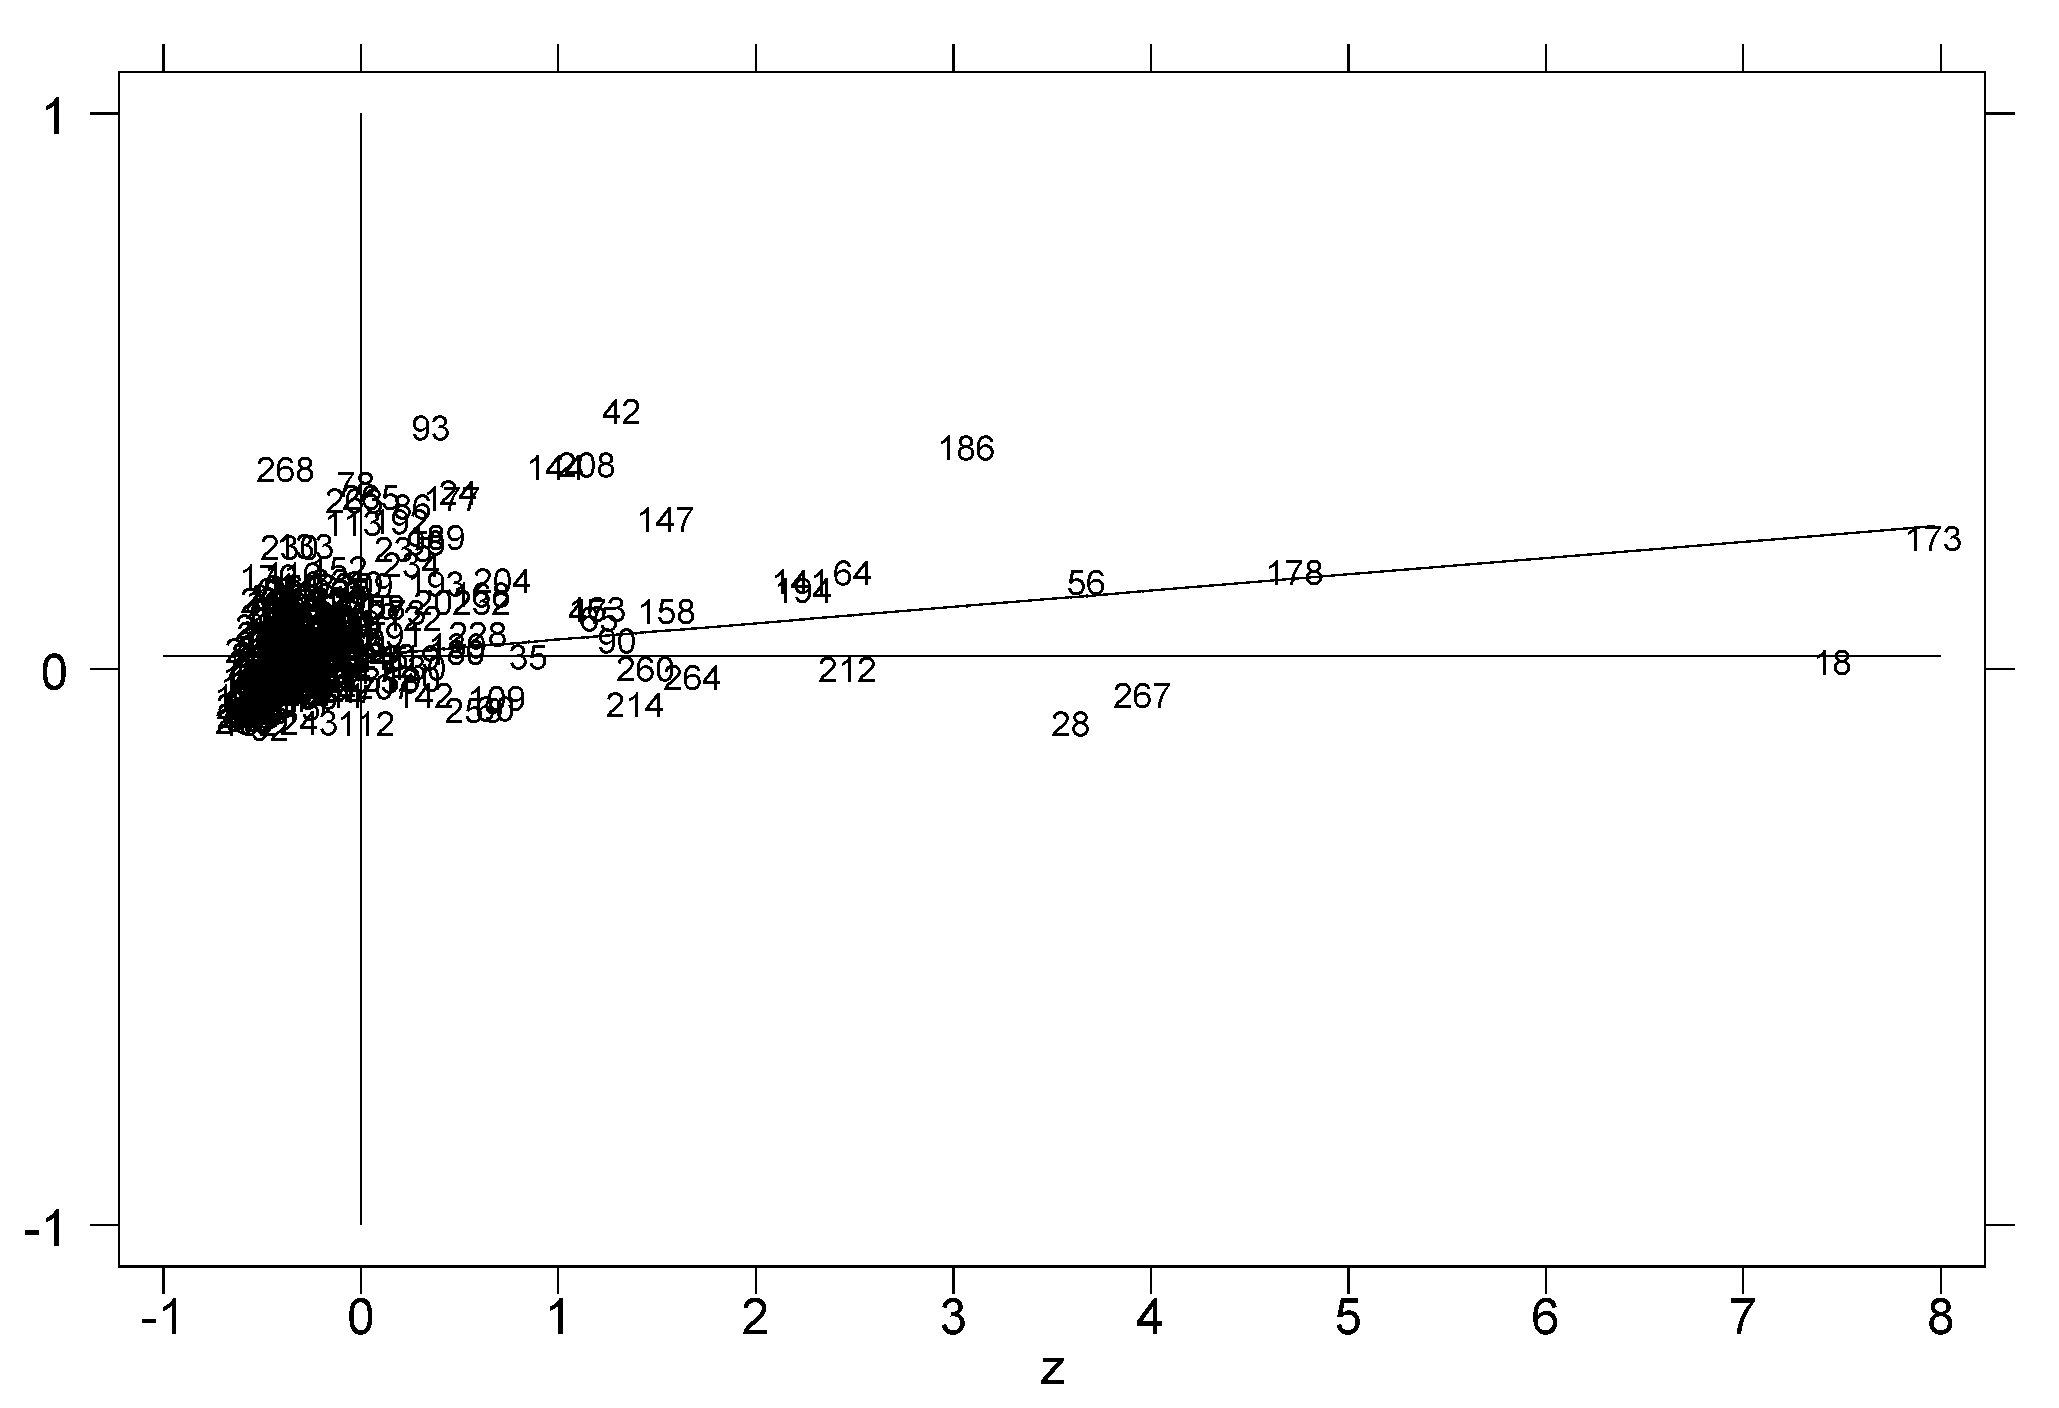
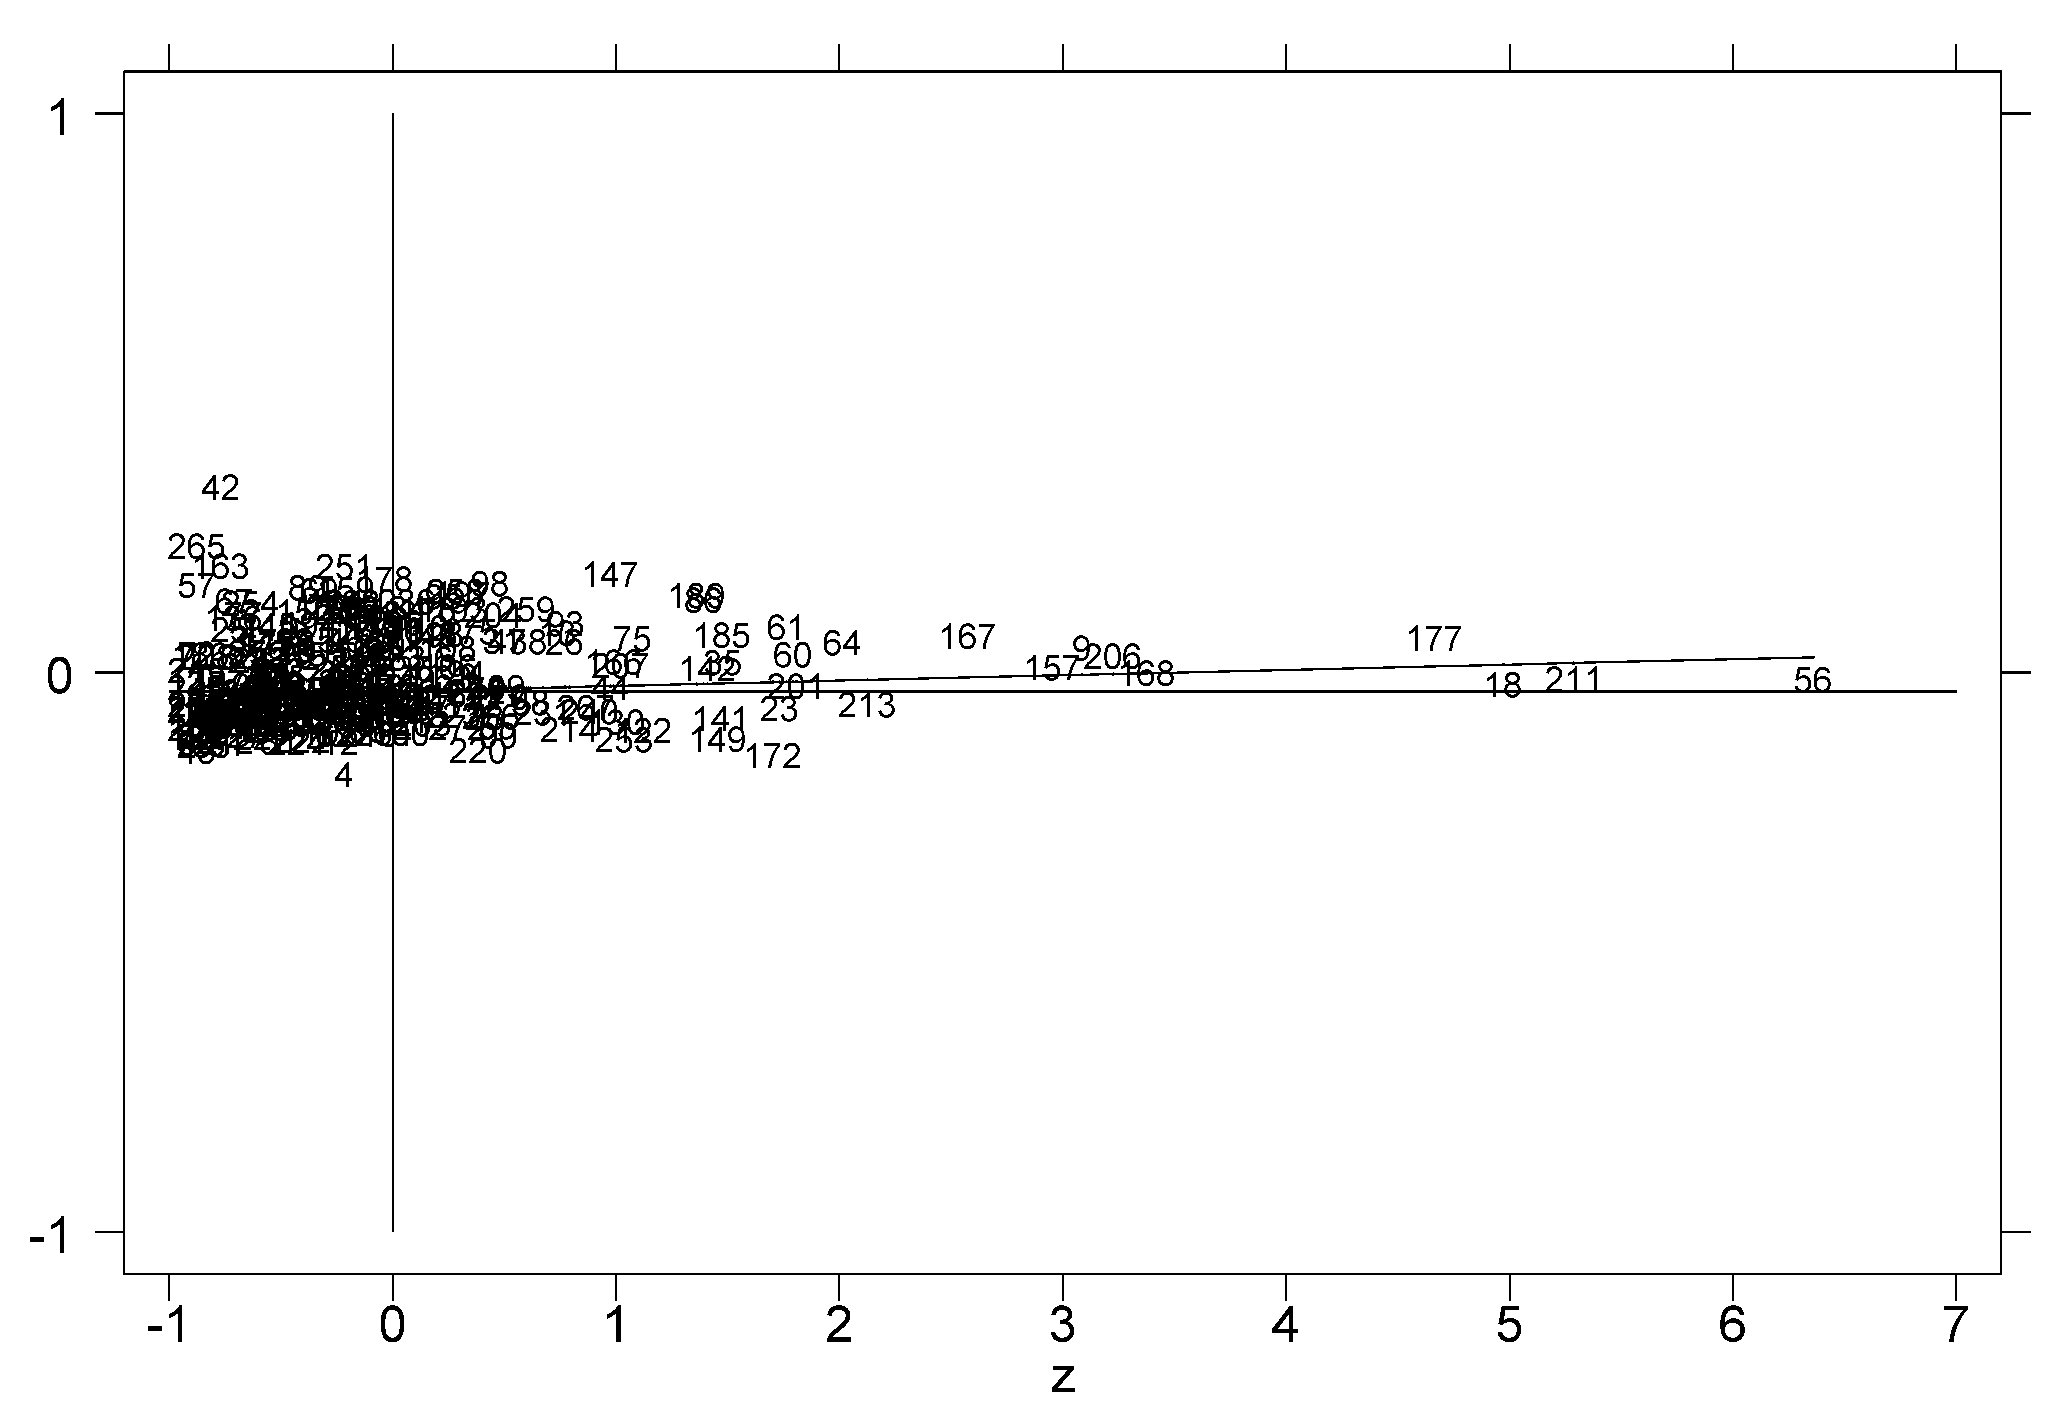
After the test of global spatial autocorrelation, the local Moran index was used to analyze the distribution of the two in space. In order to clearly observe the distribution of 274 sample points, this study analyzed the local spatial autocorrelation between data by drawing a Moran scatter plot. Each scatter in the Moran scatter plot was the Moran index of the city in the year. According to its location, it could be divided into four quadrants corresponding to four types: (1) the first quadrant (HH) itself is a high observation value, and the surrounding area is also a high observation value; (2) the second quadrant (LH) itself is a low observation value, and the surrounding area is a high observation value; (3) the third quadrant (LL) itself is a low observation value, and the surrounding area is also a low observation value; (4) the fourth quadrant (HL) itself is a high observed value, and the surrounding area is a low observed value. The local Moran index analysis of the digital economy and urban low-carbon transformation is shown in
Figure 2,
Figure 3,
Figure 4,
Figure 5,
Figure 6 and
Figure 7.
According to the comparative analysis of
Figure 2,
Figure 3,
Figure 4,
Figure 5,
Figure 6 and
Figure 7, China’s urban low-carbon economic transformation and digital economy both showed a spatial autocorrelation distribution trend and were constantly developing over time. Further analysis was carried out in the subsequent spatial econometric regression analysis.
- (2)
Spatial econometric model selection and empirical analysis
In this paper, the statistical value of the chi-square test was −68.26 by using the Hausman test, and the original hypothesis was rejected. The final model was the fixed effect space Durbin model. At the same time, this paper found that the digital economy has a direct effect on the low-carbon transformation of cities and a spatial spillover effect on the surrounding areas. The specific regression results are shown in
Table 7.
According to the results shown in
Table 7, in the reciprocal spatial weight matrix of geographical distance, the digital economy had a significant role in promoting the low-carbon transformation of local cities, but it had a significant negative effect on the surrounding areas. The regression coefficients were 0.116 and −0.157, respectively, indicating that for every additional level of digital economic development, the local low-carbon economic transformation will be promoted by 0.123, and the negative effect on neighboring areas will be 0.134. At the same time, this situation was also reflected in the reciprocal square matrix of geographical distance, that is, the development of the local digital economy has a siphon effect, which promotes the transformation of a low-carbon economy and hinders the economic transformation of surrounding areas to a certain extent. The development of the digital economy is accompanied by the transfer of a large amount of high-quality labor and high-quality capital. Both capital and labor have the characteristics of preferential selection, which in turn leads to a shortage of talent and capital in the surrounding areas, indirectly making the surrounding areas lack the internal vitality of economic transformation. However, it is hoped that the result will be that the digital economy will not only promote the low-carbon transformation of local cities but also promote the surrounding areas with relatively close economic and geographical distances, which largely illustrates the importance of coordinated development. In economically underdeveloped areas, once a well-developed city emerges, it will lead to a large influx of resources. When the overall economic development level of an urban agglomeration is high, resources will be rationally allocated within the urban agglomeration, thus promoting the low-carbon economic transformation of the entire urban agglomeration. In addition, from the results of control variables, the level of education and population were positive for the low-carbon transformation of local cities.
5.3. Empirical Regression of the Moderating Effect of Public Attention
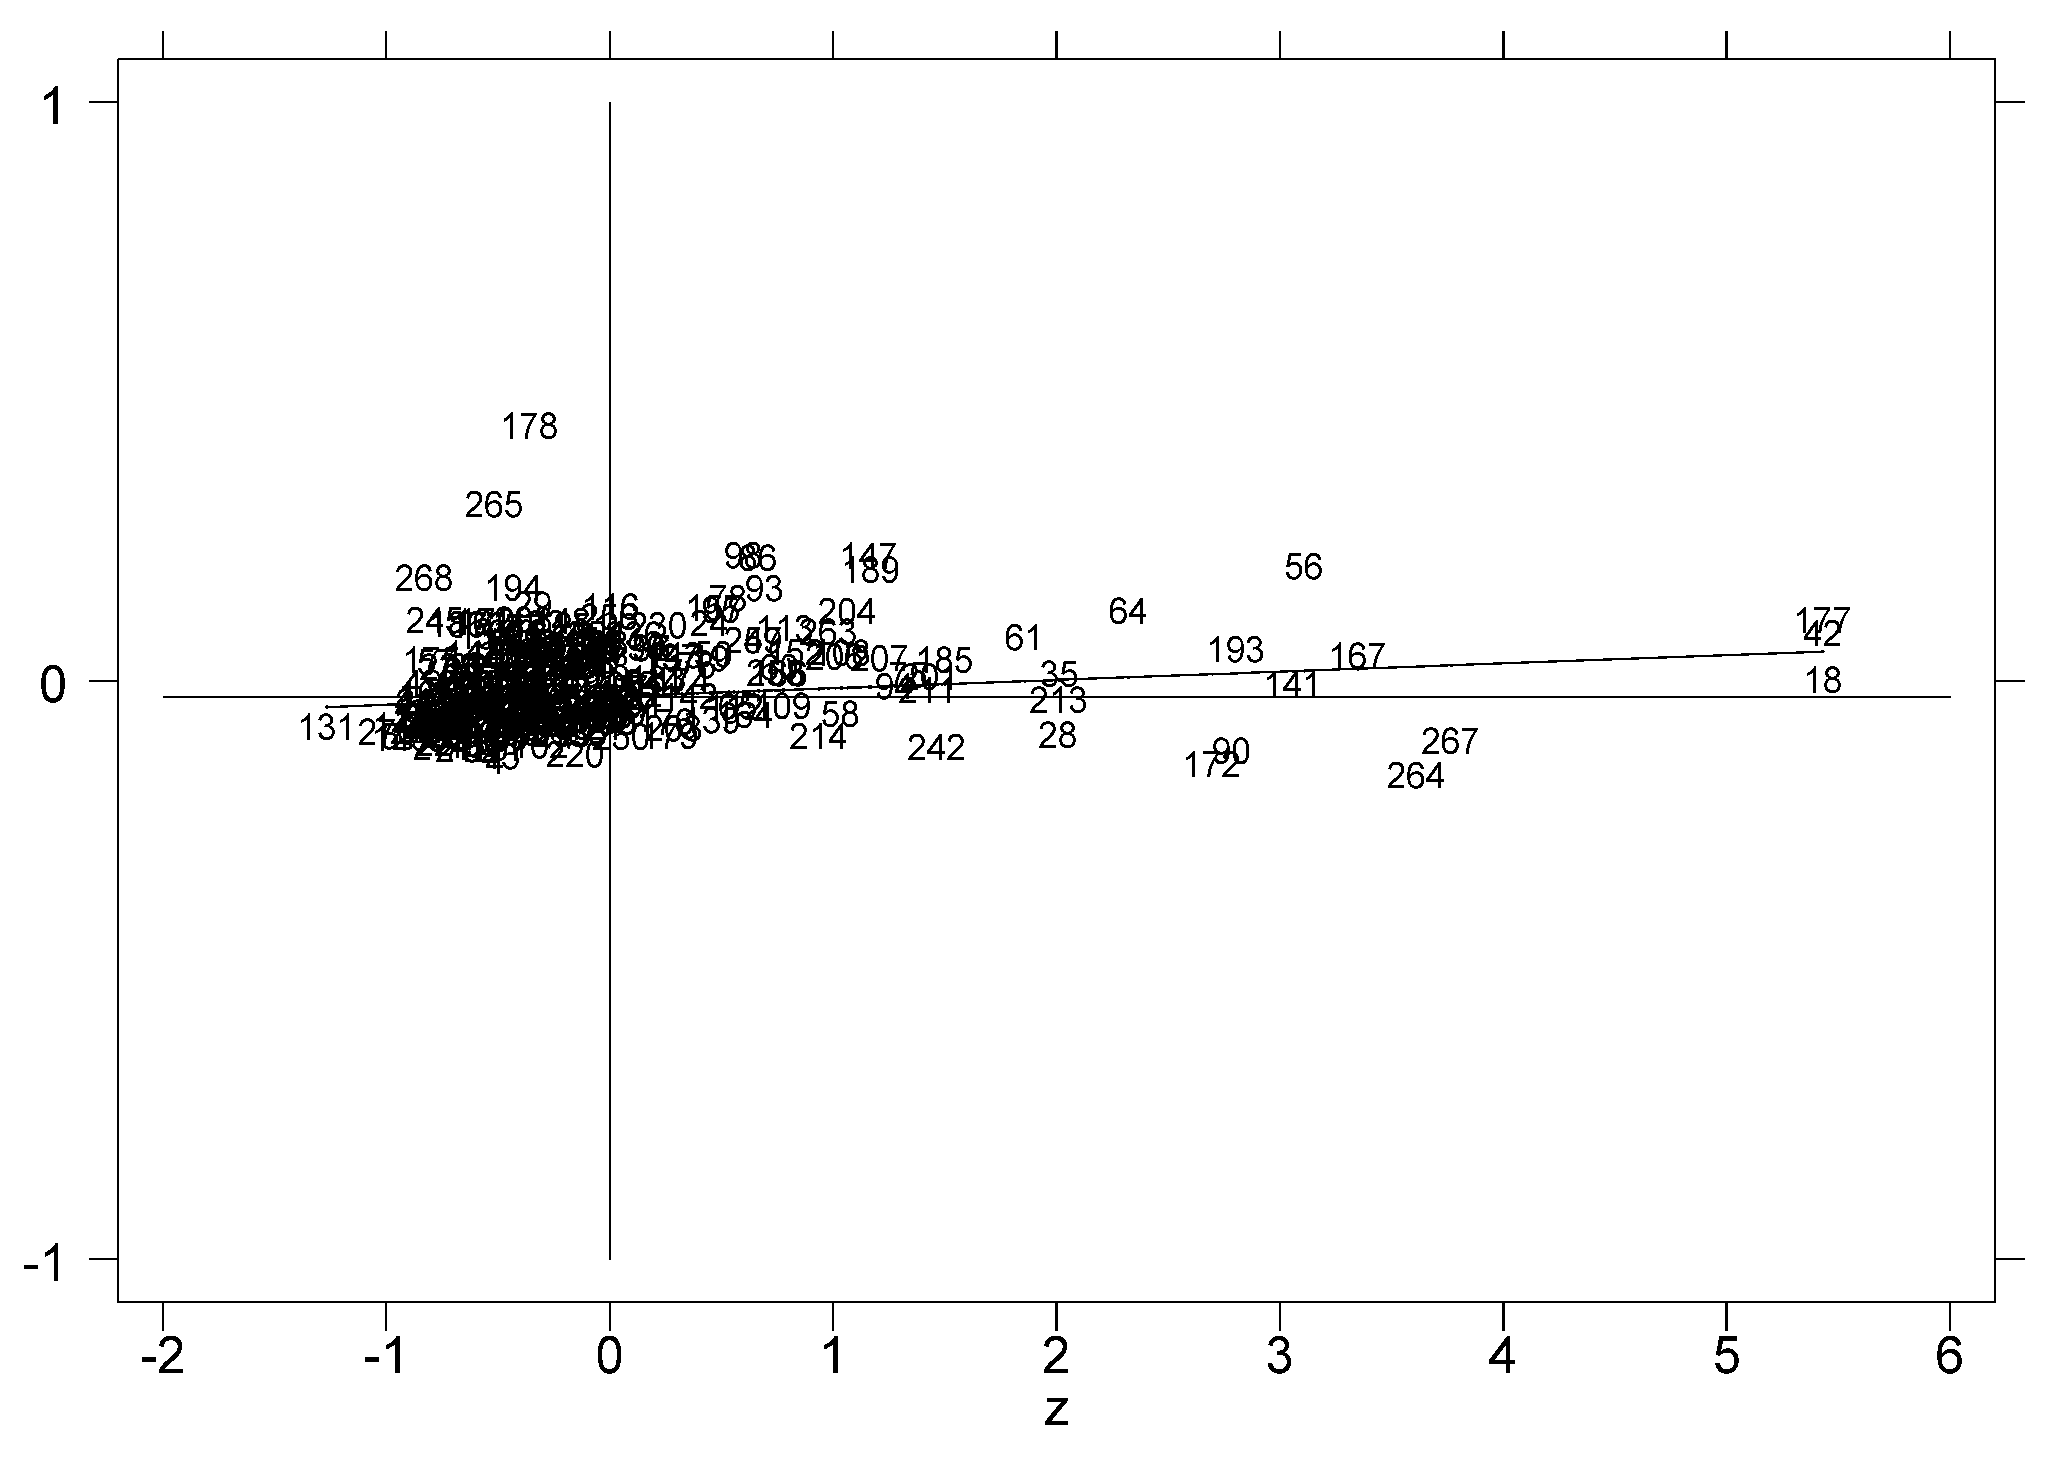
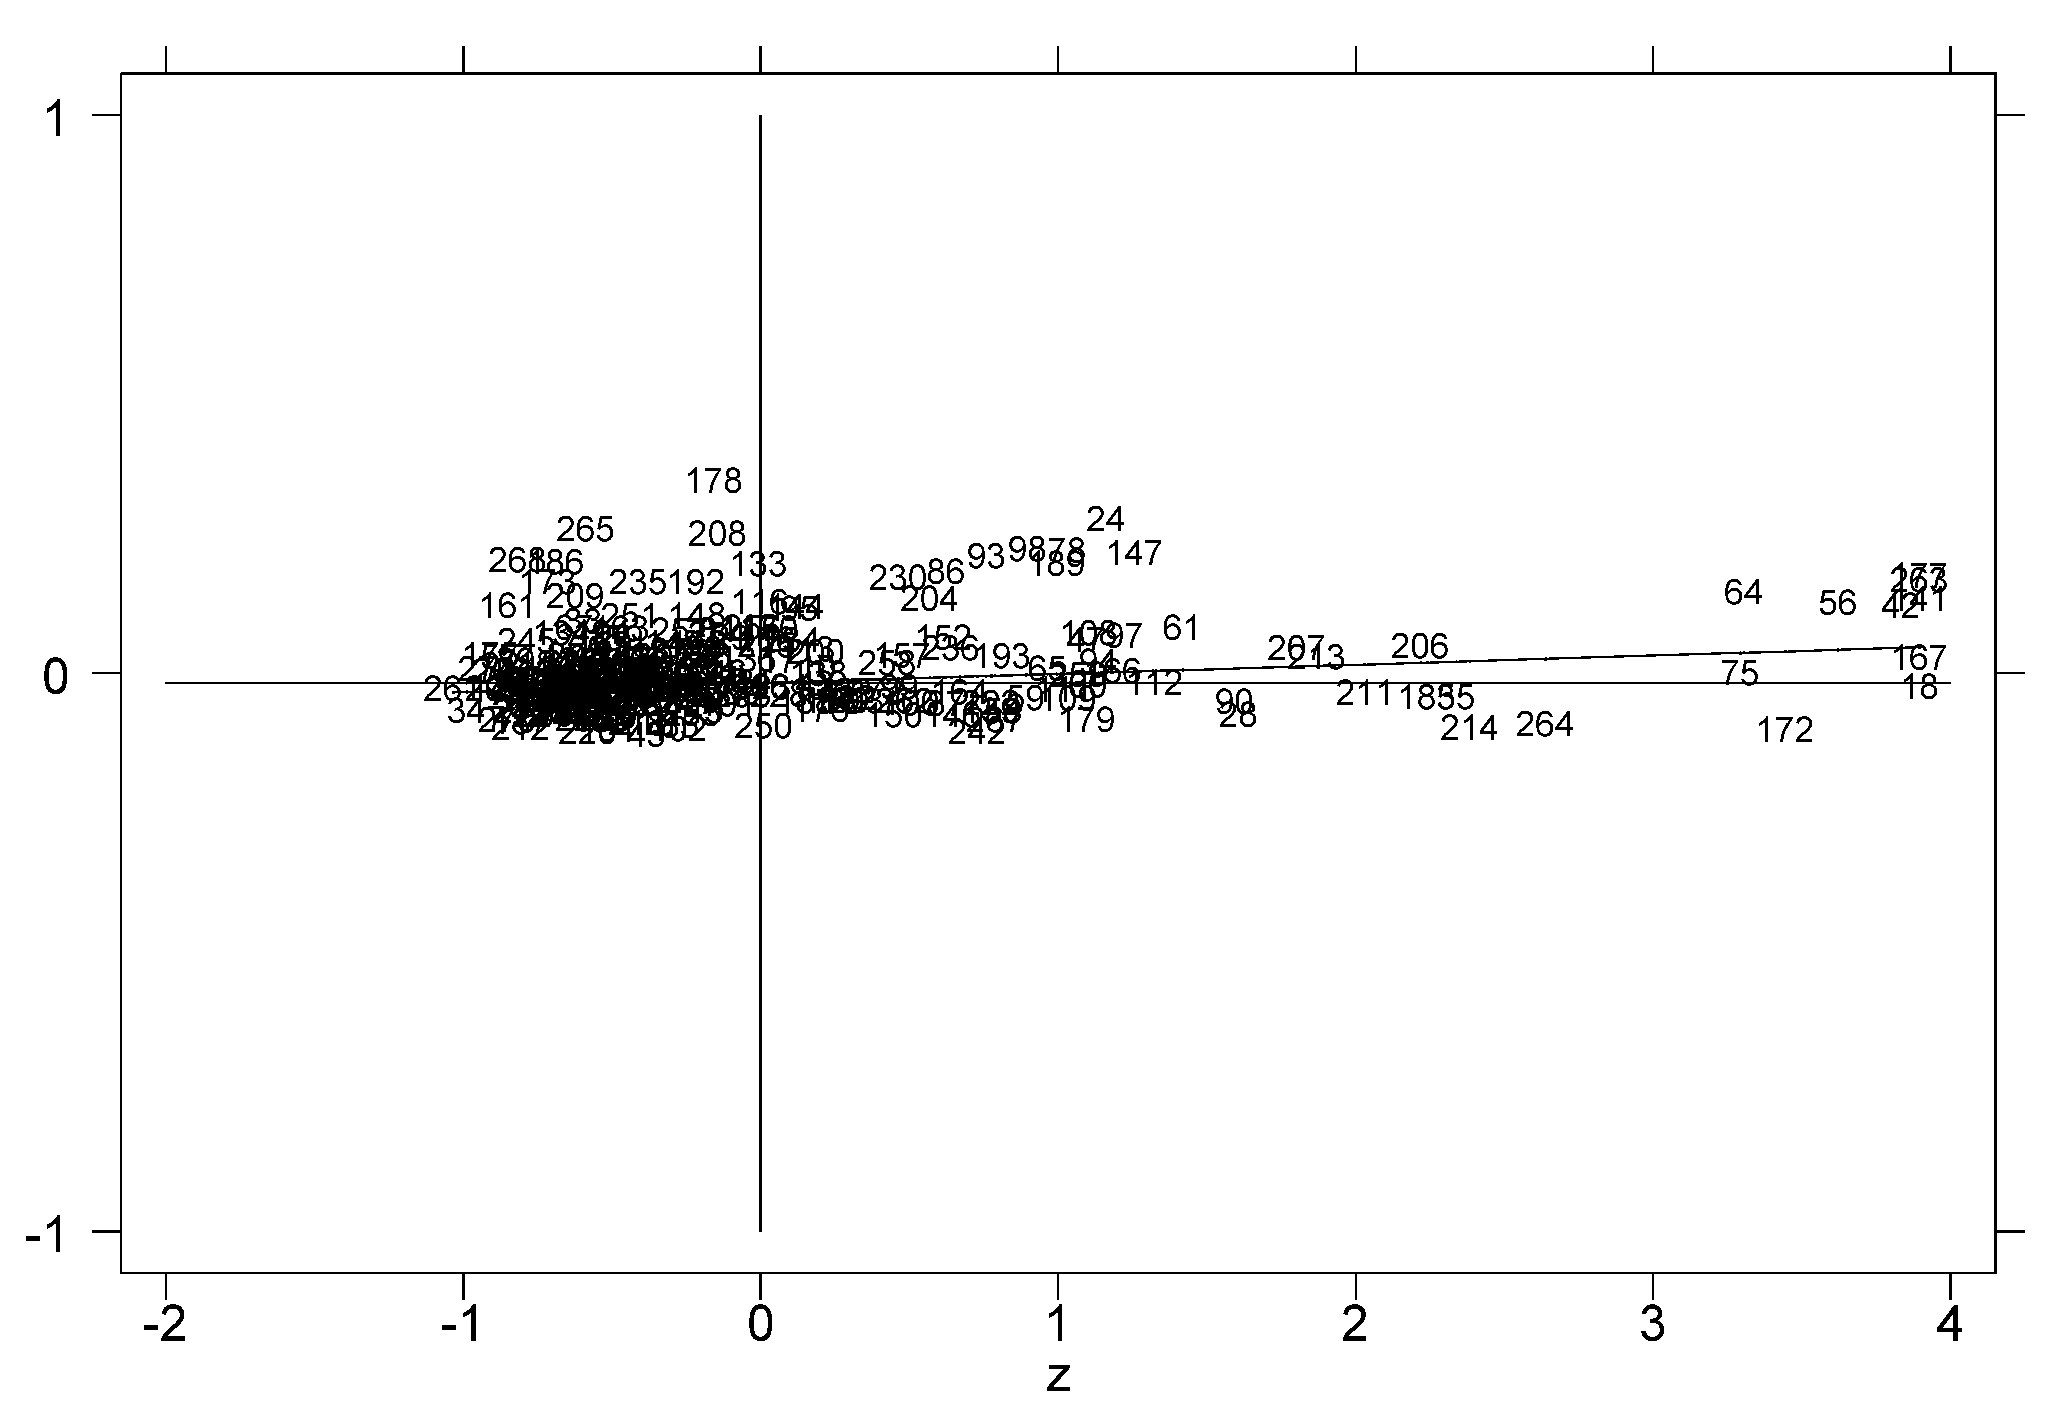
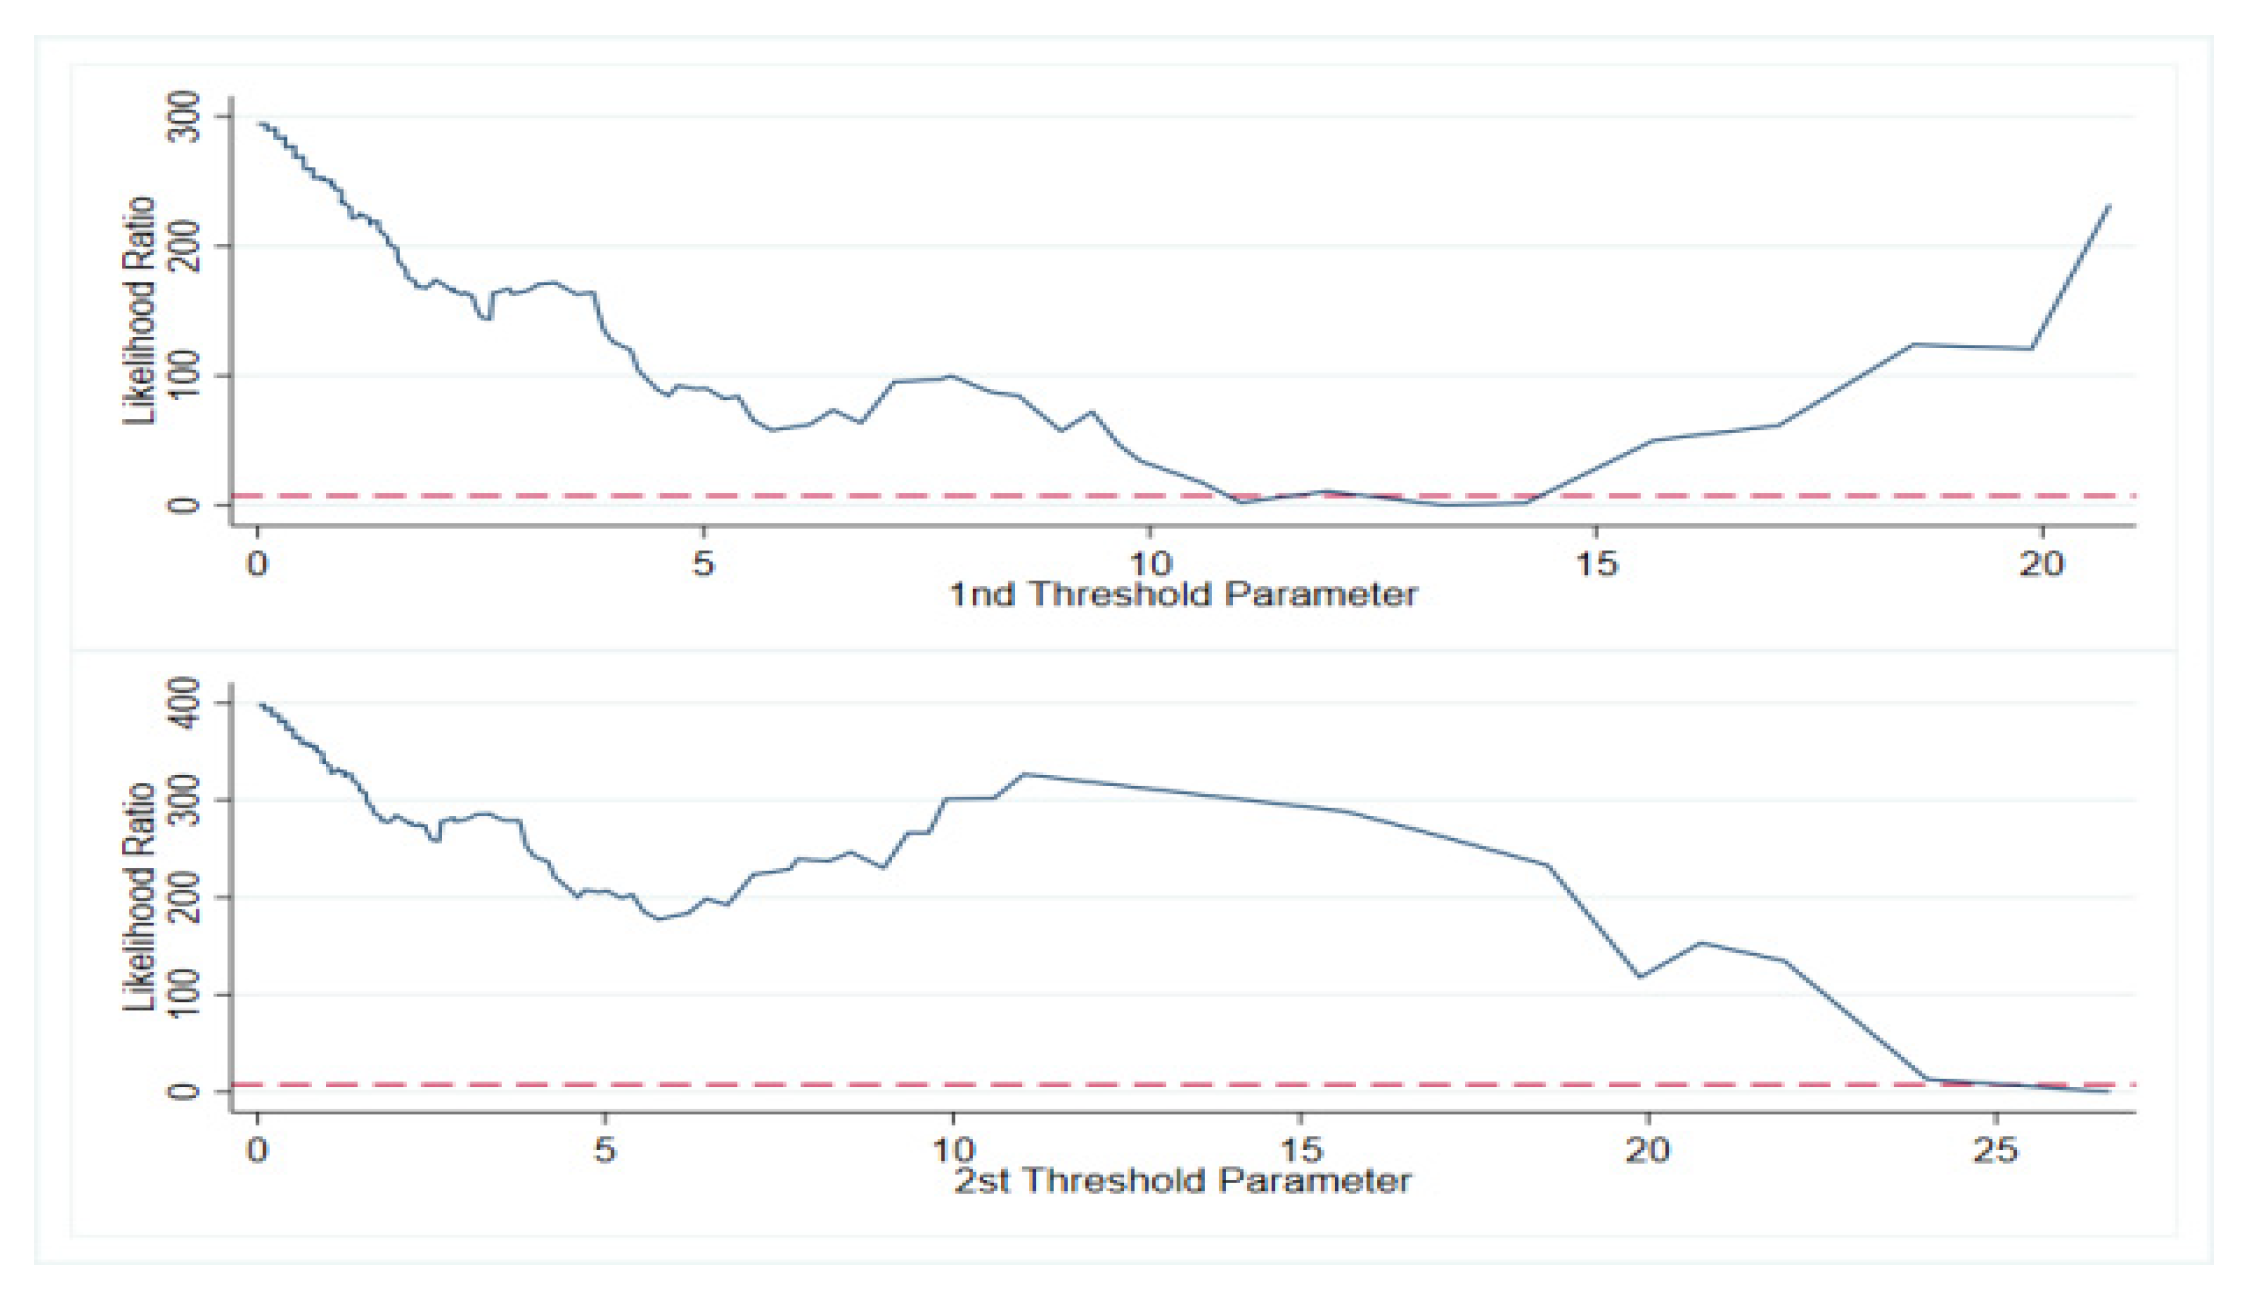
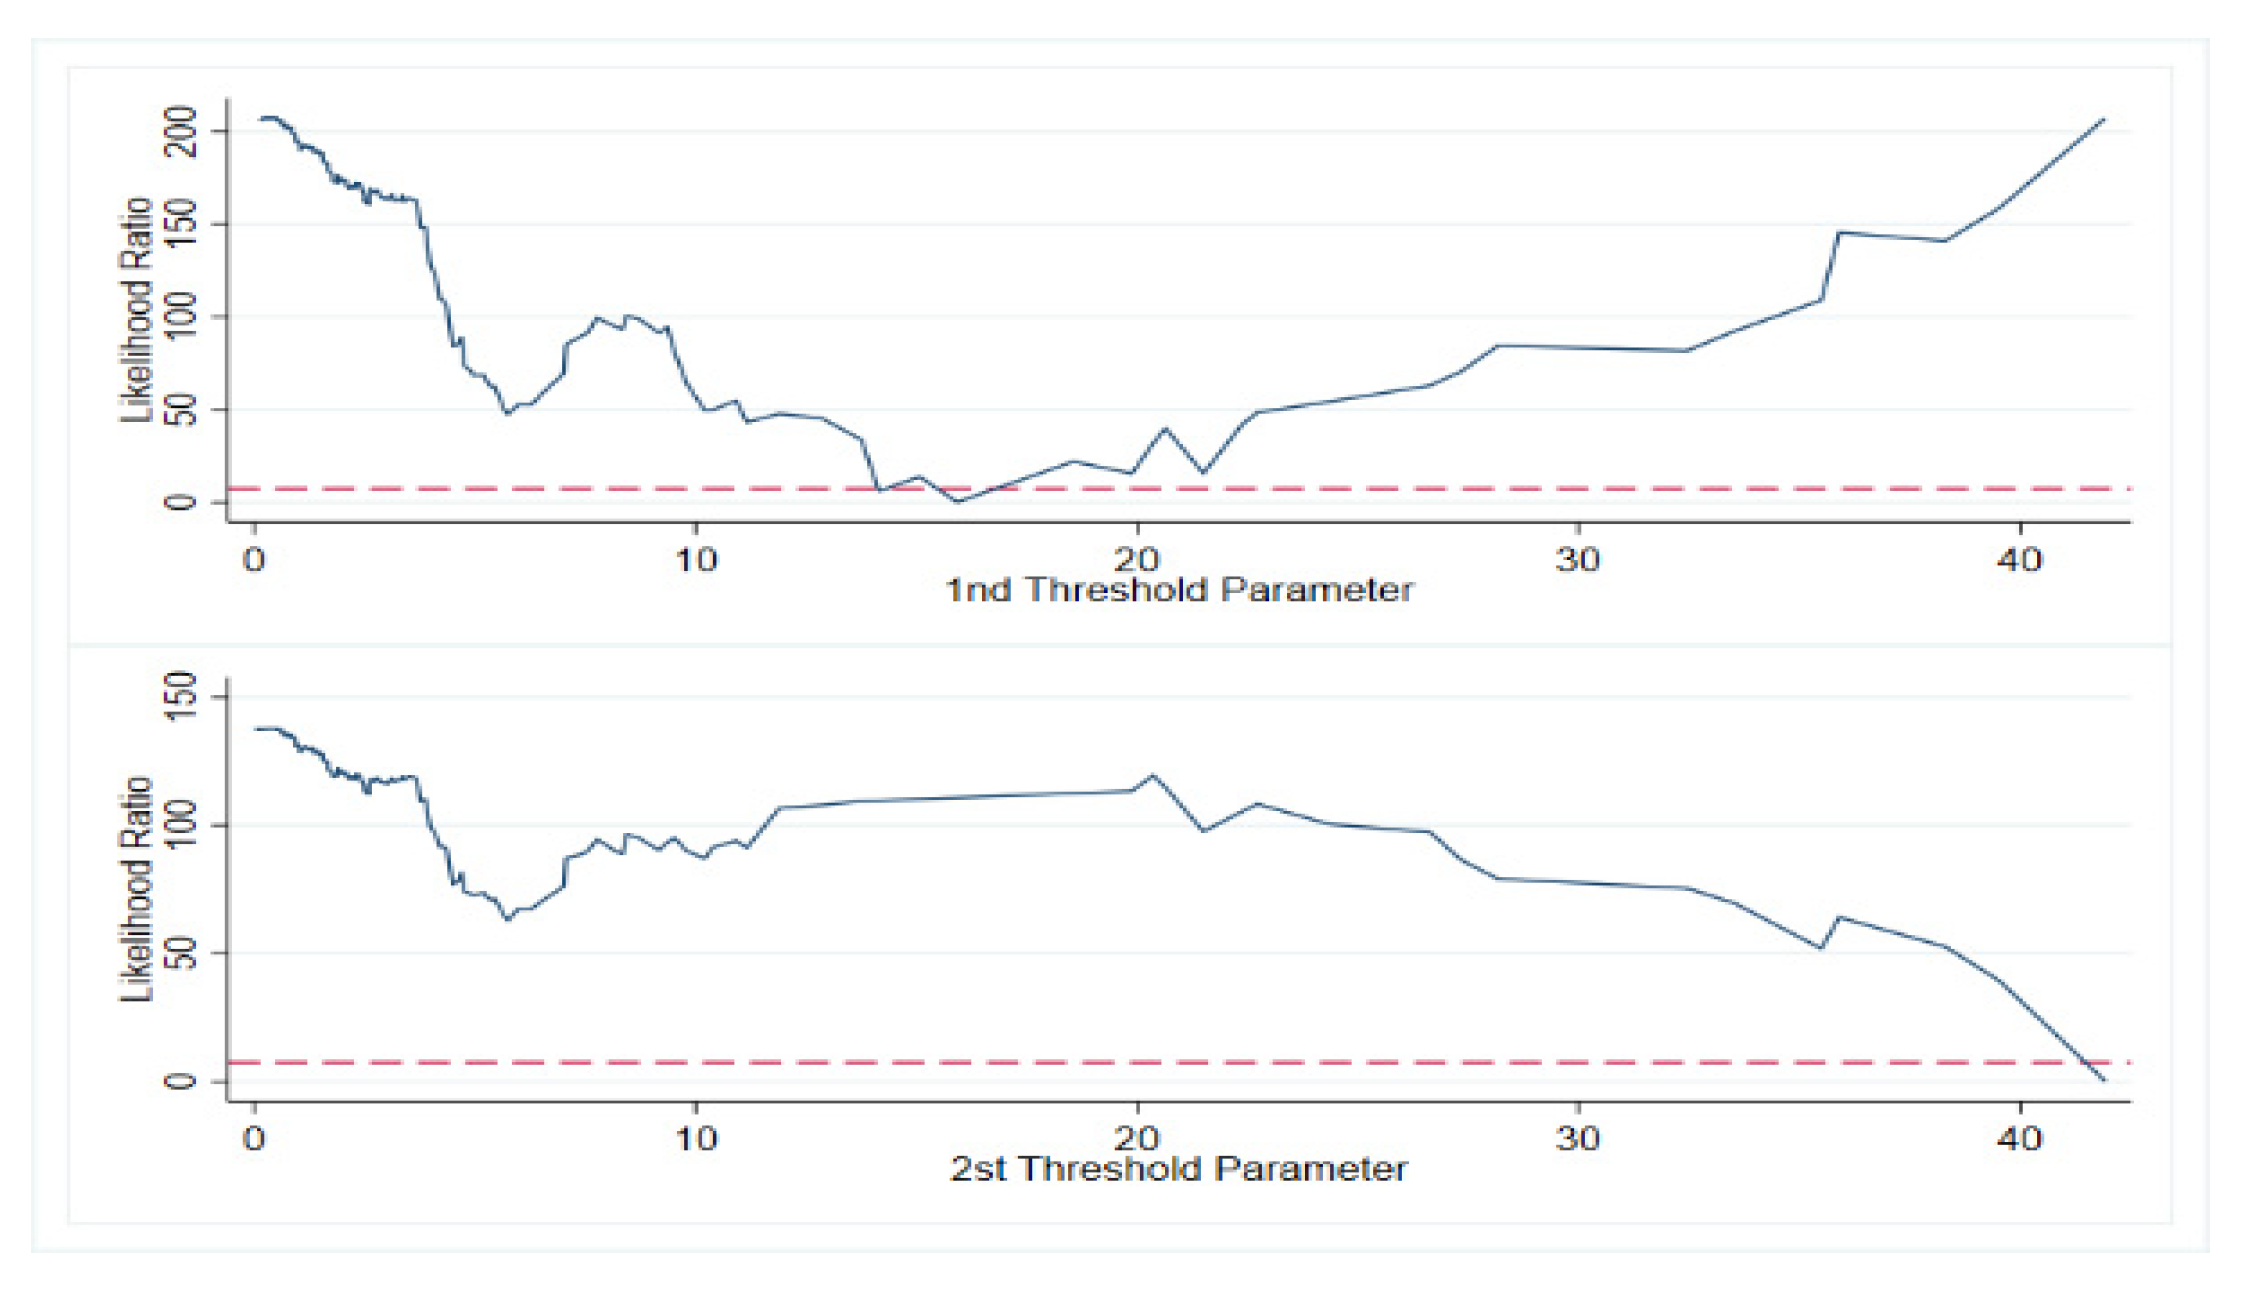
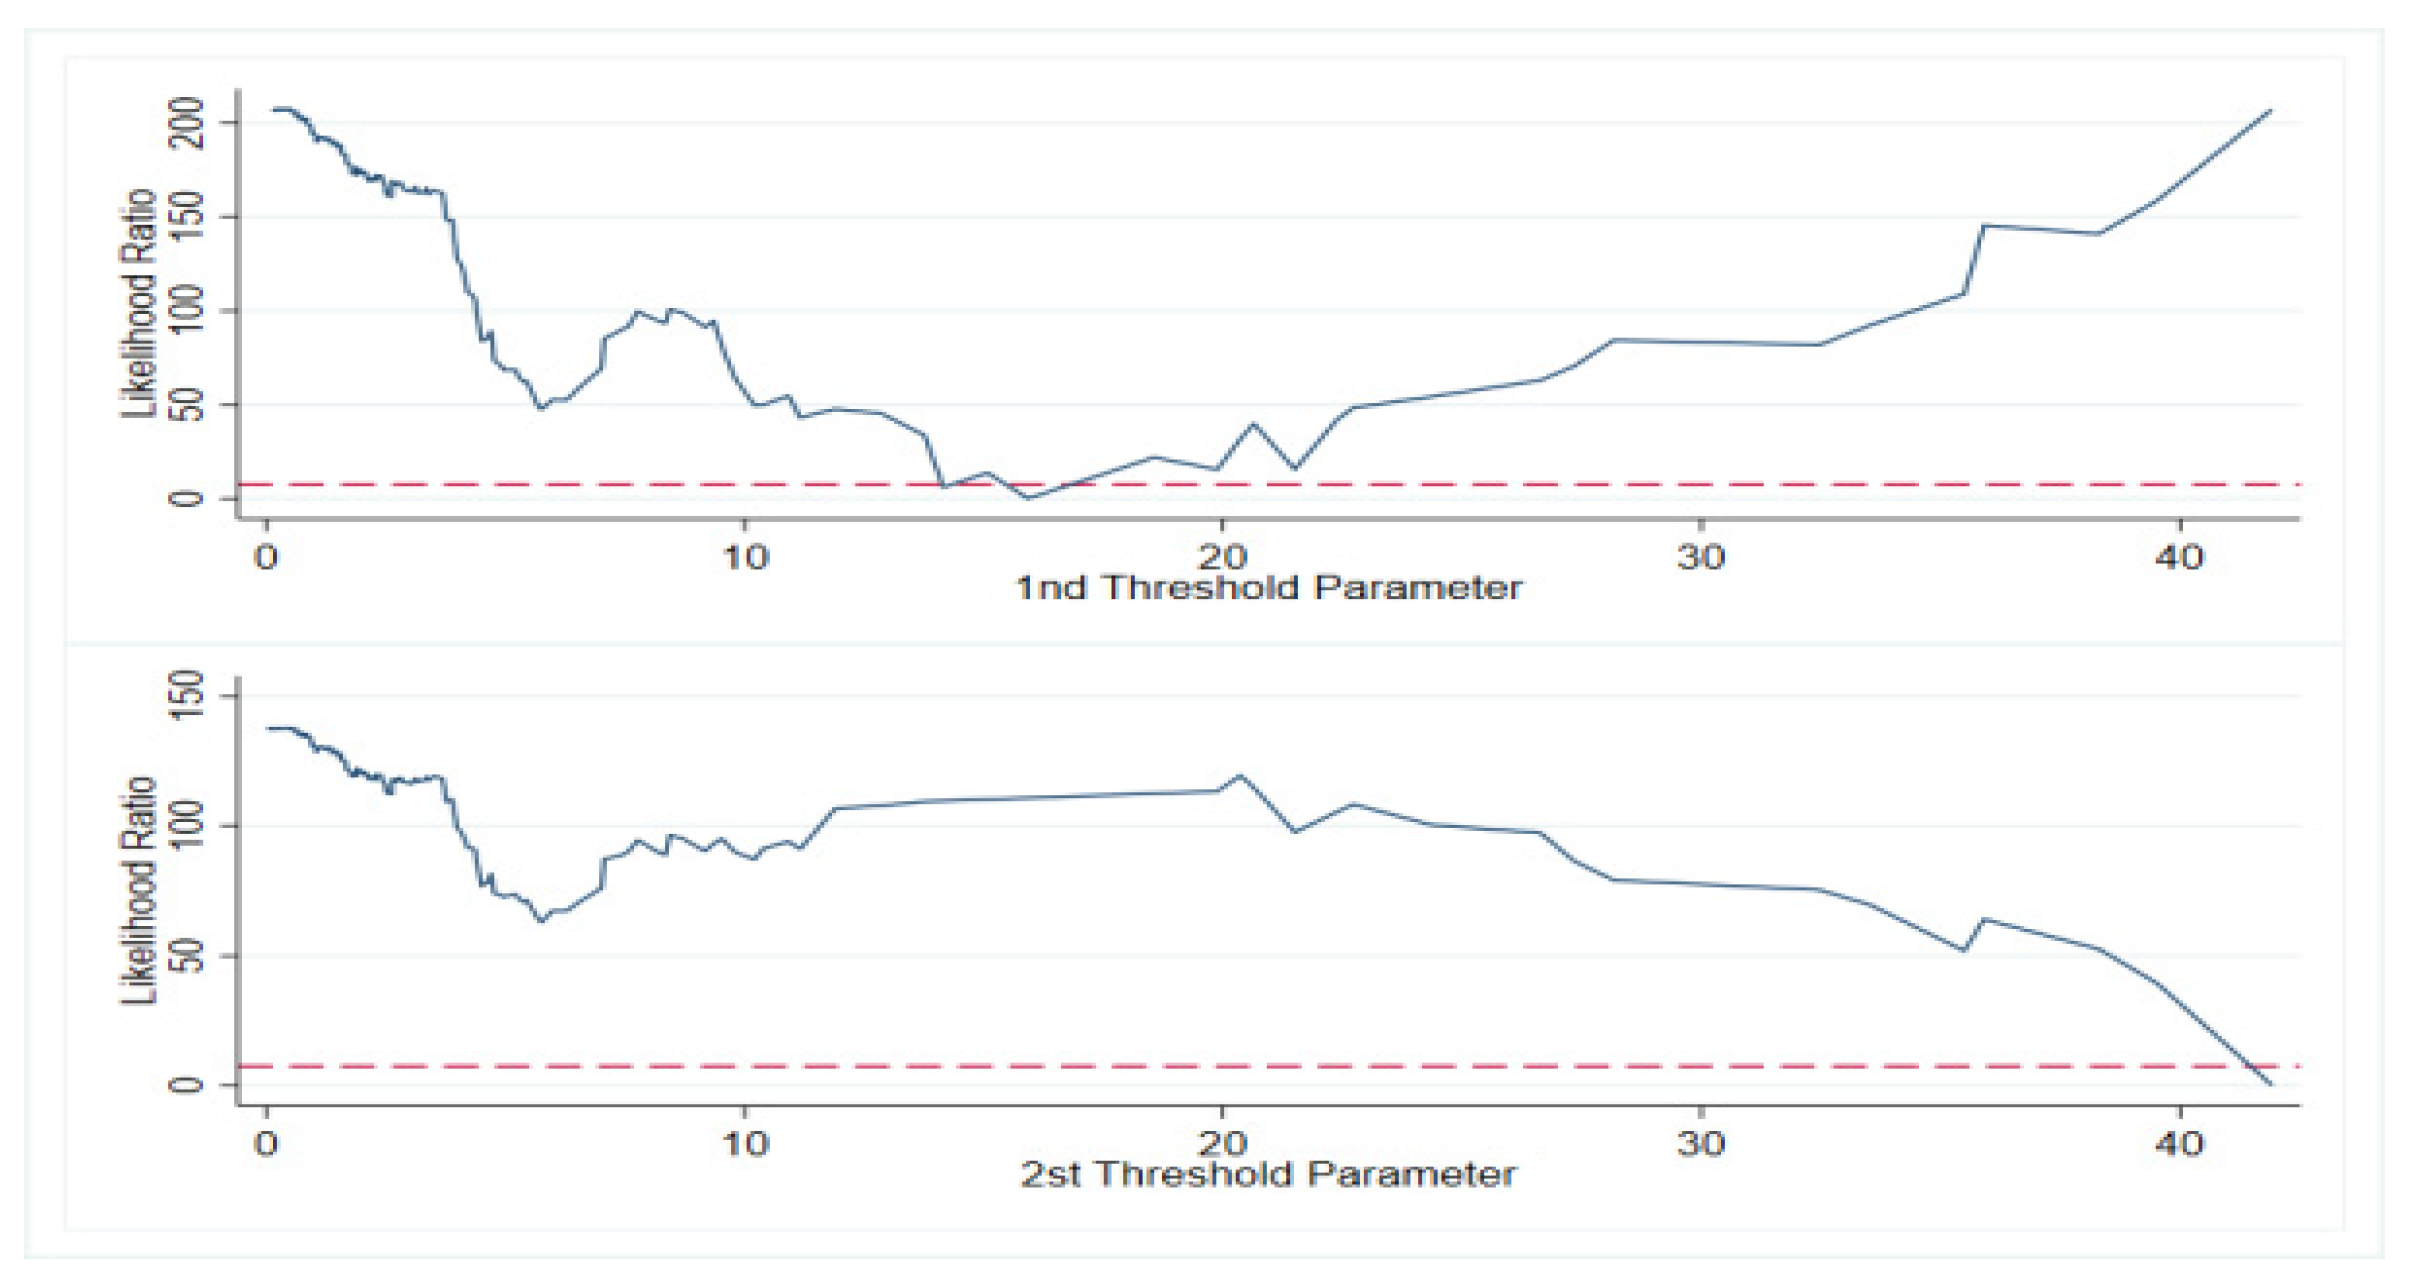
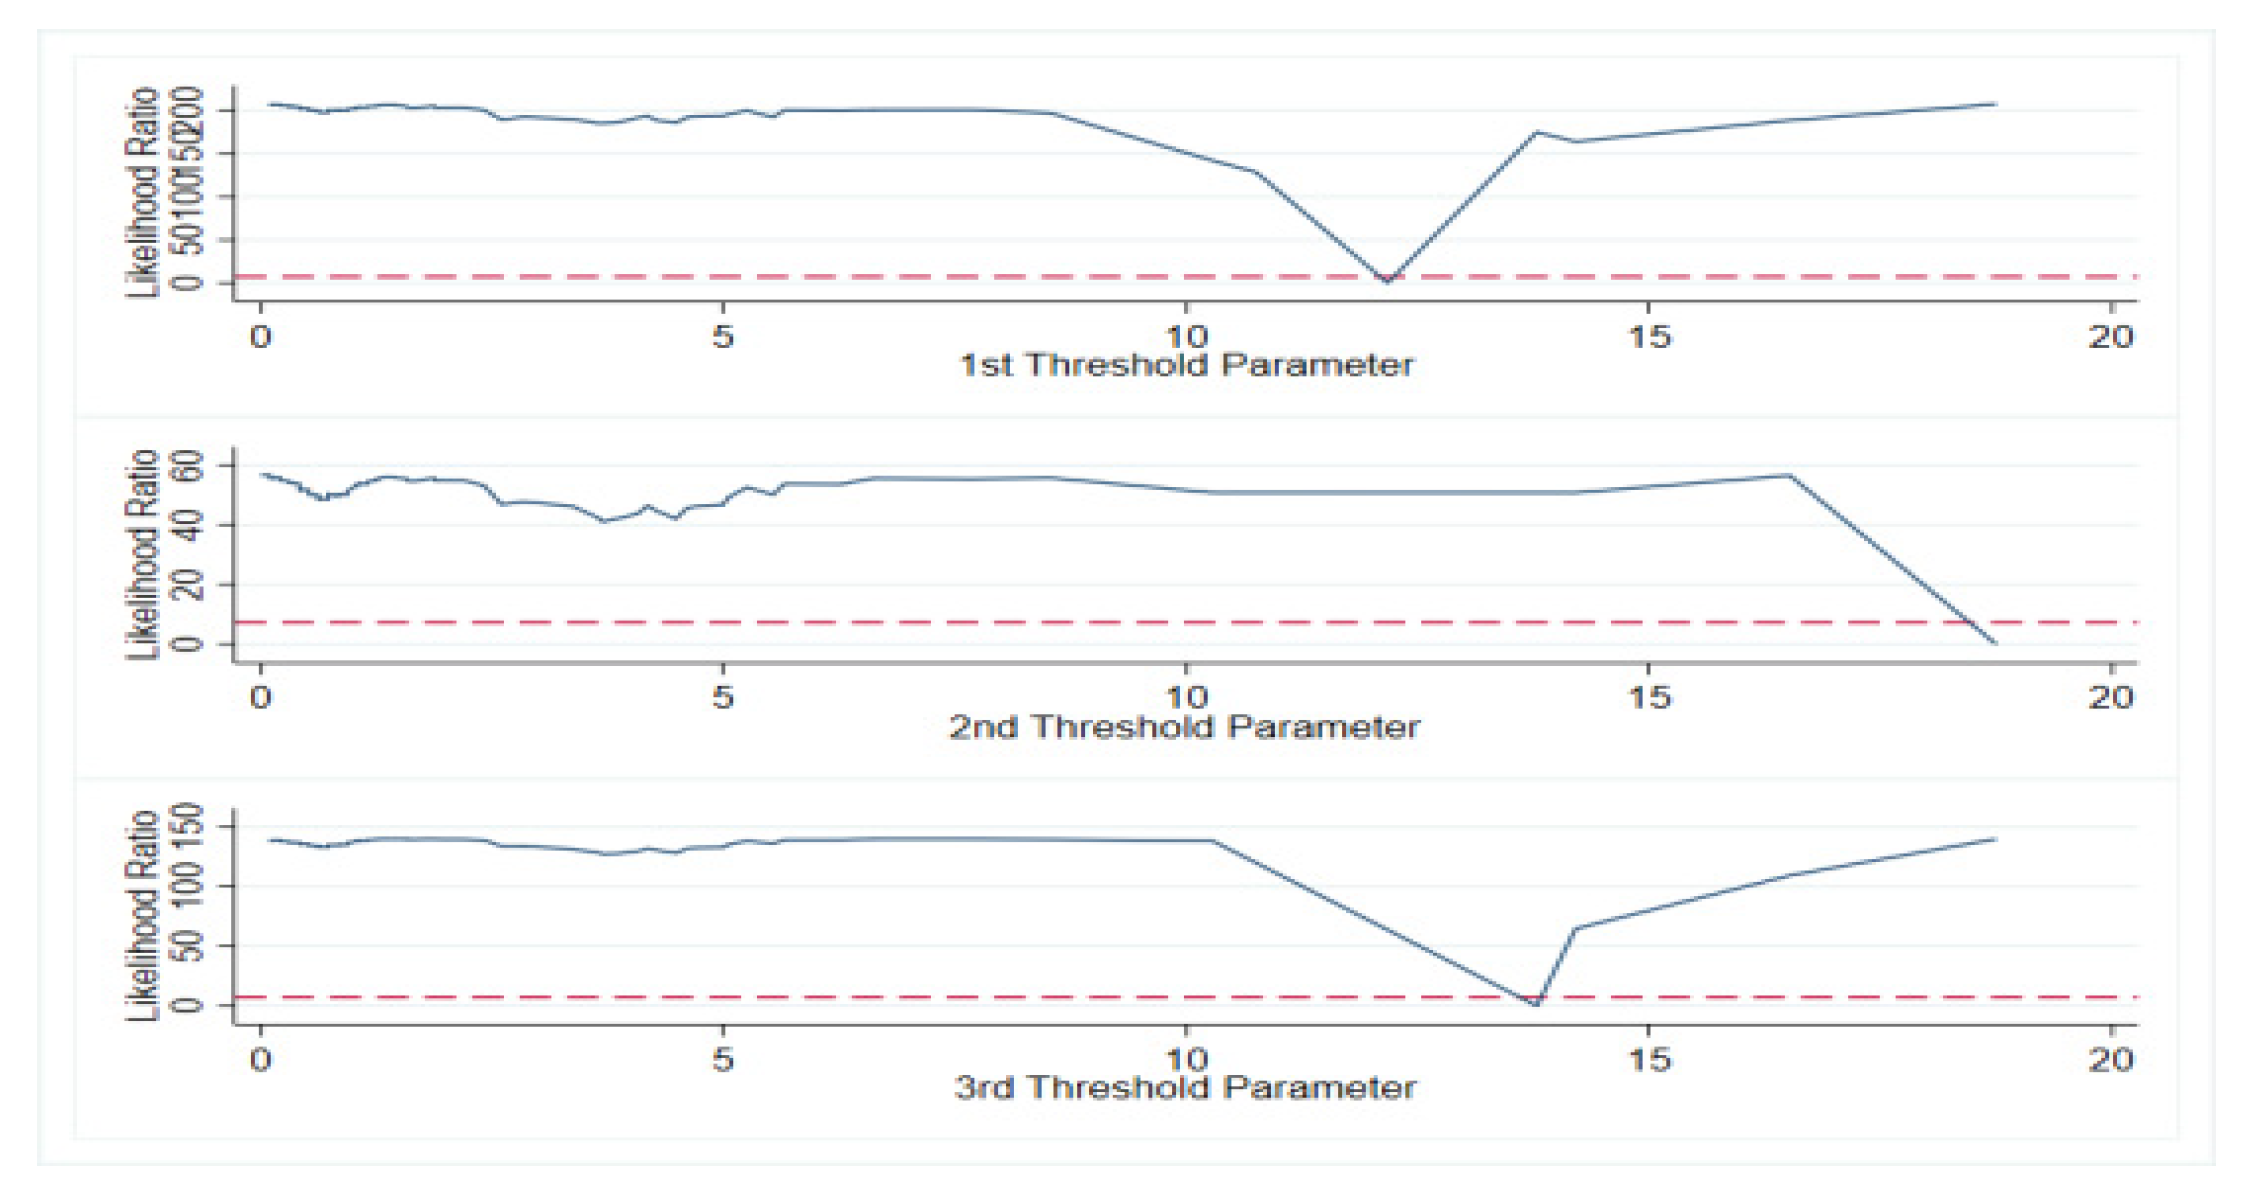
This paper examined the moderating effect of income level by constructing a panel threshold model. Compared with ordinary linear regression, the panel threshold model algorithm can divide the whole regression into several sections through bootstrap sampling and calculate its threshold value, which has the empirical advantage of demonstrating the moderating effect. Therefore, this paper took public environmental participation as the threshold variable to test the existence of the threshold value. From the test results, there was a double threshold effect in the threshold regression of the whole country, the eastern cities, and the central regions, and there was a three threshold effect in the western cities. After testing the existence of the threshold effect, the panel threshold model was used to estimate the threshold value of the moderating effect of public attention. At the same time, in order to verify the consistency between the threshold estimate and the real value, this paper drew the likelihood ratio function diagram of each region, as follows:
As seen in
Figure 8,
Figure 9,
Figure 10 and
Figure 11, all the threshold values were within the confidence interval, and the threshold values were real. Threshold regression analysis could be performed, as shown in
Table 8.
As seen from the threshold regression results of
Table 8, all regional levels were reflected in the fact that with the increase of public attention, the effect coefficient of the digital economy on urban low-carbon transformation was gradually increasing. On the one hand, the government and enterprises will not pay attention to the expansion of the investment and consumption scale brought about by the development of the digital economy, and then the problems of overcapacity and carbon dioxide emissions will occur. They will only devote themselves to the digitization of the whole society to reduce the energy consumption of individual sectors. When public attention reaches a certain level, the government cannot ignore the local carbon dioxide emissions and focuses on urging enterprises to realize the low-carbon transformation of production methods and production equipment as soon as possible and reduce the energy consumption of unit output value, thus forming a demonstration effect and promoting the low-carbon transformation of the whole city. On the other hand, in the process of digital development, it is inevitable that the allocation of resources is unreasonable, which hinders the transformation of the urban low-carbon economy. As the ultimate beneficiaries of various resources, the public can play a precise synergistic effect in the allocation of resources so as to enhance the driving effect of the digital economy on urban low-carbon transformation.
From the perspective of regional heterogeneity, as the public’s attention to climate change and carbon dioxide emissions in the eastern region gradually increases, the coefficient of the digital economy to promote the low-carbon transformation of cities also gradually increases, and the increase is relatively large, indicating that the eastern cities are the first-mover areas, with the advantages of various economic resources, and the development concept is more advanced. When the public’s attention is increased, it positively regulates the role of the digital economy in driving the low-carbon transformation of cities, increasing the coefficient from 0.105 to 0.56 and then to 0.979, and the increase is at a high level in the urban agglomeration group. From the perspective of the central region, when the public attention crosses the threshold value, the digital economy begins to have an effective influence on the low-carbon transformation of the city. This shows that when public attention is low, the development of digital technology in the central region may have a certain crowding-out effect on green technology innovation, and the government and enterprises pay less attention to it, resulting in the improvement of the level of the digital economy being unable promote the low-carbon transformation of the city. Finally, from the regression results of western cities, when the public attention is low, the influence coefficient of the digital economy on urban low-carbon transformation is very small, and when the public attention crosses the third threshold, the influence coefficient of the digital economy rises to 0.542. This also shows that when the public attention to carbon dioxide emissions or low-carbon city construction reaches a certain level, the government and enterprises have to pay attention to the public demands, increase green technology R&D subsidies, and promote green technology innovation of enterprises, thereby reducing carbon emissions and promoting urban low-carbon transformation.
In addition, this paper used the method of constructing interaction terms to test the moderating effect of public attention. The conclusions were all passed, so they are not displayed here.
6. Stability Test of Data
6.1. Unit Root Test of Main Variables
In order to avoid such situations as spurious regression, we mainly used the LLC test, the Fisher-pp test, and the Fisher-ADF test to check the stability of the data. In the selection of fixed effects and random effects, the Husman test was used to find that the
p value was significant at the level of 1%, indicating that the model should choose a fixed effect model rather than a random effect. The test results are shown in
Table 9.
6.2. Test of Exogenous Policy Impact—The “Broadband China” Strategy
The development level of a city’s digital economy often depends on the local economic development level, industrial structure, and education level, and these factors will affect the level of urban low-carbon economic transformation. Therefore, in order to avoid endogenous problems so as to more robustly assess whether the digital economy has promoted the level of the urban low-carbon economic transformation, this paper used the upgrading of Internet facilities in the “Broadband China” pilot as an exogenous policy impact, and it used the difference-in-differences (DID) method to evaluate this practical problem. In the construction of the DID model, according to the list of pilot cities in 2014, 2015, and 2016, a time for each city to implement the “Broadband China” policy was formed. If it is an implementing city, the value was 1; otherwise, it was 0. The data were collated into panel data, and fixed effect regression was performed. The DID regression results are shown in
Table 10.
All regression results showed that the “Broadband China” policy could improve the level of the urban low-carbon transition and were significant at the 1% level.
6.3. Endogenous Test—Instrumental Variable: Historical Data of Post and Telecommunications
There are many factors affecting the low-carbon transformation of cities, and the model is difficult to consider comprehensively, so it is inevitable that there will be missing variables. In addition, the development level of the digital economy is related to many economic factors, and the urban low-carbon transformation is also related to many economic factors. There may be endogenous problems in the model, which need to be solved urgently. Referring to the practice of Nunn and Qian (2014), this study introduced a time-varying variable to construct the panel instrumental variable [
24]. Specifically, an interaction term between the number of Internet users in the previous year and the number of telephones per 10,000 people in 1984 was constructed as an instrumental variable of the level of digital economy development in that year. Due to the changes of administrative divisions in some cities since 1984, the sample size of cities selected in the endogenous test was the panel data of 215 cities. The results of the endogenous test are shown in
Table 11.
According to the above endogenous test, the results reported by the two-stage least squares and LIML methods were not different from the regression results of the benchmark model, which proved that the results of this paper have a certain robustness.
6.4. Robustness Test of the Regulation Effect–Interaction Effect
In order to verify the moderating effect of public attention in the whole model, this paper verified the existence of the moderating effect of public attention in the above subject model by constructing the interaction term. The regression results of the interaction term model are shown in
Table 12.
From the results of the interaction term, public attention and the development level of the digital economy are the complementary effects of the two. That is, with the increase of public attention, the development of the digital economy drives the low-carbon transformation of the city to be more effective, and the public attention plays a positive regulatory role. The regression results of the model shown by the interaction effect are consistent with the regression results of the threshold model, indicating that the regression of the regulatory effect in this paper also has a certain robustness.
7. Discussion
Unlike previous studies, in terms of research content, previous scholars have studied urban low-carbon transformation, the digital economy, and public attention to a certain extent, and they have reached a relatively mature level, but no scholars have included these three into the same consideration framework for research and analysis. In terms of research methods, although there is no lack of research on the impact of the digital economy on urban low-carbon transformation at this stage, most of these only analyzed the positive impacts of the digital economy on urban low-carbon transformation. Few scholars have paid attention to the fact that while the digital economy is developing, there will also be a "digital divide" and a "siphon effect", which are not conducive to the transformation of the low-carbon development model of the whole country. In addition, the digital economy will also have a technology-biased energy rebound effect while developing, thus increasing local energy consumption and causing obstacles to an urban low-carbon transformation. At the same time, for the study of urban low-carbon economic transformation, few scholars have studied its regional agglomeration and inequality from a spatial perspective, as well as its demonstration effects on surrounding cities. Therefore, future work will use better research methods and related tests to address this deficiency; in terms of research objects, although there is no lack of research on the digital economy and public concern at this stage, most of these studies used provincial data as research samples and could not provide targeted policy recommendations for cities with different development characteristics. At the same time, even if a small number of scholars believe that the digital economy has both positive and negative effects on the low-carbon transformation of cities, there is a lack of research on the role of the public environment in the low-carbon transformation of cities driven by the digital economy from the micro-subject of the public. While comprehensively comparing and analyzing the positive and negative effects of the digital economy on the low-carbon transformation of cities, public environmental concerns are added to examine whether it can alleviate the negative effects and promote the positive effects of the digital economy. In addition, when selecting indicators of public concern, indicators will also be selected and processed from more micro and big data means.
Nevertheless, this paper also has some shortcomings; in the heterogeneity analysis, this paper divides the entire sample size into eastern, central, and western regions, and the research level is still at a relatively macro level. In future research, we can continue to deepen and refine the research so as to put forward more local and targeted policy recommendations for cities to achieve low-carbon transformations.
8. Conclusions and Policy Recommendations
With four decades of reform and opening up, China has not only experienced rapid economic growth but has also experienced a sharp rise in energy consumption and carbon emissions. China has become the world’s largest carbon emitter. To achieve the “double carbon” goal, China has taken a series of emission reduction measures but still faces enormous pressure to reduce carbon emissions. Based on the panel data of 274 cities from 2011 to 2019, this paper studies the impact of the digital economy on urban low-carbon transformation and its spatial spillover effect, and uses the panel threshold model to measure the moderating effect of public attention. The study found the following: (1) The regional distribution of the digital economy, urban low-carbon transformation level, and public attention is uneven, which is characterized by a “point-to-point” distribution and a “decreasing from east to west” distribution, and in terms of the speed of change, the annual increment of each indicator increased after 2015. (2) There is a “U”-shaped relationship between the development of the digital economy and the level of urban low-carbon transformation. At present, most cities in China have crossed the inflection point, showing a significant promotion effect. However, in the comparison of regional coefficients, the eastern region > the western region > the central region. (3) The development of the digital economy has a significant “siphon effect” on the spatial impact of the urban low-carbon transformation; that is, the digital economy improves the low-carbon level of cities in the region, but at the same time it reduces the low-carbon level of surrounding areas, which is not conducive to the overall realization of the “dual-carbon” goal. (4) With the increase of regional public attention, the positive role of the digital economy in promoting urban low-carbon transformation has gradually increased.
Therefore, this paper puts forward the following policy recommendations:
First, we should give full play to the role of the digital economy in energy conservation and emission reduction. Local governments should accelerate the improvement of the development level of the regional digital economy and give full play to its scale effects and technical effects. By accelerating technological breakthroughs in big data, cloud computing, intelligent manufacturing, and 5G networks, we advise the continuous penetration of intelligence and integrate information technology and services into enterprise production and environmental protection. At the same time, to improve the capacity of broadband network services, the government should speed up the use of relevant technologies in digital development to dynamically monitor energy consumption and carbon dioxide emissions, improve energy efficiency, and optimize energy consumption structures. For enterprises, in the future, they should make full use of the Internet, artificial intelligence, and information technology to improve productivity and reduce energy consumption and pollution emissions in the production process so that the digital economy can become a new driving force for high-quality economic development of enterprises. By accelerating the commercialization of 5G, the construction of the big data model, and the application of artificial intelligence, we will further consolidate information technology, increase Internet investment, promote the construction of digital China, penetrate the digital economy into all aspects of the city, and promote the low-carbon transformation of the city.
Second, we recommend attaching importance to the "Matthew effect" of the digital economy in promoting urban low-carbon development and improve the coordination and balance of digital economy development. On the one hand, the central government should carry out appropriate policy change and institutional innovation, give certain financial subsidies and tax relief to digital enterprises in the central and western regions, guide the orderly flow of digital capital and innovation factors to the central and western regions, and then improve the overall development level of the digital economy in the central and western regions so as to give full play to the quality and incremental effects of digital-related technologies on economic development. On the other hand, local governments should optimize laws and regulations related to the digital economy and strengthen the knowledge and technology spillover effects of the core region. Core cities and their surrounding areas should gradually expand information and data transmission channels, improve the level of interaction between different regions, and use their own geographical location advantages to play a demonstration effect to promote the development of the digital economy in the surrounding areas. At the same time, on the basis of absorbing relevant technologies and resources, the surrounding areas should actively digest, absorb, and learn cutting-edge technologies and even carry out secondary innovation, gradually giving full play to local late-mover advantages, improving regional digital innovation capabilities and application capabilities, and thus promoting the low-carbon transformation of cities.
Third, we advise giving full play to the moderating effects of public attention and promoting the digital economy to better enhance the impact level of urban low-carbon transformation. On the one hand, the public needs to enhance environmental protection awareness and energy conservation and emission reduction concepts, enhance health needs, accumulate human capital, and promote a "bottom-up" public supervision model so that the public can play a more effective role in public environmental supervision and energy resource allocation. At this time, the relevant environmental protection departments can regularly push relevant articles and videos on environment and climate change through innovative traditional publicity methods, using various Internet platforms and new media methods so as to improve the enthusiasm of the public to participate in environmental governance and energy conservation and emission reduction, and to enhance the attention of the masses in the influence of the social atmosphere. On the other hand, government departments should also actively pay attention to public demands on the Internet, including Weibo, Baidu, and other Internet platforms. At the same time, they can eliminate the channel obstacles of people’s demands and feedback by building official appeals and feedback platforms. Relevant government departments, starting from areas of high public concern, earnestly should understand and address the public’s demands, give full play to the role of the government’s governors, and create a good market environment by relying on the reform policies of decentralization, regulation, and service so as to realize the advantages of coordinated governance.


