1. Introduction
Oil is a strategic resource, vital for global economic and industrial development. However, the uneven distribution of crude oil resources together with the rapid growth of demand have led to profound adjustments in the trade network, and all major countries are engaged in this global competition. Beyond that, the international financial crisis, uncertain trade policies, and geopolitical conflicts will also directly affect the evolution direction of the trade system. For example, the financial crisis in 2008 systematically impacted the global crude oil trade network, resulting in reduction or even interruption of trade between partner countries. In addition, OPEC and non-OPEC countries reached a joint production cut agreement in 2017, which set the target and a combined ceiling at 1.2, 32.5, and 0.6 million barrels per day. This agreement directly disrupted the market in the subsequent phase, leading to a volatile trade pattern. Therefore, the crude oil supply and demand risk has become a central topic for all related countries [
1]. This paper aims to provide a comprehensive picture of the evolution of the global crude oil trade network pattern, a new sight on the competition and cooperation relationship among countries for crude oil as a strategic resource, and examine the impact of crude oil supply and demand country shocks on network resilience.
To date, most existing studies examine the evolution of the trade structure without considering the aforementioned dynamics. Since Serrano and Boguna (2003) [
2] pioneered the application of the CNA to the analysis of international trade, some scholars have found that the global trade network tends to expand and become increasingly connected [
3,
4,
5,
6], with a stable “core-edge” hierarchy [
7,
8] and a local “rich club” phenomenon [
9]. In this process, the network has a “small world” and scale-free character or “power law” characteristics [
10], the average trade distance between countries is significantly reduced and gradually regionalized agglomerates [
11,
12], and the distribution of trade positions among countries is non-homogeneous. The status of emerging economies climbs rapidly and gradually converges to the core region [
13]. In addition, Smith and Sarabi (2022) [
14] further explored the causes of the “core-edge” structure and found that differences in import patterns across countries are essential.
In terms of crude oil trade, other scholars argue that the global crude oil trade network is gradually expanding in size, showing a similar distribution structure, the network has a competitive relationship between imports and exports [
15], and the expansion of trade relations can reduce risks and enhance energy security [
16]. Using crude oil, coal, natural gas, and photovoltaics as research samples, Guan and An (2017) [
17] find that many joint trading partners promote the establishment of fossil energy trade cooperation. Dong et al. (2020) [
18] propose an algorithm to optimize the global crude oil trade network from the perspective of the lowest trade costs and find that the model can effectively reduce transaction costs, major oil exporters choose their partners more wisely, and trade relationships are more stable. Following descriptive analysis, scholars have studied the impact of crude oil trade network resilience on different shocks. Resilience initially refers to the ability of an entity to recover from external disruptive events [
19] and includes the ability to return to a normal state, maintain normal function and structure, maintain critical functions, and the ability to withstand disruptions and recover within the appropriate time and cost and risk [
20]. From a trade network perspective, network resilience refers to the ability of the network structure to maintain or return to normal function when the network is subjected to external shocks or disruptions [
21]. Some scholars have also found that the links of global oil trade networks show a gradual shrinking trend, natural gas trade networks show a trend of first tightening and then decreasing ties, oil trade networks are more resilient to deliberate attacks than natural gas, and natural gas trade networks are more resilient to random attacks than oil. For example, Shahnazi et al. (2022) [
22] found that China, Belarus, the United States, India, Taiwan, the Republic of Korea, Germany, Canada, Spain, and Italy are highly unstable while playing a significant role in the network, thereby reducing the resilience of the importers’ network. In addition, Saudi Arabia, Russian Federation, Iraq, Canada, Nigeria, Kuwait, Venezuela, Iran, Mexico, and Kazakhstan reduce the global oil trading network’s resilience in exports. Applying the SIR epidemic model, Garas et al. (2010) [
23] found that a crisis that originates in a large country, such as the USA, has the potential to spread globally, such as the recent crisis, and lower GDP countries, such as Belgium, can initiate a global crisis. Han and Shin (2015) [
24] developed a novel evaluation mechanism for assessing the structural robustness of a supply chain considering disruption propagation. They developed a structural robustness evaluation mechanism that integrated two quantitative metrics, average path length and degree-out degree. They argued that nodes and arcs of a network and their relationships should be considered to measure robustness more accurately. The method may be utilized to verify whether or not the planned supply chain is robust to risks.
Although existing studies provide insights into the evolution pattern of the global crude oil trade distribution, there are still some limitations. First, the network pattern is more studied from the overall structure and country-specific perspectives, while it is rare to analyze trade clustering and its changing configurations from the spatial–geographical level. Geopolitical conflicts and reduction agreements prompt the development of the GVC in the direction of regionalization and localization. Countries are beginning to pay more attention to geographical location and distance in energy trade. The development of the trade network in terms of geographical agglomeration is apparent, but the current work has not yet examined the trade network from a spatial–geographical perspective. Second, existing studies have mainly investigated the evolution of trade networks based on the steady state, ignoring the impact of external shocks on the network structure and its resilience, such as financial crises and geopolitical conflicts. Disruption of local oil supply disruptions or import surges can directly or indirectly affect the overall flow relationship, which is barely discussed in current studies. With the overconsumption of oil resources since the 20th century, the limited enlargement of production capacity, global reserves have been gradually reduced, and the risk of energy depletion of the “Club of Rome” has become more prominent. It resulted in the increasing concentration of oil production areas and the imbalance between supply and demand, of which the Russia-Ukraine conflict in 2020 is a concrete manifestation. Influenced by several factors, Russia, a major crude oil supply country, cut off crude oil exports to the EU after the outbreak of the conflict between Russia and Ukraine; President Biden announced a total ban on energy imports from Russia on 8 March. The Brent crude oil price in the North Sea broke the USD 120 per barrel mark on 23 March. Conflicts in the supply of crude oil trading countries can cause sharp fluctuations in international crude oil prices, exacerbating structural imbalances in supply and demand. Thus, their uncertainty can be transmitted through the international energy market prices and supply to the entire network, thus affecting other countries. As more countries join the competition, the global crude oil trading system is becoming progressively unstable. The impact of the COVID-19 epidemic has also aggravated the uncertainty of the network, and the global value chain division of crude oil is at risk of disruption, making it a practical necessity to examine the resilience of the trade network. Therefore, studying the network’s resilience is still necessary, considering possible disruptions.
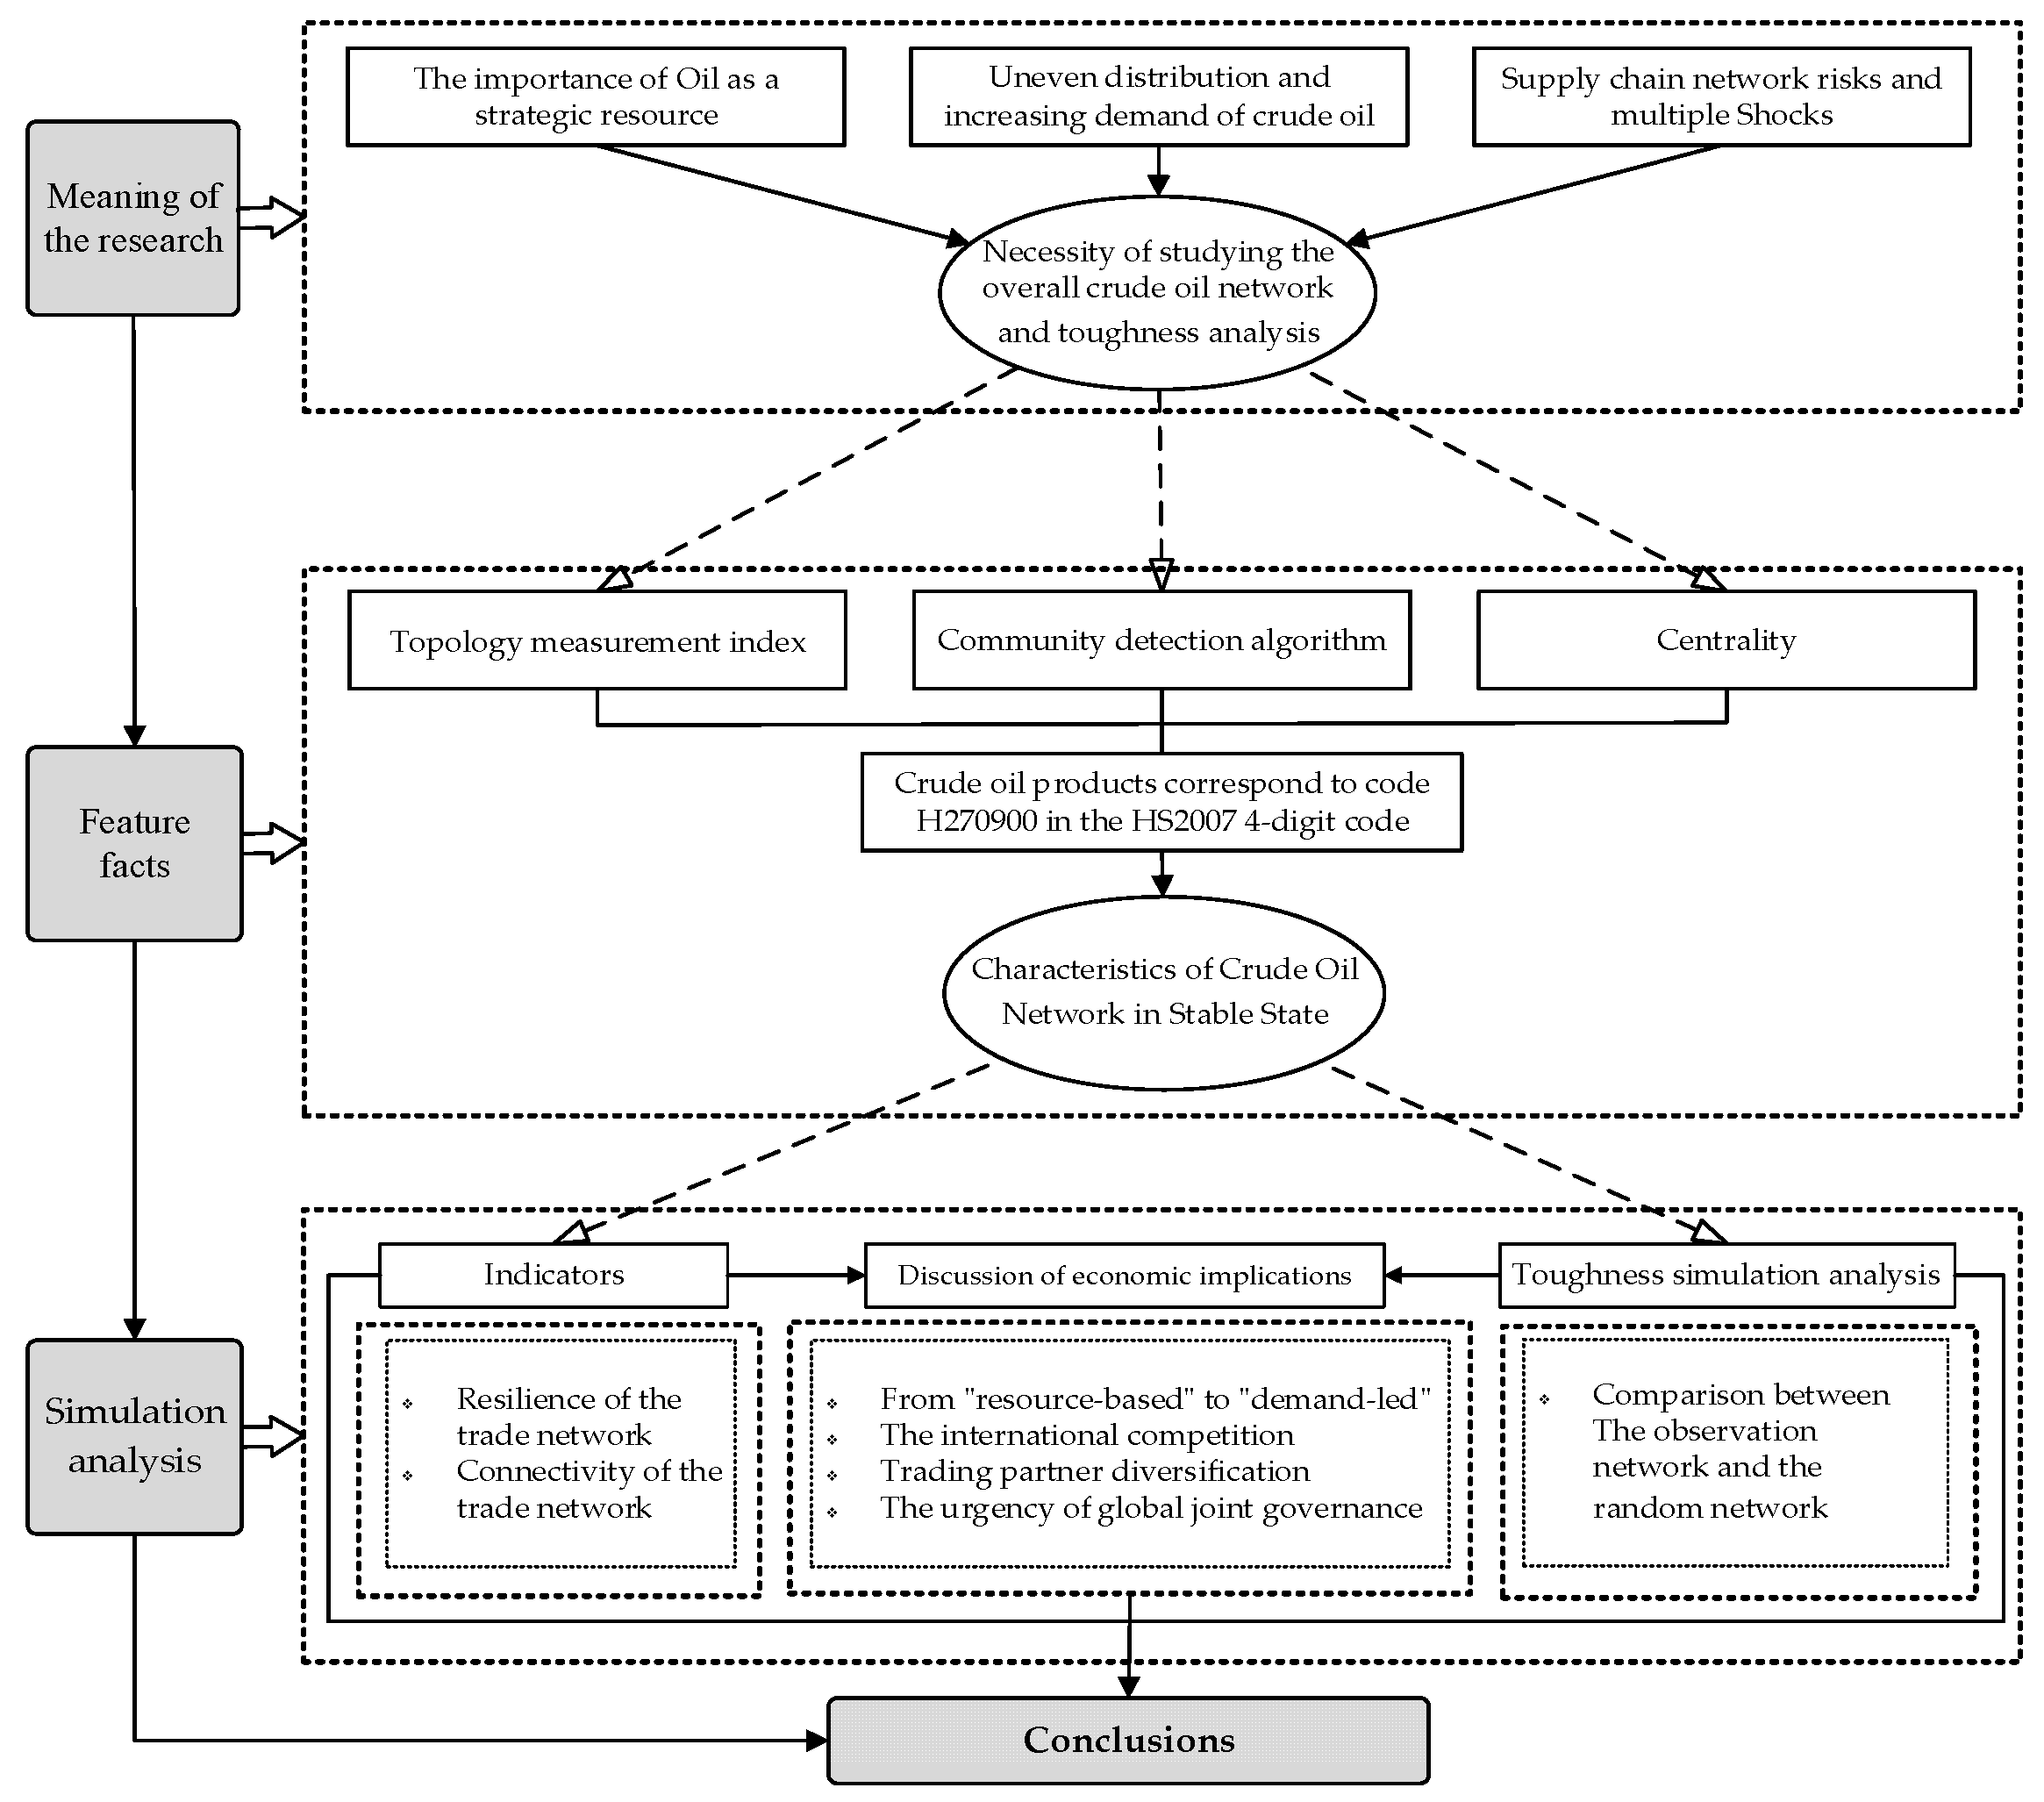
This paper adopts a complex network approach to study the evolution of the global crude oil trade network. Furthermore, a simulation method is employed to analyze the impact of external shocks on the changes in the network structure and its resilience. The major contributions of this paper are summarized as follows: firstly, it studies the trade clustering pattern from a spatial–geographic perspective. Specifically, it provides new insights on the cooperative relationship among countries, reveals the evolution of the trading system, and identifies the changes of different countries’ control over crude oil resources. Secondly, existing studies usually consider how the crude oil trade network changes but need to consider the impact of network shocks. When a country stops supplying crude oil or importing crude oil from partner countries, this will not only have to shock the partner country’s crude oil trade, which will be transmitted to the development of that country’s economy, especially industry but also have an impact on other countries through international energy prices and structural imbalance between supply and demand. Both of these approaches affect the resilience of global trade networks. If such effects are significant, the global crude oil trade faces disruptions that create systemic risks and are, therefore, detrimental to the sustainable development of the global economy. This paper provides theoretical references and policy inspirations for revealing the evolution of the trading system, identifying the changes in the competing relationships among countries, and also providing insights for multilateral cooperative governance, formulating energy trade rules and sustainable development of the global economy. In accordance with the graphical approach, the main elements of the research in this paper are shown in
Figure 1.
3. Evolutionary Features of Global Oil Trade Network Structure
3.1. Overall Topological Structure Change
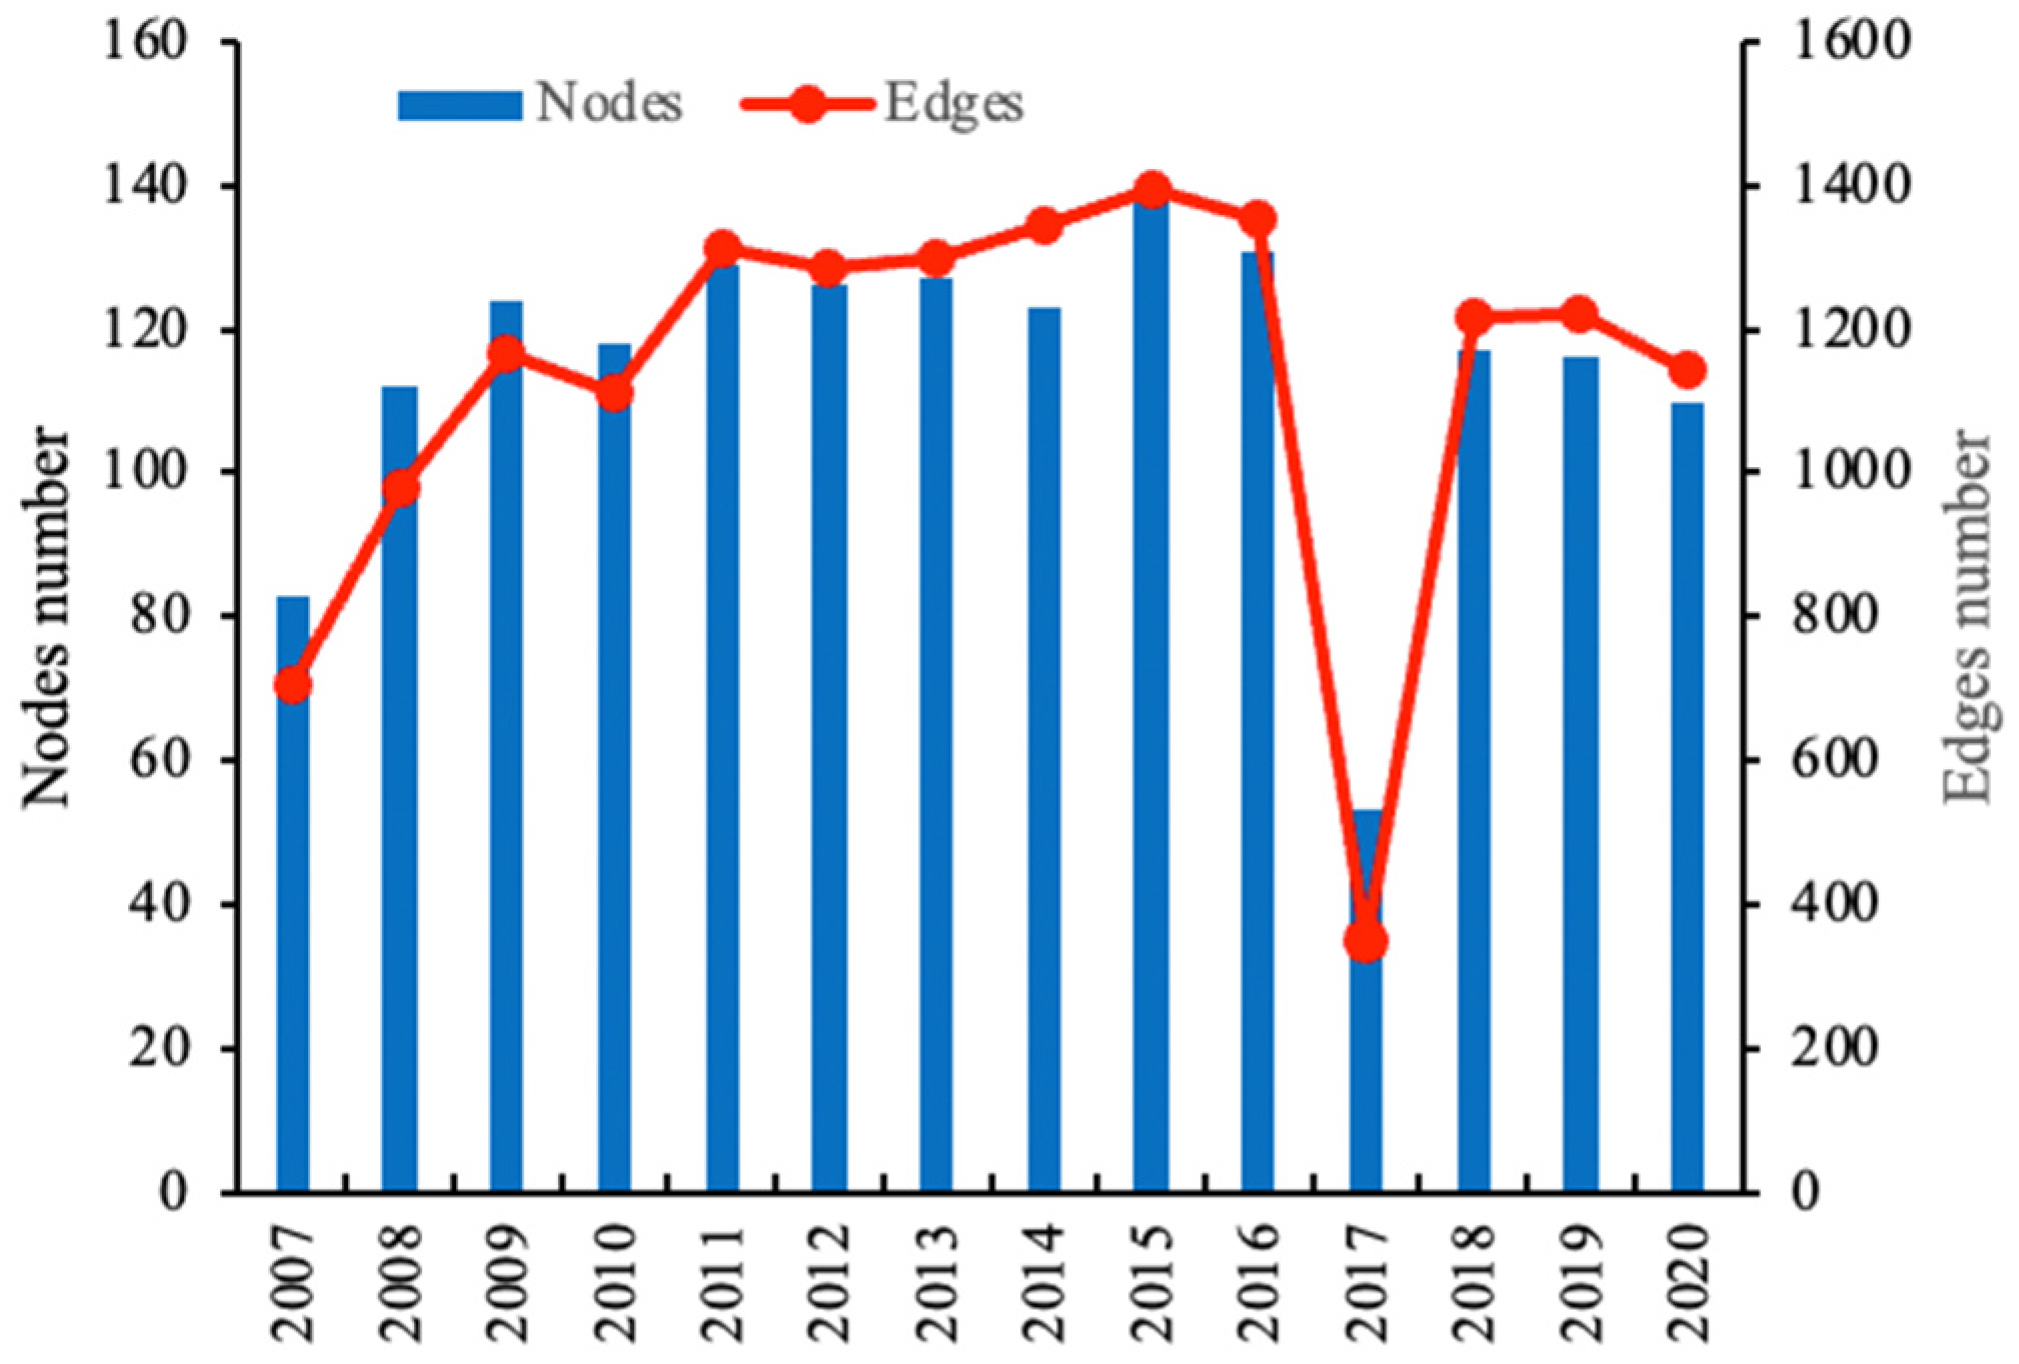
Based on Equation (1), the number of nodes and connected edges of the global crude oil trade network from 2007 to 2020 are shown in
Figure 2, manifesting a fluctuating expansion of the network in scale and trade links. The number of countries in the trade network started from 84 in 2007 to the peak of 141 in 2015, then rapidly decreased to 53 in 2017, and finally rose from 2018 to 2020. The number of contiguous countries in the network decreased moderately in 2009 and gradually rebounded. So, the 2008 Financial Crisis systematically affected the trade network, prompting some countries to reduce or close trade with partner countries. Similar to Zhong et al. (2014) [
31], we find that many countries returned to their original communities after 2009, and the value of consumption, production, and prices seemed to be recovering. In 2017, the significant decline in both the number of countries and the adjacent edges may be related to events such as the extension of OPEC production cuts, the continued low national oil prices, and the successful test mining of combustible ice in the United States and China. Among the reasons for this are three main points: (1) In January 2017, the OPEC and non-OPEC oil-producing countries’ production cut agreement came into effect, with both targeting production cuts of 1.2 million barrels per day (BPD) and a combined ceiling of 32.5 million BPD and 0.6 million BPD, hugely affecting the trade network. It prompted a significant decline in global crude oil trade, with average daily crude oil production cut by 9.7 million barrels, accounting for 13.5% of global crude oil trade (BP World Energy Statistics Yearbook, 2019). (2) It also prompted sharp fluctuations in international crude oil prices, with NYSE crude oil futures prices falling 24.59% and London Brent crude oil prices falling 24.1% on 9 March. The sustained low international oil prices from 2015–2017, coupled with the high cost of oil sands and market opportunities in the U.S. shale oil sector, led to oil giants such as Statoil, Shell, and ConocoPhillips to selling up to CAD 24 billion of Canadian oil assets successively. The decline in crude oil production and the sharp drop in oil prices prompted a surge in crude oil gates of major demand countries in the context of energy security concerns, which primarily hit crude oil imports from other countries. (3) In March 2017, U.S. President Donald Trump signed an Executive Order on the Clean Power Plan, requiring states to cut carbon emissions from coal-fired and gas-fired power plants, which may indirectly curb the expansion of U.S. crude oil imports. Meanwhile, the development of energy sources such as shale gas in the United States has also substituted for crude oil trade, weakening its trade dependence on crude oil resources. As a result, the global crude oil trade network in 2017 saw a significant decrease in countries and contiguous sides.
In conclusion, the upward trend of the global crude oil trade network indicates that more and more countries have participated in conducting trade with each other. On the other hand, the fluctuations indicate that the trade network is inherently unstable. It is subject to multiple factors, including but not limited to OPEC oil producers’ market decisions, energy policies of major oil-demand countries, the primary trend of international oil prices, and geopolitics.
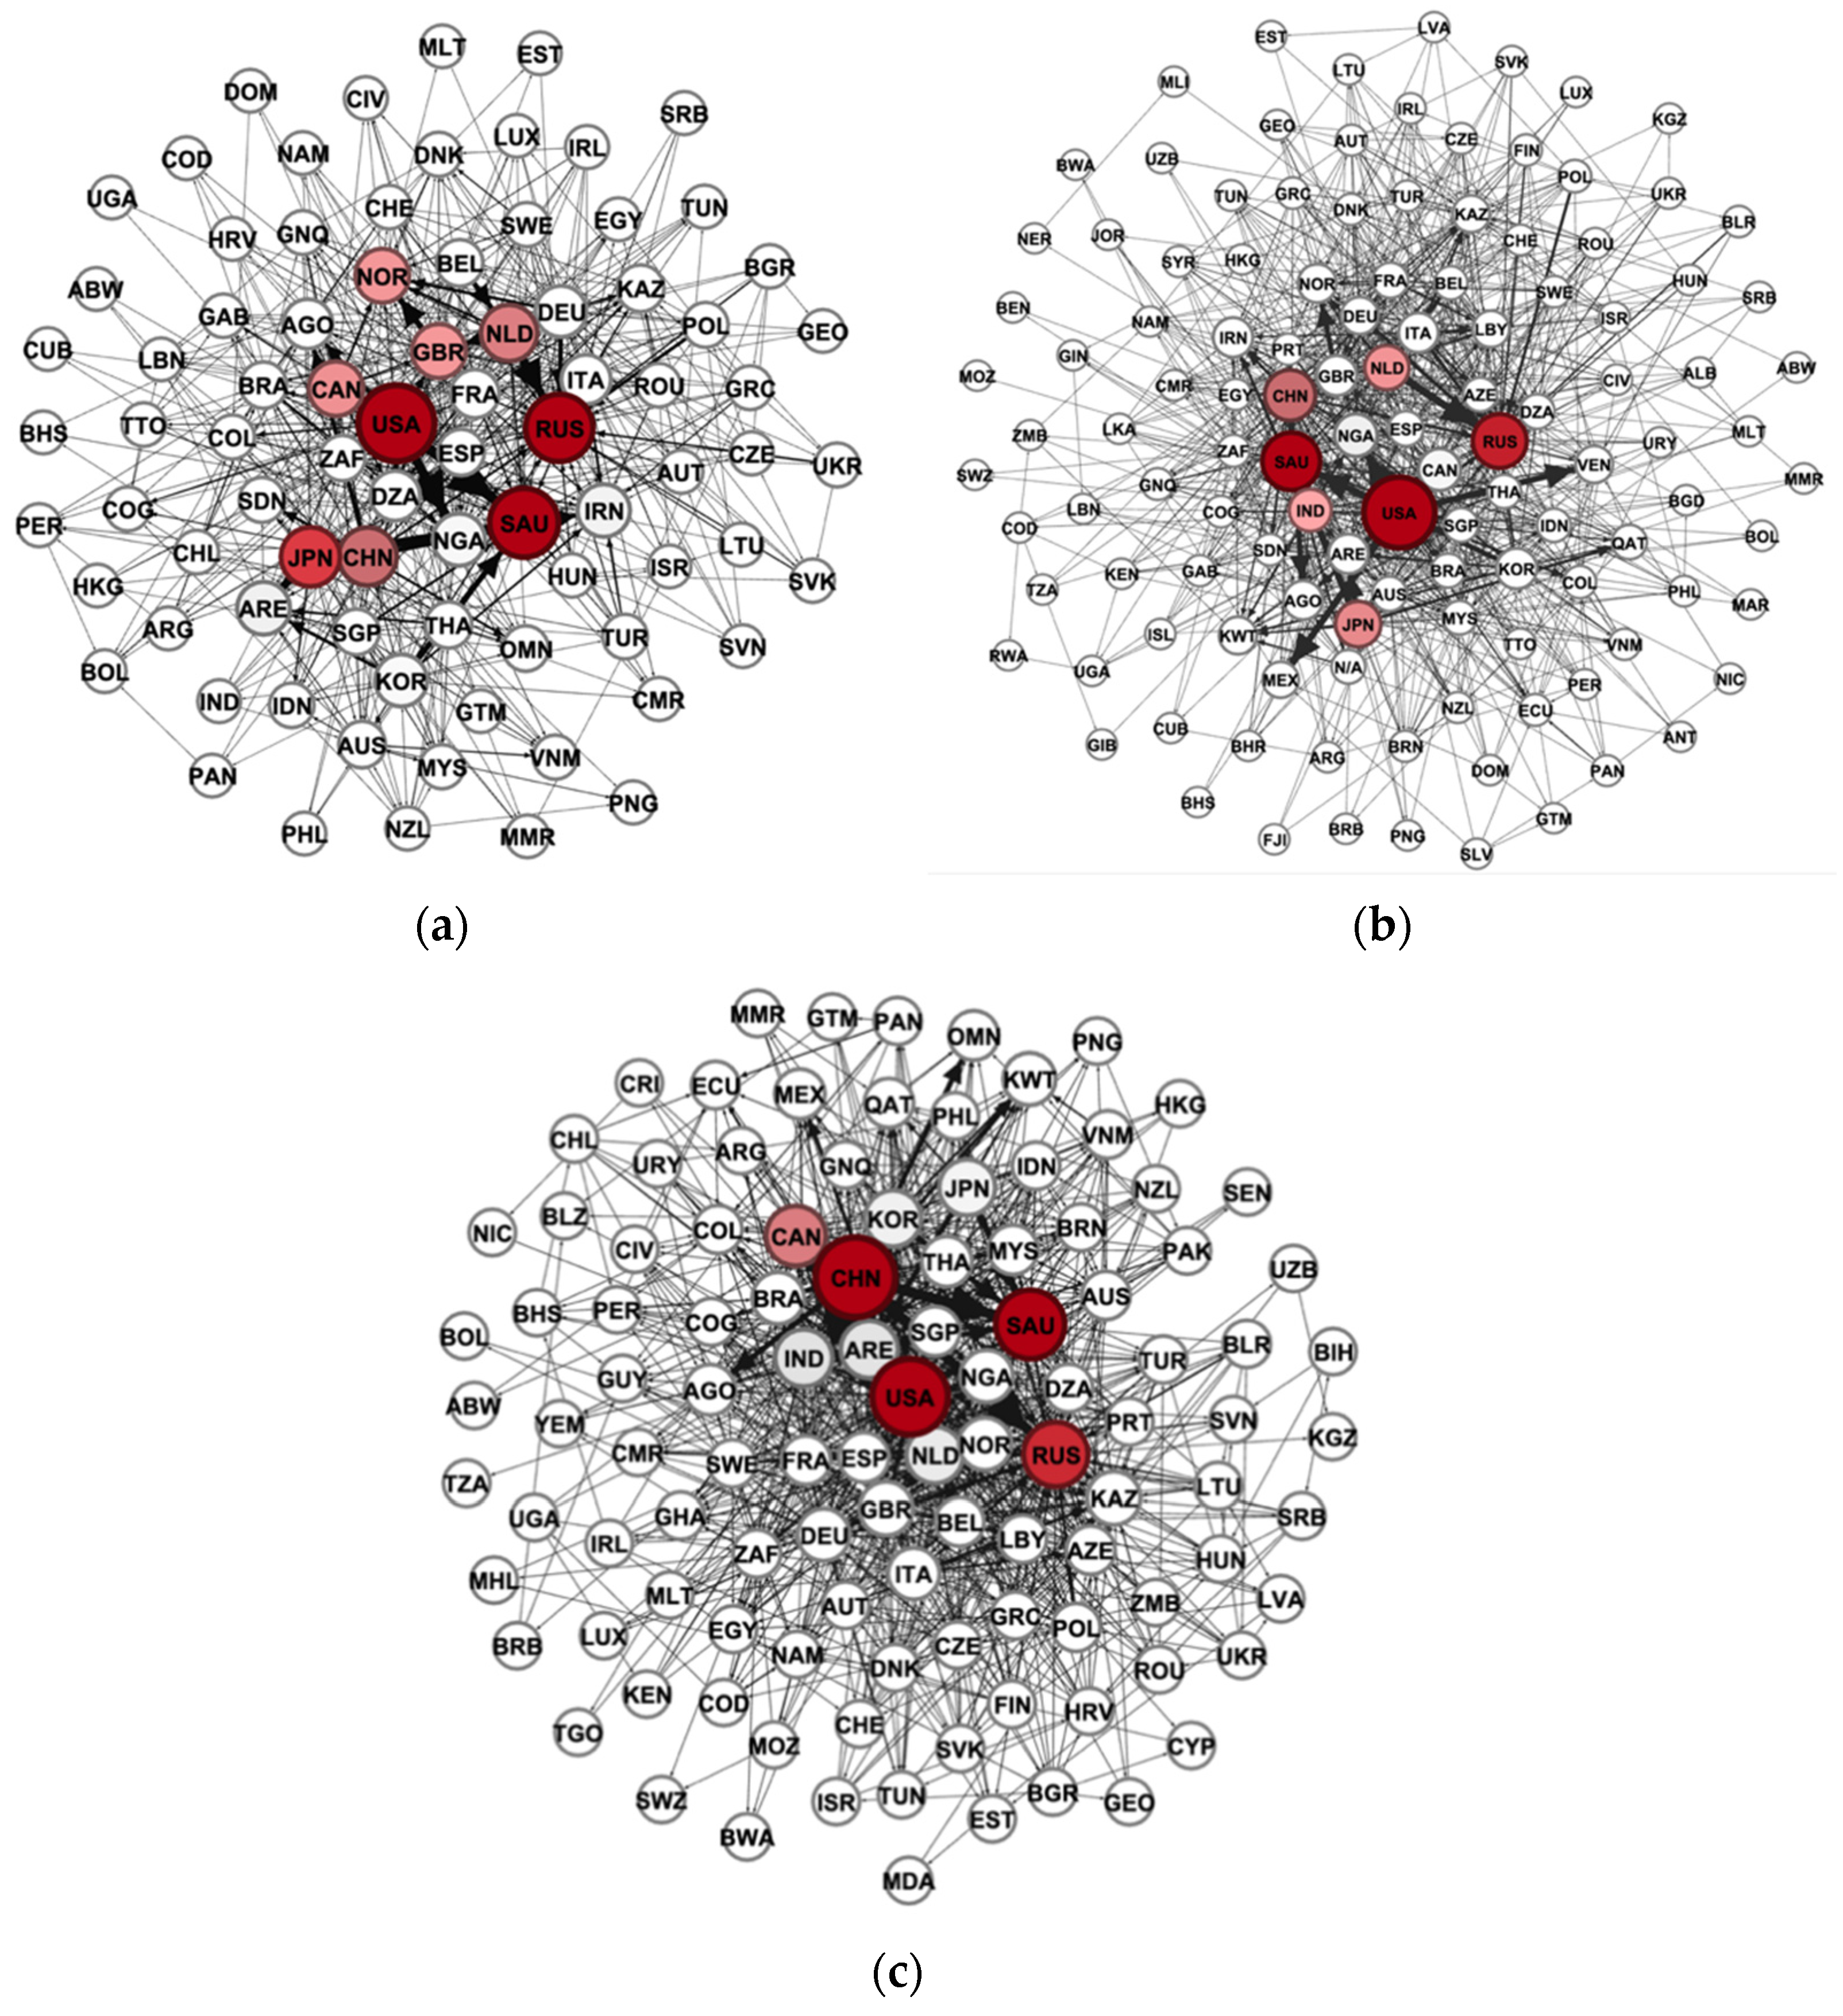
In order to reveal the distribution pattern of the trade network and its evolution, this paper utilizes the gravitational directed algorithm introduced by Fruchternman and Reingold (1991) [
32]. What is shown in
Figure 3 is the topological structure of the crude oil trade network in 2007 and 2020 using Gephi software. It can be seen in (a) that the network in 2007 was relatively sparse, with few connected edges and uneven distribution, basically forming a “core-edge” hierarchy with the United States, Saudi Arabia, Russia, and Japan as the core, and Canada, China, the Netherlands, Norway, and the United Kingdom as the second core. Among them, the nodes of countries with significant crude oil demand and supply, such as the United States, Saudi Arabia, Russia, and Japan (dark red nodes) in the central region, are more prominent in shape and darker in color. The edges among these countries, crude oil channel countries, and major demand countries such as Canada, China, the Netherlands, Norway, and the United Kingdom (light red nodes) in the sub-region are significantly more comprehensive than those of other countries (white nodes). The core and sub-nuclear countries have clear bilateral relations, and the countries overlap and intertwine as partners. It means that the core countries not only control the main trade flows of global crude oil but also exert the highest level of regulatory power. Before the 2008 Financial Crisis, countries such as the United States, Saudi Arabia, Russia, and Japan processed the right to price the resources, while other non-core countries had relatively weak influence. The global crude oil trade involves most countries and regions, and the unbalanced geographical distribution of supply and demand areas is one of the factors contributing to the “core-edge” hierarchy of the trade network.
(b) In 2010, the “core-edge” hierarchy of the trade network remained stable with the United States remaining the darkest, while the number of countries in the network increased significantly, and the number of connected edges also rose relatively. The network structure became denser and sparser. The major countries remained unchanged, but the sub-central countries switched to China, India, Japan, and the Netherlands. The influence of Canada and Norway relatively decreased compared to the early period and the rest countries were stable. Despite not being the world’s largest crude oil producer, the position of the United States was relatively higher than other countries due to its massive demand, its well-developed financial markets, and its strong voice in the market. The core position of non-producing countries was mainly gained through their advantage of occupying global transportation corridors or performing distribution functions. For example, neither Canada nor the Netherlands are not major crude oil producers, but Canada’s north–south oil pipeline network mainly exports oil to the United States, while its eastern region barely enjoys the benefits of the pipeline, so it turns to import the Texas crude oil for convenience through the U.S. domestic pipeline network. The Netherlands mainly relies on the ports of Rotterdam and Amsterdam and large oil trading companies to trade with the major countries, especially maintaining a bilateral trade with most European countries, so it eventually has developed into a global oil trading center.
(c) As depicted in the sub chart, the basic structure of the trade network remained unchanged in 2020. However, the central countries altered to the United States, Saudi Arabia, Russia, and China. Compared with the previous period, the rapid expansion of China’s trade position is most evident, as China has become a major crude oil trading power due to its huge domestic demand. Though, China is not the top crude oil producer and its relatively large overseas demand determines the centrality of China and increases its dependence on the global market.
From subplots (a)–(c), it can be seen that the global crude oil trading system is still dominated by oil-producing countries such as OPEC and major demand countries such as the United States, and the trading among them maintains relatively stable. The scale of trade among countries such as Saudi Arabia, the United States, Russia, and Canada is a major part of resource allocation. These large-scale trade relationships further contribute to their close cooperation and also help to maintain the structural stability of global energy markets. In contrast, minor trade relationships are less stable and highly fungible. Given the national energy security and geopolitical considerations, small-scale trading countries can balance supply and demand through other channels. In addition, the “core-margin” structure also highlights the necessity for major developing and less-developed countries to improve their trade status to enhance their discourse and pricing power in the global market.
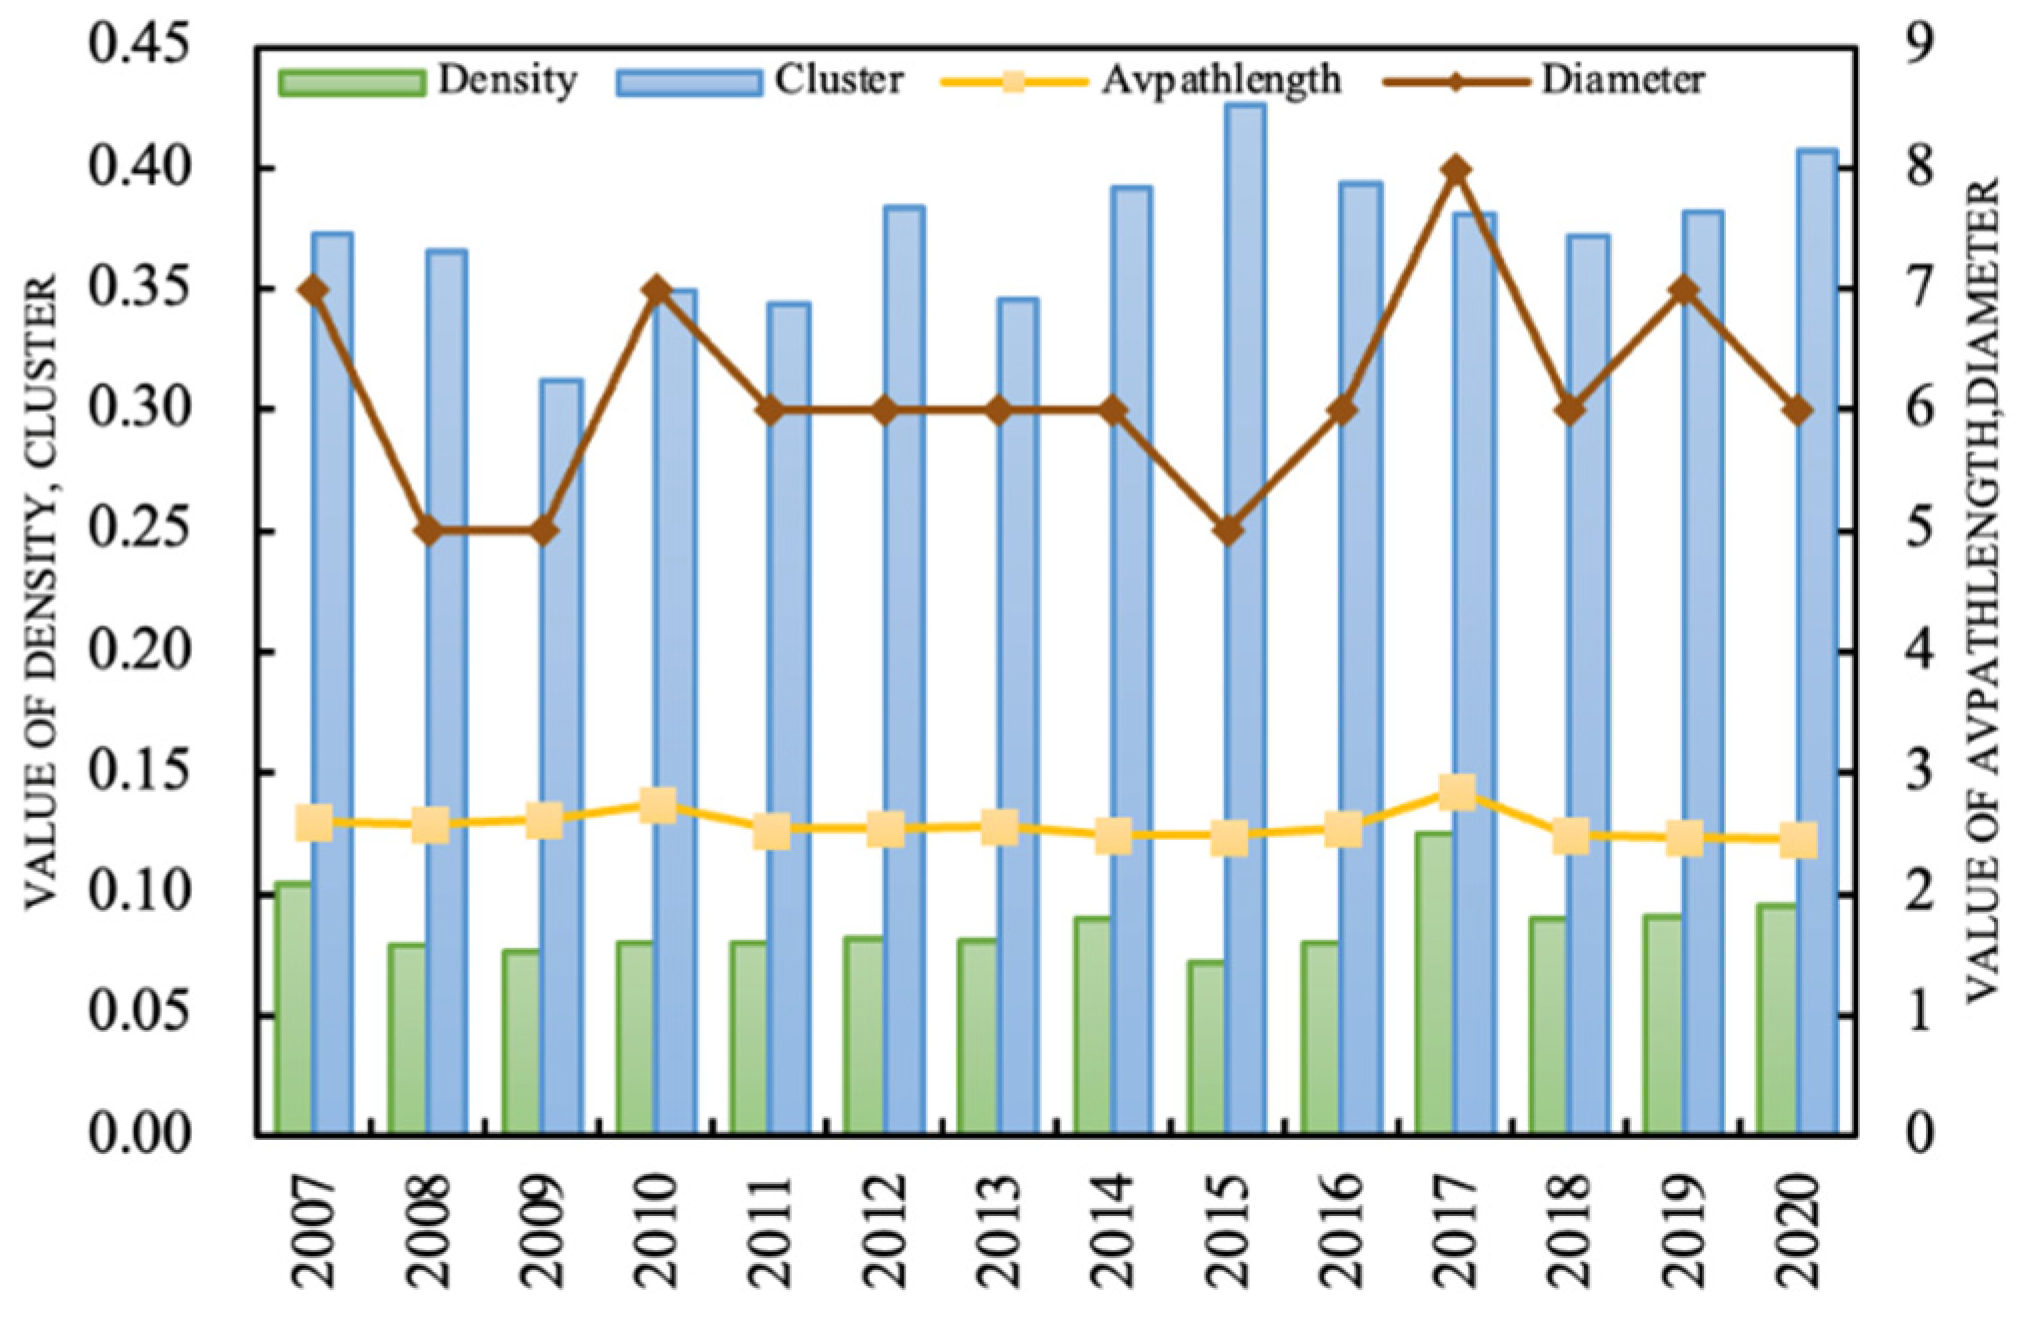
Examining the distribution pattern of the trade network from the overall topological structure is not enough to accurately illustrate the internal changes of the network, for example, the degree of closeness between nodes, the trend of conglomeration, the length of GVC, and the degree of connectivity. For this reason, this paper measures the changes in network density, the average clustering coefficient, the average path length, and the network diameter using Equations (2)–(5), respectively (as shown in
Figure 4). As can be seen, density displays a fluctuating decreasing trend in general. It went down from 0.104 in 2007 to 0.08 in 2016 before rising to 0.125 in 2017, and finally reached 0.095 in 2020, indicating that the closeness of the trade network tends to decline and the trade links tend to be sparse. The fluctuation of clustering indicates that the trade network grouping changes irregularly but leans to strengthen in general. This trend reflects the signs of grouping from global to regionalization. As most countries carry out trade with a few countries, this grouping has inherent stability. The non-homogeneous spatial distribution of crude oil resources, the concentration in a few oil-exporting countries, and the geographic transportation costs are the direct factors that govern the groupings among countries. Moreover, it reveals that any country only needs to go through about six countries to establish a crude oil trade connection with another country, and the length of this path is gradually shortening. Additionally, the integration of the division of labor has been enhanced and the distance of trade between countries is shortened. To summarize, the evolution of the global crude oil trade network and the division of labor bring the trade closer and the length of labor chain shorter. In their papers, Johnson (2014) and Timmer et al. (2014) emphasized a similar point.
3.2. Trend of Community Structure Distribution
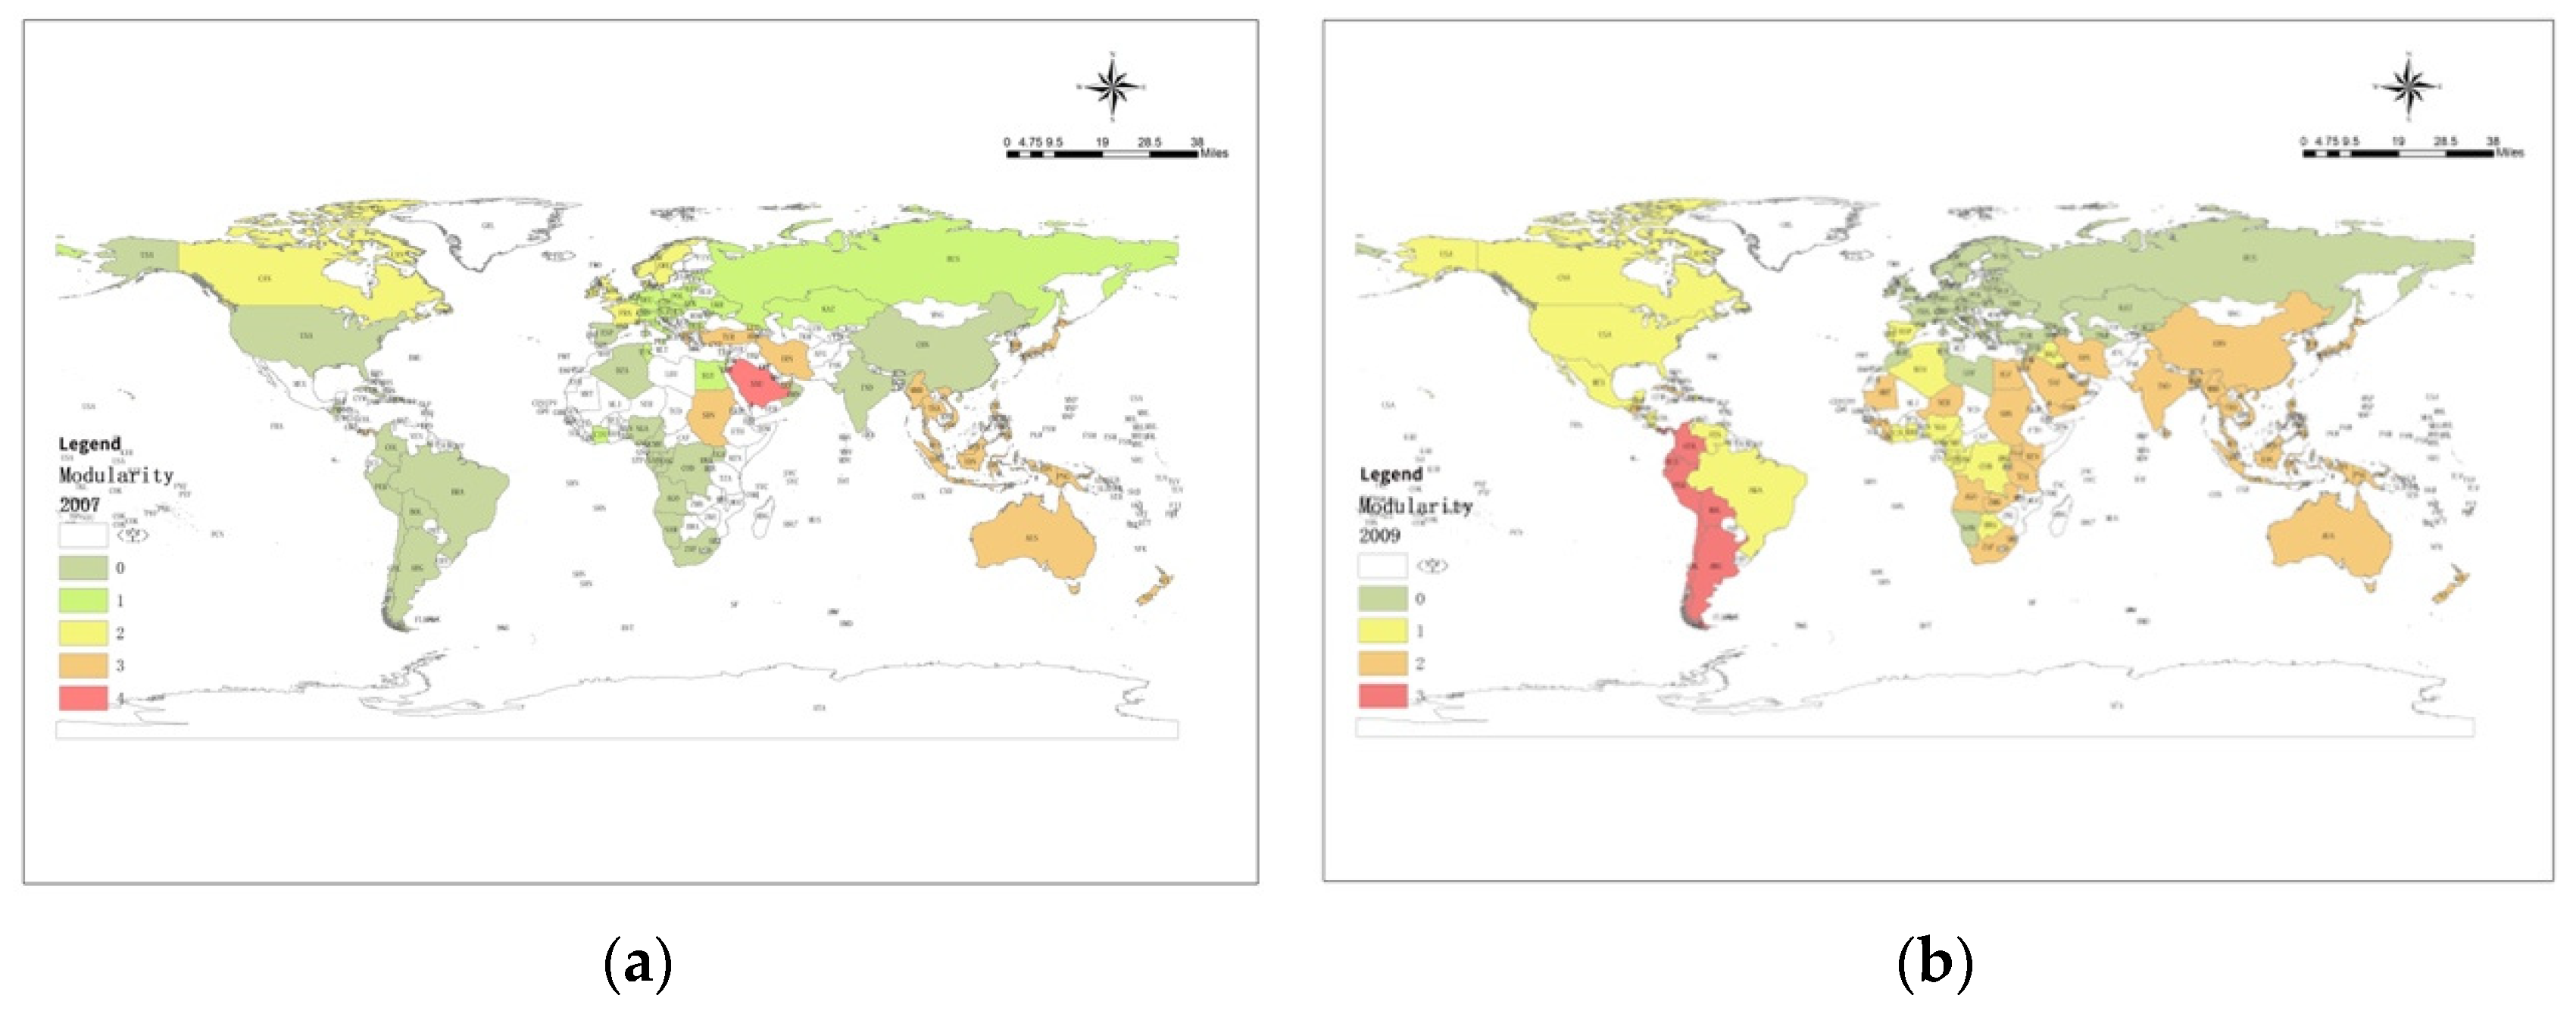
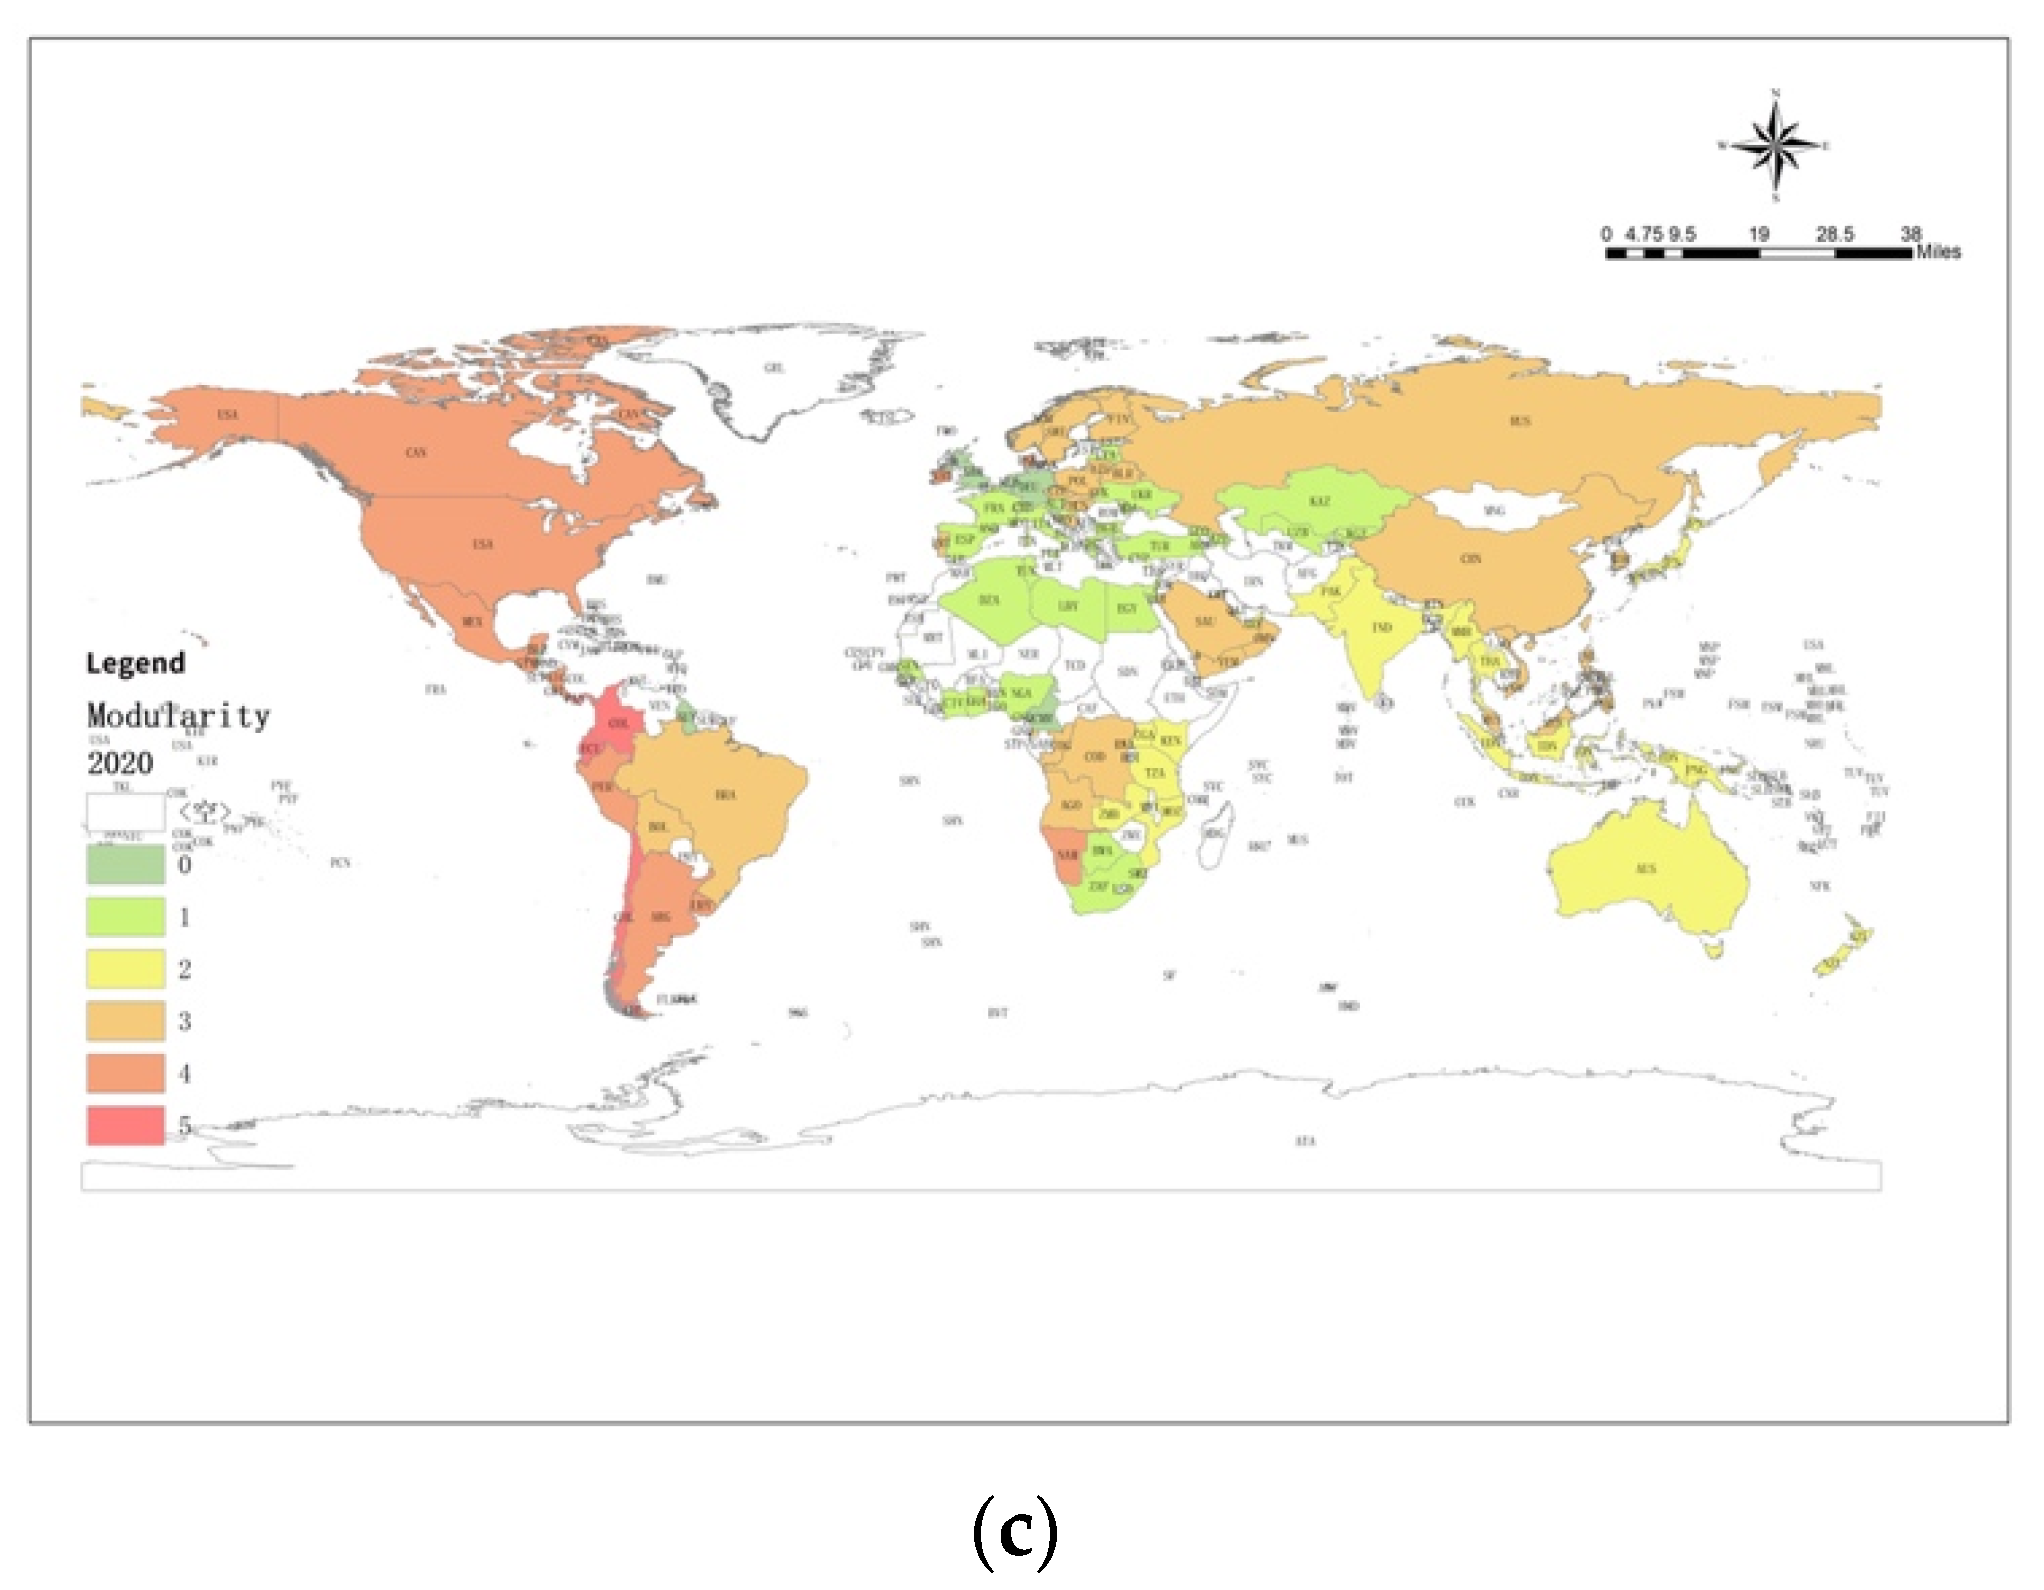
Based on Equation (6), we measure the changes in the associations and the geographical distribution using ArcGIS software in 2007, 2009, and 2020, as presented in
Figure 5. It can be observed that the global crude oil trade network identify four major associations in 2007, which are the Asia–Europe–North Africa associations (30) represented by Russia, Germany, Czech Republic, Poland, Kazakhstan, and Egypt, the North America–Asia–South America associations (41) represented by the United States, China, India, Peru, Brazil, and Algeria, and the North America–West Europe associations (13) represented by Canada, Sweden, Norway, and the United Kingdom. In 2009, the Asia–Europe–North Africa community expanded significantly to include the United Kingdom, France, Poland, Ukraine, Libya, Namibia, Syria, and other countries. The North American–Asian–South American society evolved into the North American–South American–South African society, while the West Asian–East Asian–Oceania society split into two--- South American society represented by Chile and Ecuador and the Asia–Oceania society with China, Saudi Arabia, Australia, Asian, and other countries as the core. In 2020, the membership structure of the previous societies has undergone magnificent changes, and the four major communities have evolved into five, represented by the United States, Canada, and Argentina. They are the Asia–West Africa Association, represented by Russia, China, Poland, the Czech Republic, Saudi Arabia, Yemen, Oman, ASEAN countries, and the Congo; the Asia–East Africa–Oceania Association, represented by India, Australia, Indonesia, Kenya, Tanzania, and Zambia; the Asia–Oceania Association, represented by France, Britain, Bulgaria, Turkey, Spain, Tunisia, Egypt, and Libya; the Asia–East Africa–Oceania community, represented by India, Australia, Indonesia, Kenya, Tanzania, and Zambia; the Europe-North Africa community, represented by France, Britain, Bulgaria, Turkey, Spain, Tunisia, Egypt, and Libya; and the South America community, represented by Colombia, Ecuador, and Chile. Compared with the previous period, the number of associations increased, and the membership within each association changed considerably. More members showed clustering patterns characterized by geographical distance and national borders, reflecting their vital role in shaping the supply and demand relationship of global crude oil trading associations.
3.3. Changes in the Trade Status of Countries
The level of crude oil trade status has become a key element in the distribution of international power. Whoever has more crude oil resources in control will exert more influence in the global energy trade system and have a tougher international voice. To this end, this paper uses Equation (7) to measure the changes in degree centrality(measuring trade status), out-degree centrality (measuring export status), and in-degree centrality(measuring import status), and for each country from 2007 to 2020, and
Table 1,
Table 2 and
Table 3 demonstrate the distribution of the top 10 countries in the corresponding centrality ranking, respectively. From
Table 1, it can be observed that the United States, Saudi Arabia, Russia, Japan, China, and India are ranked high and experience changes in different years. Among them, the U.S. and Saudi Arabia dropped from first and second in 2007 to one position down in 2020, while China climbed rapidly from fifth to the first position. Russia’s ranking is relatively stable, but Japan dropped noticeably, from fourth at the beginning of the period to tenth at the end. The above changes shifted the dominant countries to China, the United States, Saudi Arabia, and Russia. The rapid rise in China’s position and the significant decline of Japan are important sources of the changes in the global crude oil trade network pattern. Before the 2008 financial crisis, the United States, Saudi Arabia, Russia, and Japan had more muscular control over global crude oil resources and therefore had more substantial pricing power and voice in the international market. With the increase in China’s trade position, its control over crude oil resources has improved rapidly. At the same time, countries such as the United States, Saudi Arabia, and Russia still control over crude oil markets and resources.
Secondly, other countries such as Saudi Arabia, the Netherlands, South Korea, and Japan have a more decisive, albeit less powerful, impact in the market than other countries that rank lower. Comparing
Table 2 with
Table 3 (for example, in 2020), we can notice that the higher trade status of China, the United States, Saudi Arabia, Russia, and India can largely be attributed to the shift in the trade pattern from a “resource-led” to “consumption-led” pattern. While China, the United States, and India are not the world’s largest crude oil producers, their prestigious positions are mainly due to the huge demand for foreign markets, as shown by their high import status in
Table 3. The higher ranks of Saudi Arabia and Russia, since they are the world’s most important producers, and their status are reinforced by the enormous export abroad, as evidenced by their top export status in
Table 2. Other countries such as South Korea and Japan rank ninth and tenth in import degree, while outside the top 10 in export degree, indicating that their high trade positions are also mainly due to imports. In summary, the countries with high centrality in the global crude oil trade network are mainly producing countries and transportation corridors. There are still only a few major countries that control global trade flows. The overall competition is still a seller’s market dominated by major exporting regions. The rapid economic growth, the rising per capita income of developing countries coupled with their strong oil demand, are the main force behind the incremental expansion of global oil demand. Additionally, emerging Asia–Pacific countries and Middle East oil-producing countries are the primary sources of growth.
4. Global Crude Oil Trade Network Resilience Simulation Analysis
Crude oil is a strategic resource, as its trade activities and network structure are highly sensitive to international relations, geopolitics, and external shocks. The volatile supply decisions from the middle east, the intense competition between the United States and Russia, along with the intricate racial and religious conflicts, geopolitical relations, and the threat of terrorism, have interfered and threatened the global crude oil trade network to varying degrees. The outbreak of the Russia–Ukraine conflict in February 2022, followed by rounds of economic sanctions against Russia by the western countries, has amplified the tension and contributed to a spike in crude oil prices. Since then, western countries have continued to announce sanctions in the fields of energy and finance, including forbidding transferring investments and energy technologies into Russia. Some radical EU countries have even stopped importing from Russia. In addition to these EU countries, some countries such as the United States, Australia, the Unite Kingdom, and Canada have also banned the import of crude oil and natural gas from Russia. With the reality taken into consideration, this section creates the trade network resilience index, and then uses MATLAB software to simulate the gradual decrease of the number of nodes (i.e., the number of countries that trade with other countries gradually declines), so that it can compare the difference between the observed network and the simulated network in terms of the resilience.
4.1. Indicators for Measuring the Resilience of Trade Networks
Resilience was first proposed by Canadian ecologist Holling (1973) [
33] and represented the ability of ecosystems to absorb, change, and return to a steady state after being exposed to turbulence. Similarly, network resilience refers to the ability of the network structure to maintain or return to normal function when the network is subjected to external shocks. As for the measures of it, scholars studied the impact of external shocks, such as financial crises, on the rate of change in node trade size or network structure as a reflection of the robustness of network resilience [
34]. Some scholars used the SEIR or SIS model to study risk contagion, drawing on viral contagion. However, crude oil trade network resilience differs from the studies mentioned above. The trade among different countries in the network is correlated. It is difficult to fully reflect the overall network resilience strength by considering only the rate change in country trade size. Crude oil network shocks may be human and natural factors, such as natural conditions, while financial crises usually occur in specific countries due to human factors. The viral contagion model assumes that viruses are contagious only when they contact each other. However, the premise of the crude oil network is fundamentally different in that trade can be generated between network countries with long geographical distances.
We refer to Han and Shin (2015), Dixit et al. (2020) [
35], and Mou et al. (2020) and use a measure of resilience in complex networks. The advantage is that it can examine how the disruption of global crude oil supply or demand due to natural or artificial factors affects network resilience from the perspective of the internal structure of the whole network (e.g., network density, average path length), and it can also overcome the strict assumption of direct contact for transmission in the virus transmission model, and thus has a broader scope of application. Moreover, this method can also conduct random simulations of crude oil trade disruptions in all countries separately. The patterns can be obtained by comparing the differences in the changes in network resilience between this paper and the random network.
Regarding the resilience metrics, the following formula is used:
where
is the resilience of the trade network,
is the connectivity,
is the number of nodes, and
is the weighted-average center respectively. Among them, connectivity is the main factor in affecting the resilience, especially during the recovery periods [
36]: when the network is disturbed, a well-connected one can provide alternative connections, thus assisting it to recover from the shock. Thus, network connectivity is positively related to network resilience. To measure connectivity, this paper focuses on the perspective of network transmission [
37,
38]. The equation is expressed as:
where
ranges from 0 to 1, and
is the shortest path between any different nodes in the network. The shorter the path length is, and the more connection can be achieved through other nodes, which means a better transmission of the network. On the other hand, larger
denotes more redundant nodes in the network. So, when the local nodes of the network are impacted, more nodes will spread the influence, thus compromising the effectiveness of network.
In the meantime, greater Density denotes more connections between nodes and a denser network. If the local nodes are impacted, more nodes are affected, leading to a worse network in terms of resilience. Finally, represents the central position of all nodes on average. The wider range of communication between the network nodes and other nodes, the stronger the degree of connection. If the local nodes of the network are affected, the greater directs to a worse resilience of the network.
4.2. Toughness Simulation Analysis of Crude Oil Trade Network Node Disruptions
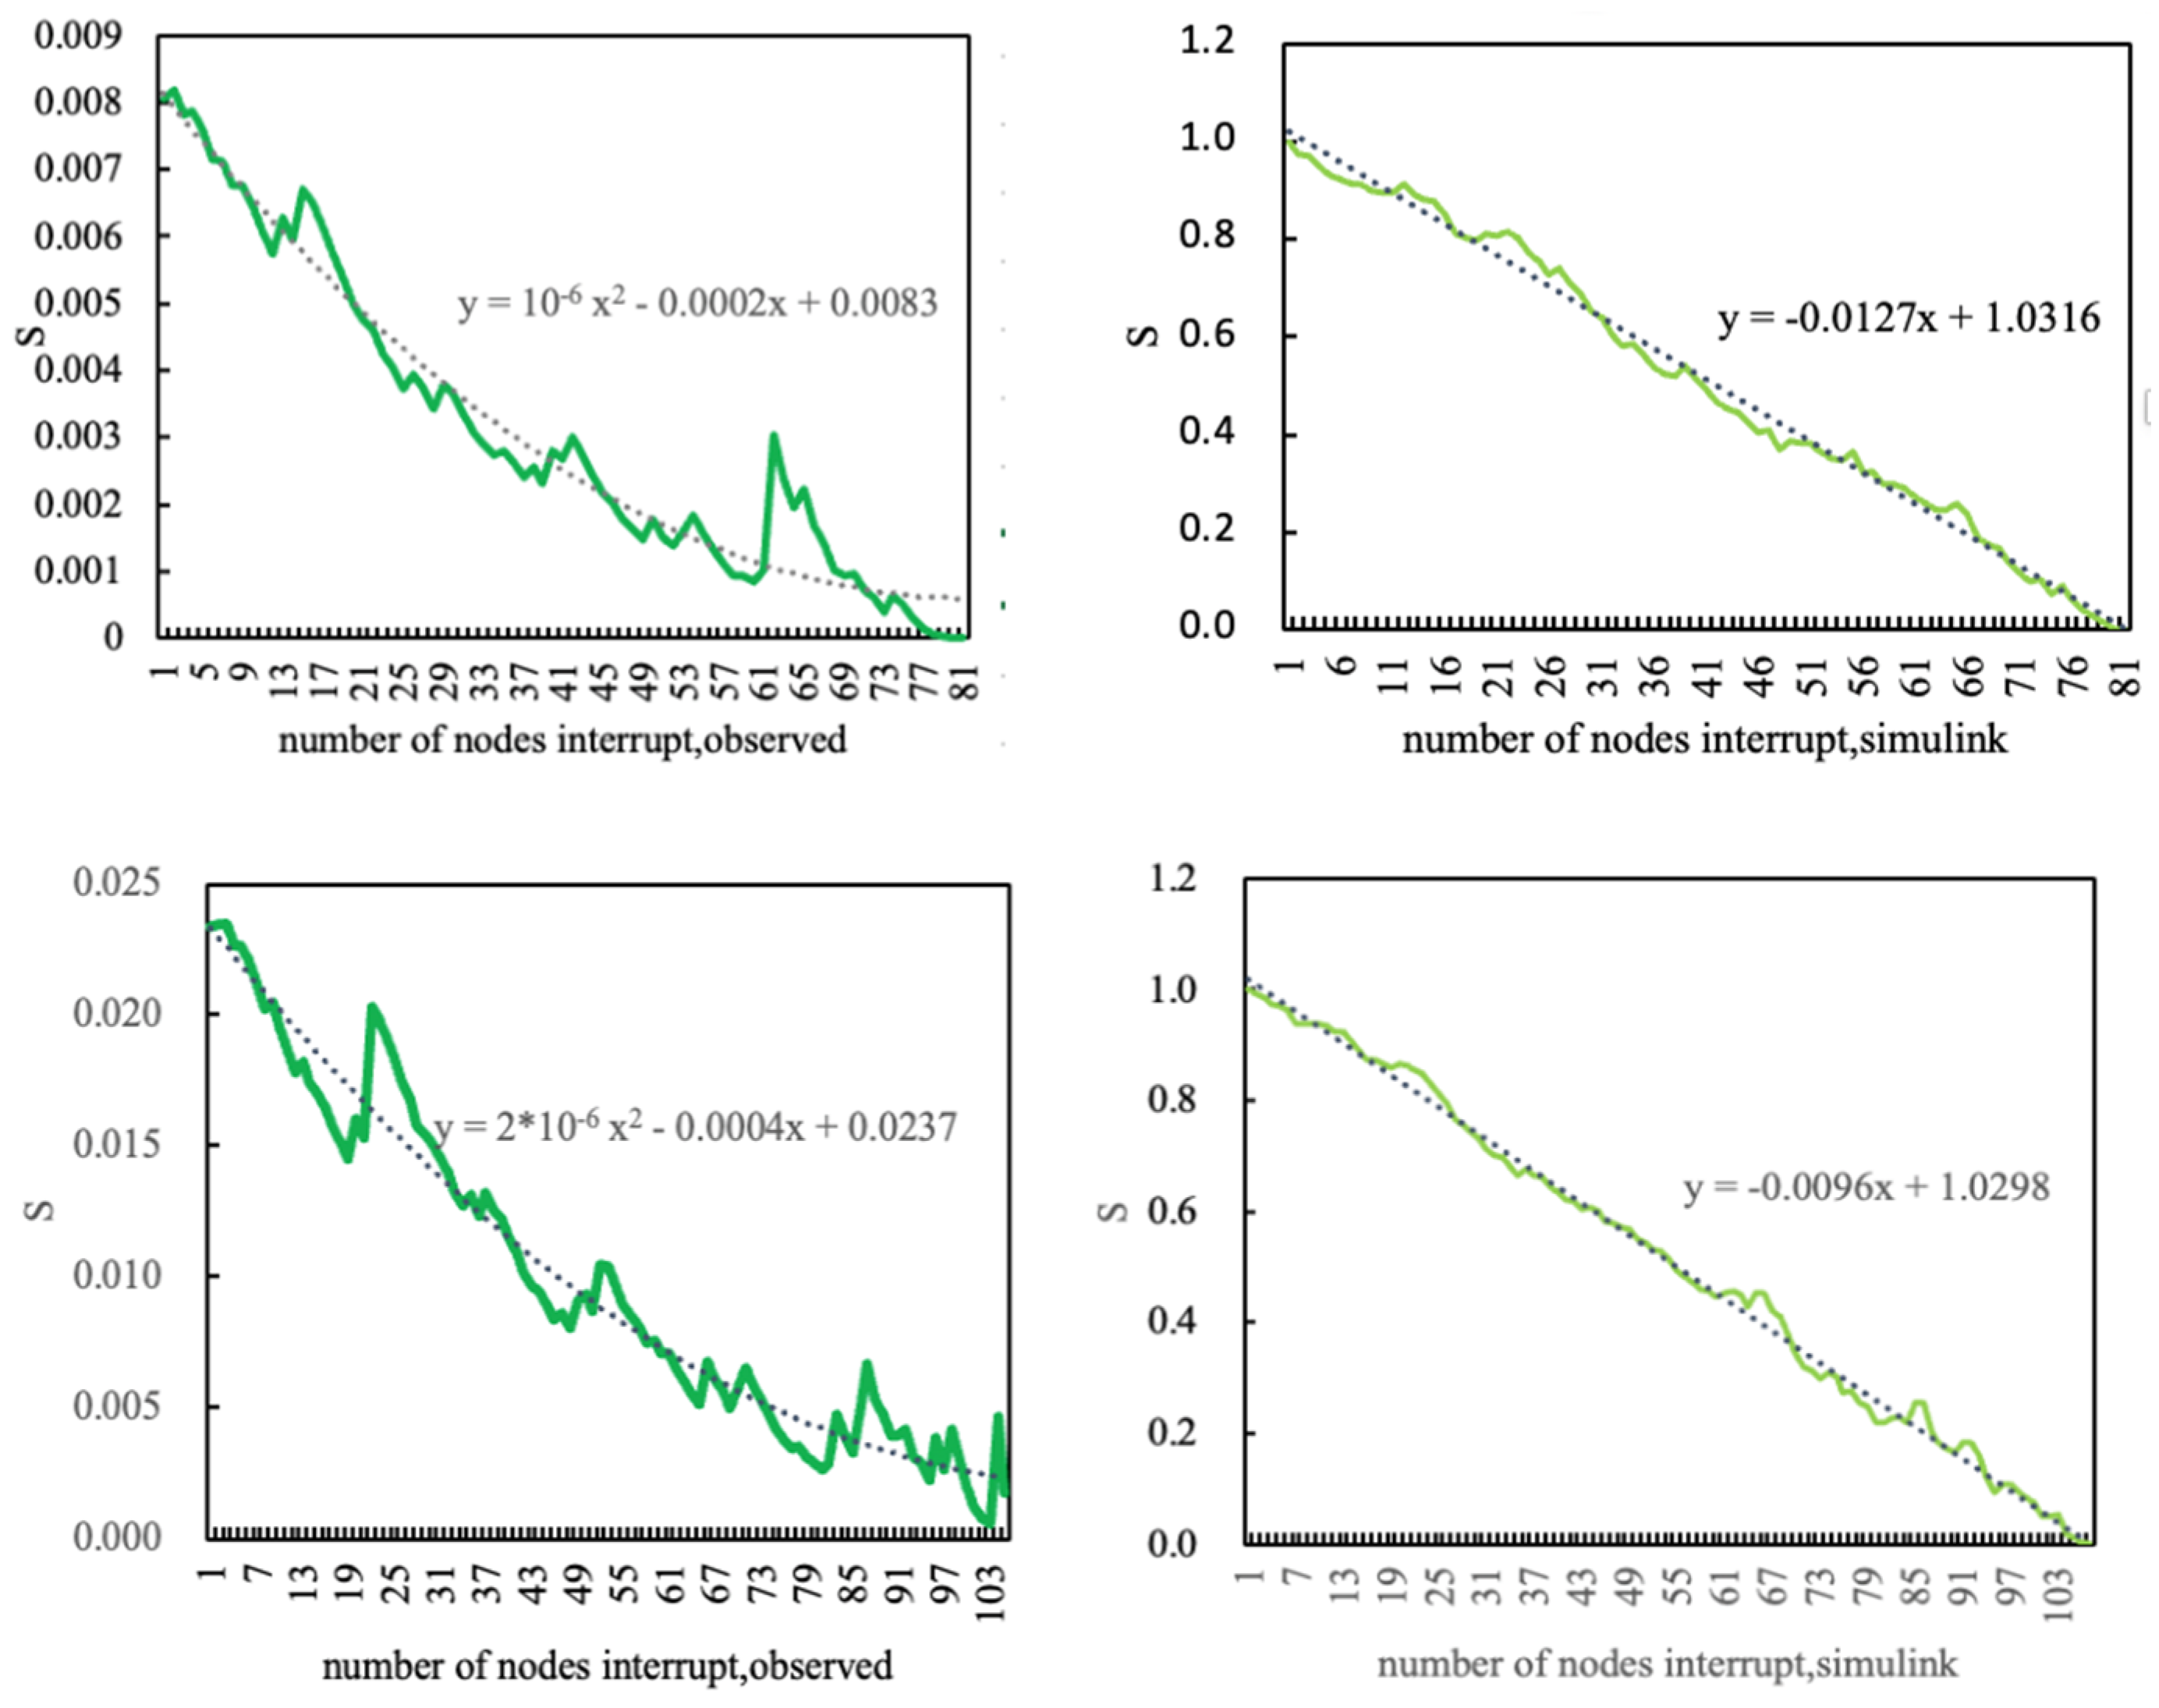
In this paper, MATLAB software is used to set up the gradual increase or decline in the number of countries in the global crude oil trade network from 2007 to 2020. Then the toughness of the remaining trade network is obtained according to Equations (8) and (9). At the same time, the use of R studio generates the simulation matrix with the same number of nodes and connected edges as the network matrix in 2007 and 2020, respectively (the nodes of this matrix are connected with 50% probability).
First,
Table 4 reports the statistical results of the basic parameters of the toughness index. From this, it can be seen that the global crude oil trade network resilience tends to fluctuate upward in general from 2007 to 2020. Secondly, the above operation is repeated to obtain the simulation network toughness measurements, as shown in
Figure 6. The specific simulation process is as follows.
- (1)
First, choose the crude oil trade network for a specific year,
- (2)
Remove one of the nodes and its edges,
- (3)
Calculate the toughness of the remaining network using Equations (8) and (9) while constructing a random network with the same number of nodes and edges as the specific crude oil trade network, and
- (4)
follow the above practice to calculate the toughness of the remaining network.
Subsequently, the number of removed nodes gradually increases, and finally, the toughness of both networks is calculated. Using 2007 as an example, compared with the smooth change in the number of disrupted countries, the network resilience does not change uniformly but shows a non-linear decreasing trend. When the number of affected countries increases from 13 to 22, the decreases nearly linearly. It indicates that network resilience is related to the relationship structure. When the number of disrupted countries increases from 61 to 63, the instead shows signs of a local rise, implying that the structure is also related to the number of redundant countries in the network because those countries can mitigate the negative impact of the shocks. They play a supportive role in the decline of network resilience. On the contrary, the simulated -value shows a linear decrease, with the number of disrupted countries increasing from 22 to 61. Under this range, the network structure, connectivity, and density changes are relatively stable, so the simulated network resilience shows a linear decline. The above results suggest that trade resilience is correlated with trade relationships and patterns among countries.
The resilience of the global crude oil trade network reflects the impact of external shocks on the restructuring of crude oil resources on a global scale, manifesting the political games and competing interests between core and non-core countries, crude producing and consuming countries. Its changing trend is related to countries’ energy strategies and security. Under the context of globalization, some trade relations significantly impact the stability of global trade, and other parts of trade relations might inhibit the decline of resilience [
39]. Therefore, cooperation and dialogue have become a meaningful way to maintain global crude oil trade and energy security. Additionally, an international system that includes suppliers, consumers, and transit countries should be established to balance the interests of different groups and ensure the security of the trade chain, so that the energy market can be more secure, stable, and sustainable.
4.3. Comparison of the Change in Resilience of “Core-Marginal” Countries’ Disruptions
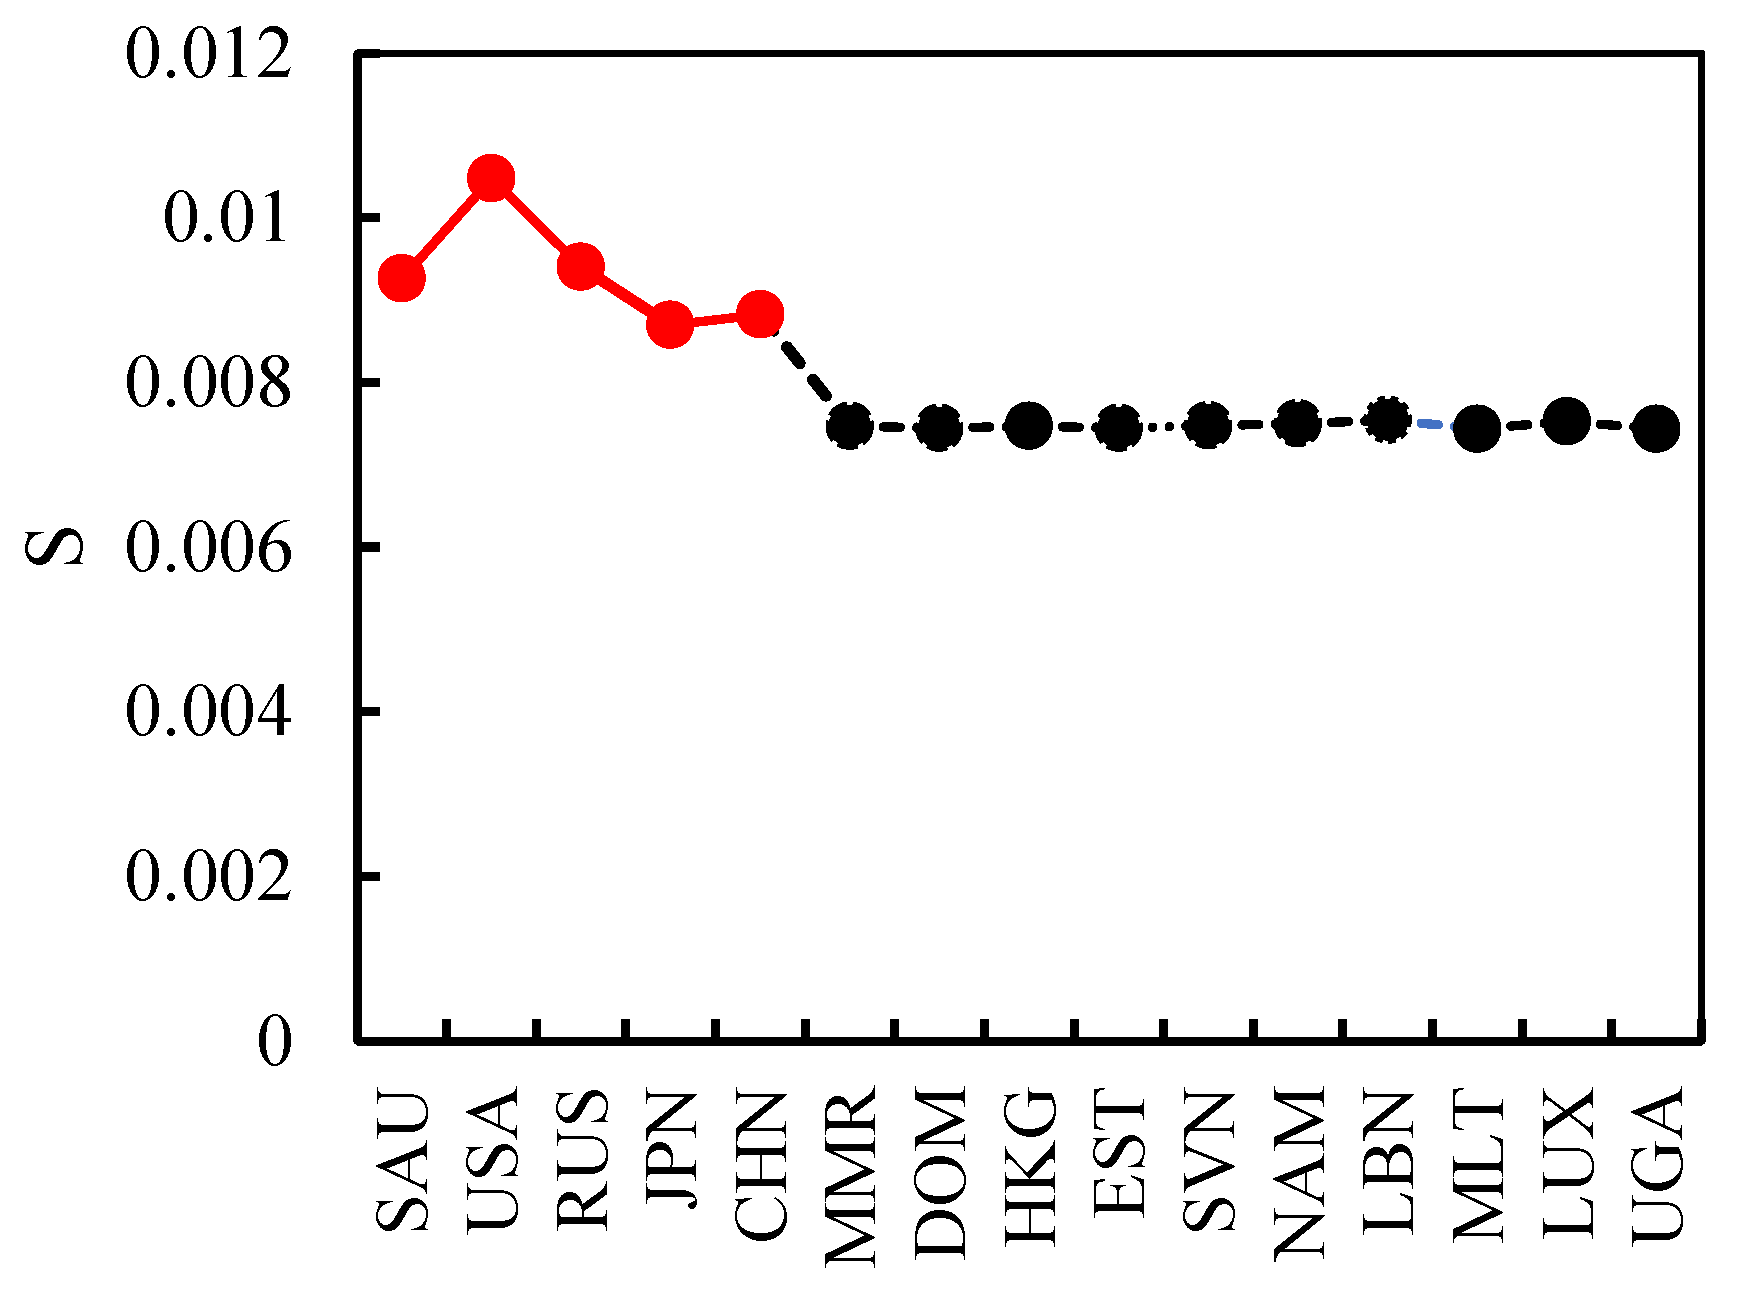
Major crude oil producers (e.g., Saudi Arabia and Russia) and demanders (e.g., the United States, China, and Japan) jointly dominate the global energy trading system. Other marginal countries such as Myanmar, Lebanon, and Uganda have relatively weaker influence. Therefore, comparing trade disruptions in core and marginal countries, and testing the network’s resilience under the two scenarios, is essential. To this end, this paper calculates the changes in network resilience based on (8)–(9) using the data in 2020, by excluding the above countries from the network separately, and the results are shown in
Figure 7. The main conclusion which can be drawn is that the core countries have a higher impact on resilience than the peripheral countries. The impact of disruptions from Saudi Arabia, the United States, Russia, Japan, and China on resilience is roughly between 0.008 and 0.011, while marginal countries such as Myanmar, Estonia, Namibia, and Uganda are at 0.007. Of these, the United States has the greatest impact on the resilience of the global crude oil trade network, followed by Saudi Arabia and Russia. When the core countries are disrupted, the network density and the weighted-average trade among countries decrease together. The network shock can be transmitted to the whole network through sparser trade relations, and it is less likely to return to the previous average level. On the other hand, when the marginal countries are disrupted, the network density does not drop much, the weighted-average trade among countries is relatively stable, and the network shock can be transmitted to the whole network through denser trade relations. Then it is easier for the trade network to recover back. The difference in the impact of disruptions in core and peripheral countries on resilience suggests that the impact is relatively more substantial from countries with high trade status.
From the perspective of sustainable development, the resilience of the crude oil trade network relates to the role played by each country and the network topology, both of which impact the sustainable development of the global economy. The uneven geographical distribution of crude oil resources gives crude oil resource countries an advantage and their role as core countries in the global energy network. Once these countries form a resource pull path dependency, shifting from the old trade model to a green and sustainable development model is not easy. It is because these countries can only rely on human capital accumulation and technological innovation to improve energy efficiency and import green energy through international trade, thus achieving sustainable development. The impact of these countries on network resilience is undoubtedly immense, but they also face difficulties and challenges in the transition to green economic development. Non-core countries do not have the advantage of crude oil resources. They can only import crude oil from partner countries through international trade to promote economic development, forming import dependence. Once partner countries stop exporting, the country will face a tremendous national energy security problem. Therefore, non-core countries should reduce their crude oil import dependence through diversified import channels and promote green energy economies to eliminate excessive dependence on core countries and ensure their energy security through energy transformation and upgrading.
4.4. Discussion of Economic Implications
First, the dynamic evolution of the global crude oil trade network highlights the change from a “resource-based” to a “demand-led” model. Oil-producing countries used to have control over the scope and magnitude of oil resource flows. In other words, they largely dominated the evolution direction of the network, and their rule-making power was high. With the acceleration of globalization and industrialization of many developing countries, their demand for crude oil has increased significantly. These countries do not have abundant oil reserves so the huge demand has prompted them to increase imports through the trade network, further strengthening the oil-producing countries’ trade position. On the other hand, the trade positions of major demand countries such as the United States, China, and India have climbed faster due to high imports and path dependence. In this process, the resource advantage of the major oil-producing countries may become a “resource curse.” While the economic growth of the major demand countries is faster, they still are over-dependent on imports.
Second, the “core-edge” hierarchy of the global crude oil trade network is non-congruent, reflecting the international competition for crude oil resources among countries. From the hierarchy, it can be seen that the connected edges among countries with high trade status, such as Saudi Arabia, the United States, China, and Russia, are higher than those of others, so it is easier for them to form close trade relations, thus occupying the “core” of the network. The global crude oil trade network has a “nucleus,” implying a “similar status” matching relationship, part of which lies in the fact that major resource countries have a dominant voice in the supply chain. The natural differences in oil resources between supplying and consuming countries make it difficult for countries to achieve “opposites attract” and equal bilateral relationships. Since crude oil is a non-renewable resource with strategic importance, major resource countries are bound to face the “path dependence” of energy exports and the “resource curse” that inhibits economic growth. Therefore, they need a stable and durable crude oil market. Demand countries rely on resource countries to promote economic and social development. Both sides of countries compete and cooperate in terms of imports or exports within their groups. For example, the United States and China both import crude oil from Russia, so they compete for imports; the United Kingdom. imports crude oil from Russia, and Russia exports to China, so the United Kingdom and China are in import complementarity for Russia. From a resource perspective, the overlapping of competition and cooperation is an important reason for the “core-fringe” hierarchy of the network to remain relatively stable until a new alternative economic energy source is found.
Third, the financial crisis and OPEC decisions severely impacted the network’s structure, prompting countries to pursue trading partner diversification for energy security. The decline in oil consumption and production because of the two events increased the volatility of oil prices, which obviously impacted both demanding and producing countries. With the increasing demand for crude oil resources, all oil-producing regions, including the Middle East, Africa, Russia, and Latin America, are considering export diversification strategies to ensure national security and the sustainability of energy trade. Moreover, countries such as the United States, China, India, and Canada are also aware of the energy security problems resulting from over-dependence on crude oil. They are gradually considering the need for import diversification, increasing crude oil reserves, and developing new energy sources. Taking import diversification as an example, it can be achieved through various ways, such as diversification of import sources, channels, varieties, operators, means, and access methods.
Fourth, the interdependence of crude oil trade relations among countries highlights the urgency of global joint governance to avoid complete disruption of the supply, industrial, and value chains. The global crude oil trade network dominated by traditional powers and resource-based countries such as the United States, Saudi Arabia, and Russia has not undergone fundamental changes, and they still have a strong influence and voice in the market. The trend of relying on imports is irreversible. This requires considering oil security issues from the perspective of both oil-consuming and importing countries, and using international trade as the primary means of response has become an inevitable choice. The development of exploration and mining technologies has led to a trend of “multiple growths” in the local centers of global crude oil reserves. Therefore, only extensive cooperation can effectively cope with various shocks and risks. Under the new situation, the possibility of oil-producing countries arbitrarily interrupting oil supply is reduced, but supply interruptions caused by wars, terrorists, or natural disasters cannot be eliminated. Countries should strengthen energy diplomacy and joint governance cooperation in the interdependent crude oil trading system and enhance the resilience of the industrial, supply, and value chain to external shocks.
Finally, the central crude oil supply and demand countries significantly impact network resilience more than other countries. It precisely means that it faces excellent development potential and space in the renewable energy involved in green and sustainable development. In fact, with rapid technological advances, global energy consumption is transforming towards renewable and green energy sources, and the strength of crude oil trade network resilience does not necessarily mean that countries are high or low in terms of green and sustainable energy sources. Crude oil trade inevitably has damaging effects on the global environment, even directly threatening the survival of marine and atmospheric species, as exemplified by the accelerated global industrialization process that is accelerating global warming. In the future, crude oil supply and demand countries need to develop more green energy sources, better reduce their dependence on global non-renewable resources and reduce pollution to the environment, to form a green energy trade system with sustainable development as the core. Only in this way can the world achieve sustainable and inclusive green development in the new energy governance system.
5. Conclusions
Based on the HS2007 four-digit global crude oil trade data from 2007 to 2020, this paper adopts a complex network methodology to examine the structural evolution characteristics of the global crude oil trade network. It simulates the impact of disruptions in national trade relations on the network’s resilience. As the degree of integration and regionalization gradually increases, and the trade distance between countries tends to shorten, the global crude oil trade network continues to expand and becomes more closely connected. Five major trade groups have been formed, namely North America–South America, Asia–West Africa, Asia–East Africa–Oceania, Europe–North Africa, and South America, among which the influence of Saudi Arabia, Russia, the United States, China, and Japan is significantly higher than other countries. Further network simulations reveal that the impact of national trade disruptions on global trade resilience is not linear, such that it shows a sudden drop but then a temporary increase as the number of disrupted countries increases. Finally, the impact of disruptions in core countries is significantly higher than in peripheral countries.
The findings provide policy implications for advancing global energy supply and demand structural security, green energy transformation, and sustainable development. With rapid technological advances, global energy consumption is transforming towards renewable and green energy sources. Crude oil trade inevitably has damaging effects on the global environment, even directly threatening the survival of marine and atmospheric species and global warming. In the future, crude oil supply and demand countries must develop new green energy sources, focus better on partner countries’ diversified development strategies, and reduce environmental pollution. Only in this way can the world achieve sustainable and inclusive green development in the new energy governance system. In addition, both core and non-core countries face double national energy security and sustainable development constraints. However, in the long run, the global economy will stay the same in the direction of green and sustainable development.


