Abstract
LCC and EL models have been widely used in recent years to determine the decommissioning life of equipment in energy companies, with LCC (life-cycle cost) being the total “lifetime” cost of the equipment from the time it is put into operation until the end of its decommissioning and disposal; the average annual cost of the equipment can be calculated based on the LCC. The overall LCC can be calculated as the average annual LCC, while the EL is the age of the equipment at which its average annual LCC is the lowest. It is believed that the decommissioning of the equipment in the EL year will result in the lowest annual average equipment turnover, thus maximizing the economic benefits of the equipment. Recently, LCC and EL research has been gradually introduced to the energy field, but there remains a lack of research depth. In current practice, energy equipment LCCs are mainly determined by selecting a portion of inventoried equipment to serve as a sample record for all costs incurred. The intent is to derive the economic life of the equipment-year by directly seeking its average annual cost, but this method tends to downplay maintenance, overhaul, and other cost events as “random small probability events”. This method is also incomplete for evaluating the decommissioning life of equipment whose average annual cost strictly decreases year-by-year. In this study, we analyzed the use of 75,220 KV transformers that were put into service by an energy company in 1986 as a case study (costs for this type of equipment were first recorded strictly in terms of LCC in 1986), used Isolated Forest (IF) to screen the outliers of various types of data costs, and then probability-corrected the corrected dataset with a Welbull distribution (Welbull). Then, we employed a stochastic simulation (MC) to calculate the LCC of the equipment and determined its economic lifetime (EL) and compared the results of the stochastic simulation method with those of the traditional method to provide a more reasonable explanation for the “small probability” of cost occurrences. Next, we predicted the average cost of the equipment given a use-period of 38-41-years using AHA, Bi-LSTM, and other comparative algorithms, compared the MAE, MAPE, and RMES indexes, selected the most suitable prediction model, and produced a predicted cost under the chosen method to obtain the economic life of the equipment. Finally, we compared our results with the design life of the equipment (design life being the technical life expectancy of a product based on the expectations of the manufacturer), and determined its best retirement age by comprehensively studying and judging the economic and technical benefits. The retirement age analysis was guided by by a comprehensive study of economic and technical benefits. We refer to our decommissioning life determination model as Monte Carlo -artificial hummingbird algorithm–BiLSTM–lifecycle cost model (MC-AHABi-LCC). We found that the decommissioning life obtained by MC-AHABi-LCC is closer to the actual equipment decommissioning life than that given by standard LCC and EL analysis and that our model is more accurate and scientific.
1. Introduction
In energy enterprises, the safe and stable operation of equipment is of great significance for the life security of residents. In the past, more attention was paid to the use of equipment for solving operational problems over time than to the economic costs incurred when the equipment fails. In recent years, with the gradual increase in the scale of equipment in energy enterprises, researchers have begun to move away from the single-target system approach to operation management in favor of a consideration of the technical and economic realities of equipment operation to better judge equipment retirement age. In this paper, we focus our discussion on the optimal retirement age of equipment from an economic point of view with consideration for the equipment’s technical lifespan.
The concept of LCC was first formally introduced by the US General Accounting Office in 1933 and then quickly spread through government departments and civilian companies. Yash P. Gupta (1983) [1] proposed a specific LCC architecture in the context of defense equipment that cast LCC in terms of a total cost model that could encompass the full lifetime of equipment. The approach sought to influence the LCC with different system parameters to minimize the total lifetime average cost of the system, while optimizing performance and efficiency. Na Li et al., (2020) [2] proposed a link between LCC and EL that described EL as the age at which equipment reached its lowest LCC cost; upon calculating the average annual cost spent in terms of the LCC, the difference in cost by year could be represented by a line graph in which the lowest average annual cost point is the EL point of the equipment. Antonio Dominguez-Delgado et al., (2020) [3] proposed the application of the LCC model to residential housing to evaluate the feasibility of converting the roofs of social housing buildings into cool roofs from energy and economic perspectives. Yinga Wu (2020) [4] proposed a high-precision computer analysis method to assess the economic life of oil-well development. The study focused on oil well data for data preprocessing and data cleaning, and appropriate economic lifetimes for oil-well development were obtained according to LCC calculation rules. The applied method was, in essence, the minimum annual average cost method.
Several studies [1,2,3,4] describe the application of LCC in various fields. While LCC has been proposed in the past for electric power equipment, it has only recently begun to be so applied. Zhuyi Cai et al., (2011) [5] suggested that the LCC model could be applied in the field of electric power energy with the description of a reasonable allocation of the cost breakdown of electric power equipment in an LCC context, highlighting the need for uncertainty factors (such as equipment repair costs) for modeling and analysis. Yinkai Bai et al., (2014) [6] evaluated transformer life by using the whole life-cycle theory, using the interval linkage theory to establish the interval models of initial investment cost, operation cost, repair cost, maintenance cost, failure cost, and end-of-life cost for the selected transformer samples while also considering social and environmental costs; the results were determined by the selected sample states. Xiang Chen (2022) [7], using the traditional LCC–EL model, introduced the factor of equipment operation reliability and found a reasonable selection scheme for main transformers. Yongli Wang et al., (2020) [8] used sensitivity analysis to explore important factors identified by power policy reforms for the whole life cycle of equipment, redetermined the impact of equipment breakdown on LCC cost analysis, and suggested rules for managing the apportionment of costs incurred by equipment.
While there are some studies [4,5,6,7,8] that have investigated the application of LCC and EL in the energy sector, the depth of the research is still insufficient in the dimensions of data processing, LCC breakdown determination, calculation of LCC, and determination of economic life, as the analytical methods remain imprecise and unscientific. Due to the severe uncertainty of decision environments, decision-makers can benefit from models that incorporate fuzzy analysis. To solve this problem, Narges Hemmati (2019) [9] combined the fuzzy analytic hierarchy process (FAHP) and the propensity technique (TOPSIS) model. In this new model, the three-level (objective, criterion, solution) decision hierarchy of FAHP arrives at a set of decision options, which is analyzed with the TOPSIS model to evaluate decision effectiveness and select the most suitable maintenance policy for the equipment in question. Similarly, Galankashi M R (2020) [10] created the AHP–FAHP approach to analyze and select the best maintenance policies for the different equipment of a cement manufacturer. Due to the absence of scenarios, a scenario layer first needed to be constructed. In the case study, the second factor layer and third scenario layer were constructed based on a study of the literature and expert advice, after which AHP was used to select the best equipment maintenance policies. As AHP and FAHP operate on deterministic and fuzzy data, respectively, in this model, FAHP operates on the fuzzy data to choose the maintenance strategy. This method allows for decision-making not only in exact environments but also in uncertain environments, enabling the optimal decision to be selected by comparison. Compared with the traditional multiple-criteria decision-making method (MCDM), this model takes into account both deterministic and probabilistic factors, making it more scientific and rational.
In our study, we used all incurred costs for seventy-five 220 KV transformers from the case study as sample data. First, the outliers of the dataset were screened using an Isolated Forest approach, and the probability of failure occurrence of the corrected dataset was corrected via Weibull distribution. Then, the universal LCC of the equipment was obtained using a stochastic simulation, which was followed with an artificial hummingbird optimization algorithm to combine the two-way long- and short-term memory models. Next, other machine-learning algorithms were used to predict and compare the future average annual LCC, and MAE, MAPE, and RMES indexes were selected as indicators to test the accuracy of the cost prediction. This enabled the selection of the most appropriate model prediction to serve as the LCC annual average cost chain. Finally, the economic life of the equipment was obtained based on the average annual LCC, and the result was compared with the design life to determine the final optimal decommissioning life of the equipment.
In our method, the probability of equipment breakdown was modified via the Weibull model to correct the O&M repair cost and make results more consistent with the theory of failure occurrence. Stochastic simulation was used to fully address the randomness and “small probability” of energy equipment costs, which improved the issues that were caused by direct averaging in previous studies. Finally, machine-learning algorithms were used to effectively predict the future average annual LCC by considering both the economic life and technical life of the equipment, resulting in a proposed retirement age that is appropriate from those perspectives as well.
2. Methods and Research
2.1. Whole Life-Cycle Cost (LCC) and Economic Life (EL) Models for Assets
The LCC model, also known as whole life-cycle cost management, focuses on the entire life cycle, i.e., the “lifetime” of equipment. LCC analysis encompasses feasibility study, construction and implementation, commissioning, decommissioning, etc. for the overall planning of all costs likely to be incurred in connection with some object in question, ultimately establishing its whole life-cycle cost. A recent example of this method in the research context can be found in Zhisheng Lv (2022) [11], which considered the overall factors of study materials and methods in the context of an analysis of flexible electrodes produced via the masked-membrane vacuum-filtration of polyaniline/bacterial cellulose (BC) ink, reflecting a systematic and comprehensive analysis of characteristics in line with the LCC model.
The calculation rules of LCC often vary greatly with the data and management record system of energy enterprises, and even in the same energy enterprise, the LCC measurement approach of physical assets between different departments can show great variation. Jing Hu (2012) [12] proposed a whole life-cycle cost model for transformers that they adapted to the new characteristics of the “Big Five” system and provided a detailed analysis of the components of the life-cycle cost. Zerong Lai (2017) [13] conducted a statistical analysis on data taken from high-voltage circulators and calculated their unit LCC by taking into account their time value and discounting their input cost at different times relative to a uniform point in time, so as to solve the LCC problem more comprehensively.
To address the low number of input cycles in much equipment (i.e., small n value for the cycle parameter), Zhao Yang et al., (2021) [14] used quadratic curve fitting to obtain predictive LCC values based on 20 years of LCC data taken from actual equipment. This predictive extension produced a forecast of year-by-year LCC, facilitating a further calculation of economic life years. Meng Sheng et al., (2018) [15] used a grey forecasting method that tolerated the use of low-quality data, by which the LCC of equipment could be predicted and the economic life derived with consideration for said equipment’s time value.
Studies such as these reveal the essence of whole life-cycle cost management: it is a cost-analysis methodology that aims to maximize economic efficiency and minimize costs while maintaining safety and reliability. In our own research, we predicted the LCC of our case-study equipment using the improved Bi-lstm of the hummingbird optimization algorithm, which is discussed in Section 2.5 and Section 2.6.
The EL (economic life) of energy equipment describes its most reasonable period of use from an economic point of view, i.e., its lowest average annual cost of use over its entire life cycle. Usually, a piece of equipment is put into operation because its acquisition cost remains unchanged; as the years of use increase, the average acquisition cost of the equipment will decrease; i.e., the economic benefits will increase as years of use increase, while as the equipment gets older, the annual operation and maintenance cost of the equipment will increase, such that the economic benefits may decrease as the service life of the equipment increases. This relationship is shown in Figure 1 below.
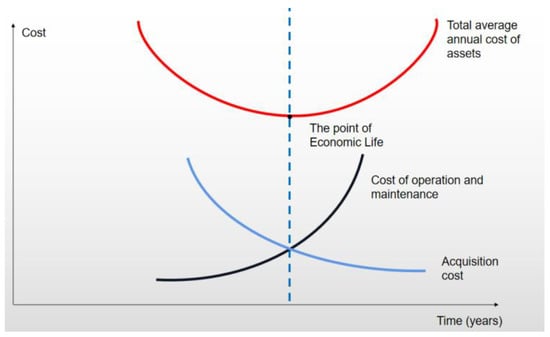
Figure 1.
Economic life effect diagram.
The optimal year point in Figure 1 is the economic life point for this type of equipment. Kexin Zhang et al., (2014) [16] obtained the LCC by studying the reliability EMU model of the equipment and calculated the average annual cost to obtain the economic life. In this paper, by combining an analysis of the LCC model data obtained using stochastic simulation, the overall LCC formula is divided by the number of years in operation to obtain the average annual cost of use value and find the economic life of the target equipment.
2.2. Isolated Forest Model (IF)
The Isolated Forest algorithm provides an important method for data pre-processing by using algorithms to find data that are different from other data patterns. It can perform unsupervised learning outlier detection on large amounts of continuous data, and while it is not applicable for high-dimensional data, it has a wide range of applications. For example, Nair et al., (2022) [17] performed outlier detection on data and assessed the stability of the filling process of human-induced multifunctional stem-cell products, Liu et al., (2022) [18] used Isolated Forest as a method for surface water quality anomaly detection, while Lin et al., (2020) [19] combined Isolated Forest with neural network models for effective wind-power prediction. Similarly, Ahmed et al., (2019) [20] employed the principle of the Isolated Forest algorithm, i.e., constructing the shortest mean path length to identify erroneous data in grid data and reduce system losses. There are also many scholars who have improved the Isolated Forest algorithm: Barbariol et al., (2022) [21] developed the TiWS-iForest model using weak supervision, which reduced the complexity of Isolated Forest improved its detection performance. To solve the problem of finding abnormal data in a device, Jiang et al., (2022) [22] detected abnormal values in lithium battery data based on the Isolated Forest algorithm, which was effectively applied to the fault diagnosis of powered lithium batteries; Wang et al., (2021) [23] used Isolated Forest for monitoring the status of marine diesel engines for fault detection. As the sample points need to be segmented several times, at which point they are relatively clustered, the more isolated points will be segmented out of class after several segmentations. These isolated points are the outliers for which we are looking. A demonstration of the segmentation of data points in a two-dimensional plane is shown in Figure 2.
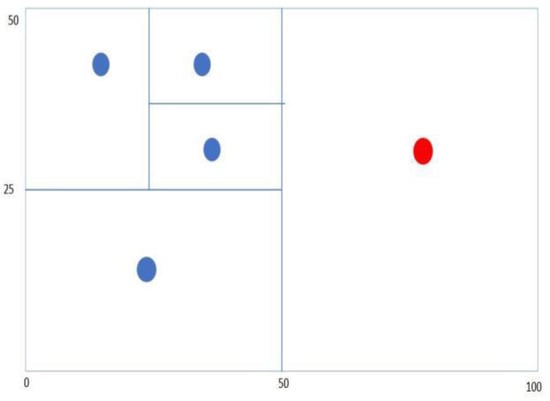
Figure 2.
Demonstration of data segmentation in a two-dimensional plane.
The principle of Isolated Forest is to find outliers by repeatedly splitting the data points at random until all sample points are isolated and then comparing path lengths. Figure 3 below shows a demonstration of data segmentation in the form of a binary tree.
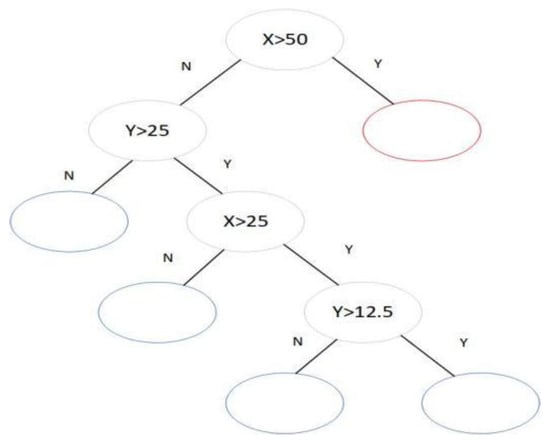
Figure 3.
Demonstration of data-partitioning in the form of a binary tree.
The algorithm steps are shown below:
Step 1: Assume n sample data such that of dimension .
Step 2: Build isolated trees: randomly select feature and segmentation value and segment the dataset .
Step 3: Determine whether the segmented dataset satisfies the following criteria: (1) the height of the constructed tree reaches the limit; (2) there is only one sample point on the leaf nodes; (3) sample points on the nodes have the same eigenvalue. If this is satisfied, the process is finished, if not, step 2 is repeated.
The outlier determination is as follows:
Step 1: Let the length of the path travelled by the leaf node to the root node be .
Step 2: For sample data, the average path length of the tree is decribed by Equation (1):
where is the summation number, the estimated value of , after reviewing the information, is , and is the average path length.
Step 3: Calculate anomaly scores for all data in the sample.
where is the mathematical expectation of the path length of the sample point .
Step 4: Determine abnormal values; when is close to 0.5, the average path length of a sample point is too similar to the average path length of the tree, so the abnormality of the sample point cannot be determined; when is close to 1, the sample point is an abnormal value point; when s is close to 0, the sample point is a normal value point.
2.3. Weibull Distribution and Fitting
Based on extensive experimental evidence, the Weibull distribution is considered suitable for processing data on the failure probabilities of various equipment and is widely used for fitting the distribution of wear-and-tear cumulative failure for electromechanical equipment. For example, Umesh Agarwal et al., (2020) [24] used the Weibull probability density function to predict the failure rate of equipment in a power grid system for the timely maintenance planning and replacement of old equipment. Jomkun Suntaranurak et al., (2020) [25] used the Weibull distribution to calculate the failure rate and service life of each component of power-circuit breakers and disconnect switches.
The Weibull distribution is continuous distribution function with three parameters, (scale parameter), (shape parameter), and (location parameter), where because there exists a probability of failure starting at the moment that the energy equipment is put into service. The Weibull distribution can be simplified to a two-parameter model with the following Equations (2) and (3) for the distribution function and density function (where ):
There are various ways to fit the parameters of the Weibull distribution; the more common methods are least squares (LS), moment estimation (ME), and the maximum likelihood estimate (MLE); for example, Renheng Xu et al., (2017) [26] applied a two-parameter Weibull distribution for a reliability prediction of smart energy-meter failure data and then used least squares to estimate various parameters of smart energy meter life prediction for the Weibull distribution. Rui Wang et al., (2019) [27] proposed a method of smart energy-meter failure rate and life prediction based on the Weibull distribution and solved the shape parameters and scale parameters of the Weibull distribution model using the maximum likelihood method; the results show that their method had better prediction accuracy. Among these different methods, LS is the most widely used. In this study, LS was adopted for fitting the Weibull distribution parameters in the following manner:
Step 1: A shift transformation of for part gives Equation (5).
Step 2: Perform two logarithmic transformations on the result to obtain Equation (6).
Step 3: Let and to obtain . By statistically calculating each set , fitting values can be obtained for the parameter , with for each failure occurring in the sample set.
2.4. Monte Carlo Stochastic Simulation (MC)
Monte Carlo stochastic simulation (MC), also called stochastic testing, is based on a probabilistic model that eliminates the need for complex mathematical derivation processes and is able to describe the characteristics of things well. It has been widely used in various fields of production and life in recent years. Haruna Bege et al., (2020) [28] proposed a Monte Carlo stochastic simulation model for predicting user bandwidth utilization in campus networks that facilitated an upgrade of the campus network design to ensure proper functioning during both higher and normal traffic loads. While cost estimates are essential in the early stages of architecture design, they can be inaccurate; to address this issue, Wang J et al., (2021) [29] used Monte Carlo stochastic simulation instead of the volumetric method to assess geothermal resources in the Subei Basin, East China, when studying geothermal resources. In contrast to the volumetric method, Monte Carlo stochastic simulations consider trends in input parameters as well as uncertainties. Traverso L et al., (2021) [30] analyzed low indirect land in Europe based on cost-effectiveness and the risk of variable bioenergy production; for the risk assessment, they applied Monte Carlo stochastic simulations, enabling the determination of a possible economic range. Licheng Miao (2022) [31] used classical molecular dynamics simulations (MD), finite element method (FEM) simulations, and Monte Carlo simulation thought methods in the analysis of the effects of four additives in a comparison of batteries. They came close to simulating the random diffusion phenomenon of a substance by simulating the diffusion thousands of times on a computer, where each input was randomly selected from a range of possible input values. Since each input was often an estimation interval itself, the computer model randomly selected any value within that interval for each input, and through a large number of thousands or even millions of simulations, a substance diffusion process could finally be derived.
In addition to the engineering, environmental, and economic fields, Monte Carlo also has advantages in the field of electrical engineering, as mentioned above A. Rezaee Jordehi (2018) [32] noted that power systems have many uncertain parameters, such as electricity prices, failure rates, loads, etc., and that it is extremely important to study them. Thus, in order to realistically model and make better decisions for power systems, uncertainty must be taken into account. The common methods for dealing with uncertainty in power systems can be divided into three main categories. In the first category of methods (probabilistic methods), uncertain parameters are modelled by probability density functions (PDFs) and different probabilistic strategies are dealt with, such as in Monte Carlo stochastic simulations (MCS). Dmitry Krupenev (2020) [33] used a Monte Carlo stochastic simulation to assess the reliability of energy systems and found that due to their large size, the assessment process of power systems is usually very time consuming, which can interfere with subsequent control problems.
The reliability of the Monte Carlo stochastic simulation method and the accuracy of the results depend directly on the number of stochastic states of the system. Stochastic states can be defined as shortage states and non-shortage states; to assess the reliability of a power system using the Monte Carlo stochastic simulation method, only the shortage states should be analyzed. Scholars have compared Monte Carlo stochastic simulation methods with quasi-Monte Carlo methods, and through such comparison, it has been found that Monte Carlo stochastic simulation methods can more effectively improve assessment efficiency. S Nallainathan et al., (2020) [34] adopted Monte Carlo stochastic simulation to model the failure rate when performing reliability assessment on power grids. Later, Haiming HU (2022) [35] used a Monte Carlo stochastic simulation for wind power operation to analyze the probability density of active power output and compared the change in the output probability density curve after adding energy storage. It was found that, after adding energy storage, the horizontal coordinate of the curve shifted right by one unit of storage capacity and brought the output probability density curve of the wind storage system to the desired value.
2.5. Artificial Hummingbird Algorithm (AHA)
The artificial hummingbird algorithm is an algorithm proposed by Zhao weiguo et al., (2021) [36] to simulate the foraging behavior of hummingbirds, which is divided into two phases: self-search and guided search. The algorithm simulates the cognitive behavior of hummingbirds in the self-search phase to improve the algorithm’s search ability and the ability to jump out of the local optimum; it imitates the territorial behavior of hummingbirds in the guided search phase to balance exploitation and exploration abilities. Through the synergistic cooperation of the two search phases, the artificial hummingbird optimization algorithm can effectively solve complex optimization problems. After its proposal, the algorithm began to be applied in various fields. Abdelhady et al., (2022) [37] applied the AHA adaptive adversarial method to select whether to use an adversarial-based learning method. Abid et al., (2022) [38] used the AHA method for solving the RDG planning optimization problem, which improves the techno-economic efficiency of grid distribution systems. In studying the wear rate of composites prepared by chemical methods, Sadoun (2022) [39] et al. developed an RVF–AHA model and reported good results upon training and testing. Ahmed et al., (2022) [40] used the AHA method for determining the optimal location and size of distributed systems in radial distribution grids. The AHA method not only improves the search capability, but also avoids getting trapped in a local optimum situation; the results show that the method is advantageous for distributed system integration.
The steps are as follows:
Step 1: Initialization of data
- (1)
- The n individual hummingbirds are placed on n food sources and randomly initialized as follows:where and are the upper and lower boundaries of the d-dimensional problem, and r is a random vector of representing the location of the th individual.
- (2)
- The access table for food sources is initialized as follows:where represents the hummingbird that has just visited the food source in the current iteration, and indicates that the hummingbird is feeding at a particular food source.
Step 2: Build flight skills including omnidirectional, axial, and in-focus flight
Definition of axial flight:
Definition of diagonal flight:
Definition of omnidirectional flight:
,
where generates a random integer from 1 to , indicates the creation of a random arrangement of integers from 1 to , and is a random number of .
Step 3: Guided foraging
Food sources were updated from older sources based on target food sources selected from all available sources. The mathematical equations simulating guided foraging behaviour and candidate food sources were extrapolated to Equations (10) and (11).
where is a leading factor, is the location of the th food source at the th iteration, and is the location of the target food source that the first hummingbird plans to visit.
The above equation allows each current food source to update its position in the target food source attachment and simulates guided foraging by hummingbirds with different flight patterns.
The location of the th food source is updated as follows:
where is expressed as a function fitness value.
Step 4: Regional foraging
Equation (12) allows any hummingbird to easily find a new food source in its vicinity based on its particular flying skills, depending on its individual location:
where is a regional foraging factor that obeys a standard normal distribution.
Step 5: Migrating for food
Foraging by hummingbirds migrating from the worst source of supplementary nectar rates to a new randomly generated source was Equation (13).
Of these, is the poorest food source in the population in terms of nectar replenishment rate.
2.6. Bidirectional Long- and Short-Term Memory Algorithm (Bi-LSTM)
Bi-LSTM is a combination of a forward LSTM and an inverse LSTM. It divides the hidden layer into two opposing parts, dimensional forward and backward, and reads information from past and future moments, respectively. The algorithm has been widely used in a variety of fields. Huang (2022) [41] used the Bi-LSTM network as a generative model to obtain characteristics of wind power output data distribution. For financial market forecasting, Yang (2022) [42] applied Bi-LSTM to financial time series to mine more valid information, and the results showed that the model is highly accurate and can capture both past and future data information. Huang (2022) [43] proposed a combined CEEMDAN–Bi-LSTM model and used it to perform time-series feature error-correction, and achieved good results in short-term electricity load forecasting. For the instability of solar and weather variables, Bi Guihong (2022) [44] et al. investigated the characteristic relationship between historical data through Bi-LSTM models and obtained forecasts based on the positive and negative spatio-temporal patterns, and the results showed high accuracy and stability in the forecasts.
The steps are as follows: the first forward LSTM calculates the order information of the sequence at the current moment, and the second backward LSTM calculates the inverse order information of the sequence at the same moment. Finally, the hidden layer state of the Bi-LSTM at is obtained by weighting the forward hidden layer state and the backward hidden layer state.
where indicates the forward hidden layer state at , indicates the backward hidden layer state at , indicates the weights corresponding to and , and indicates the hidden layer bias at .
2.7. Other Comparative Optimization Algorithms
GRU has been widely used in both electrical and economic fields. Zou (2022) [45] constructed an SA–GRU model for stock price prediction, where GRU could effectively extract the dependencies between stock factors. Yi (2022) [46] constructed a deep life-prediction network by stacking two layers of GRU for the remaining life of motor rolling bearings, and the results showed that the method had higher prediction accuracythan the single-layer version. Qiao (2022) [47] predicted wind power using a GRU algorithm optimized by a starvation game search algorithm and demonstrated that the method improved the prediction accuracy via simulation.
The LSTM algorithm is also a commonly used prediction algorithm. Xue (2022) [48] proposed an improved LSTM prediction algorithm for electromechanical equipment life, which used three additional layers of BP structure in series on top of LSTM and proved to be effective for equipment life prediction. Jian (2022) [49] proposed a CNN–LSTM-based prediction system for short-term power compliance that demonstrated a maximum 1 h compliance prediction accuracy of 98.66%, effectively improving prediction accuracy. Meanwhile, Ge (2022) [50] et al. performed residual life prediction using an improved LSTM algorithm and showed that their residual life prediction method had a good prediction effect for multi-service equipment.
3. Empirical Analysis: 220 KV Transformers
In this study, seventy-five 220 KV transformer units put into service in 1986 by an energy company were selected to verify the feasibility of the MC–AHABi–LCC model. The company had recorded all costs incurred by each unit in strict accordance with cost management principles. The sample set was pre-processed prior to the study. First, for equipment that did not incur any O&M cost in some year, we filled the null with zero to ensure the integrity and processability of the dataset. Second, the data for the entire sample set were discounted by a 3% inflation rate, and the data for each year were discounted to 1986 to ensure the objectivity of the sample set. The following section verifies the feasibility of the study on the processed dataset.
3.1. Sample LCC Cost Components
For our 220 KV transformer sample, we summarized the LCC model cost of the equipment as shown in Figure 4 below based on the actual previous cost attribution rules of the company and our own study.
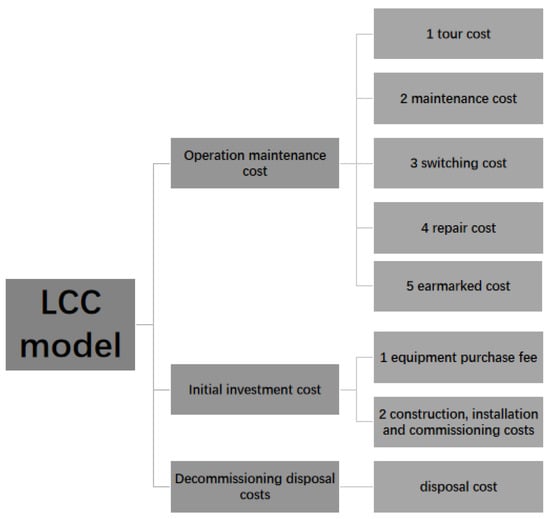
Figure 4.
LCC model cost diagram.
As shown in Figure 4, in this study, we divided the LCC model cost of the equipment into initial investment cost (including equipment acquisition cost, installation cost, and commissioning cost), operation and maintenance cost (cost for inspection and maintenance and repair to ensure the safety and availability of the equipment, which can be subdivided into tour cost, switching cost, repair cost, earmarked cost, and self-operating cost) and decommissioning and disposal cost (the value of equipment that can be recycled at the end of its life and the disposal cost that may be incurred in disposing of the equipment).
Define the initial investment cost for the th sample of a particular type of electrical equipment as , the O&M maintenance cost for the nd year as , and the decommissioning disposal cost as . Then, the whole life-cycle cost of the th unit as can be described as
where is the number of samples of this equipment, is the service life of the first unit in operation until the year when a technical replacement occurs, represents all costs incurred within two years of the first unit being put into service. consists of tour cost , maintenance cost , switching cost , repair cost , and earmarked cost as shown in Formula (15):
When is used, indicates the tour cost incurred during the third year of operation of the second equipment in the sample set, and the other costs are expressed in the same sense. In our study, the results of the stochastic simulations were compared with the results of the traditional calculation method to obtain the best study solution, which follows the algorithm shown in studies [11,12] for the calculation of LCC.
3.2. Screening Outliers Using the Isolated Forest Model
We found ambiguity in the management rules and improper recording of costs in the process of capturing cost data. For example, the average value of repair cost for all year subsets was 84,564.34, but the maximum value was 1,534,324.54. This was verified to be the 1st year that this repair cost occurred after a piece of equipment was put into service and was directly returned to the factory for replacement due to a major problem, but the cost was still retained. Therefore, the collected dataset needed to be screened for outliers. We searched O&M repair costs using Isolated Forest to label and filter out data judged to be outliers, which were removed and replaced with the average of the normal values of all tour costs in equal amounts.
Using the 36-year tour cost of a 220 KV transformer as an example, the outliers flagged using the Isolated Forest algorithm are shown in Figure 5.
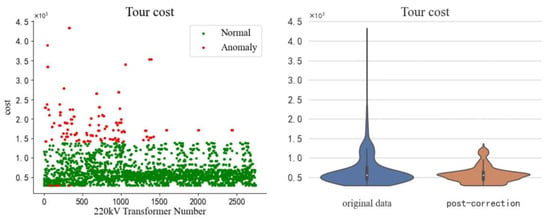
Figure 5.
220 KV tour cost anomaly screening chart.
The red dots in the graph on the left are outliers. According to our measurement, the percentage of outliers was 10.01%, which means that the screened dataset retained 90% of the original dataset. The Isolated Forest algorithm determines outliers in a dataset based on the sparsity between values. Based on the results of screening outliers, the range of normal values for the tour cost was approximately [331.51, 1165.1], and the percentage of normal values contained within this range was 97.5478%.
After screening out the outliers, they were corrected with the average of the normal values to ensure that the stochastic simulation was accurate. The graph on the right shows a violin plot of patrol cost before and after the correction, the blue graph is the dataset before the correction, and the brown graph is the dataset after the correction. It can be seen that the blue graph is more elongated, with a maximum value of around 4400, and the yellow graph is flatter and wider, demonstrating a more concentrated range of distribution in the dataset after the outliers were removed. We used the quartile polar deviation and standard deviation to evaluate the corrected dataset. Before the correction, the two indicators were 317.6512 and 403.7934, respectively; after the correction, they were 232.1810 and 274.6287, respectively, thus proving that the outliers in the dataset had been effectively reduced.
Tour cost, switching cost, repair cost, and earmarked cost were analyzed in the same steps using Isolated Forest; the results of the outlier screening are shown in Figure 6 below.
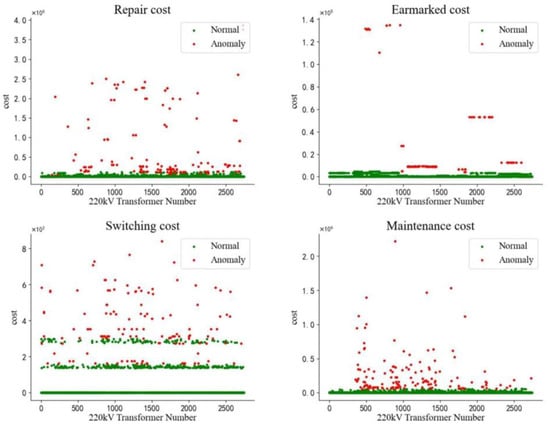
Figure 6.
Outlier screening chart of maintenance and maintenance cost.
Based on the above graph, the distribution of outliers for repair and maintenance cost was irregular, and the distribution of outliers spanned a wide range, which was consistent with the fact that equipment repair was a chance event. The distribution of switching and earmarked costs was regular and distributed with regularity, which was consistent with the rule that both types of cost were equally shared among the same batch of equipment. To demonstrate the effectiveness of using Random Forest to filter outliers and correct the data set with the mean, the table below shows the difference between the five categories of cost before and after correction.
Table 1 shows that the proportion of outliers screened for each cost was small, and all retained most of the characteristics of the original dataset. The quartile extreme deviation and standard deviation before and after data correction have been effectively reduced, especially for repair cost. The table also gives the range of normal values; taking tour cost as an example, the range [331.51, 1165.09] contained 97.55% normal values. In terms of inclusion, the proportion of normal values included in repair and tour cost was slightly smaller than in the other three costs, which was related to the chance and severity of equipment failures.

Table 1.
Revised results for various cost of O&M maintenance.
3.3. Correction of Equipment Failure Rates Using the Weibull Model
The maintenance cost and repair cost included in the LCC result from equipment failures. As the pattern of equipment failures fits the Weibull distribution, we correct the probability of these two types of cost occurring with the Weibull distribution in 3.3, to improve the stochastic simulation.
However, we first needed to filter out all non-zero values of in the sample dataset to fit the Weibull distribution. contained 612 occurrences of repair cost and 986 occurrences of repair cost in 37 years; using as an example, the 612 repair faults were collated into a new sample set and arranged and labeled from smallest to largest by year, defining the year of occurrence of the fault as . According to Equation (5), we have
where is the median rank. .
The two-parameter profile fitted using least squares for group 612 () follows.
The results of fitting for tour cost:
The parameters were fitted in the same way for the repair cost ; the results were as follows:
The actual probabilities of occurrence for each of the years , are presented in bar charts and the probabilities corrected for the Weibull curve are presented in line graphs in Figure 7 below.
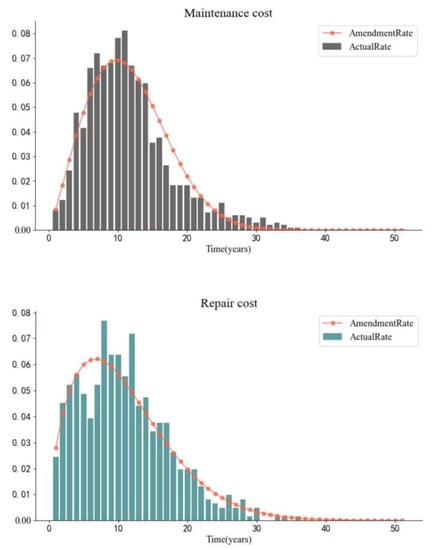
Figure 7.
Comparison of failure rates by year for repair after the Weibull amendment.
Figure 7 shows that the probability of incurring maintenance or repair cost for equipment failures both trend upwards and then downwards, with the probability of incurring maintenance cost peaking around year 10 and repair cost peaking around year 7; after 30 years, the probability of incurring equipment repair cost dropped to less than 1%.
3.4. LCC of Random Simulation Equipment
After the Weibull model was used to modify the occurrence probability of equipment maintenance and repair costs, the five operation and maintenance costs were, respectively, randomly simulated. Define as , the five types of expenses, such that (). Then, is the cost for each year under each cost category (in this case, ), is the number of random simulations, and is the cost of the stochastic simulation.
Define as the probability of a nonzero value in each year for each type of expense, that is, the annual equipment inspection, maintenance, repair, and other five costs; is a random number, . The specific process of the full stochastic simulation is shown in Figure 8:
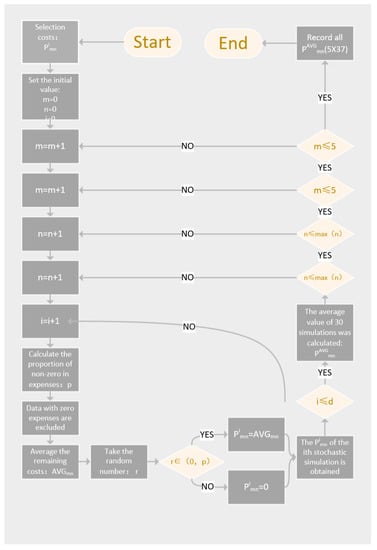
Figure 8.
Flow chart of Monte Carlo stochastic simulation.
is the average of non-zero values. For example, the non-zero value of maintenance cost in the third year, that is, the set of overmaintenance costs in the sample set is screened out, and the set is averaged as . is the average value of random simulation; for example, is
, representing the switching cost in the fourth year after averaging values at the end of stochastic simulations.
The process of stochastic simulation starts from , and the first result, , is obtained. Table 2 below shows the results from repeated stochastic simulation.

Table 2.
Data sample table generated by random simulation.
Table 2 is a matrix of (). All data were generated by random simulation. A Table 2 with different values could be obtained based on different values of . On this basis, the calculation formula of LCC and annual average LCC in the year under stochastic simulation is as follows:
where is the initial investment cost of the 220 KV transformer, which is the cost before the equipment was put into use in 1986, is the disposal cost, which was taken as the disposal cost in 2021 and discounted to 1986 based on an inflation rate of 3%.
In this paper, we take to conduct random simulation, respectively, to obtain , and compare it with the traditional LCC method to obtain the average value.
As shown in Figure 9, the mean is the average annual cost calculated by the traditional LCC method. The traditional LCC method calculates the cost by averaging the average repair cost incurred in different years and different service periods. The results of the four random simulations are close to the mean, so it is impossible to directly judge which random simulation presents the best effect. To better present the research effect, the average annual LCC obtained from 20 to 37 years is shown in Figure 10, which follows Figure 9.
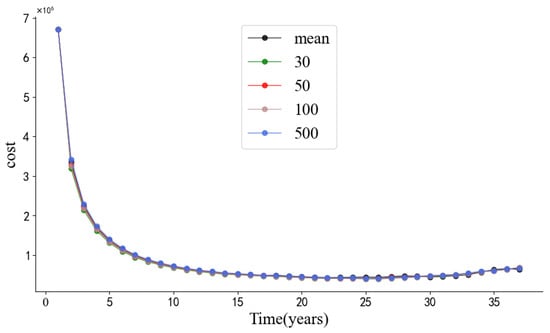
Figure 9.
Comparison of annual average LCC over 37 years fitted by random simulation.
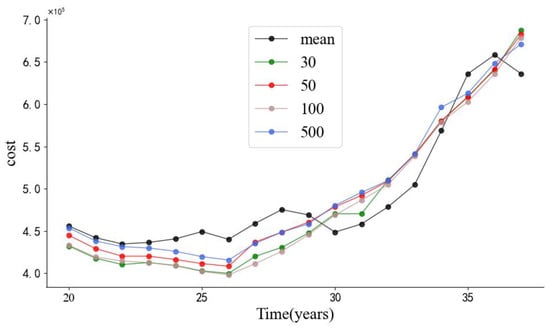
Figure 10.
Comparison of annual LCC over 37 years fitted by random simulation.
As shown in Figure 10, the following conclusions can be drawn: the results obtained by stochastic simulation are more stable and the fluctuation range is smaller than that obtained by the traditional averaging method. In contrast to the results for four iterations of stochastic simulation, the simulation results for when iterations produces more intermediate values. However, more random simulation results will produce an LCC that reflects the sample set “personality” and strengthen its common characteristics compared to further extensions towards infinity. Thus, we think 50 iterations of stochastic simulation for the LCC and economic life is the best solution. To obtain the economic life of 220 KV transformer samples, we describe our prediction of the curve for in 3.5.
3.5. Using Hummingbird Optimization Algorithm and Other Models to Predict Future LCC
In this study, we used data on seventy-five 220 KV transformers that were first put into service in 1986 as our research object. Their operation cycle was 37 years, while their design life (according to manufacturer safety expectations) was 41 years. To more accurately obtain the economic life of the equipment and also reference the design life, it was necessary to predict the average annual LCC of the equipment over the remaining four years. In the random simulation described in Section 3.4, there are 37 data points for the curve. The first 34 data points were used as the training set of the model, and the last 3 data points were used as the test set to verify the effectiveness of the algorithm.
Because the original order of magnitude is large, the data needed to be preprocessed and standardized to reduce the error. The standardized formula is as follows:
where is the LCC lifetime data of each year.
For the processed data, this study adopted the Bi-LSTM algorithm for prediction. To enhance the accuracy of prediction results, the artificial hummingbird algorithm was used to optimize Bi-LSTM parameters. The number of parameters set for the input layer, connection layer, and hidden layer of the AHA–Bi-LSTM algorithm in this method was 3, 1, and 10, respectively. To ensure the rationality of the benchmark test, the parameters of the Bi-LSTM, LSTM, and GRU comparison algorithms were set as described above. The flowchart is shown in Figure 11.
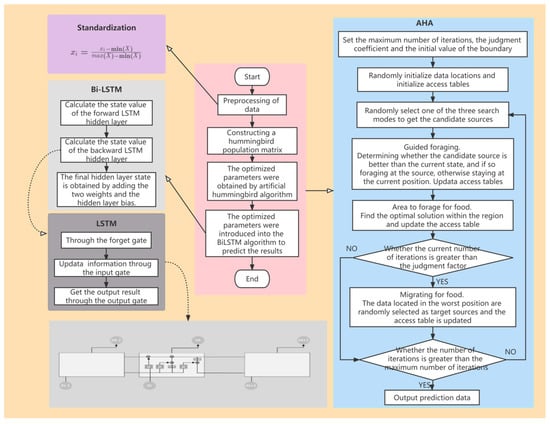
Figure 11.
Flow chart of the prediction algorithm.
In this study, the Bi-LSTM algorithm, LSTM algorithm, and GRU algorithm were selected for comparison, and the prediction effect was evaluated by the MAE, MAPE, and RMES error evaluation indexes, as shown in Figure 12.
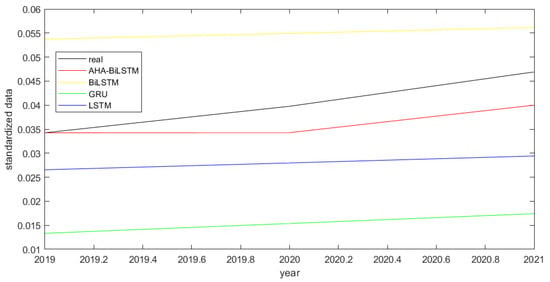
Figure 12.
Comparison of prediction method errors diagram.
In Figure 12, the black curve is the true value from 2019 to 2021, the red curve represents the predicted value obtained by the AHA–Bi-LSTM algorithm adopted in this study, the yellow curve is the Bi-LSTM algorithm, the GRU is the green curve, and the LSTM is the blue curve. The red curve is the closest to the true value curve, followed by the LSTM algorithm represented by the blue curve, while Bi-LSTM and GRU had poor prediction effects. Therefore, the AHA–Bi-LSTM algorithm was an appropriate selection for use in prediction.
Table 2 shows that the MAE of the AHA–Bi-LSTM algorithm was improved by 71.84% compared with that of the Bi-LSTM algorithm. Compared with the GRU algorithm, its MAPE value increased by 93.13%. Compared with the LSTM algorithm, the value of RMES was improved by 60.65%. Through the judgment of the three error indexes, the prediction effect of the AHA–Bi-LSTM algorithm on each index was good and was the most effective prediction method, which indicates that the method could effectively predict the average annual O&M cost data. Therefore, this algorithm was used to predict the data for the next four years; the standardized results of prediction are shown in the following Figure 13.
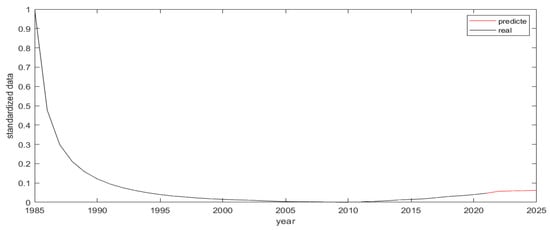
Figure 13.
Standardized forecast of expenses from 2022 to 2025.
The red part is the prediction result. The data still show an upward trend, which indicates that in the next few years, costs will still rise, but the rate of the rise will not substantially increase. Table 3 below shows the specific annual LCC for each year, with the projected portion highlighted in green.

Table 3.
Error plots of AB data in the four models.
Table 4 shows that the average annual cost reached its lowest value in the 26th year after the eqipment was put into use. The predicted cost gradually rose year-byyear, but the trend of growth is not obvious.

Table 4.
Annual LCC table of each year predicted by AHA–Bi-LSTM algorithm. (Green font is the forecast section).
3.6. Empirical Conclusions and Research Results
As described in Section 3.5, we obtained the LCC curve for 41 years of 220 KV transformer use, which showed a trend that first decreased and then increased, dropping to its lowest point in 2012; that is, the average annual LCC of the equipment dropped to the lowest point after 26 years of use. Therefore, according to the definition of economic life, the economic life of the equipment is 26 years. While its design life is 41 years, suggesting that the manufacturers expected an operational cycle of 41 years for this equipment, this estimate may not include all security, economic, and technical factors that can affect equipment operation. Based on our analysis, which endeavored to encompass such factors, we arrived at an optimal retirement life of 26 years, which would guarantee the safe operation of the equipment while also maximizing economic benefits.
Currently, energy enterprises are continuing to expand, and the amount of equipment introduced increases every year. The stable operation of equipment is critical to guaranteeing the lives and safety of enterprises and people, such that traditional enterprises often adopt an operational attitude of “only focusing on efficiency, regardless of cost”. However, the operating capital of enterprises is limited. To reasonably allocate enterprise capital and ensure the safe and stable operation of equipment, this paper has described the novel MC–AHABi–LCC algorithm, which can accurately calculate the optimal retirement period of equipment and make contributions to the safe and sustainable development of energy enterprises. MC–AHABi–LCC not only selects a suitable economic life calculation method, but also can determine the economic life or technical life decommissioning point according to the curve trend. If the trend is first down and then up, the inflection point of the curve is the economic life point, that is, the optimal retirement life point of the equipment. If the trend is falling, this suggests that the operational cost of repair is gradually increasing even within a fixed number of years. Large initial investment costs must be coupled with repair costs and equipment safety operations to achieve the best economic life; because we must ensure the safe operation of the equipment and establish the technical life of the equipment as the end of the curve, then the longer that use of the equipment provides economic benefits, the better. The end point of the curve is the optimal retirement life point of the equipment. This model improves the traditional LCC method by avoiding errors such as cost collection. The model first uses of Isolated Forest method to screen the dataset, and the filtered dataset is corrected via Weibull distribution. To address the small probability of equipment failure, a Monte Carlo stochastic simulation is used to replace the averaging process in the traditional LCC method. Moreover, this model also adds a prediction step, which makes the calculation of the optimal decommissioning life of the equipment more accurate.
In Section 3.1, we delimited the composition structure of the sample set and LCC based on our empirical study of the actual management rules and statistical data. The sample was composed of data on seventy-five 220 KV transformers: their purchase cost, disposal cost, and maintenance and repair costs had been recorded over their 36 years of operation. The operation costs consisted of tour costs, maintenance costs, switching costs, repair costs, and earmarked costs. All costs were obtained in strict accordance with the inclusion rules of the LCC method. In Section 3.2, the outliers of each cost in the dataset were screened according to the Isolated Forest algorithm, and incorrectly recorded data generated in the collection process were deleted to make the actual cost obtained in the random simulation more accurate. In Section 3.3, the incidence of operational maintenance and repair costs were modified, respectively, via Weibull distribution to make the probability analysis of equipment failure more rigorous. In Section 3.4, a Monte Carlo simulation was carried out for each operation, repair, and maintenance cost, respectively, and after simulation, these costs were summed up for the same year. Then, the operation, repair, and maintenance costs for each year were gradually added up and divided by the corresponding years to obtain the annual LCC. In Section 3.5, the artificial hummingbird optimization algorithm and Bi-LSTM model were used to predict the annual average cost of LCC, while the cost of the next 4 years was predicted with 37 simulated data points to build a curve with the same length as the equipment’s design life.
Using the economic life and technical life of our case study equipment, we could obtain the optimal period for equipment decommissioning. Although the algorithm proposed in this study optimizes the traditional LCC algorithm and makes the calculation method for life-cycle cost and economic life more rigorous and accurate, there are still some improvements to be made in the future. For example, the classification rules of equipment costs and the collection rules of expenses are not perfect, thus affecting the accuracy of the optimal retirement year. Thus, in our future research, we will develop more complete cost classification rules and cost collection rules. In the traditional calculation methods for LCC and economic life, the relationship between the cost and the service life of the equipment is not considered. For example, when the equipment is in the “youth period”, the corresponding cost is relatively low; when the equipment is in the “old age period”, the corresponding cost will increase. In future research, the relationship between equipment cost and service life should be taken into account to optimize the calculation process of optimal decommissioning life.
4. Major Contributions and Future Work
As the safe operation of energy equipment is critical to maintaining our daily lives and safety, enterprise management personnel often do not consider cost factors when attempting to fix equipment operation problems, as their focus is on ensuring equipment safety and its stable operation. However, this attitude is only sustainable in small enterprises.
In the past 20 years, with the continuous expansion of the scale of energy enterprises, the operation cost of equipment and the number of failures has also continued to increase. This working mode often leads to breaks in the capital chain of enterprises and does not adequality solve equipment operation problems. Therefore, it is necessary to propose lean-cost management for equipment to meet the increasing social demands for energy. The MC–AHABi–LCC method that we propose in this paper is mainly intended for the early cost work of LCC in the field of energy. Using this model, the optimal cost of equipment and the optimal scheme of maintaining high efficiency can be obtained in a more rigorous fashion.
The MC–AHABi–LCC method may offer a touchstone for future studies on LCC-based equipment economic life determination, and we will continue to improve our research as well. Since LCC has been intensively studied in China for only about 30 years, the classification, detailed management, and allocation rules of equipment cost are still not perfect. Still, due to the insufficient sample base and time span of the LCC model, many kinds of energy equipment (especially new equipment being put into use) lack a complete LCC cost chain. These problems will be solved as energy enterprises improve their cost management. Furthermore, with the detailed management of expenses, the expense accounting rules in the LCC model can be improved, and the composition structure of runtime cost and the accuracy of outlier screening can be optimized. In addition, to popularize the economic life model in energy industries, it will be important to explain how the economic-life-based actual average retirement age is much shorter than for equipment in the past. To persuade companies that are in the traditional and single-target work mode to change—to end the “only look at efficiency, regardless of the cost” mindset—this is the main problem that we will need to solve in the future.
The main contributions of this research to energy enterprise asset management are as follows:
- LCC and the single-task system of economic-life transformation enterprises are introduced to help enterprises improve the traditional single-goal system. When determining the operation cycle of equipment, it is necessary to consider not only the stable and safe operation of equipment, but also the operating cost factors of equipment, to maintain the stability of the capital chain and promote the lean management of equipment.
- Differing from previous studies, the MC–AHABi–LCC model proposed in this study uses Isolated Forest (IF) to screen outliers for cost data and a Welbull distribution for the probability correction of the revised dataset to make the results more accurate. Using random simulation instead of the traditional method of directly calculating the average cost in LCC can provide a more rational explanation of the “small probability” of incurred costs, which better reflects the reality of the “randomization” of operation and maintenance costs. While retaining the overall characteristics of the original dataset, the “personality” of each cost can be considered, which makes the selection of the economic life of LCC more flexible and closer to the actual production situation.
- Differing from LCC in other fields of research (such as the military industry), research on LCC for energy companies is still at the exploration stage, and many of the records in management costs are still incomplete. However, by using models built with machine learning and optimization algorithms, more accurate and rigorous LCC forecasts are possible.
Author Contributions
Improving traditional LCC and EL models and determining the decommissioning life of equipment by considering both stability and economic benefits is of great significance to the sustainable development of energy enterprises. Conceptualization, B.L., T.W., C.L., Z.D., H.Y., Y.S. and P.W.; Methodology, T.W., Z.D., H.Y., Y.S. and P.W.; Software, T.W. and Y.S.; Validation, T.W., Y.S. and P.W.; Formal analysis, B.L., T.W., C.L., Z.D., H.Y., Y.S. and P.W.; Investigation, B.L. and C.L.; Resources, T.W. and P.W.; Data curation, B.L., C.L., Z.D., H.Y. and Y.S.; Writing—original draft, T.W. and Y.S.; Writing—review & editing, T.W. and Y.S.; Visualization, T.W. and P.W.; Supervision, T.W. and P.W.; Project administration, T.W.; Funding acquisition, B.L., T.W., C.L., Z.D., H.Y. and Y.S. All authors have read and agreed to the published version of the manuscript.
Funding
This work was supported by the Hebei Electric Power Research Institute and by a grant from North China Electric Power University.
Conflicts of Interest
The authors declare no conflict of interest.
References
- Gupta, Y.P. Life cycle cost models and associated uncertainties. In Electronic Systems Effectiveness and Life Cycle Costing; Springer: Berlin/Heidelberg, Germany, 1983; pp. 535–549. [Google Scholar]
- Li, N.; Wang, X.; Zhu, Z.; Wang, Y.; Han, J.; Xu, R. The Research on the LCC Modelling and Economic Life Evaluation of Power Transformers. Sci. Math. 2020, 12, 347. [Google Scholar] [CrossRef]
- Dominguez-Delgado, A.; Domínguez-Torres, H.; Domínguez-Torres, C.A. Energy and economic life cycle assessment of cool roofs applied to the refurbishment of social housing in southern Spain. Sustainability 2020, 12, 5602. [Google Scholar] [CrossRef]
- Wu, Y. Computer High-precision Analysis Method for Economic Life of Oilfield Development. J. Phys. Conf. Ser. 2020, 1648, 32175. [Google Scholar] [CrossRef]
- Cai, Y.; Liu, L.; Cheng, H.; Ma, Z.; Zhu, Z. Application review of life cycle cost (LCC) technology in power system. Power Syst. Prot. Control. 2011, 39, 149–154. [Google Scholar]
- Bai, Y.; Xiong, C.; Han, B. Economic life assessment of transformer based on life cycle theory. Shaanxi Electr. Power 2014, 42, 6. [Google Scholar]
- Chen, X. Selection analysis of main equipment of substation based on life cycle cost. Electrotechnical 2022, 4, 161–163. [Google Scholar] [CrossRef]
- Wang, Y.; Song, S.; Gao, M.; Wang, J.; Zhu, J.; Tan, Z. Accounting for the Life Cycle Cost of Power Grid Projects by Employing a System Dynamics Technique: A Power Reform Perspective. Sustainability 2020, 12, 3297. [Google Scholar] [CrossRef]
- Hemmati, N.; Galankashi, M.R.; Imani, D.M.; Rafiei, F.M. An integrated fuzzy-AHP and TOPSIS approach for maintenance policy selection. Int. J. Qual. Reliab. Manag. 2019, 37, 1275–1299. [Google Scholar] [CrossRef]
- Galankashi, M.R.; Khorramrouz, F.; Esmaeilnezhad, M.; Rafiei, F.M.; Hisjam, M. Maintenance strategy selection in a cement company: An integrated AHP-FAHP approach. AIP Conf. Proc. 2020, 2217, 30197. [Google Scholar]
- Lv, Z.; Wang, C.; Wan, C.; Wang, R.; Dai, X.; Wei, J.; Xia, H.; Li, W.; Zhang, W.; Cao, S.; et al. Strain-Driven Auto-Detachable Patterning of Flexible Electrodes. Adv. Mater. 2022, 34, 2202877. [Google Scholar] [CrossRef]
- Hu, J.; Li, K.; Ma, R. Life cycle cost model of power transformer under the new environment. In Applied Mechanics and Materials; Trans Tech Publications Ltd.: Stafa-Zurich, Switzerland, 2013; Volume 241, pp. 591–596. [Google Scholar]
- Lai, Z. Comprehensive life assessment of high-voltage circuit breaker based on life cycle cost. Commun. World 2017, 9, 117–118. [Google Scholar]
- Zhao, Y.; He, Q.; Zhang, W.; Wang, H. Research on optimization of technical reform overhaul strategy based on equipment LCC. China Equip. Eng. 2021, 10, 4. [Google Scholar]
- Sheng, M.; Zhang, S. Study on the Optimal Replacement Time of Physical Assets in Power Grid on the Basis of Grey Theory. Electr. Power Constr. 2018, 6, 131–136. [Google Scholar]
- Zhang, K.X.; Yao, J.W.; Zhao, Z.P. Life Cycle Costing Decision Analysis for Electric Multiple Units Based on Reliability. In Applied Mechanics and Materials; Trans Tech Publications Ltd.: Stafa-Zurich, Switzerland, 2014; Volume 644, pp. 6274–6280. [Google Scholar]
- Nair, A.; Horiguchi, I.; Fukumori, K.; Kino-oka, M. Development of instability analysis for the filling process of human-induced pluripotent stem cell products. Biochem. Eng. J. 2022, 185, 108506. [Google Scholar] [CrossRef]
- Liu, J.; Wang, P.; Jiang, D.; Nan, J.; Zhu, W. An integrated data-driven framework for surface water quality anomaly detection and early warning. J. Clean. Prod. 2019, 251, 119145. [Google Scholar] [CrossRef]
- Lin, Z.; Liu, X.; Collu, M. Wind power prediction based on high-frequency SCADA data along with isolation forest and deep learning neural networks. Int. J. Electr. Power Energy Syst. 2020, 118, 105835. [Google Scholar] [CrossRef]
- Ahmed, S.; Lee, Y.; Hyun, S.-H.; Koo, I. Unsupervised Machine Learning-Based Detection of Covert Data Integrity Assault in Smart Grid Networks Utilizing Isolation Forest. IEEE Trans. Inf. Forensics Secur. 2019, 14, 2765–2777. [Google Scholar] [CrossRef]
- Barbariol, T.; Susto, G.A. TiWS-iForest: Isolation forest in weakly supervised and tiny ML scenarios. Inf. Sci. 2022, 610, 126–143. [Google Scholar] [CrossRef]
- Jiang, J.; Li, T.; Chang, C.; Yang, C.; Liao, L. Fault diagnosis method for lithium-ion batteries in electric vehicles based on isolated forest algorithm. J. Energy Storage 2022, 50, 104177. [Google Scholar] [CrossRef]
- Wang, H.; Jiang, W.; Deng, X.; Geng, J. A new method for fault detection of aero-engine based on isolation forest. Measurement 2021, 185, 110064. [Google Scholar] [CrossRef]
- Agarwal, U.; Jain, N.; Kumawat, M.; Maherchandani, J.K. Weibull Distribution Based Reliability Analysis of Radial Distribution System with Aging Effect of Transformer. In Proceedings of the 2020 21st National Power Systems Conference (NPSC), Gandhinagar, India, 17–19 December 2020. [Google Scholar] [CrossRef]
- Suntaranurak, J.; Suwanasri, T.; Suwanasri, C. Lifetime Estimation of Switching Devices Using Weibull Distribution Analysis. International Conference on Electrical En-gineering. In Proceedings of the 2020 17th International Conference on Electrical Engineering/Electronics, Computer, Telecommunications and Information Technology (ECTI-CON), Phuket, Thailand, 24–27 June 2020; pp. 413–416. [Google Scholar]
- Xu, A.; Yi, B.; Wang, C.; Zhao, D. Reliability analysis of electricity meter based on Weibull distribution. Autom. Instrum. 2017, 7, 56–58. [Google Scholar]
- Wang, A.; Yang, B.; Yuan, C.; Xu, D. Research on life prediction method of intelligent electricity meter based on Weibull distribution and maximum likelihood method. Acta Metrol. Sin. 2019, S01, 125–129. [Google Scholar]
- Bege, H.; Yusuf, A. A Quality of Experience (QOE) Based Estimate of Bandwidth Requirement for Computer Networks. Sci. Math. 2020, 24, 175–182. [Google Scholar]
- Wang, J.; Yin, H. Failure Rate Prediction Model of Substation Equipment Based on Weibull Distribution and Time Series Analysis. IEEE Access 2019, 7, 85298–85309. [Google Scholar] [CrossRef]
- Traverso, L.; Mazzoli, E.; Miller, C.; Pulighe, G.; Perelli, C.; Morese, M.M.; Branca, G. Benefit and Risk Analysis of Low iLUC Bioenergy Production in Europe Using Monte Carlo Simulation. Energies 2021, 14, 1650. [Google Scholar]
- Miao, L.; Wang, R.; Di, S.; Qian, Z.; Zhang, L.; Xin, W.; Liu, M.; Zhu, Z.; Chu, S.; Du, Y.; et al. Aqueous Electrolytes with Hydrophobic Organic Cosolvents for Stabilizing Zinc Metal Anodes. ACS nano 2022, 6, 9667–9678. [Google Scholar] [CrossRef]
- Jordehi, A.R. How to deal with uncertainties in electric power systems? A review. Renew. Sustain. Energy Rev. 2018, 96, 145–155. [Google Scholar] [CrossRef]
- Krupenev, D.; Boyarkin, D.; Iakubovskii, D. Improvement in the computational efficiency of a technique for assessing the reliability of electric power systems based on the Monte Carlo method. Reliab. Eng. Syst. Saf. 2019, 204, 107171. [Google Scholar] [CrossRef]
- Nallainathan, S.; Arefi, A.; Lund, C.; Mehrizi-Sani, A.; Stephens, D. Reliability Evaluation of Renewable-Rich Microgrids Using Monte Carlo Simulation Considering Resource and Equipment Availability. In Proceedings of the 2020 IEEE International Conference on Power Systems Technology (POWERCON), Bangalore, India, 14–16 September 2020; Volume 16, pp. 7–17. [Google Scholar]
- Hu, H.; Yan, Y. Probability Density Analysis of Wind Storage Output Based on Monte Carlo Simulation. J. Phys. Conf. Ser. 2022, 2195, 12043. [Google Scholar] [CrossRef]
- Zhao, W.; Wang, L.; Mirjalili, S. Artificial hummingbird algorithm: A new bio-inspired optimizer with its engineering applications. Comput. Methods Appl. Mech. Eng. 2022, 388, 114194. [Google Scholar] [CrossRef]
- Ramadan, A.; Kamel, S.; Hassan, M.H.; Ahmed, E.M.; Hasanien, H.M. Accurate photovoltaic models based on an adaptive opposition artificial hummingbird algorithm. Electronics 2022, 11, 318. [Google Scholar] [CrossRef]
- Abid, M.S.; Apon, H.J.; Morshed, K.A.; Ahmed, A. Optimal Planning of Multiple Renewable Energy-Integrated Distribution System With Uncertainties Using Artificial Hummingbird Algorithm. IEEE Access 2022, 10, 40716–40730. [Google Scholar] [CrossRef]
- Sadoun, A.M.; Najjar, I.R.; Alsoruji, G.S.; Abd-Elwahed, M.S.; Elaziz, M.A.; Fathy, A. Utilization of improved machine learning method based on artificial hummingbird algorithm to predict the tribological behavior of Cu-Al2O3 nanocomposites synthesized by in situ method. Mathematics 2022, 10, 1266. [Google Scholar] [CrossRef]
- Fathy, A. A novel artificial hummingbird algorithm for integrating renewable based biomass distributed generators in radial distribution systems. Appl. Energy 2022, 323, 119605. [Google Scholar] [CrossRef]
- Huang, L.; Li, L.; Wei, X.; Zhang, D. Short-term prediction of wind power based on BiLSTM–CNN–WGAN-GP. Soft Comput. 2022, 26, 10607–10621. [Google Scholar] [CrossRef]
- Yang, M.; Wang, J. Adaptability of Financial Time Series Prediction Based on BiLSTM. Procedia Comput. Sci. 2022, 199, 18–25. [Google Scholar] [CrossRef]
- Huang, W.; Chen, T. Short-term power load prediction based on SAE and CEEMDAN-BiLSTM combination model. Comput. Appl. Softw. 2022, 39, 52–58. [Google Scholar]
- Bi, G.; Zhao, X.; Chen, C.; Chen, S.; Li, L.; Xie, X.; Luo, Z. Ultra-short-term prediction of photovoltaic power generation based on multi-channel input and PCNN-BiLSTM. Power Syst. Technol. 2022, 46, 3463–3476. [Google Scholar] [CrossRef]
- Zou, J.; Li, L. Stock Price Prediction Research Based on RF-SA-GRU ModelComputer Engineering and Application. Sci. Math. 2019, 4, 122–126. [Google Scholar]
- Yin, B.; Yuan, X.; Yang, Y.; Xie, L. Residual life prediction of servo motor rolling bearings based on stacked GRUs. Mach. Tools Hydraul. 2022, 12, 153–158. [Google Scholar]
- Qiao, T.; Xie, L.; Ye, J.; Gao, Y.; Dai, B. Short-term wind power prediction based on wind speed fluctuation characteristics Electrical measurement and instrument. Stat. Sci. 2022, 2, 97–105. [Google Scholar]
- Xue, X.; Zhao, X. Equipment life prediction of LSTM-BP long- and short-term memory model. Mod. Comput. 2022, 14, 79–82. [Google Scholar]
- Jian, D.; Li, P.; Huang, H.; Liang, Z. Short term power load forecasting based on CNN-LSTM network. Electr. Electr. 2022, 9, 1–6. [Google Scholar]
- Ge, Y.; Ma, J.; Ren, Y.; Qin, J. Prediction of remaining life of electromechanical equipment under multiple working conditions based on improved LSTM. J. Chang. Inst. Technol. 2022, 5, 65–72. [Google Scholar] [CrossRef]
Publisher’s Note: MDPI stays neutral with regard to jurisdictional claims in published maps and institutional affiliations. |
© 2022 by the authors. Licensee MDPI, Basel, Switzerland. This article is an open access article distributed under the terms and conditions of the Creative Commons Attribution (CC BY) license (https://creativecommons.org/licenses/by/4.0/).