Article

Influences of Naphthalene Concentration on Starch Anaerobic Digestion: Focusing on Digestion Performance, Extracellular Polymeric Substances and Function Microbial Community

1
School of Environmental Science and Engineering, China-America CRC for Environment & Health, Shandong University, 72# Jimo Binhai Road, Qingdao 266237, China
2
Key Laboratory of Pollution Processes and Environmental Criteria (Ministry of Education), Tianjin Engineering Center of Environmental Diagnosis and Contamination Remediation, College of Environmental Science and Engineering, Nankai University, Tianjin 300350, China
*
Author to whom correspondence should be addressed.
Sustainability 2022, 14(24), 16377; https://doi.org/10.3390/su142416377
Submission received: 4 November 2022 / Revised: 1 December 2022 / Accepted: 2 December 2022 / Published: 7 December 2022

Abstract

:
Polycyclic aromatic hydrocarbons (PAHs) are widely distributed in the sludge environment due to activities such as oil extraction and pose a serious threat to deep-seated anaerobic microorganisms. Thus, in this study, we discussed the dose–response efficiency of naphthalene (Nap, a typical PAH) on anaerobic digestion (AD) through co-metabolic degradation via batch experiments. The batch results showed that 30 mg/L Nap promoted the AD with the accumulation of CH4 18.54% higher than the control (without Nap) by increasing the efficiency of hydrolysis and acetogenesis 99.49% and 61.95%, respectively. However, adverse effects were observed with an excessive dosage of Nap (higher than 100 mg/L) with a decrease of methane production (37.16) with 2000 mg/L Nap. Interestingly, the concentrations of the polysaccharide and protein reached the highest at 138.76 mg/L and 400.41 mg/L, respectively, in 1000 mg/L Nap. Furthermore, the high activities of hydrolase and transmembrane ATPase were acquired in 30 mg/L Nap. In addition, Nap significantly affected the methanogenic microbial abundance and diversity, especially diminishing Methanolinea and Syntrophobacter. Furthermore, the enrichment of Bacteroides in 30 mg/L Nap showed moderate Nap could facilitate hydrolysis. The genes relevant to cellular processes were activated by Nap. This research provided a reliable basis for the anaerobic microbial response under Nap stress.

1. Introduction

Polycyclic aromatic hydrocarbons (PAHs) are new prevalent organic pollutants resulting from the development of the modern petroleum industry [1,2]. Among the components of crude oil, PAHs are recalcitrant hydrophobic pollutants, which possess carcinogenic, as well as cumulative, characteristics and seriously threaten human health and ecosystem security [3]. In actual petroleum-contaminated environments, most PAHs eventually transfer to deep soil layers, groundwater, or swamp bottoms, where aerobic microorganisms can hardly survive [4]. Deep soil is the storage place for organic compounds, where anaerobic microorganisms use the complex organic compounds for anaerobic digestion (AD) [5]. Therefore, it is an important concept to explore the effects of PAHs on microorganisms under anaerobic conditions.
In recent years, naphthalene (Nap), one of PAH, has drawn considerable concerns as a potential carcinogen due to its high-water solubility and high volatility [6,7]. Nap had a positive effect on denitrification, while phosphorus was inhibited [8]. Additionally, Verrhiest et al. [9] assessed the toxicity of PAH mixtures at the level of a microbe in natural freshwater sediments. The activity of β-glucosidase was increased, while the leucine-aminopeptidase activity was decreased at 300 mg/kg PAH [9]. Research has shown that PAHs generate large amounts of reactive oxygen species during their transformation in organisms. Electrophilic intermediates are produced during the degradation of PAHs by cell oxygenase, which can cause lipid peroxidation, destroy the structure and composition of the cell membrane, and cause DNA oxidative damage [10]. These intermediates can also change the conformation of protein molecules, reduce the enzyme activity and repair efficiency of damaged DNA, and induce apoptosis [11,12]. However, there is little research about the effects of Nap on microbial activity and physiological indicators during AD, especially the extracellular polymeric substances (EPS), and the key enzyme activities of anaerobic microbes in response to NAP also need to be studied systematically.
This study aimed to explore the physiological indicators and metabolic function response of mixed anaerobic sludge at different Nap concentrations. Physiological indicators, including EPS and amylase, as well as ATPases, were extracted for analysis. The microbial community changes and function prediction were analyzed by high-throughput sequencing technology.

2. Materials and Methods

2.1. Experimental Design and Procedures

The batch experiments were conducted in serum bottles with 100 mL work volume at 35 °C, 120 rpm/min. The detailed experimental design is listed in Table 1. Firstly, use acetone as the solvent to prepare a high-concentration naphthalene solution (3, 10, 30, 100, and 200 g/L). Then, 1 mL of high-concentration naphthalene solution was added in serum bottles and vaporized to dryness in a fume hood. Next, the medium and sludge were added in turn. All the group were flushed with pure nitrogen to ensure an anaerobic environment. According to the gas production, the mud–water mixture was extracted from the vials for analysis at 45.5, 69.5, 99, and 142.5 h, respectively. The basal medium consisted of 1.0 g/L MgCl2, 2.0 g/L KH2PO4, 2.0 g/L K2HPO4•3H2O, 1.0 g/L CaCl2, and 5.0 g/L KCl. The bottle in which only the inoculum and starch were added was set as the control group.

2.2. Chemical Analysis

Total solids (TS), volatile solid (VS), pH, and chemical oxygen demand (COD) were measured according to the Standard Methods [13]. The biomethane content was measured by saturated NaOH solution to capture CO2. The concentration of volatile fatty acids (VFAs) was analyzed by High-Performance Liquid Chromatography (Shimadzu LC-2030).
The three-dimensional excitation–emission matrix (EEM) was described in our previous method reported [14]. The zeta potential of the sludge–water mixture was measured by the microelectrophoresis instrument (Shanghai Zhongchen JS94H) at 142.5 h to analyze the variances of sludge physical properties. A glass cuvette with a specification of 0.5 cm thickness was used, and about 1 mL of sample was added each time. Na+ K+- ATPase and Ca2+ Mg2+- ATPase were tested using enzyme activity kits (Nanjing Jiancheng Bioengineering Institute), respectively.

2.3. Data Analysis

The performance of biogas and biomethane-producing were simulated by the modified Gompertz fitting equation, which can be expressed as follows in Equation (1):
P t = P 0 × exp exp K max 2.73 A t P + 1
where P is the accumulated gas (biogas/biomethane) production at time t, mL/gVSadd; P0 is the maximum gas production potential, mL/gVS; Kmax is the maximum production rate of gas, mL/(gVS·h); A is the lag phase, h; t is the response time, h; and e is the constant.
The efficiencies of hydrolysis, acidogenesis, acetogenesis, and methanogenesis during AD were calculated based on the COD.
Hydrolysis = SCOD + COD CH 4 TCOD × 100 %
Acidogenesis = COD VFA + COD CH 4 TCOD × 100 %
Acetogenesis = COD acetate + COD CH 4 TCOD × 100 %
Methanogenesis = COD CH 4 TCOD × 100 %
where soluble chemical oxygen demand (SCOD) is the COD of digestate after filtering with a 0.45 μm filter; CODCH4 was calculated based on the principle of 350 mL CH4/gCOD under the standard conditions; and CODVFA and were obtained by converting VFA and acetate to COD, according to the theoretical calculations.

2.4. EPS Extraction and Analysis

EPS was extracted using the heat method as in our previous study [14]. The PN concentration in EPS was measured by the BCA Protein Assay Kit (Nanjing Jiancheng Bioengineering Institute A045-4). The concentration was determined by a UV spectrophotometer. The PS in EPS was determined by a UV spectrophotometer, according to the phenol-sulfuric acid method standard (details in the Supplementary Materials).

2.5. Molecular Docking

Molecular Operating Environment (MOE) software (Version 2009, Chemical Computing Group Inc., 910-1010 Sherbrooke St. W. Montreal, QC H3A 2R7, Canada) was used to predict the interaction between Nap and enzymes. The enzymes were downloaded from the Protein Data Bank. The crystal structure of the enzymes, the constitutional formula of Nap, and the parameter settings were referred to in [15].

2.6. Sequencing and Function Prediction

The sludge samples of N0, N1, N3, and N4 were collected. The modified forward primer 5′-CTACGGRRBGCASCAGKVRVGAAT-3′ and the revise primer 3′-GGACTACNVGGGTWTCTAATCC-5′ targeting the V3–V4 region were selected for modified sequencing. The metabolic functions prediction was performed by the Tax4Fun2 package and Kyoto Encyclopedia of Genes and Genomes (KEGG) [16].

3. Results and Discussion

3.1. Influences of Nap on Biogas

As shown in Figure 1b, the production of CH4 decreased with the Nap was added, except for N1 and N2. The biomethane yields of N1 and N2 were 181.99 and 161.50 mL/gVS, which were 18.54% and 5.20% higher than N0. However, the biomethane yields were reduced by 12.35%, 35.91%, and 37.16% in N3, N4, and N5 with high Nap concentrations. In addition, lower concentration of Nap (30 mg/L) could be utilized as the carbon source, which resulted in the biogas production rate curve with a second peak [17]. With the Nap concentration increased, the rate of biogas production decreased rapidly, and the second peak in the biogas production rate curve disappeared. On the face of it, the Nap (higher than 100 mg/L) would severely inhibit biogas production rather than act as a carbon source to promote AD.
The simulation results for the P0, Kmax, and A were listed in Table 2. The values of the root mean square error (1.07–5.40), normalized root mean square error (0.01–0.05), and Akaike information criterion (AIC) (4.76–53.23) were calculated, verifying the applicability of the Gompertz model to the data obtained from gas production. N1 had the maximum Po (129.14 mL/gVS), while the minimum (77.59 mg/gVS) appeared in N4. The methanogenic activity of the microbial was inhibited to different degrees with the Nap concentration increasing.
According to Table 2 a low concentration of Nap (less than 300 mg/L) significantly increased the Kmax. The Kmax values of N3, N4, and N5 decreased by 24.67%, 55.33%, and 46.00% from the control, respectively. In addition, N1 also had the shortest lag phase, which was reduced by 3.96% compared to the N0 Table 2). In combination with Figure 1d, N1 reached the maximum methanogenic rate of 3.28 mL/(gVS·h) at the earliest time (45.5 h). However, excess Nap inhibited the AD, which caused the value of A in N5 to be 56.37 h, 125.57% longer than the control, and almost no biomethane was produced at the beginning of digestion.
The significant enhancement may be caused by the microbial community consuming the appropriate amount of Nap for cell growth [17]. With the increase of the Nap concentration, the anaerobic sludge activity was inhibited, which resulted from the high concentrations of Nap induced the accumulation of toxic metabolites in the system [18]. Similar phenomena were also reported that PAHs could conduce to the growth of microorganisms [9]. However, the opposite effect was observed that Nap above 56 mg/L inhibited Pseudomonas aeruginosa seriously [19].
In summary, it was found that Nap promoted microbial methanogenic activity at less than 300 mg/L. The most significant promotion effect was observed at 30 mg/L, with an 18.54% and 13.33% increase in biomethane yield and production efficiency compared to the control group. However, the inhibitory effect of Nap on methanogenic activity increased significantly with the Nap concentration higher than 100 mg/L. With 2000 mg/L Nap, the biomethane yield and production efficiency decreased by 37.16% and 46.00% compared to the control group. Moreover, the asynchrony of the maximum biogas and biomethane production rate also proved that Nap had different effects on the four phases of AD.

3.2. Influences of Nap on AD Performance

3.2.1. Changes of DOM Components

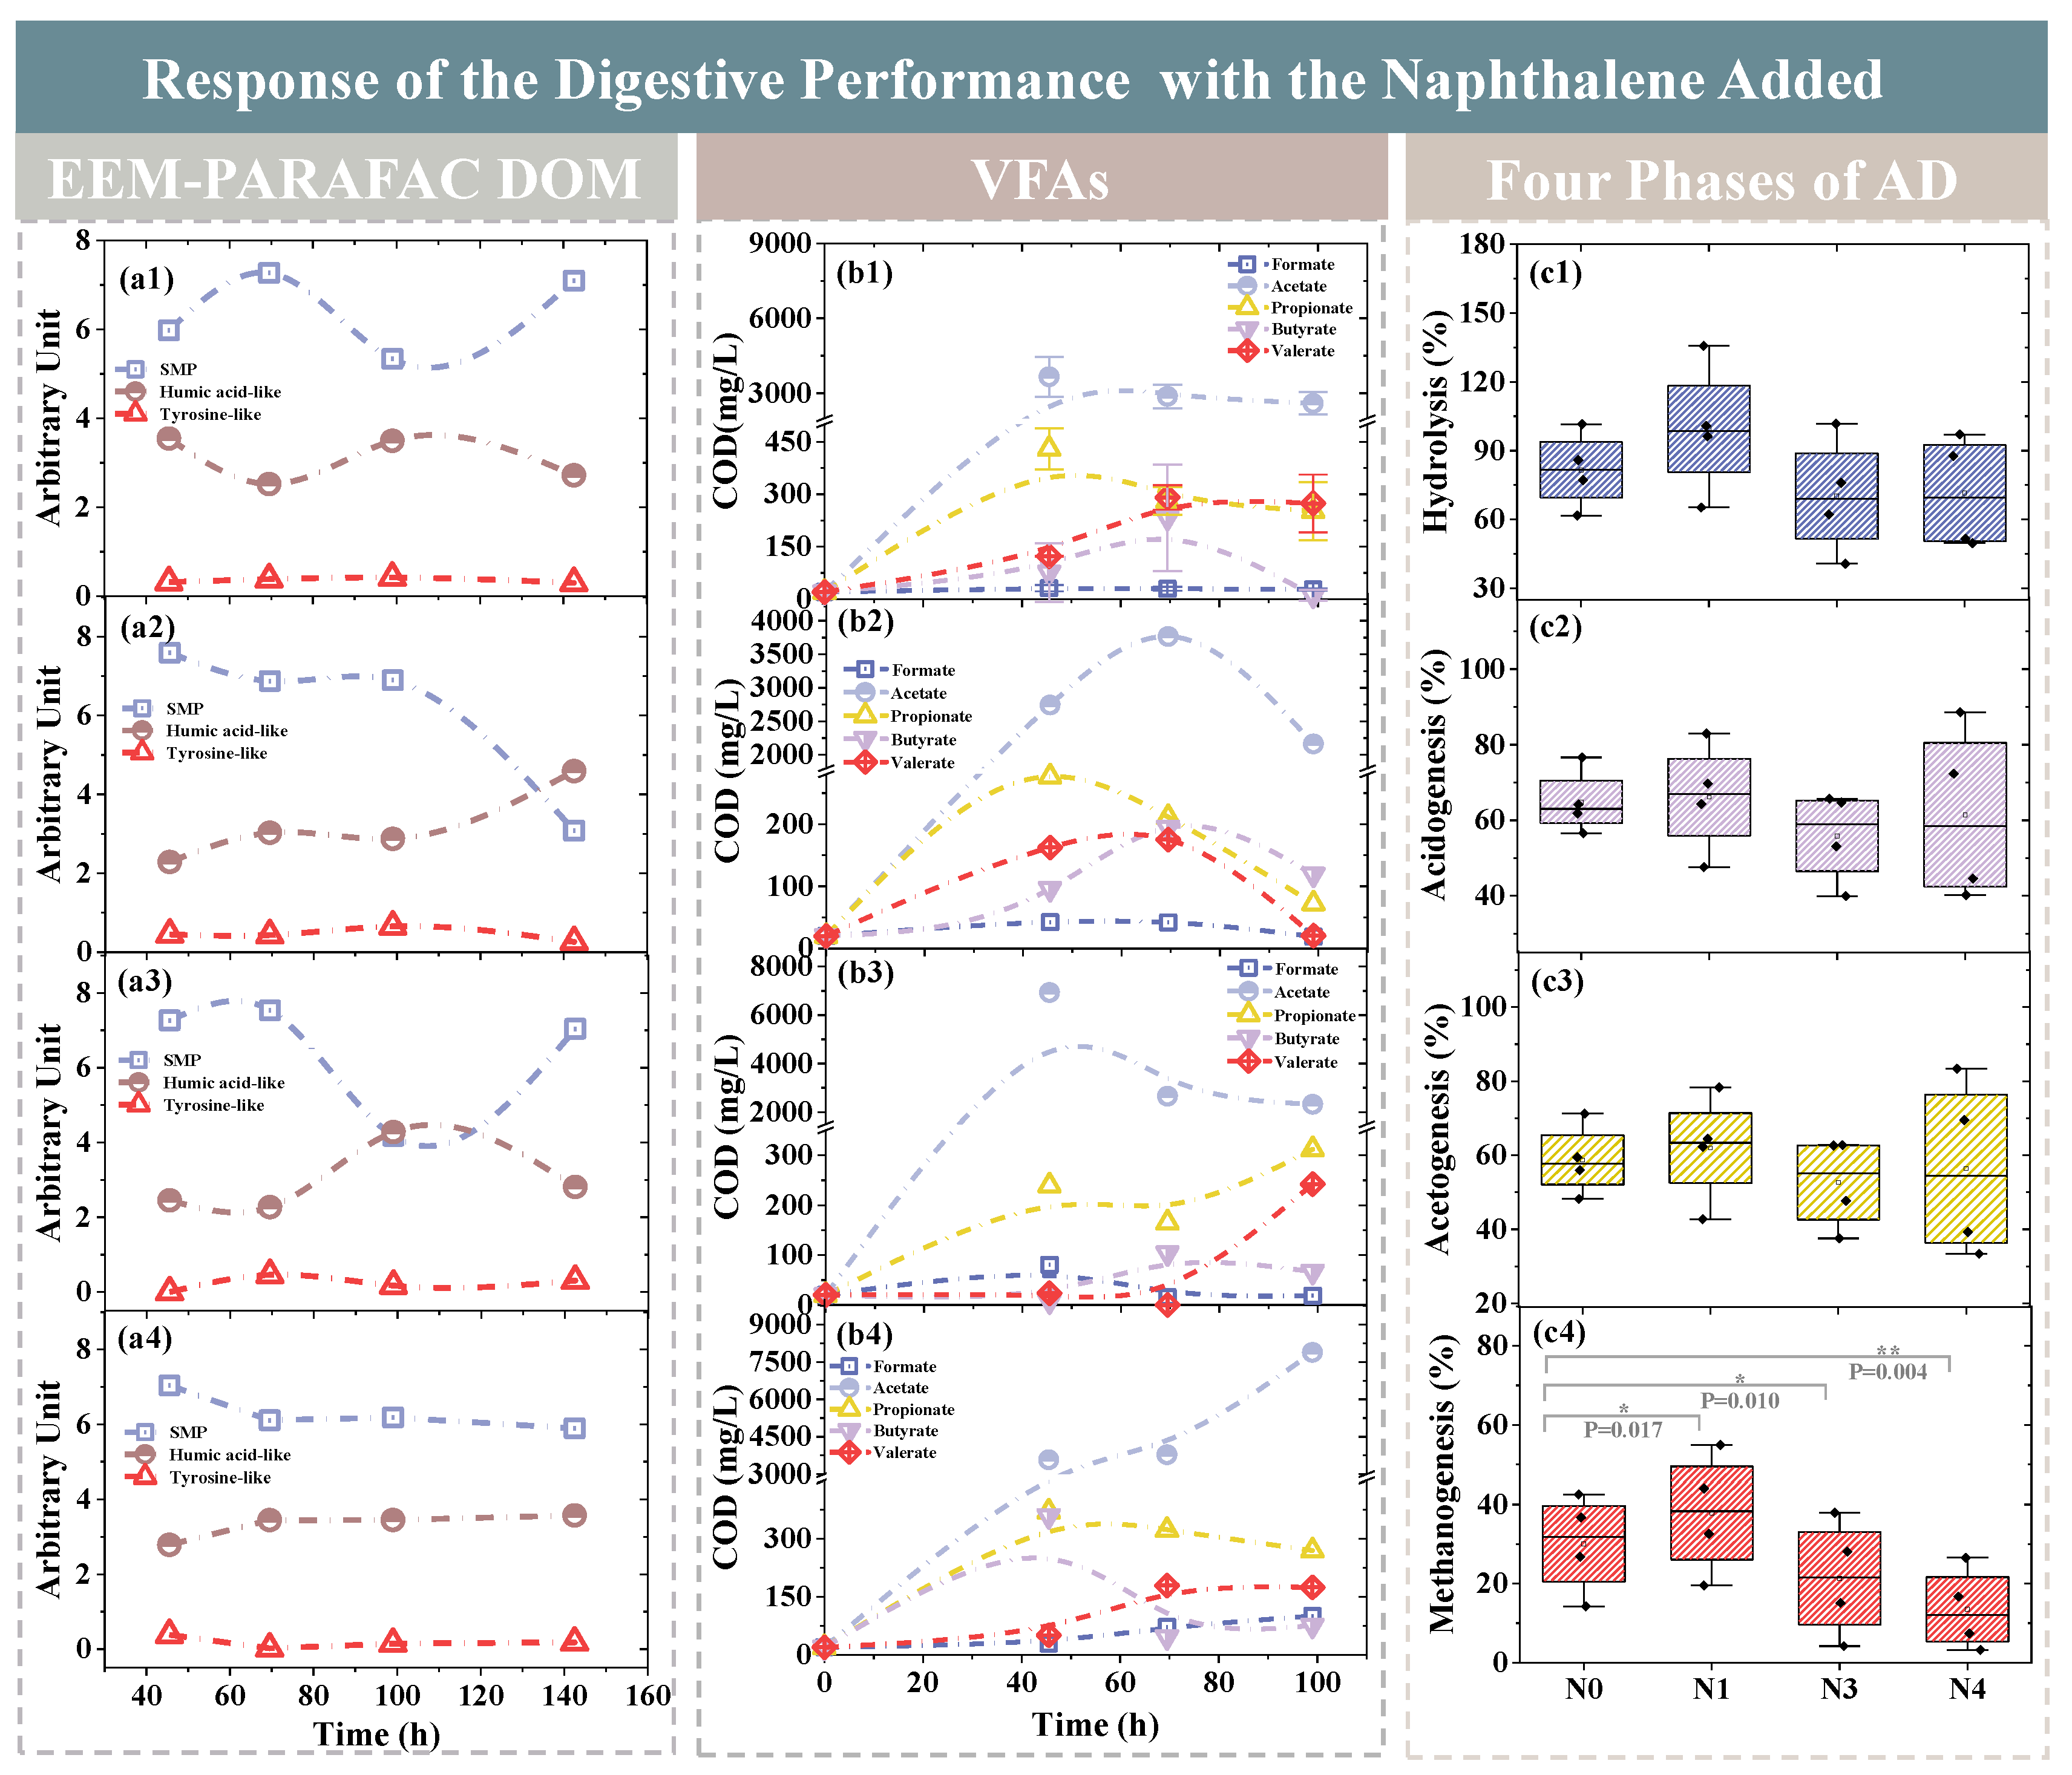
DOM include carbohydrates, humic substances, hydrophilic acids, proteins, etc., which are closely related to the microbial metabolism [20]. The results of the typical EEM-PARAFAC are shown in Figure 2a. On the time series, the concentration of soluble microbial metabolites (SMP) increased by 21.59% and 3.67% at 69.5 h compared to 45.5 h for N0 and N3, with the rapid production of soluble metabolites from easily degradable organic matter (Figure 2(a1, a3)). The SMP fluorescence intensity of N0 and N3 decreased to 5.34 AU (arbitrary unit) and 4.18 AU at 99.5 h, respectively. However, the fluorescence intensity of SMP in N1 kept weakening and diminished to 3.08 AU by 145.5 h (Figure 2(a2)). Additionally, the tyrosine-like component showed the same decreasing trend. These results indicated that 30 mg/L Nap exhibited the best impact on the metabolic capacity of microorganisms with the maximum utilization of the substrate. In addition, SMP in N4 maintained a stable strong fluorescence density with about 6.30 AU, as shown in Figure 2(a4). The abundant SMP in N4 was mainly converted from extracellular polysaccharides produced by cell lysis [21].
Particularly, humic acid-like (HA), the nonbiodegradable compounds, remained at a high level (average 3.32 AU) at a high concentration of Nap (1000 mg/L) in N4 compared with the other groups. As a typical electron acceptor in AD, HA can steal electrons from acetic acid and further hinder methanogenesis [22]. This was one of the reasons why a high concentration of Nap (1000 mg/L) in N4 inhibited biomethane production.

3.2.2. Variations of VFA

Figure 2b shows the variation of VFAs for N0, N1, N3, and N4. Except for N4, the content of the total VFAs increased and then decreased with the treatment time in all groups. In the first 45 h, the sample carbon source was hydrolyzed and acidified. The accumulation of VFA indicated that hydrolytic and acidified bacteria adapt to the environment better than methanogens [23]. The acetate accounted for the vast majority of total VFAs with a relatively stable accumulation (3765.67 mg/L) in N1 until 69.5 h due to the high efficiency of acetogenesis (Figure 2(c3)) and subsequently rapid declined synchronization with the rapid production of biomethane. In contrast, a maximum value close to 8000 mg/L of acetate was observed in N4, indicating that excess Nap was significantly beneficial to acidogenesis up to 88.58% but inhibited the methanogenesis efficiency with 13.49%, leading to acetate accumulation.
In AD, propionate degradation by syntrophic acetogenic bacteria was recognized as the thermodynamical challenge due to higher Gibbs-free energy [24]. Additionally, the excessive propionate accumulation might inhibit subsequent processes of AD. The concentration of propionate in N1 decreased to 72.52 mg/L at 99.0 h. Meanwhile, the efficiency of acetogenesis in N1 reached the maximum of 61.95% in Figure 2(c3). It indicated that the moderate Nap facilitated propionate to be converted to acetate fully, resulting in a high methanogenesis efficiency with 37.79%. Nevertheless, the propionate contents of N3 and N4 reached 312.31 mg/L and 269.92 mg/L at 99.0 h. These results illustrated that excess Nap hindered the syntrophic bacteria from interacting with methanogens to oxidize propionate. Furthermore, the acetogenesis of N3 and N4 declined by 10.35% and 3.99%, respectively. The maximum value of acidogenesis efficiency in N4 reached 88.58% due to the accumulation of SMP, and the methanogenesis could be further inhibited [25].

3.2.3. Changes of SCOD

As shown in Figure S1, N0 and N1 had the highest SCOD content at 45.5 h, and N1 was 33.06% higher than N0. The microorganisms were in the stabilization phase with strong activity, and the methanogenic rate of N0 and N1 also increased significantly in this phase (Figure 1d). In addition, the hydrolysis efficiency also obtained a maximum value of 99.49% in N1, which was 21.93% higher than N0. It was proven that 30 mg/L Nap could enrich the hydrolytic bacteria to promote the hydrolysis of starch, as follows in the discussion in Section 3.5 and Section 3.6, respectively. During the first 99 h of digestion, along with microorganisms degrading soluble organic substances to synthesize substances available to them, the content of SCOD in N0 and N1 gradually decreased to the minimums at 2951.67 and 2501.67 mg/L, respectively. However, the hydrolysis was inhibited after the excessive Nap was added. At the end of the experiment, N4 had the highest SCOD level of 7235.00 mg/L, which was 1.41 times higher than the N0. There are two possible reasons for the low SCOD removal result: firstly, excess Nap (1000 mg/L) potentially inhibited the activity of microorganisms capable of degrading organic matters. Secondly, microorganisms were lysed and inactivated, caused by excess Nap with the cellular contents flowing out (confirmed in Section 3.4), which contributed to the SCOD.

3.3. Effects of Nap on Zeta Potential of Sludge Particles

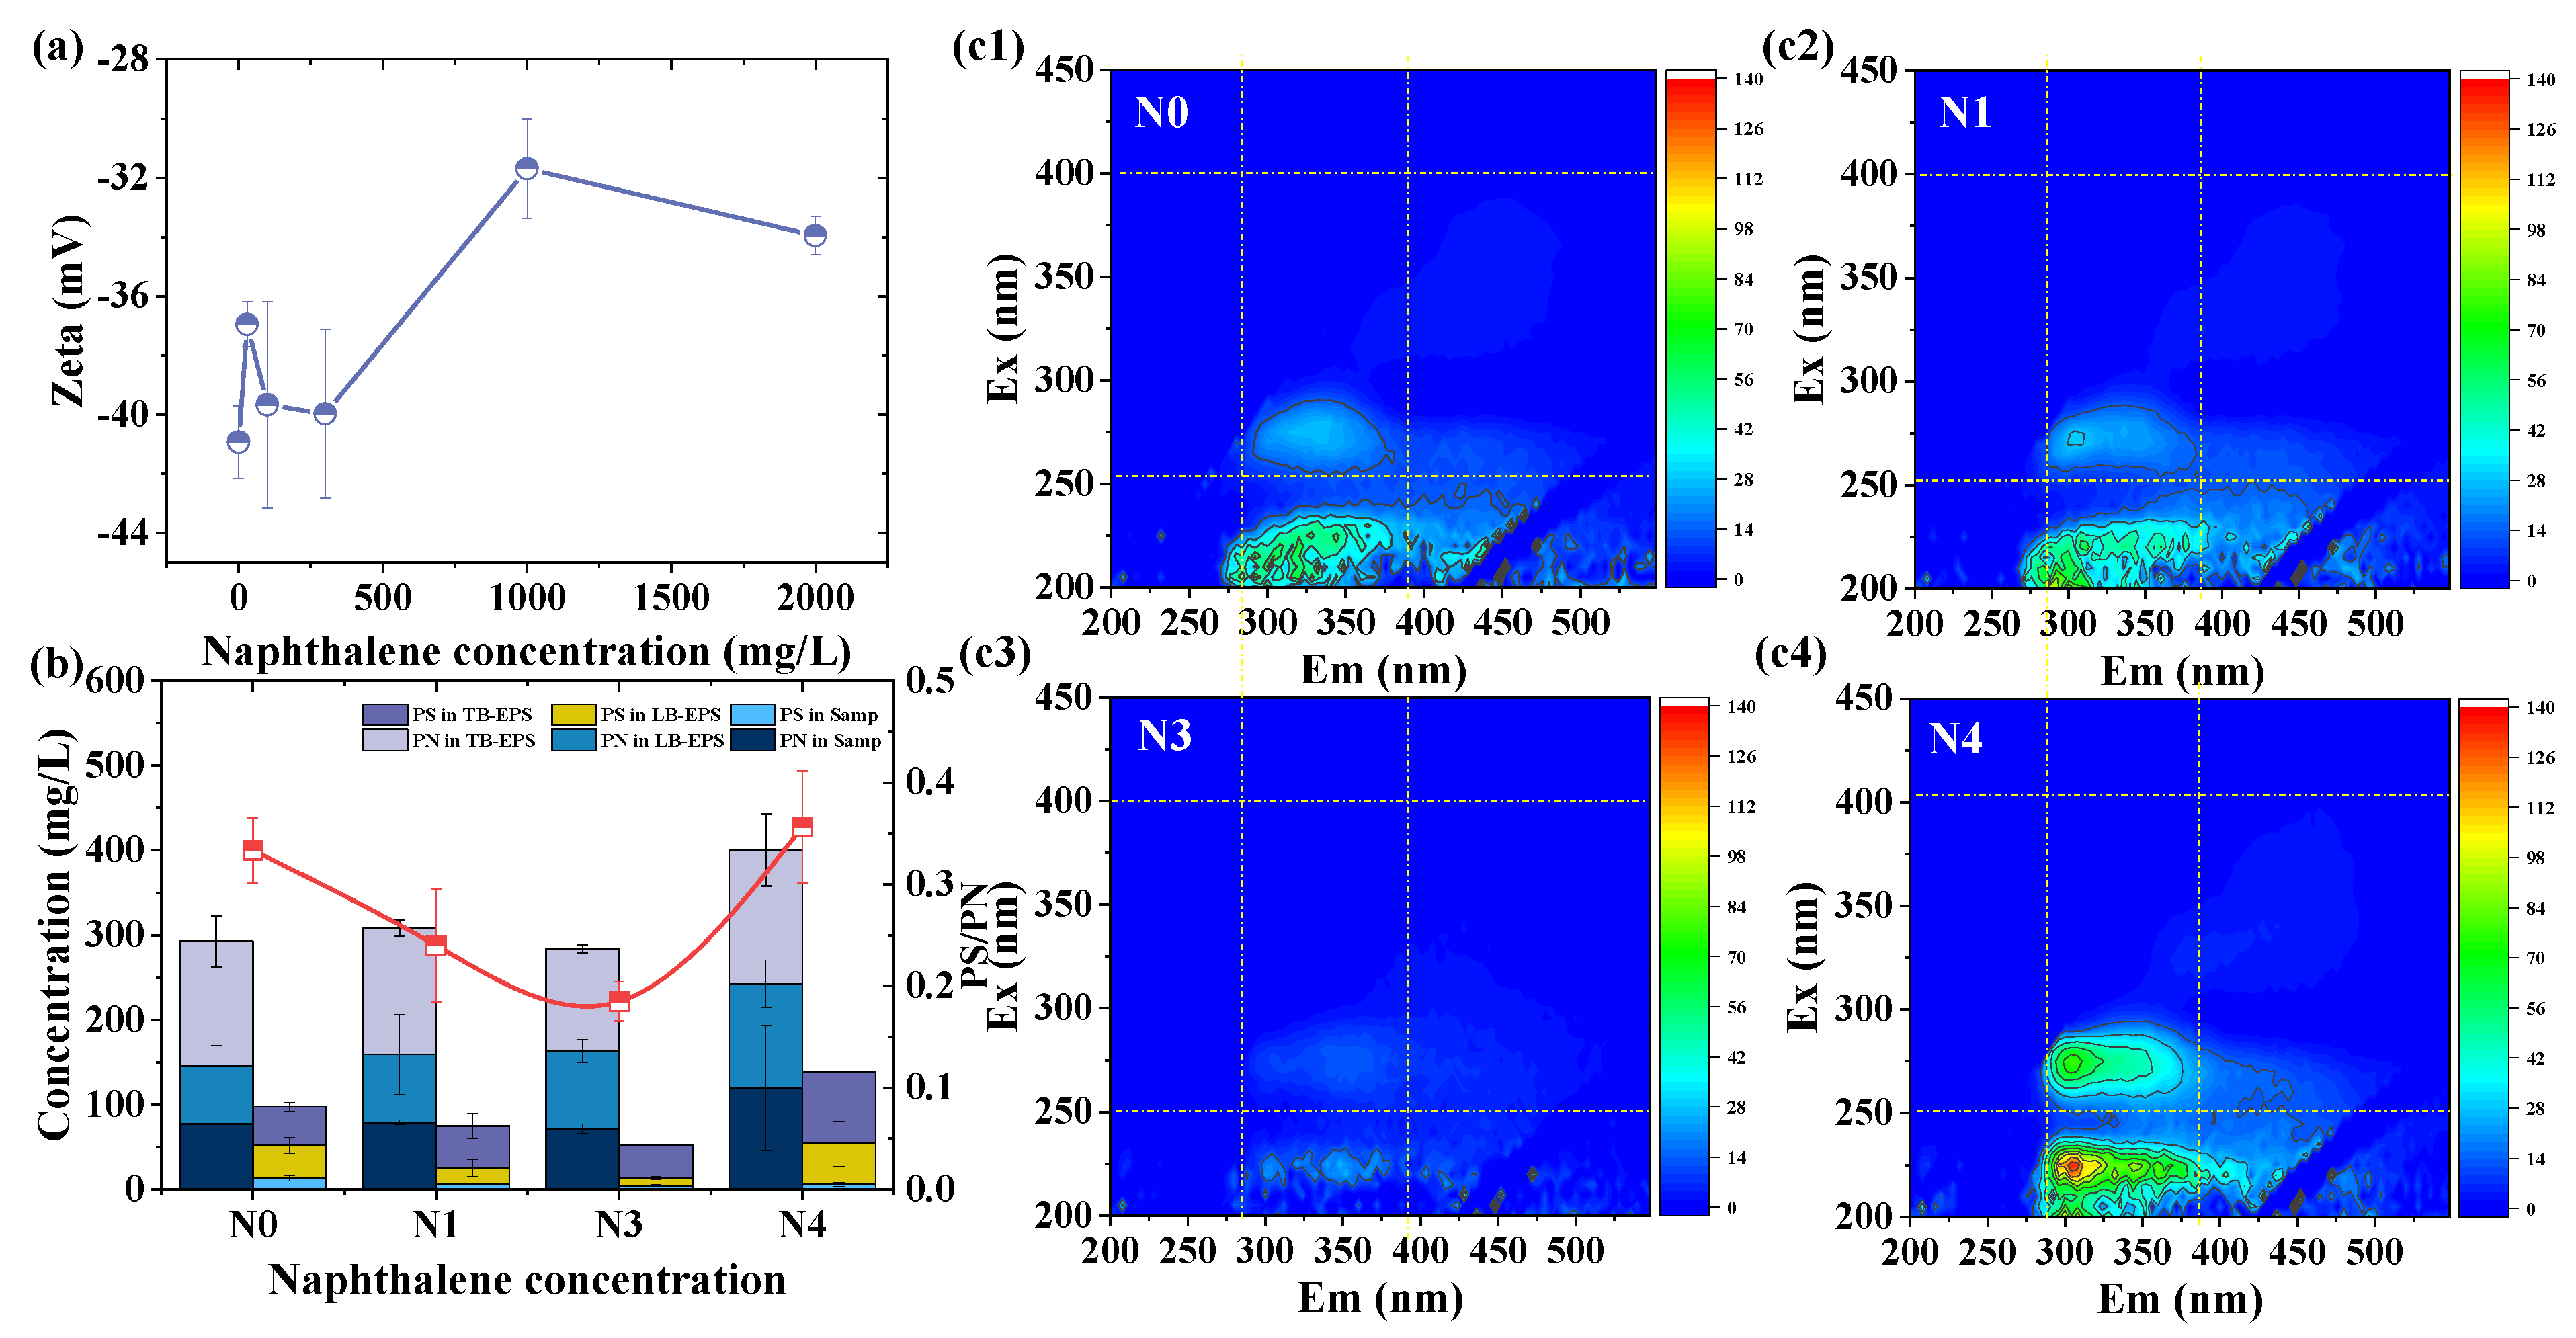
The results of the measured variation of the zeta potential with Nap dose are shown in Figure 3a. The magnitude of the zeta potential reflected the potential stability of the system and the macroscopic adsorption of Nap by microorganisms. The zeta potential values of all the reaction systems ranged from -30 mV to −42 mV, indicating that the systems tended to be stable, and the sludge particles were well-dispersed [26]. The zeta potential values were all negative, which was caused by the negatively charged carboxyl, phosphoryl, and hydroxyl groups on the surface of the bacteria. Ionization of anionic groups in EPS has been reported to be responsible for its surface electronegativity [27]. The N0, N2, and N3 systems had the lowest surface potential of about −40 mV, followed by the N1 with about −36 mV, and the highest was N4 with −31.70 mV. Due to the electrophilic nature of Nap, a more negative surface charge was more likely to occur during adsorption, so the surface of microbial cells in N0, N2, and N3 were more likely to attach Nap.

3.4. Effects of Nap on EPS Production and Composition

EPS are secreted by microorganisms, which contain PS, PN, lipids, and various heteropolymers [28]. The variations of the PN contents, PS contents, and PS/PN of each layer of the EPS at different Nap concentrations are shown in Figure 3b. EPS is not only involved in the microbial metabolism as an extracellular electron acceptor but also serves as a barrier to protect cells from damage by toxic substances [29]. The total PS and PN concentrations induced at 1000 mg/L Nap were 138.76 mg/L and 400.41 mg/L, respectively, and the values were higher than those of the other groups, which could adequately illustrate Nap toxicity on anaerobic microorganisms. This phenomenon was also found in the partial nitrification process of CuO nanoparticle treatment by [28]. There are two possible reasons for this result. Firstly, the microbes secreted more PS and PN in response to the high concentration of Nap. Secondly, the high enrichment of lipophilic Nap led to swelling and cleavage of the cell membrane, disrupting the ion gradient concentration, and eventually led to cell lysis and the release of organic matter, which increased the PN and PS of EPS [30,31]. Li et al. [32] stated that PS would form complex networks, which might inhibit the efficiency of the mass transfer. Although the concentrations of PN and PS both increased under 1000 mg/L Nap, the PN and PS had different responses to Nap. The concentration of PN in the SAMP, LB-EPS, and TB-EPS all increased, while PS increased in the LB-EPS and TB-EPS. It could be inferred that PS became more compact to protect the microbe against Nap toxicity.
Tay et al. [33] mentioned that the higher the PS content in EPS, the more hydrophilic the microorganisms are, which, in turn, leads to sludge foaming and caking phenomena. Moreover, Liu et al. [34] showed that, as the sludge granulation and aggregation enhanced, the PN concentration increased accordingly. PS/PN can be applied as the index of sludge granulation. During the experiment, the best sludge settling property was found in N3 and the worst in N4, which coincided with the results that PS/PN was only 0.18 in N3 and up to 0.36 in N4.
The results of EEM were compared with [35] to analyze the effect of the Nap concentration gradients on the cell surface material. The control group showed two distinct peaks for SMP and HA. The abundance of SMP, tyrosine-like, and tryptophan-like in N3 decreased by 21.65%, 38.58%, and 60.55%, respectively, compared to N0 (Figure S2). However, N4 showed significant fluorescence peaks in regions I, III, and IV with volume integral values of 1.76, 3.09, and 1.73 times higher than N0. This is because low concentrations of Nap facilitated the full utilization of PN by microorganisms, but with the concentration of Nap reaching 1000 mg/L, PN could not be effectively utilized, and the system was accompanied by cell lysis leading to the enhancement of both peaks ultimately. In addition, high concentrations of Nap (1000 mg/L) resulted in the rupture of cell membranes and the efflux of cell contents including PN, which led to a significant enhancement of those fluorescence peaks.

3.5. Effects of Nap on the Activity of Key Enzymes

When the starch is the carbon source, amylase as a hydrolase can accelerate the production of reducing sugars and oligosaccharides. N1 had the highest amylase activity of 1.35 mg/g, which suggested that 30 mg/L Nap could increase the amylase activity and promote the conversion of substrate. Consequently, the metabolic rate of methanogens was elevated, and the methane yield was increased. It has been reported that amylase hydrolysis produced more sugars to facilitate single fermentation for methane production [36]. Moreover, starch is also a major chemical component in biofilm formation, and the process of biofilm breakdown requires the participation of amylase [37,38]. In Section 3.4, it was demonstrated that there was a general cell membrane rupture in N4. This was why the hydrolysis efficiency of N0, N3, and N4 was similar, but the amylase activity in N4 was the highest among the three at 1.08 mg/g.
To reveal the stress feedback of ATPase in the anaerobic microorganisms to Nap stress and the effect of Nap concentrations on the hydrolytic enzyme, the ATPase and amylase activities were explored at 142.5 h (Figure 4a). Overall, the addition of Nap resulted in different degrees of enhancement of ATPase activity. Fan et al. [39] found that when the toxic substances acted on Ralstonia solanacearum, the bacteria regained their growth via stress responses such as elevated Na+K+-ATPase activity. The Na+K+-ATPase activities of N1, N3, and N4 were 1.15, 2.36, and 2.09 times higher than those of the control group, indicating that Nap had the least stress on microorganisms in N1, and the microorganisms responded most strongly to N3 (300 mg/L Nap).
Moreover, the Ca2+Mg2+-ATPase activity in N4 was the lowest among the experimental groups, only 1.18 times higher than that of the N0, which implied that excess Nap inhibited cell-activating Ca2+Mg2+-ATPase. This thereby inhibited Ca2+ efflux, leading to an increase in the intracellular Ca2+ concentration. This phenomenon was associated with a previous report that the cytoplasmic Ca2+ concentration rises briefly to provoke a cellular response after an external stimulus (PAH), at which time Ca2+Mg2+-ATP on the cytoplasmic membrane expels Ca2+ to maintain its intra-concentration homeostasis [40]. Furthermore, the results obtained coincided with studies reporting that toxic metabolites of Nap accumulated in organisms could induce apoptosis [11,12].
To better understand the interactions mechanisms of Nap and transmembrane channel ATPase, amylase, and three key enzymes of the methanogenic pathway, MOE was used for simulating the special binding sites (Figure 4c). The simulation results showed that Nap was mainly bound to the enzyme active site with π-hydrogen bonding force and had the greatest effect on lysine (Lys) and glycine (Gly). The formation of the π-hydrogen bond can enhance the aromaticity, which makes Nap an inhibitory factor [41].
The specific results of the docking are listed in Table S2. For Ca2+Mg2+-ATPase, Nap interacted with Lys 133 with the highest binding free energy of -2.9 kcal/mol. Additionally, for the amylase interactions, Site 1 contained amino acid residues Phe 14, Thr 15, and Gly 16. Site 2 contained residue Lys 211. Site 3 contained residues Phe 14, Thr 15, and Gly 16. As shown in Figure 4c, the benzene ring of Nap formed four π- hydrogen bonds with amino acid residues at Site 1, which led to significant ligand–bioreceptor interactions and the inhibition of amylase activity in N3 (Figure 4a). Furthermore, compared to F420, Nap attack Lys 55 of acetyl-CoA at a long distance of 4.34 Å. Due to the weak interactions, the effect of Nap on the metabolic activity of acetate was not significant (Figure 4b).

3.6. Microbial Community Variation Responsed to Nap Concentration

3.6.1. Genus Level

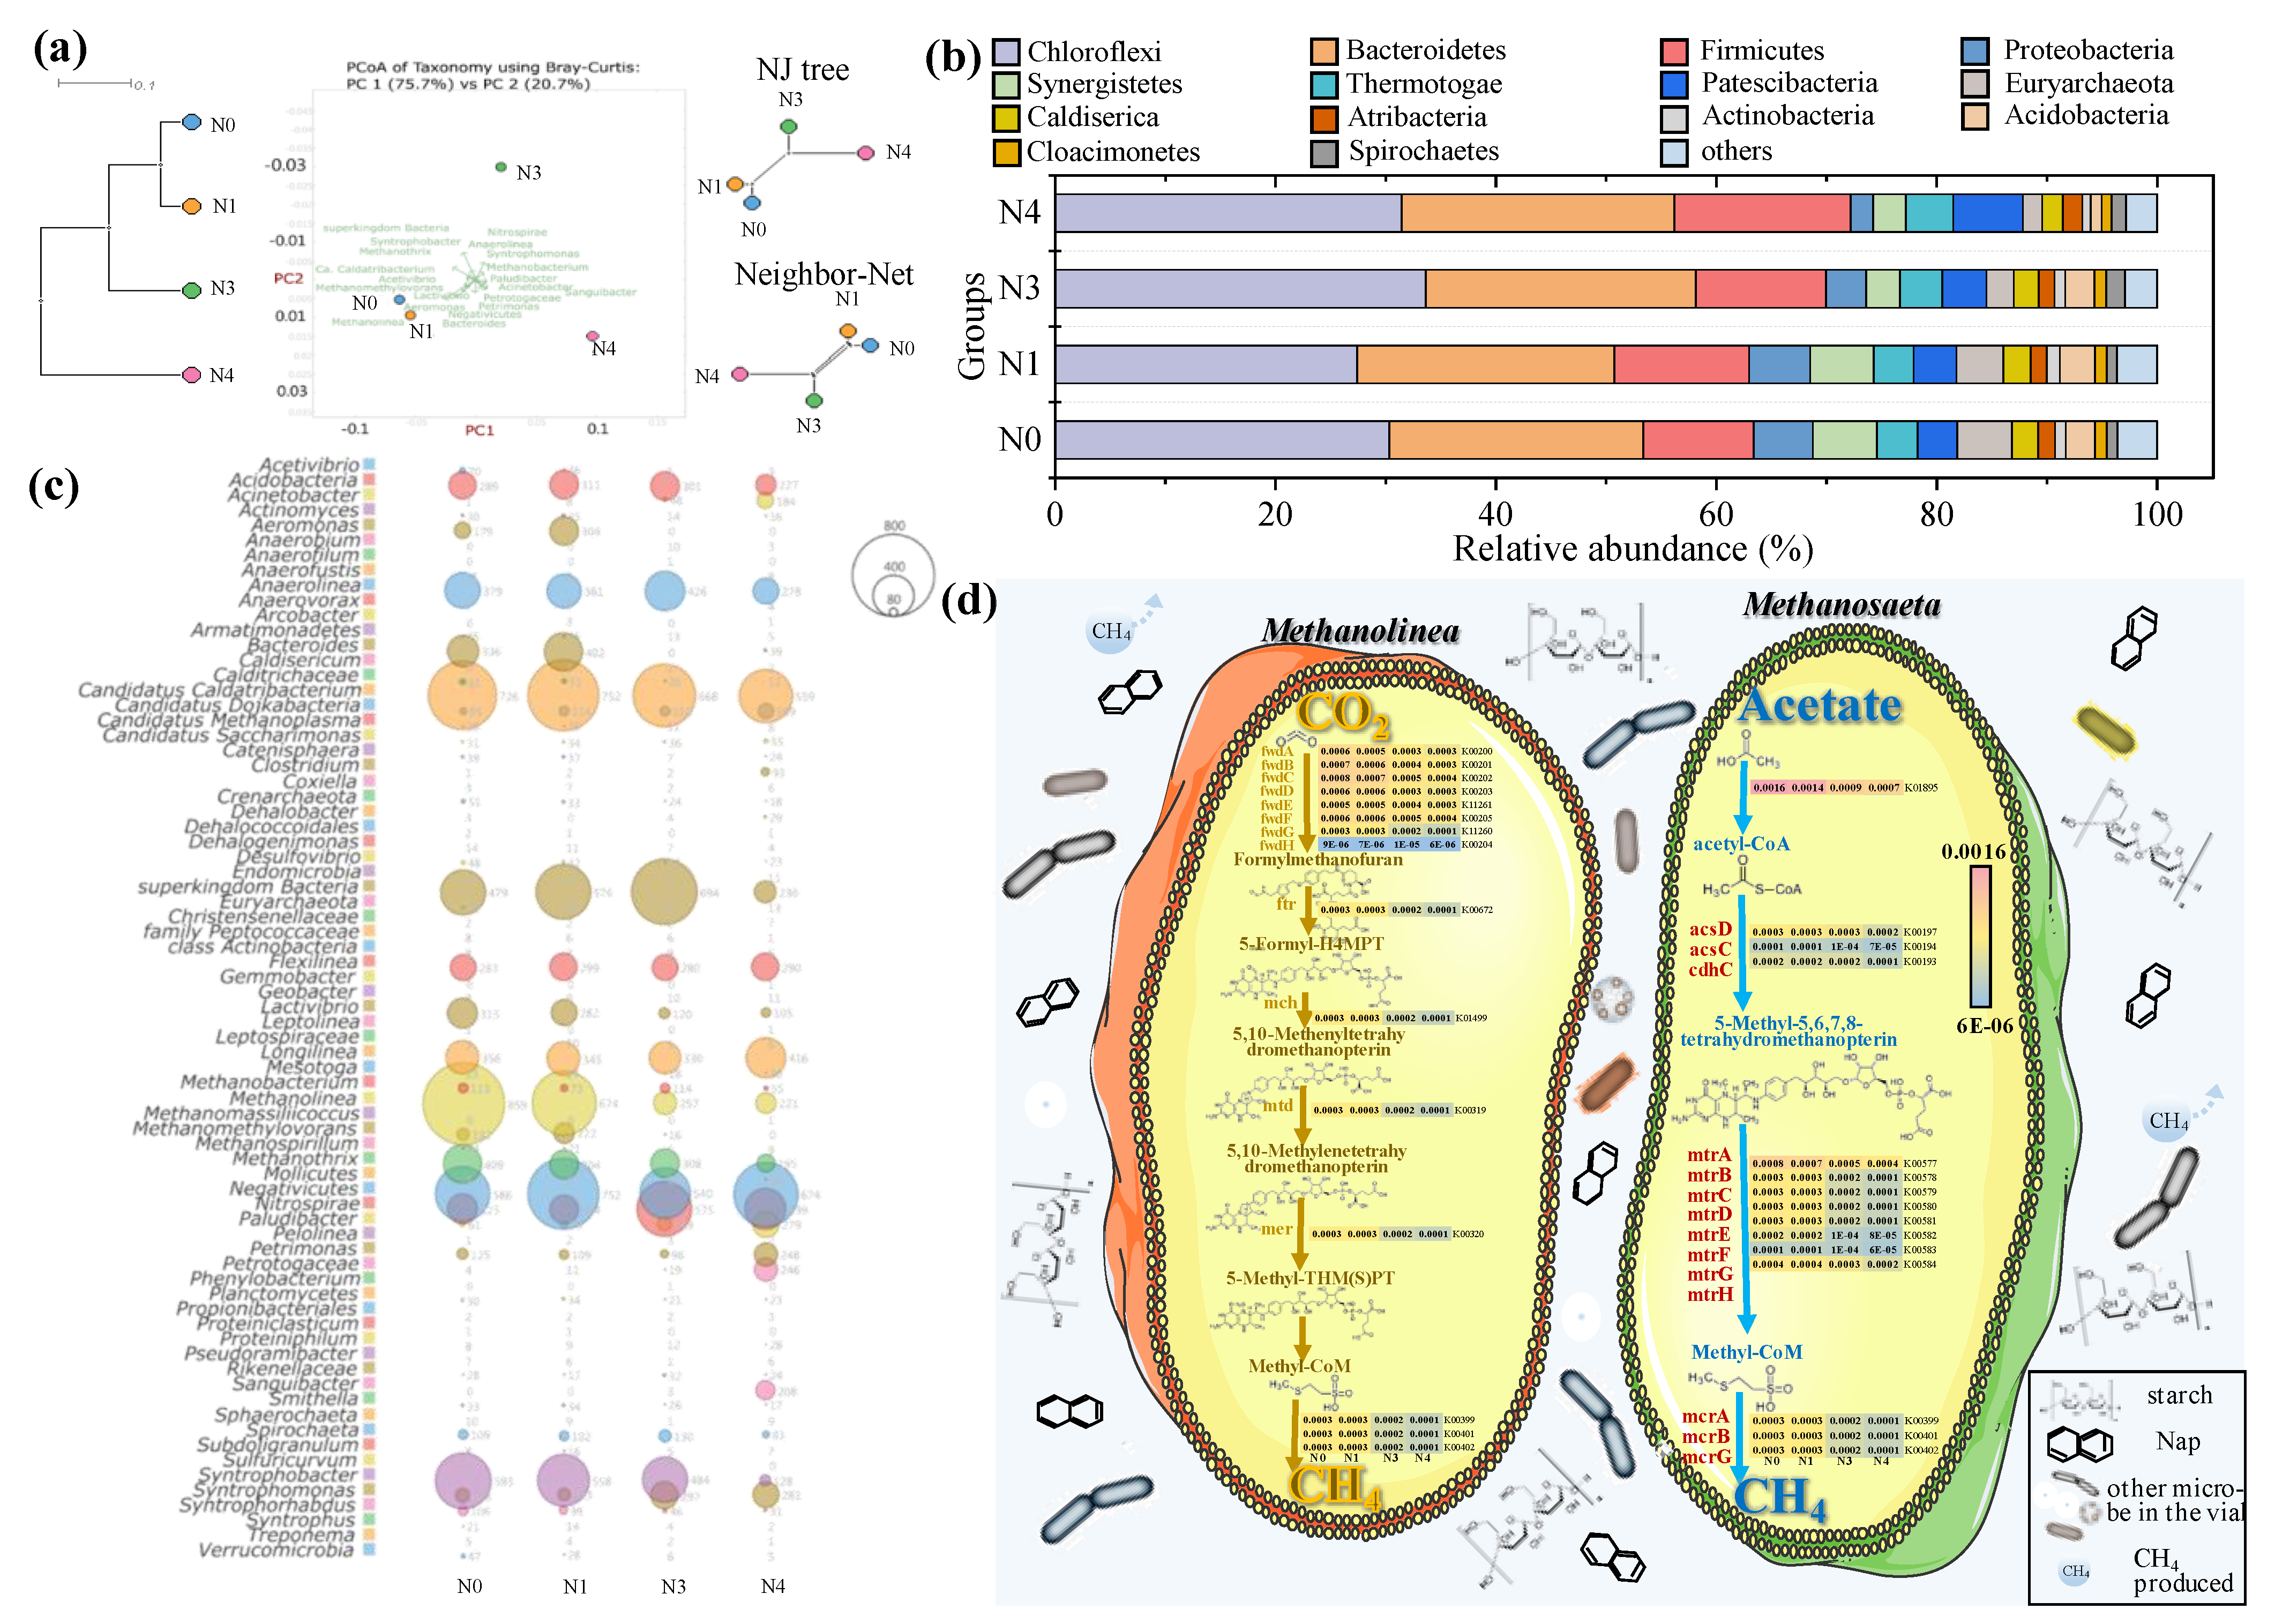
As shown in Figure 5, the dominant phyla were Chloroflexi, Bacteroidetes, Firmicutes, Proteobacteria, Synergistetes, Thermotogae, Patescibacteria, Euryarchaeota, Caldiserica, and Atribacteria. Firmicutes accounted for 16.00% in N4, which was reported as typical acid-forming bacteria in AD [42]. Moreover, the microbial community have a significantly different abundance, as listed in Table S3.
At the genus level, the primary methanogen was hydrogenotrophic Methanolinea with the relative abundance of 11.12% in N0, followed by acetoclastic Methanosaeta (Methanothrix) (5.30%). The authors of [43] also found that Methanosaeta predominates in a medium-temperature reservoir environment. With the increase of Nap, the abundance of Methanolinea and Methanosaeta decreased to 3.60% and 3.18% in N4, which suggested that methanogens were highly sensitive to Nap. The decrease in hydrogenotrophic Methanolinea indicated a deterioration in biomethane production through an interspecific hydrogen transfer. Therefore, the poor performance in N4 might mainly derive from a significant reduction of Methanolinea and Methanosaeta. It has been reported that phosphate in the buffer selectively inhibited the activity of acetoclastic methanogens [44]. Presumably, this was why Methanosaeta was enriched, but the acetate metabolic test was the lowest level of biomethane production of the three activity tests (Figure 4b).
To examine deeply the impacts of Nap on methanogenic pathways, an abundance of potentially functional genes of the dominant methanogens in the system were analyzed in Figure 5d. The genes in both methanogenic pathways decreased with the increasing Nap concentration, except for K00204 (4Fe-4S ferredoxin). The relative abundance of most genes was less than 1 × 10⁻⁴ in N4, which demonstrated the inhibitory effect of Nap on the methanogenic metabolic activity in the hydrogenotrophic and acetoclastic methanogens.
Several functional genera that were significantly enriched upon the addition of a suitable amount of Nap, namely Anaerolinea, Bacteroides, and Candidatus Caldatribacterium. The abundances of Anaerolinea related to sludge aggregation and granulation had the highest abundance with 6.66% in N3 [45]. It is consistent with the sludge aggregation and granulation phenomenon in N3. Bacteroides was heavily enriched in N0 with an abundance of 4.35%, which were recognized for the ability to degrade organic matter into acetic acid [46]. Bacteroides played an important role in providing substrate for acetoclastic methanogens in the N1 with an abundance of 5.23%. In contrast, Bacteroides almost disappeared in N3 and N4 at 0 and 0.64%, indicating that it was unable to adapt to high concentrations of Nap. Candidatus Caldatribacterium was reported to be a group of thermophilic bacteria that produce acetate through glycolysis [47], which maintained a high relative abundance of about 9.69% in all groups with obvious resistance to the stress of excess Nap (1000 mg/L). In addition, Syntrophobacter, which could oxidize propionate via the methyl–malonyl–CoA pathway had a high abundance in N0, N1, and N3 with the values of 7.68%, 7.26%, and 7.57%, respectively.
Moreover, the PCoA of taxonomy by Bray–Curtis showed that components PC1 and PC2 interpreted 75.7% and 20.7% of the data variance at the genus level, respectively (Figure 5a). It was worth noting that the composition of the community was shifted in the anaerobic system with the addition of Nap, with samples of N3 and N4 significantly different from the other samples. This suggested that Nap could reshape the microbial community.

3.6.2. Potential Functions Analysis

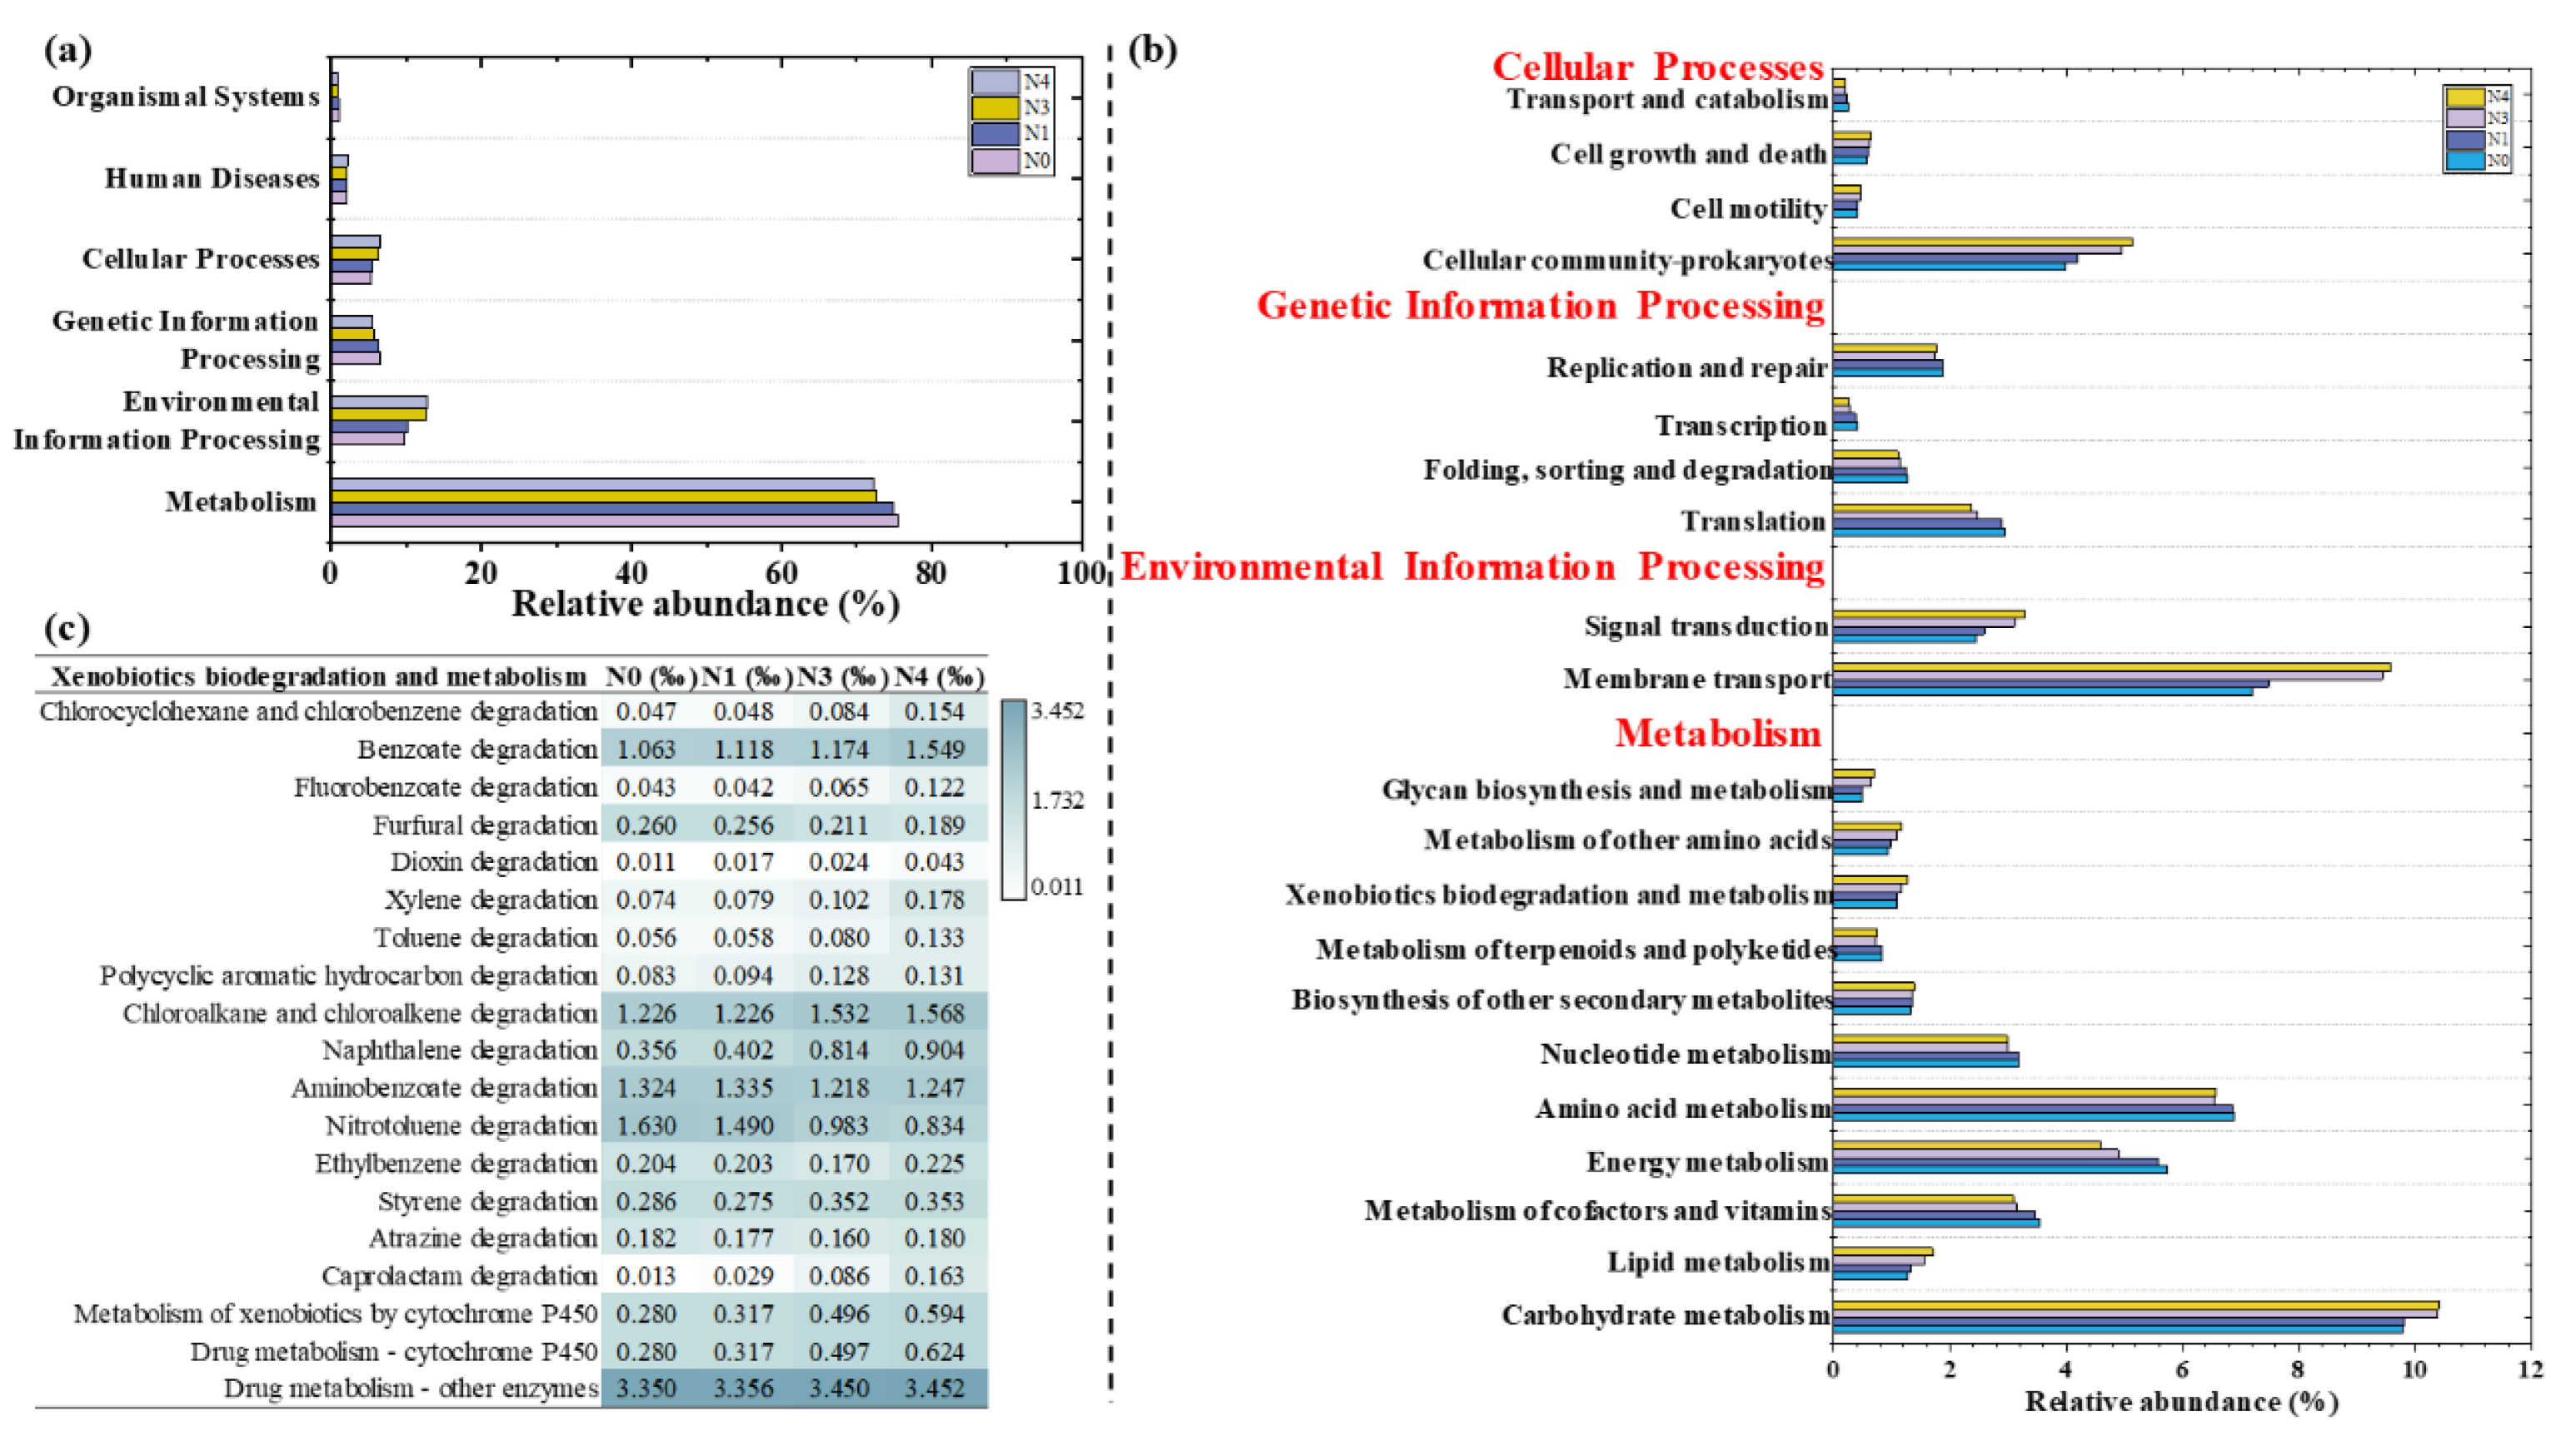
The potential functional pathways of the microbial community in four groups were classified into three levels. The functional pathways related to anaerobic microorganisms were further explored at level 2 (Figure 6b).
Carbohydrate metabolism was the most abundant (9.79–10.41%), which indicated that carbohydrates were the main metabolic substrate as the major carbon source. Furthermore, the abundance of genes related to energy metabolism decreased from 5.73% to 4.59% with the addition of Nap. It showed the negative effect of Nap on energy conversion and transfer during the AD process, which might be responsible for the poor methanogenesis. Additionally, membrane transport in environmental information processing was significantly promoted from 7.21% in N0 to 9.57% in N4, which could explain the marked increase in transmembrane ATPase activity under Nap stress in Figure 4a. On the other hand, alterations in the cell membrane structure and function in N4 (demonstrated in Section 3.4) made the membrane selective permeability weak, leading to enhanced membrane transport. Last, but not least, all the pathways included in genetic information processing were increasingly inhibited with the Nap concentration going up, indicating that Nap blocked the pathway of genetic information processing. The abundance of xenobiotics biodegradation increased with the increasing concentration of Nap. Moreover, the abundances of Nap degradation were 2.29 and 2.54 times higher in N3 and N4 than that in N0. The higher potential functional gene abundance of Nap degradation and other xenobiotics biodegradation pathways in N3 and N4 provided evidence for the enrichment of Nap-disintegrating microorganisms under high Nap stress.

4. Conclusions

This study assessed the dose–effects of Nap on the AD process. A significant improvement of the biomethane yield (181.99 mL/gVS) was achieved in N1 (30 mg/L Nap), and an obvious inhibitory effect was obtained with an excessive concentration (over 100 mg/L). Meanwhile, the optimized dosage of 30 mg/L Nap significantly promoted the hydrolysis and acetogenesis efficiencies. Moreover, the highest ATPase activity in N3 (1.98 U/mg prot for Na+K+-ATPase and 1.68 U/mg prot for Ca2+Mg2+-ATPase) represented the strongest stress responses to maintain the intracellular homeostasis. The lipophilic Nap led to cell lysis at 1000 mg/L, with the total PS and PN concentrations reaching 138.76 mg/L and 400.41 mg/L, respectively. The abundance of Methanolinea and Syntrophobacter decreased greatly with Nap added. Furthermore, the enrichment of Bacteroides in 30 mg/L Nap proved that moderate Nap could facilitate hydrolysis. Furthermore, the addition of Nap mainly inhibited the potential functional genes related to energy metabolism, translation, and metabolism of cofactors and vitamins. The presented research provided a comprehensive discussion for the response of anaerobic microorganisms to Nap from trace to excess.

Supplementary Materials

The following supporting information can be downloaded at: https://www.mdpi.com/article/10.3390/su142416377/s1, Materials and Methods: Figure S1. Changes of SCOD during AD; Figure S2. Volume integral results obtained by the FRI analysis of EPS; Table S1. Composition of inoculum, substrate, and naphthalene; Table S2. MOE docking profiles of ATPase, amylase, F420, acetyl-CoA, and methylmalonyl-CoA; Table S3. The abundance of the microbial community.

Author Contributions

Y.Y.: Writing–Methodology and original draft; J.L.: Methodology and Writing—review and editing; H.X.: Review and editing; Y.L.: Review and editing; J.Q.: Review and editing; J.T.: Review and editing and comments; R.L.: Conceptualization, Review and Editing; and Q.N.: Project administration, Supervision, and Funding acquisition. All authors have read and agreed to the published version of the manuscript.

Funding

The authors’ research is supported by the National Natural Science Foundation of China (Grant No. 51608304 and Grant No. U1806216) and Young Scholars Program of Shandong University. “The Fundamental Research Funds of Shandong University” and China Postdoctoral Science Foundation (Grant No. 2017M622209 and 2019T120599) are also acknowledged.

Institutional Review Board Statement

Not applicable.

Informed Consent Statement

Not applicable.

Data Availability Statement

Not applicable.

Acknowledgments

The authors gratefully acknowledge the immense support about the copyright of MOE from Wansong Zong, College of Geography and Environment, at Shandong Normal University, China.

Conflicts of Interest

The authors declare no conflict of interest.

References

  1. Haritash, A.K.; Kaushik, C.P. Biodegradation aspects of polycyclic aromatic hydrocarbons (PAHs): A review. J. Hazard. Mater. 2009, 169, 1–15. [Google Scholar] [CrossRef] [PubMed]
  2. Zioła, N.; Słaby, K. The Content of Selected Heavy Metals and Polycyclic Aromatic Hydrocarbons (PAHs) in PM10 in Urban-Industrial Area. Sustainability 2020, 12, 5284. [Google Scholar] [CrossRef]
  3. Zhao, Z.; Zhang, L.; Cai, Y.; Chen, Y. Distribution of polycyclic aromatic hydrocarbon (PAH) residues in several tissues of edible fishes from the largest freshwater lake in China, Poyang Lake, and associated human health risk assessment. Ecotoxicol. Environ. Saf. 2014, 104, 323–331. [Google Scholar] [CrossRef] [PubMed]
  4. Hasinger, M.; Scherr, K.E.; Lundaa, T.; Bräuer, L.; Zach, C.; Loibner, A.P. Changes in iso-and n-alkane distribution during biodegradation of crude oil under nitrate and sulphate reducing conditions. J. Biotechnol. 2012, 157, 490–498. [Google Scholar] [CrossRef]
  5. Lv, W.; Schanbacher, F.L.; Yu, Z. Putting microbes to work in sequence: Recent advances in temperature-phased anaerobic digestion processes. Bioresour. Technol. 2010, 101, 9409–9414. [Google Scholar] [CrossRef]
  6. Valdman, E.; Battaglini, F.; Leite, S.; Valdman, B. Naphthalene detection by a bioluminescence sensor applied to wastewater samples. Sens. Actuators B Chem. 2004, 103, 7–12. [Google Scholar] [CrossRef]
  7. El-Naggar, M.; Hanafy, S.; Younis, A.M.; Ghandour, M.A.; El-Sayed, A.-A.Y. Seasonal and Temporal Influence on Polycyclic Aromatic Hydrocarbons in the Red Sea Coastal Water, Egypt. Sustainability 2021, 13, 11906. [Google Scholar] [CrossRef]
  8. Jin, B.; Niu, J.; Liu, Y.; Zhao, J.; Yin, Z. Effects of polycyclic aromatic hydrocarbons on sludge performance for denitrification and phosphorus removal. Chem. Eng. J. 2020, 397, 125552. [Google Scholar] [CrossRef]
  9. Verrhiest, G.J.; Clément, B.; Volat, B.; Montuelle, B.; Perrodin, Y. Interactions between a polycyclic aromatic hydrocarbon mixture and the microbial communities in a natural freshwater sediment. Chemosphere 2002, 46, 187–196. [Google Scholar] [CrossRef]
  10. Yu, H.; Xia, Q.; Yan, J.; Herreno-Saenz, D.; Wu, Y.-S.; Tang, I.-W.; Fu, P.P. Photoirradiation of polycyclic aromatic hydrocarbons with UVA light–a pathway leading to the generation of reactive oxygen species, lipid peroxidation, and DNA damage. Int. J. Env. Res. Public Health 2006, 3, 348–354. [Google Scholar] [CrossRef]
  11. Krishnamurthi, K.; Devi, S.S.; Chakrabarti, T. The genotoxicity of priority polycyclic aromatic hydrocarbons (PAHs) containing sludge samples. Toxicol. Mech. Methods 2007, 17, 1–12. [Google Scholar] [CrossRef] [PubMed]
  12. Cebulska-Wasilewska, A.; Binkova, B.; Sram, R.J.; Kalina, I.; Popov, T.; Farmer, P.B. Repair competence assay in studies of the influence of environmental exposure to c-PAHs on individual susceptibility to induction of DNA damage. Mutat. Res.-Fundam. Mol. Mech. Mutag. 2007, 620, 155–164. [Google Scholar] [CrossRef] [PubMed]
  13. State Environmental Protection Administration. The Water and Wastewater Monitoring Analysis Method Editorial Board. Water and Wastewater Monitoring Analysis Method, 4th ed.; China Environmental Science Press: Beijing, China, 2002; pp. 38–47. (In Chinese)
  14. Song, L.; Li, D.; Cao, X.; Tang, Y.; Liu, R.; Niu, Q.; Li, Y.Y. Optimizing biomethane production of mesophilic chicken manure and sheep manure digestion: Mono-digestion and co-digestion kinetic investigation, autofluorescence analysis and microbial community assessment. J. Environ. Manag. 2019, 237, 103–113. [Google Scholar] [CrossRef] [PubMed]
  15. Jing, M.; Han, G.; Wan, J.; Zhang, S.; Liu, R. Catalase and superoxide dismutase response and the underlying molecular mechanism for naphthalene. Sci. Total Environ. 2020, 736, 139567. [Google Scholar] [CrossRef] [PubMed]
  16. Wemheuer, F.; Taylor, J.; Daniel, R.; Johnston, E.; Meinicke, P.; Thomas, T.; Wemheuer, B. Tax4Fun2: Prediction of habitat-specific functional profiles and functional redundancy based on 16S rRNA gene sequences. Environ. Microbiome 2020, 15, 11. [Google Scholar] [CrossRef] [PubMed]
  17. Lin, C.; Gan, L.; Chen, Z.L. Biodegradation of naphthalene by strain Bacillus fusiformis (BFN). J. Hazard. Mater. 2010, 182, 771–777. [Google Scholar] [CrossRef]
  18. Morasch, B.; Annweiler, E.; Warthmann, R.J.; Meckenstock, R.U. The use of a solid adsorber resin for enrichment of bacteria with toxic substrates and to identify metabolites: Degradation of naphthalene, o -, and m -xylene by sulfate-reducing bacteria. J. Microbiol. Methods 2001, 44, 183–191. [Google Scholar] [CrossRef]
  19. Chang, S.; Liu, X.; Ren, B.; Liu, B. Effects of LB Broth, Naphthalene Concentration, and Acetone on the Naphthalene Degradation Activities by Pseudomonas putida G7. Water Environ. Res. 2015, 87, 61–67. [Google Scholar] [CrossRef]
  20. Wang, Z.; Wu, Z.; Tang, S. Characterization of dissolved organic matter in a submerged membrane bioreactor by using three-dimensional excitation and emission matrix fluorescence spectroscopy. Water Res. 2009, 43, 1533–1540. [Google Scholar] [CrossRef]
  21. Cao, S.; Sun, F.; Lu, D.; Zhou, Y. Characterization of the refractory dissolved organic matters (rDOM) in sludge alkaline fermentation liquid driven denitrification: Effect of HRT on their fate and transformation. Water Res. 2019, 159, 135–144. [Google Scholar] [CrossRef]
  22. Kun, L.; Yinguang, C.; Naidong, X.; Xiong, Z.; Mu, L. Effect of humic acids with different characteristics on fermentative short-chain fatty acids production from waste activated sludge. Environ. Sci. Technol. 2015, 49, 4929–4936. [Google Scholar]
  23. Karthikeyan, O.P.; Selvam, A.; Wong, J. Hydrolysis-acidogenesis of food waste in solid-liquid-separating continuous stirred tank reactor (SLS-CSTR) for volatile organic acid production. Bioresour. Technol. 2016, 200, 366–373. [Google Scholar] [CrossRef] [PubMed]
  24. Leng, L.; Yang, P.; Singh, S.; Zhuang, H.; Xu, L.; Chen, W.-H.; Dolfing, J.; Li, D.; Zhang, Y.; Zeng, H.; et al. A review on the bioenergetics of anaerobic microbial metabolism close to the thermodynamic limits and its implications for digestion applications. Bioresour. Technol. 2018, 247, 1095–1106. [Google Scholar] [CrossRef] [PubMed]
  25. Yue, L.; Cheng, J.; Zhang, H.; Yuan, L.; Hua, J.; Dong, H.; Li, Y.-Y.; Zhou, J. Inhibition of N-Vanillylnonanamide in anaerobic digestion of lipids in food waste: Microorganisms damage and blocked electron transfer. J. Hazard. Mater. 2020, 399, 123098. [Google Scholar] [CrossRef] [PubMed]
  26. Lunardi, C.; Gomes, A.; Rocha, F.; Tommaso, J.; Patience, G. Experimental methods in chemical engineering: Zeta potential. Can. J. Chem. Eng. 2021, 99, 627–639. [Google Scholar] [CrossRef]
  27. Zhang, D.; Wang, Y.; Gao, H.; Fan, X.; Guo, Y.; Wang, H.; Zheng, H. Variations in macro and micro physicochemical properties of activated sludge under a moderate oxidation- in situ coagulation conditioning: Relationship between molecular structure and dewaterability. Water Res. 2019, 155, 245–254. [Google Scholar] [CrossRef]
  28. Zhang, Z.; Guo, L.; Wang, Y.; Li, F.; Zhao, Y.; Gao, M.; She, Z. Degradation and transformation of extracellular polymeric substances (EPS) and dissolved organic matters (DOM) during two-stage anaerobic digestion with waste sludge. Int. J. Hydrogen Energy 2017, 42, 9619–9629. [Google Scholar] [CrossRef]
  29. Tian, X.; Shen, Z.; Han, Z.; Zhou, Y. The effect of extracellular polymeric substances on exogenous highly toxic compounds in biological wastewater treatment: An overview. Bioresour. Technol. Rep. 2019, 5, 28–42. [Google Scholar] [CrossRef]
  30. Hermann, J.H.; Frans, J.W.; Sikkema, J.; Keweloh, H.; de Bont, J.A. Mechanisms of resistance of whole cells to toxic organic solvents. Elsevier Current Trends 1994, 12, 409–415. [Google Scholar]
  31. Tan, Y.; Zheng, C.; Cai, T.; Niu, C.; Wang, S.; Pan, Y.; Lu, X.; Zhen, G.; Qian, G.; Zhao, Y. Anaerobic bioconversion of petrochemical wastewater to biomethane in a semi-continuous bioreactor: Biodegradability, mineralization behaviors and methane productivity. Bioresour. Technol. 2020, 304, 123005. [Google Scholar] [CrossRef]
  32. Li, S.; Cao, Y.; Zhao, Z.; Zhang, Y. Regulating Secretion of Extracellular Polymeric Substances through Dosing Magnetite and Zerovalent Iron Nanoparticles to Affect Anaerobic Digestion Mode. ACS Sustain. Chem. Eng. 2019, 7, 9655–9662. [Google Scholar] [CrossRef]
  33. Tay, J.-H.; Liu, Q.-S.; Liu, Y. The role of cellular polysaccharides in the formation and stability of aerobic granules. Lett. Appl. Microbiol. 2001, 33, 222–226. [Google Scholar] [CrossRef] [PubMed]
  34. Liu, X.; Liu, J.; Deng, D.; Li, R.; Guo, C.; Ma, J.; Chen, M. Investigation of extracellular polymeric substances (EPS) in four types of sludge: Factors influencing EPS properties and sludge granulation. J. Water Process Eng. 2021, 40, 101924. [Google Scholar] [CrossRef]
  35. Park, M.; Snyder, S.A. Sample handling and data processing for fluorescent excitation-emission matrix (EEM) of dissolved organic matter (DOM). Chemosphere 2018, 193, 530–537. [Google Scholar] [CrossRef] [PubMed]
  36. Zhao, J.; Chen, H. Correlation of porous structure, mass transfer and enzymatic hydrolysis of steam exploded corn stover. Chem. Eng. Sci. 2013, 104, 1036–1044. [Google Scholar] [CrossRef]
  37. Klein, M.I.; Duarte, S.; Xiao, J.; Mitra, S.; Foster, T.H.; Koo, H. Structural and molecular basis of the role of starch and sucrose in streptococcus mutans biofilm development. Appl. Environ. Microbiol. 2009, 75, 837–841. [Google Scholar] [CrossRef] [Green Version]
  38. Gunn, J.S.; Bakaletz, L.O.; Wozniak, D.J. What’s on the Outside Matters: The Role of the Extracellular Polymeric Substance of Gram-negative Biofilms in Evading Host Immunity and as a Target for Therapeutic Intervention. J. Biol. Chem. 2016, 291, 12538–12546. [Google Scholar] [CrossRef] [Green Version]
  39. Fan, W.; Yuan, G.; Li, Q.; Wei, L. Antibacterial mechanisms of methyl gallate against Ralstonia solanacearum. Australas. Plant Path. 2014, 43, 1–7. [Google Scholar] [CrossRef]
  40. Zhu, J.-K. Regulation of ion homeostasis under salt stress. Curr. Opin. Plant Biol. 2003, 6, 441–445. [Google Scholar] [CrossRef]
  41. Nekoei, A.R.; Vatanparast, M. π-Hydrogen bonding and aromaticity: A systematic interplay study. Phys. Chem. Chem. Phys. 2019, 21, 623–630. [Google Scholar] [CrossRef]
  42. Li, R.; Duan, N.; Zhang, Y.; Liu, Z.; Li, B.; Zhang, D.; Dong, T. Anaerobic co-digestion of chicken manure and microalgae Chlorella sp.: Methane potential, microbial diversity and synergistic impact evaluation. Waste Manag. 2017, 68, 120–127. [Google Scholar] [CrossRef] [PubMed]
  43. Yong, N.; Zhao, J.; Tang, Y.; Guo, P.; Yang, Y.; Wu, X.; Zhao, F. Species Divergence vs. Functional Convergence Characterizes Crude Oil Microbial Community Assembly. Front. Microbiol. 2016, 7, 1254. [Google Scholar]
  44. Conrad, R.; Klose, M.; Claus, P. Phosphate inhibits acetotrophic methanogenesis on rice roots. Appl. Environ. Microbiol. 2000, 66, 828–831. [Google Scholar] [CrossRef] [PubMed]
  45. Sonthiphand, P.; Hall, M.W.; Neufeld, J.D. Biogeography of anaerobic ammonia-oxidizing (anammox) bacteria. Front. Microbiol. 2014, 5, 399. [Google Scholar] [CrossRef] [Green Version]
  46. Rivière, D.; Desvignes, V.; Pelletier, E.; Chaussonnerie, S.; Guermazi, S.; Weissenbach, J.; Li, T.; Camacho, P.; Sghir, A. Towards the definition of a core of microorganisms involved in anaerobic digestion of sludge. ISME J. 2009, 3, 700–714. [Google Scholar] [CrossRef] [PubMed] [Green Version]
  47. Lee, J.; Shin, S.G.; Han, G.; Koo, T.; Hwang, S. Bacteria and archaea communities in full-scale thermophilic and mesophilic anaerobic digesters treating food wastewater: Key process parameters and microbial indicators of process instability. Bioresour. Technol. 2017, 245, 689–697. [Google Scholar] [CrossRef]
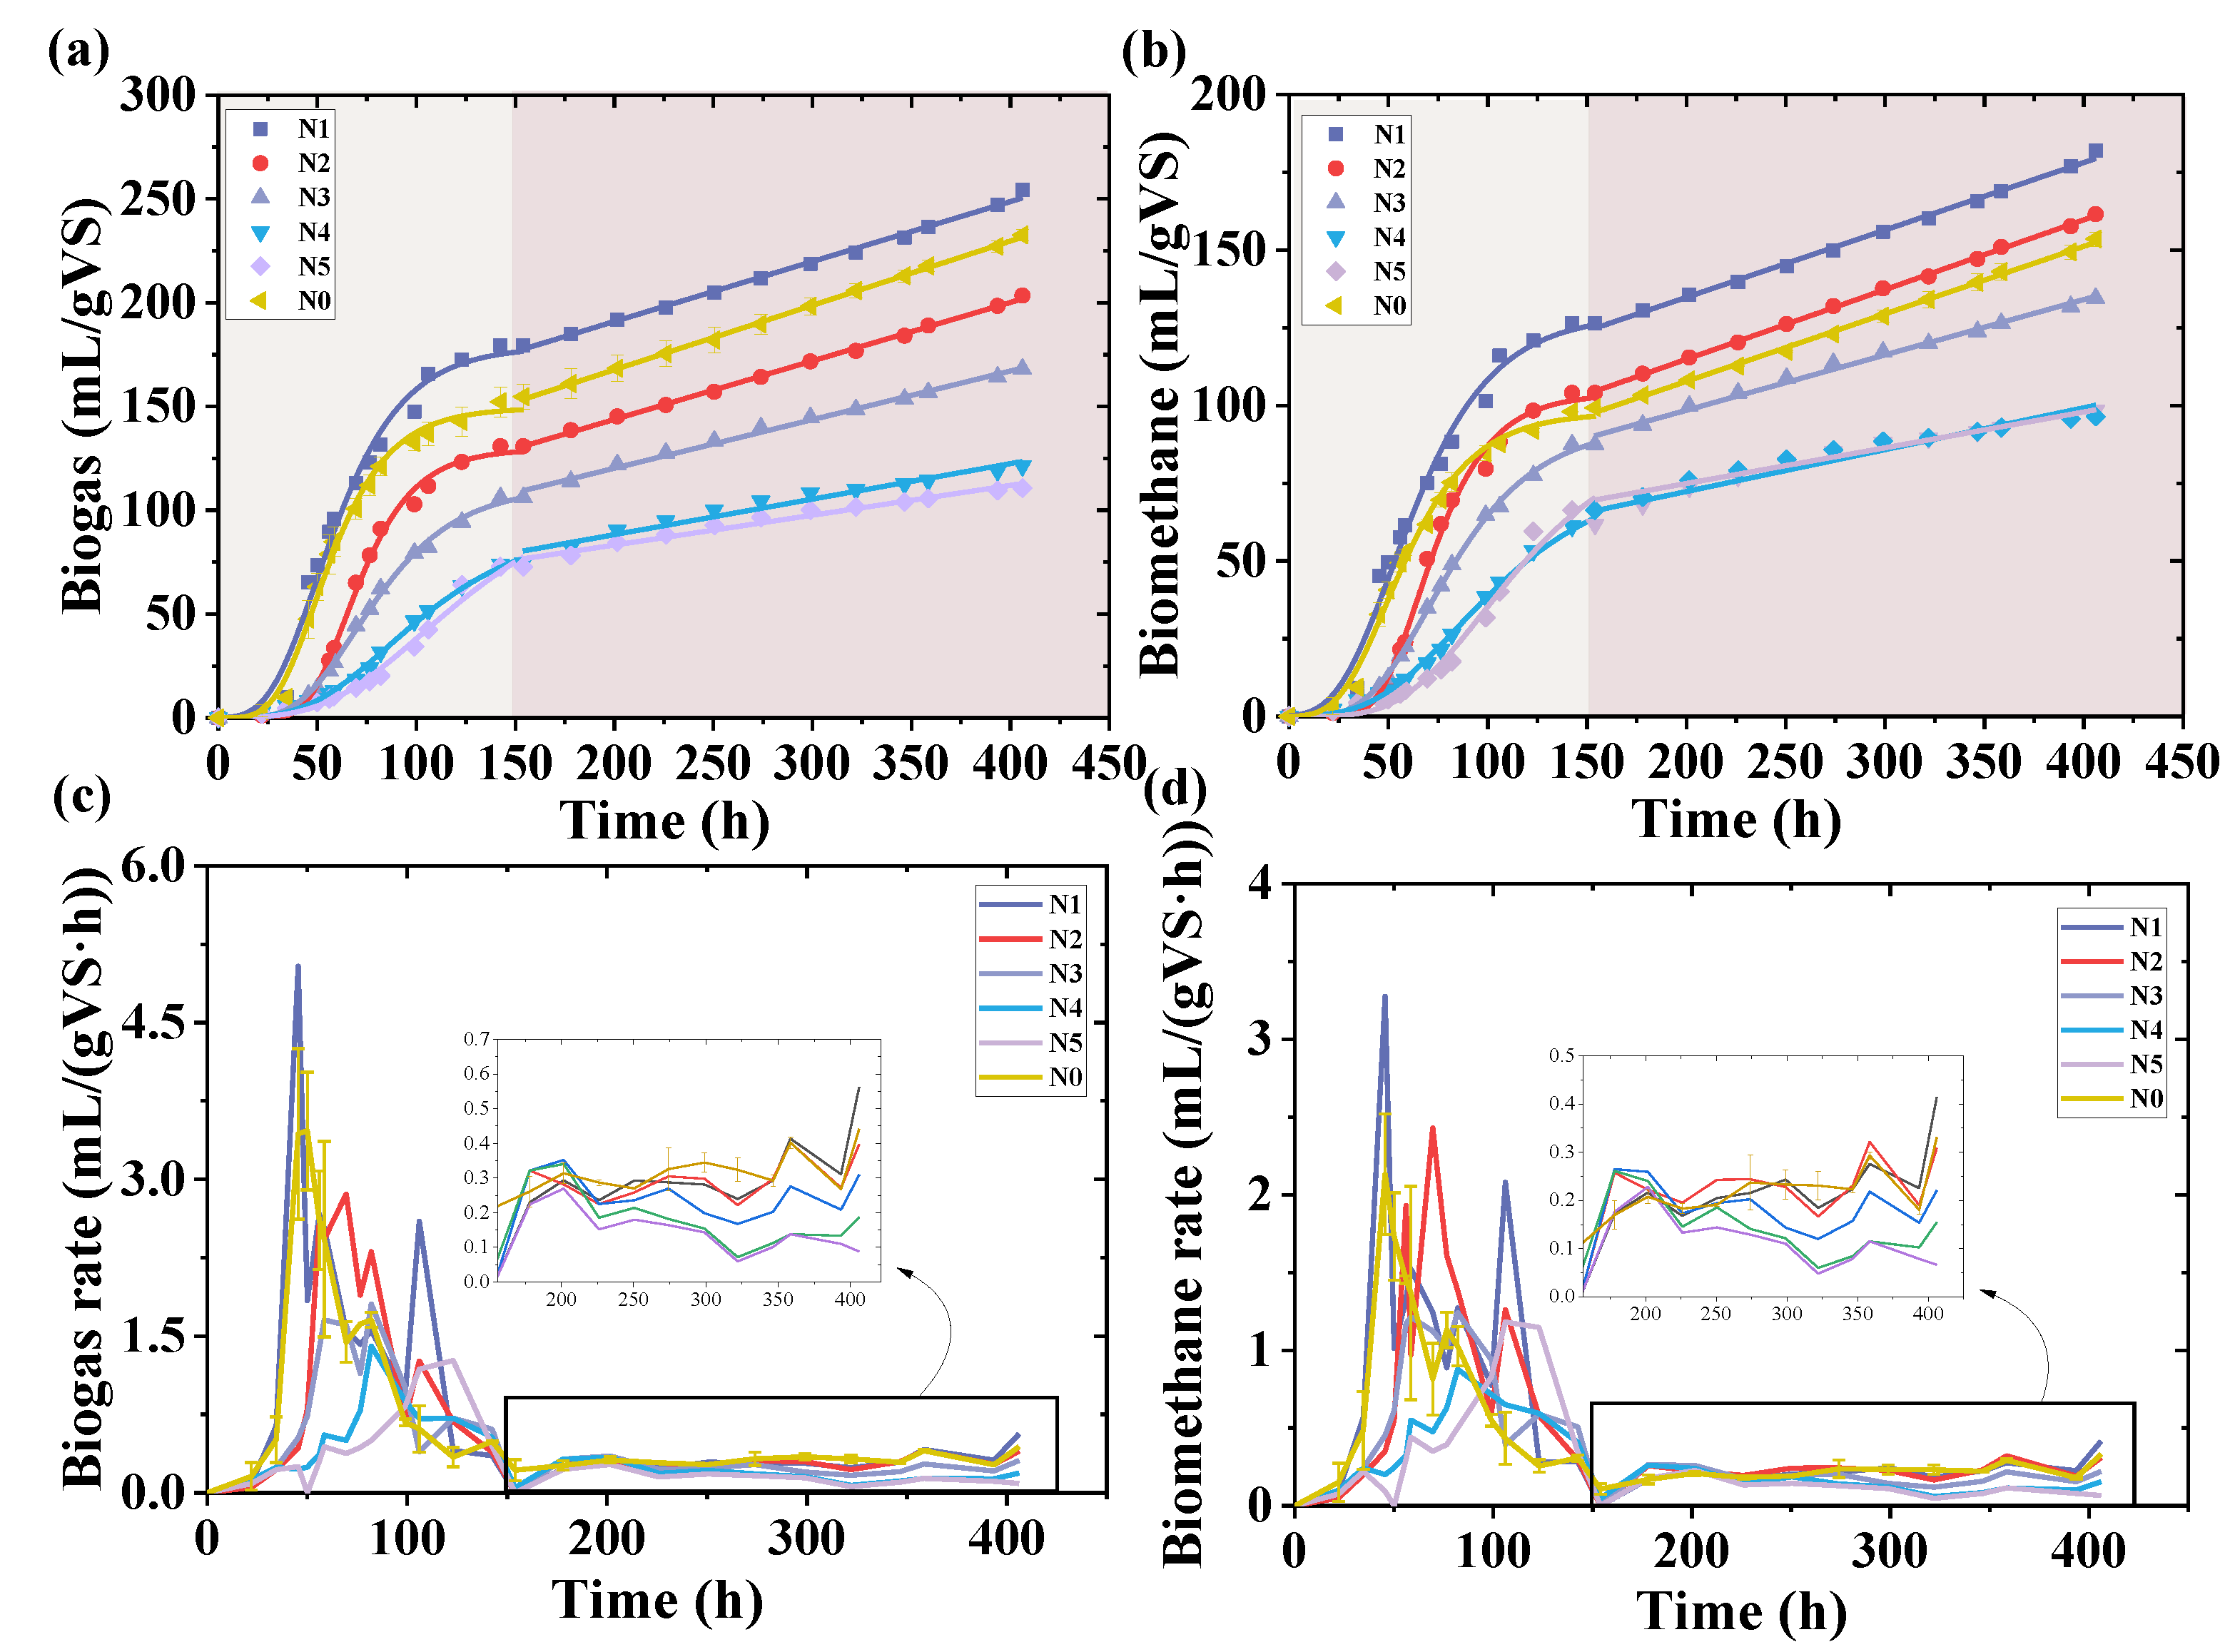
Figure 1. Cumulative biogas/biomethane yield (a,b), and instantaneous gas-producing/methanogenic rates (c,d).
Sustainability 14 16377 g001
Figure 2. Dynamic variations of the digestive performance in different reactors: the EEM-PARAFAC composition in N0 (a1), N1 (a2), N3 (a3), and N4 (a4); the concentrations of tVFA in N0 (b1), N1 (b2), N3 (b3), and N4 (b4); and the efficiencies of the four stages in anaerobic digestion (c1c4).
Sustainability 14 16377 g002
Figure 3. Zeta potential of different systems (a), the composition (b), and the EEM spectrum (c1c4) of EPS.
Sustainability 14 16377 g003
Figure 4. Key enzymes activities in different systems (a). Cumulative biomethane yield and pathway activity (maximum methanogenic rate) from in situ metabolic assays (pathways I, II, and III refer to formate, acetate, and propionate metabolism tests, respectively) (b). Results of molecule docking of different enzymes (c).
Sustainability 14 16377 g004
Figure 5. PCoA analysis (a), the abundance of microbes at the phylum level (b) and genus level (c), and abundances of potentially functional genes of the dominant methanogens (d).
Sustainability 14 16377 g005
Figure 6. Potential functions of microbial community level 1 (a); level 2 (b); level 3 (c).
Sustainability 14 16377 g006
Table 1. The detailed design of the batch test.
GroupSludge (g)Basal Medium (mL)Starch (g)Nap (mg/L)Methanol (mL)Methane (mL)
N015900.500.5415.25
N115900.5300.5415.25
N215900.51000.5415.25
N315900.53000.5415.25
N415900.510000.5415.25
N515900.520000.5415.25
Table 2. Kinetic parameters of biogas and biomethane production.
ModelParametersN0N1N2N3N4N5
Gompertz
(Biogas)
P0 (mL/gVS)149.32 178.90 129.52 111.49 92.77 109.97
Standard error3.02 5.70 2.37 1.97 4.75 16.26
K mL/(gVS·h)2.66 2.72 2.47 1.44 0.84 0.82
Standard error0.18 0.25 0.13 0.05 0.03 0.04
A (h)28.10 25.35 44.87 40.15 44.75 53.90
Standard error1.91 2.93 1.21 1.00 1.56 2.83
Reduced chi-sqr24.86 66.93 12.15 3.34 3.68 11.04
Adj. R-Square0.99 0.99 1.00 1.00 1.00 0.99
Residual Sum of Squares298.33 803.13 145.82 40.09 44.15 132.47
Root-MSE (SD)4.99 8.18 3.49 1.83 1.92 3.32
NRMSE0.03 0.05 0.03 0.02 0.03 0.05
AIC50.85 65.71 40.11 20.75 22.19 38.67
Gompertz
(Biomethane)
P0 (mL/gVS)97.73 129.14 103.77 93.68 77.59 90.86
Standard error1.97 4.47 2.14 1.30 3.52 10.69
K mL/(gVS·h)1.50 1.70 1.88 1.13 0.67 0.81
Standard error0.09 0.14 0.10 0.03 0.02 0.05
A (h)24.99 24.00 44.71 39.28 42.17 56.37
Standard error1.88 2.94 1.34 0.73 1.36 2.70
Reduced chi-sqr8.23 29.14 8.93 1.15 1.83 9.66
Adj. R-Square0.98 0.99 1.00 0.99 0.98 0.99
Residual Sum of
Squares
98.70 349.68 107.17 13.81 21.91 115.87
Root MSE (SD)2.87 5.40 2.99 1.07 1.35 3.11
NRMSE0.02 0.05 0.03 0.01 0.02 0.03
AIC34.26 53.23 35.50 4.76 11.68 36.67
Publisher’s Note: MDPI stays neutral with regard to jurisdictional claims in published maps and institutional affiliations.