Abstract
Gwadar is essential to Pakistan’s financial stability. Being the third deep-water port in Pakistan, it plays a significant role in trade between the Gulf States, Africa, UAE, and CARs. The load shedding of 12–16 h in Gwadar is the most concerning issue due to the non-availability of a utility grid, which is why the Pakistan imports 70 MW of electricity from Iran to fulfill Gwadar’s electricity needs. Gwadar has renewable energy resources that can be utilized for electricity generation. However, wind and solar systems were only installed for limited residential areas. Considering this scenario, a technological and economic analysis was performed using the Hybrid Optimization Model for Multiple Energy Resources (HOMER) software. Three models were considered in this study. Model 1 consisted of photovoltaic (PV) cells, wind turbines, converters, and batteries. Model 2 consisted of PV cells, wind turbines, converters, and a grid. Model 3 consisted of PV cells, wind turbines, converters, and diesel generators. The annual energy generated by Model 1, Model 2, and Model 3 was respectively 57.37 GWh, 81.5 GWh, and 30.4 GWh. The Levelized Cost of Electricity (LCOE) for Model 1, Model 2, and Model 3 was respectively USD 0.401/kWh, USD 0.0347/kWh, and USD 0.184/kWh. The simple payback period of Model 1 was 6.70 years, the simple payback period of Model 2 was 7.77 years and the simple payback period of Model 3 was 4.98 years. Because Model 3 had the lowest Net Present Cost NPC, its payback period was also less than those of the other two. However, Model 2 had the lowest LCOE and its renewable fraction was 73.3%. These facts indicate that Model 2 is the optimal solution.
1. Introduction
Scientists have long predicted that the Earth’s temperature will rise as a result of the current extensive use of fossil fuels, of which a significant percentage is burned. Because of the impact that human behavior has on power generation systems, environmental changes may now be felt throughout the planet due to a rise in the planet’s mean temperature [1]. One of the main causes of an increase in the average temperature of the Earth is the electrical power produced by fossil fuels-based plants. Many ozone-depleting chemicals are released into the atmosphere by these fossil fuel-based plants. The ongoing confrontation between Russia and Ukraine has made this worse. The price of petroleum products has skyrocketed; therefore, now is the ideal time for nations that import petroleum products to seriously pursue sustainable power plans. The use of environmentally friendly energy as a substitute for petroleum products and to manage the unnatural weather shift, which has been effectively implemented in industrialized countries, can now be implemented by emerging nations [2]. There is no other option besides ecofriendly power. Eco-friendly energy became more well-known after the ban on Middle East crude oil in the 1970s. Since then, eco-friendly energy has been improved and most petroleum products can be replaced by it [3]. The most well-known sustainable energy source in the past was hydropower, which requires the construction of a dam, a significant project. Hydropower can be utilized to lessen floods, as demonstrated by the Itaipu Dam in Paraguay and the Three Gorges Dam in China. Although hydropower requires a large initial investment, the levelized cost of energy generated through hydropower is less expensive in the long run. Microscale hydropower operations are also possible. The issue that micro-scale hydropower runs into is its temperamental nature: its levelized energy is pricey relative to even low-cost fossil fuel products such as coal, since solar photovoltaic and wind turbine systems are presently the most recognized renewable energy sources [4,5,6]. To make solar energy competitive, a lot of research has been done, including employing nanofluids [7] and enhancing performance with a compound explanatory concentrator and a heated dryer powered by the sun [8]. Several nations have adopted this network-related structure, particularly the clever city [9]. A study for the southern part of Ghana showed that a stand-alone hybrid energy system could be used and cheap electricity generated [10]. The author of [11] shows that electric charging stations can use different renewable energy sources to generate cheap electricity that can charge electric vehicles. An off-grid hybrid energy system was designed for radio transmitter stations in India and the results showed that such a system is a promising solution for radio transmitter stations [12]. When selecting solar for a hybrid system, the type of solar module must be selected with great care. The author of [13] produced results that show that monocrystalline solar PV modules perform better than polycrystalline modules in all-weather conditions. If a battery is being used in the hybrid system, then the type of battery should also be selected carefully. The author of [14] found that lead-acid batteries are used 70% of the time and are easily available in the market. This helps in lowering the cost of systems, because if batteries are imported or they are not easily available then they will be costly. Implementing independent and framework-related half-and-half energy frameworks has been indicated as being feasible via techno-economic analysis [15].
According to recent studies [11], the execution of serious and sustainable energy arrangements is beneficial to move beyond conventional energy utilization. This is especially true for the development of energy that incorporates ozone-depleting substances. According to the International Energy Agency’s 2019 special report, there will be a 55% increase in power demand by 2040 relative to 2018; 30% of that growth should be produced by wind and solar energy [16]. The Colombian Caribbean region benefits from the ability of solar panels and wind turbines to utilize sunlight-based illumination and wind speed separately. Research has focused on demonstrating that the public energy needs of Colombia could be met solely by installing wind turbines in 20% of the La Guajira division’s domain and 10% in the ocean, leaving 40% of power demand unfinished [17]. Colombia is the sixth largest coal exporter, which means it is affecting the global climate [18]. The author of [19] investigated how much CO2 is produced in Colombia and suggested a method to reduce the CO2. Since petroleum products are still widely used in the area and despite efforts to carry out deep oil drilling to raise the use of non-renewable energy sources for a few more years, the great potential for power creation through wind turbines and sunlight-based chargers in the Colombian Caribbean district remains unfulfilled. In [20], a hybrid system of solar and wind energy was designed which would help to reduce the CO2 emissions in the region of the Colombian Caribbean. However, using non-renewable energy sources and emitting ozone-depleting substances will soon be subject to financial penalties [21], and the efficiency of wind turbines and solar chargers will be improved. The electrification of rural areas is difficult [22] but when it is implemented, hybrid power systems will greatly aid in the transition to sustainable power systems while gradually shifting the entire activity of conventional non-renewable energy sources to systems powered by wind and solar energy [19,20]. Another benefit of using environmentally friendly energy is that it is predicted to produce continuous employment rates of 16% in the manufacturing sector, 29% in the development sector, and 50% in maintenance by 2050 [23]. The authors of [24] showed that using a hybrid system for off-grid connection would help to provide safer electricity supply to Dibba. Hybrid Optimization for Multiple Energy Resources (HOMER) programming was used to support this research project. Since HOMER has the reenactment equipment to conduct research with altered energy sources, which enables evaluating the presentation of force age plants with one or a few inexhaustible sources, it is incredibly helpful for the estimation of a half-breed energy supply framework [21]. In addition to analyzing energy performance, HOMER can deliver information from a financial and environmental standpoint [25].
A challenging energy planning problem is combining multiple sustainable power systems into a single system [26]. However, introducing environmentally friendly power into power grids offers prospective solutions to several present issues, such as increasing environmental change and ozone-depleting chemical emissions, dependence on petroleum derivatives, and extreme fluctuations in energy prices [27]. Clean energy is becoming more accepted on a global scale. Sustainable power developments are typically essential for long-term improvement, energy security, and environmental assurance [28,29]. Particularly viable options for reducing fossil fuel products and creating a cleaner, safer society are wind and solar-based energy sources. Recent studies on sustainable power resources in Thailand have focused on solar-based [30] and hybrid environmentally friendly power sources [31] to promote a cleaner energy age and increase the energy security of this Southeast Asian nation with a developing economy. However, there are certain drawbacks to using ecologically friendly power sources, one of which is their erratic nature. Additionally, geographic and environmental factors have an impact on the wind and the sun [32]. Energy for remote villages can be easily produced by hybrid systems and fulfill village electricity demands [33]. Hybrid systems have become popular for rural areas due to the high price of fuel and need to reduce CO2 emissions [34]. When selecting a hybrid system for any area, different models should be studied and an optimized model should be implemented [35]. The energy storage is very important for minimizing the power fluctuations in the system for a stable power supply [36]. An energy storage system with a reasonable capacity configuration can improve the operation reliability and economic efficiency of a microgrid [37]. To increase productivity, crossbreed sustainable power frameworks (HRES) have been developed [31,32,33]. These frameworks combine various energy resources, which has several benefits, including lower capital costs, an extended power age limit, increased steadfastness and general effectiveness, and more adaptability in the plan streamlining. Additionally, the instability of the renewable market and the vulnerability of environmentally friendly power sources affect the dependability of the power framework. Utilizing energy storage systems (ESS) can aid in resolving these difficulties [34,35]. The expansion of environmentally friendly power in the public portfolio is at the center of Thailand’s 2018 Power Development Plan (PDP), which aims to support cleaner generation as a route to energy security and carbon neutrality. Depending on the spatial circulation and the capacity of the sustainable power assets, dispersed power is a characteristic of several developments in sustainable power, such as PV, wind power, biomass, hydropower, and biogas. A HRES may be designed to combine solar, wind, hydro, biogas, and diesel generator (DG) reinforcement with a battery power capacity framework (BESS), depending on the application [38]. These hybrid systems can be installed in small telecom base stations [39]. The studies show that if a hybrid system has fuel cells and wind energy, then fuel cells help to reduce carbon dioxide emissions [40]. Energy units (FC) with H2 innovation (HT) have more recently been incorporated into HRES frameworks [37,38]. Keeping the literature review in mind, the research gap and novelty of this study are the following.
1.1. Research Gap
- (1)
- Gwadar is not connected to any national grid, which is why there is high demand for micro-grids. There are no large-scale micro-grids in Gwadar that can fulfill power demand.
- (2)
- There is no research on a large-scale hybrid system with a different generation mix for Gwadar.
- (3)
- In this study, configurations are PV/wind/battery, PV/wind/grid, and PV/wind/diesel generator. No research has been done on the selected configurations for Gwadar.
- (4)
- Techno-economic analysis has not been carried out for Gwadar with the above configurations.
1.2. Novelty
- (1)
- Gwadar is coastal area and to fulfill its power demand the above selected configurations of generation mix were first used.
- (2)
- The sensitivity analysis and techno-economic analysis was done with the objective of confirming net present cost (NPC), lowest cost of electricity (LCOE), and greenhouse gas emissions.
- (3)
- Homer Pro was used for multi-criteria decision analysis so that the optimal value of all objectives could be obtained.
2. Materials and Methods
A methodology was created and used throughout the research to ensure practical work was accomplished. Figure 1 shows the plan of the methodology used. The methodology focused research on the importance of resolving the electricity shortfall issue of Gwadar, using renewable energy sources. The following steps involved collecting data on solar and wind energy to identify how much power could be generated. This was then used to produce the demand profile that could be used in the HOMER model (Hybrid Optimization Model for Multiple Energy Resources). This study used the following analytical framework [41] (Figure 1 shows methodology flow charts).
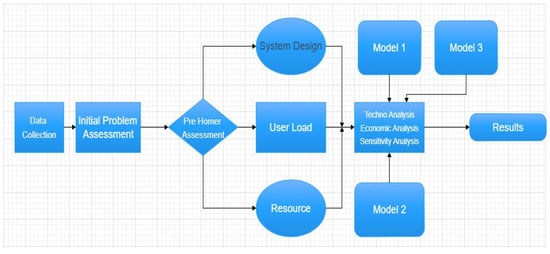
Figure 1.
Flow chart of methodology.
- (1)
- Specification of location.
- (2)
- The data needed for modeling:
- (a)
- Average electric load demand;
- (b)
- The area’s everyday radiation and clarity index;
- (c)
- The site’s everyday temperature.
- (3)
- Architecture of systems.
Homer Pro software uses mixed integer linear programming to solve problems. Multi-criteria decision analysis is implemented in a model to obtain results. Three different models with different generation mixes were implemented to obtain optimized net present cost (NPC), lowest cost of electricity (LCOE), and renewable fraction values.
2.1. Location
Pakistan is a developing country that is struggling to accelerate its economic growth and keep pace with the region’s fast-expanding economies. Energy, economic, and industrial crises are major concerns in Pakistan. To overcome these issues, Pakistan must engage in various projects. One such initiative, the China-Pakistan Economic Corridor (CPEC), has already begun. According to the author of [42], the CPEC investment is USD 46 billion, with the main goal of connecting China and Pakistan to the Middle East and conducting trade. All trade will be conducted from Gwadar, Pakistan, because it is positioned on an international trade route, which is why Gwadar is significant. The biggest concern in Gwadar is a lack of energy: there is no national grid and electricity is imported from Iran [43]. Optimizing a system to overcome this challenge was chosen for this paper’s research, and a model was created for Gwadar. It has several renewable energy resources that can meet the city’s power needs. The Gwadar map is presented in Figure 2.
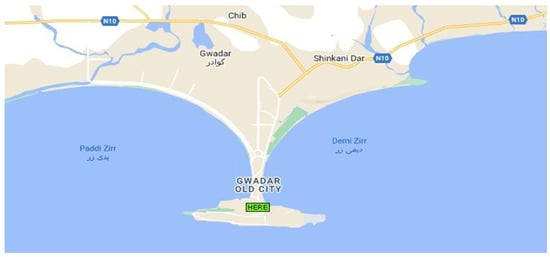
Figure 2.
Gwadar map [44].
2.2. Modeling Statistics
2.2.1. Average Electric Load Demand
At present, 70 MW/day of electricity is imported from Iran to fulfill the demands of Gwadar. However, due to Iran’s own electricity demands, it does not supply the complete 70 MW, and consequently there is load shedding of 12–16 h per day. People use generators to fulfill the demand for electricity. The price of electricity imported from Iran varies due to oil prices and Pakistan buys it in US dollars, for prices ranging from 8 cents/kWh to 11 cents/kWh [45]. Gwadar’s load is based on a power market survey conducted by NTDC (National Transmission and Dispatch Company) and QESCO (Quetta Electricity Supply Company) [46]. The daily and seasonal load profile is shown in Figure 3 and Figure 4. Load variation can be due to many reasons, including economic factors, customer behavior, and weather conditions. This means there are uncertainties regarding load. The results of [47] show that weather has a correlation with load. The components of weather are temperature, humidity, and wind speed. They influence load variance owing to the use of heating or cooling units. In Figure 4, the box plot of load variation shows that there is no outlier, which means that the estimated load is realistic. The box plot shows that the maximum load is 3123 kW and the minimum load is 2423 kW. The box plot of solar daily radiation and monthly average wind speed shows that there is a variation in energy sources due to weather, which has an impact on load variation. In Figure 5b, it can be seen that 3.59 kW/m2/day is minimum daily radiation, 5.29 kW/m2/day is median of daily radiation and 6.46 kW/m2/day is maximum daily radiation. In Figure 6b it can be seen that 4.24 m/s is the minimum wind speed, 4.7 m/s is median of wind speed and 5.28 m/s is maximum wind speed. That is why load variation can be visible in the load profile when the load is less in some hours and increased in others. For example, during peak hours, the load is higher, whereas during non-peak hours, the demand is lower.
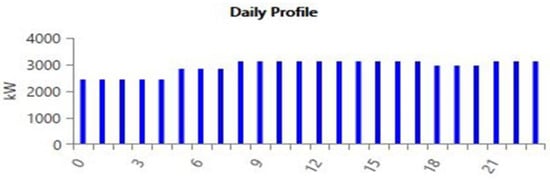
Figure 3.
Daily load profile of Gwadar.
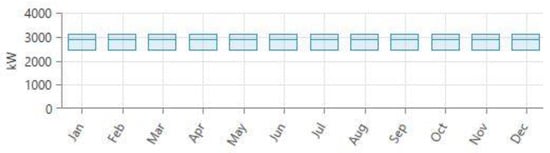
Figure 4.
Monthly load profile of Gwadar.
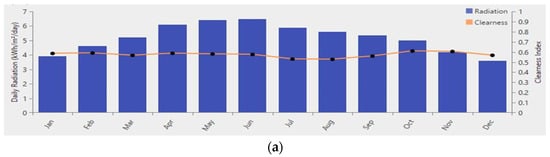
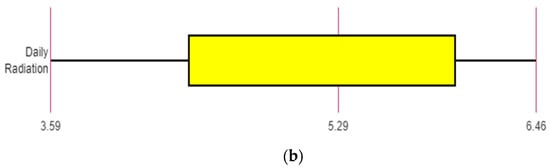
Figure 5.
(a) Annual daily radiation and clarity index [48]. (b) Box plot of annual daily radiation [48].
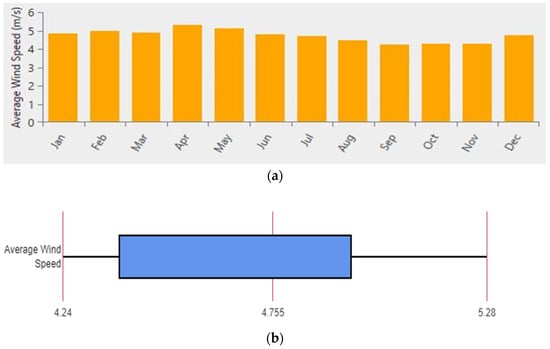
Figure 6.
(a) Average wind speed (m/s) [48]. (b) Box plot of average wind speed [48].
2.2.2. Everyday Radiation and Clarity Index at the Site
Indicators of the clarity of the atmosphere include the daily indexes for radiation and clarity numbers. A portion of solar energy reaches the Earth’s surface through the atmosphere. To calculate it, surface radiation is divided by extraterrestrial radiation, yielding a one-dimensional number between 0 and 1. The clarity index has a significant value while it is sunny and clear outside and a low value when it is cloudy. Figure 5 shows the everyday solar radiation and clarity index and Figure 6 displays the location’s average wind speed.
2.3. Proposed System Architecture
It was necessary to initially build the system architecture to mimic the renewable energy system. There were two models in this instance, each of which included the photovoltaics, wind turbines, batteries, grid connections, and capacity that was previously mentioned. Figure 7, Figure 8 and Figure 9 exhibit the schematic representations of the three distinct model designs, respectively. Table 1 lists all of the specific details of the proposed systems. The proposed systems’ location is 4867+5Q Gwadar, Pakistan (25′6.6″ N, 62′18.9″ E). Solar panels, wind turbines, battery banks, and grid connectivity make up the scenario of the recommended renewable energy system.
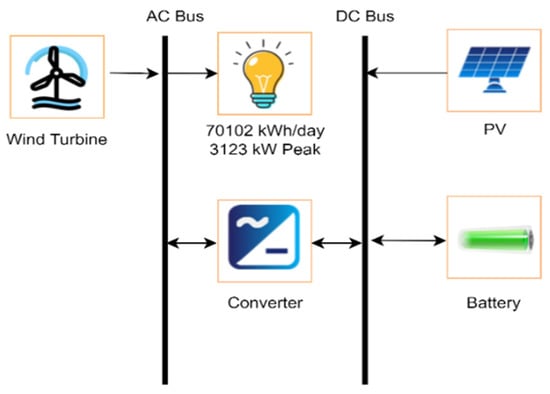
Figure 7.
Model 1.
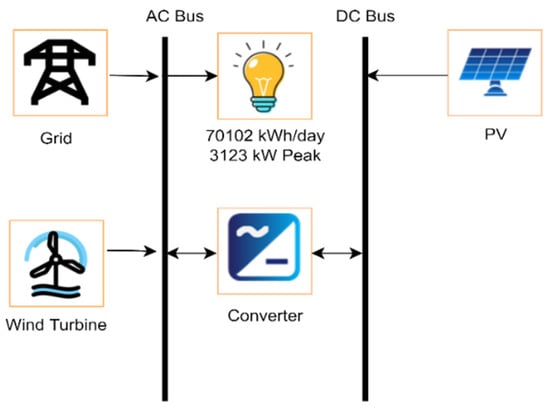
Figure 8.
Model 2.
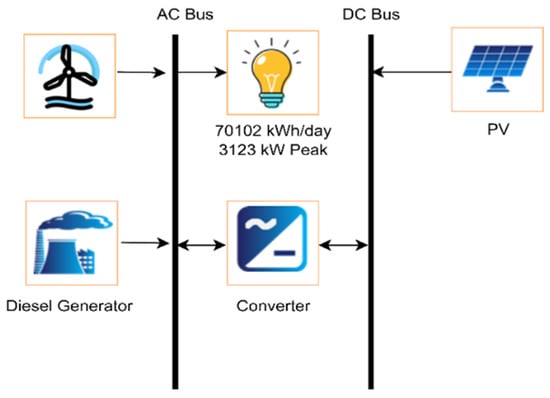
Figure 9.
Model 3.

Table 1.
Cost of components.
2.3.1. PV Panels
A mono-crystalline PV module was used because it has better performance in dry climates [13]. The lifespan and efficiency of generic PV panels are 25 years and 14%, respectively. One kW is the rated capacity of each PV plate. A photovoltaic system is expected to cost USD 641.75/kW to buy, USD 437.50/kW to replace, and USD 5.80/kW to run. The de-rating factor for the solar array was about 80%. Equation (1) [52] determines the module’s output power under ideal operating circumstances:
where Ypv stands for nominal capacity of a group of PV and the unit is kW. IT stands for total incident radiation. fpv stands for reduction factor. IS is considered to have a base value of 1000 W/m2. The average horizontal irradiance is 5.19 kWh/m2. Figure 5 shows the annual daily radiation and clearness index for Gwadar.
2.3.2. Wind Turbines
For this project, a generic wind turbine with a 10 kW rated power was chosen. The generic wind turbine has a 20-year lifespan and a 24 m hub height. The selected wind turbine is of a small scale, which is why its hub height was also small. Knowing the hub height wind speed allows one to compute the wind turbine’s output by using the power curve [53]. The power curve shows the anticipated power production of the wind turbine when estimated under typical pressure and temperature conditions. The output can be calculated by Equation (2) [54],
where P(Vhj) stands for wind turbine output, Vhj stands for hub height and P(V) is the turbine output at wind speed V from the power curve, while V2 and V1 are the wind speeds from the power curve to the hub height, respectively.
2.3.3. Battery
A “battery bank” is a grouping of a few different batteries. A solo battery is modeled by HOMER as a component with a fixed energy efficiency that can store a certain amount of DC power, depending on limitations on how fast it can be charged or discharged and the maximum amount of energy it can handle before needing to be replaced. The battery used in this design was a generic 12 volt lead-acid battery with 1 kWh of energy storage. The main reason we used lead-acid batteries in this study was that these batteries are easily available and 70% of batteries in the market are lead-acid batteries [14]. In Pakistan, lead-acid batteries are manufactured by local companies and lithium-ion batteries are imported due to which they have an import tax, which is very high. Due to this, lithium-ion batteries are costly. Its efficiency is 80%. Maximum currents for charging and discharging were 16.7 A and 24.3 A, respectively.
2.3.4. Converter
With this model, a generic system converter from the Homer Pro software was utilized. It had both rectifier and inverter modes of process. When solar and wind resources are not available, the converter only operates in inverter mode; this typically occurs at night and in overcast weather. When there is enough renewable energy to charge the battery storage system, the converter solely operates in rectifier mode. The converter has a 95% efficiency rating. The inverter’s efficiency and selection will determine how well the power converter converts DC to AC. This was calculated using Equation (3) [48].
where Pinput(t) stands for the converter’s input power and conv for its efficiency.
2.4. Economic Parameters
The techno-economic study of an engineering system requires certain economic statistics. The minimal discount rate, anticipated inflation rate, and project duration are just a few examples of the information included. The economic information needed for both Model 1 and Model 2 is summarized in Table 2.
Table 2.
Economic analysis.
2.4.1. Interest Rate
The real rate of interest for the year, often known as the actual rate of interest or basic rate of interest, is one of the inputs utilized by HOMER. It is the discount rate/interest rate used for converting one-time charges to annual costs overall. The value of the interest rate is given above in Table 2. The following equation establishes a relationship between the minimal rate of interest and the annual real rate of interest [48]:
2.4.2. Levelized Cost of Energy
The normal price per kWh of usable power the system produces as electrical energy is what HOMER refers to as the levelized cost of energy (COE). The total annualized cost less the cost of feeding the load is the cost of producing power annually, which is then divided by HOMER’s total output of usable electricity. The following equation was used to determine COE [48]:
The absolute annualized cost is the amount of every framework part’s annualized costs in addition to the annualized expenses. HOMER calculates the levelized and total net present expenses of energy using this value, making it a crucial figure.
2.4.3. Net Present Cost (NPC)
The ongoing value of the various costs the combination framework incurs over the course of its declared useful life, less the recovery value at that period, is the net present cost of the combination framework. The expenses contributing to the net current cost are those for capital expense, replacement, activity, and maintenance costs, as given in Equation (4) in accordance with [48]. Each component of the newly introduced framework had its NPC determined by Homer’s expert programming. The total NPC was calculated using the formula below [48].
In this case, the structure had a 25-year lifespan, and the investment recovery factor was a percentage used to calculate the annual present value (a progression of equivalent yearly incomes). The status of the capital recovery component was as follows [48].
2.4.4. Salvage Value
Salvage value describes how much a power system component is worth if it is still functional at the expiration of a project’s lifespan. Using this equation, HOMER determines the value of each part at the conclusion of the project’s life cycle [48]:
2.4.5. Internal Rate of Return
The internal rate of return (IRR) is the discount rate where the net present cost of the reference case is similar to the net present cost of the optimized system. The IRR is calculated by HOMER by dividing the difference between the current values of the two cash flow sequences by the discount rate.
2.4.6. Return on Investment
Return on investment is the annual budget savings compared to the initial investment (ROI). By dividing the difference in capital costs by the typical yearly difference in nominal cash flows throughout the course of the project, the ROI is determined. The next equation is used to define the return on investment [48].
2.4.7. Simple Payback
In the optimal and baseline examples, the term “simple payback” refers to the number of years required for the accumulated cash flow differential between the systems to become positive. The time required to recover the difference in investment costs between the optimal and baseline case systems is known as the payback period.
2.4.8. Total Annualized Cost
A component’s full annualized cost is the amount that, if spread out equally over the life of the project, would result in a net present cost that is identical to the component’s actual cash flow sequence. As shown in the following calculation, the capital recovery factor is divided by the net present cost to produce the annualized cost [48].
2.4.9. Renewable Fraction
The renewable fraction is the portion of energy given to the load that comes from renewable sources. It was computed using Equation (11) [48]. Table 3 shows the renewable fraction of all three selected models
where Enon ren stands for non-renewable energy, Hnon ren stands for non-renewable thermal production, Eserved stands for total electrical load served, and Hserved stands for total thermal load served.
Table 3.
Renewable fraction.
2.4.10. Reliability Analysis
The reliability of renewable energy systems is a critical evaluation for future power generation systems. There are many methods to check it and loss of power supply probability (LPSP) is a popular method. It is a probability function and is defined by a number range from 0–1. If the LPSP is 1 then there is 100% of electricity loss and if the LPSP is 0 then there is 0% of electricity loss. The LPSP can be calculated using Equation (12) [57]
where Eunmet stands for unmet load demand and Edemand stands for electrical demand for one full year. The LPSP of the three different models was calculated through the above given equation and it specified that Model 1 had 0.013 (1%), Model 2 had 0 (0%), and Model 3 also had 0 (0%), which are equivalent to 3.65 days in a year. Model 2 and 3 had zero unmet load, so their LPSP was also zero.
3. Results and Discussion
HOMER Pro was used for the techno-economic analysis and optimization of three distinct solar PV and wind turbine models for Gwadar, Pakistan, the findings of which are included in this section. The outcomes of the optimization are reviewed first, and then the techno-economic analysis findings.
3.1. Optimization Results
3.1.1. Model 1
The optimization results for the plant location 4867+5Q Gwadar, Pakistan (25′6.6″ N, 62′18.9″ E) show that all components were used in a system. The system with the lowest COE and highest proportion of renewable energy was chosen by HOMER PRO after a cost analysis of a number of system capabilities and configurations. Homer has two control dispatch strategies: cycle charging (CC) and load following (LF) [58]. The dispatch strategy used for Model 1 was cycle charging (CC). The simulation method determines the long-term feasibility of energy systems. Several configurations were generated after the hourly simulation, with the mentioned system figures displayed in light blue. To find the optimum configuration out of several combinations to meet Gwadar’s load demand, two different scenarios were assessed among diverse configured energy systems in this study. Table 4 lists the details of the optimized components. Figure 10 displays the optimized system. Table 5 summarizes the system information for the optimized components.
Table 4.
The proposed system’s optimization results of Model 1.
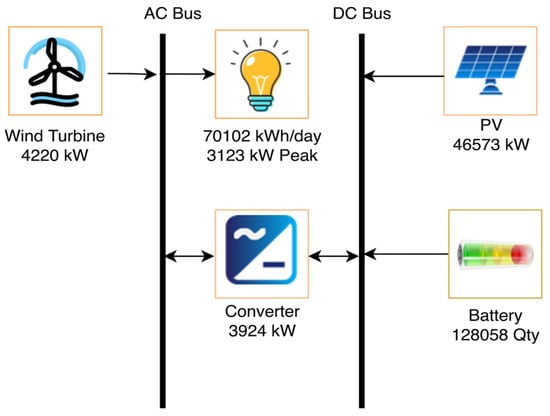
Figure 10.
The optimized system architecture of Model 1.
Table 5.
Optimized component details of Model 1.
With peak loads of 3123 kW, the total daily electricity usage in Gwadar is 70,102 kWh. The following generating sources would be used by the proposed system to meet the electrical load. The results showed that a Model 1 system had the lowest COE (0.401/kWh) over the course of the project and the highest fraction of renewable energy (100%).
Electricity Generation, Consumption, and Cost
As indicated in Table 3, the optimized system generated 100% renewable energy, with solar PV accounting for 75,705,768 kWh/year and wind turbines for 5,859,989 kWh/year. Figure 11 displays an overview of the monthly electric output from PV and GT10. Figure 12 shows the output of a solar photovoltaic system with a standard wind turbine. Figure 13 shows the cost analysis for Model 1. Table 6 and Table 7 show the net present costs and annualized costs of Model 1.
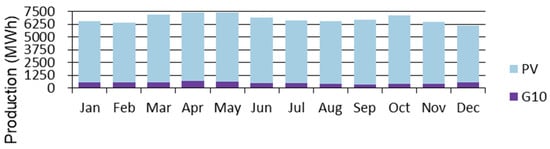
Figure 11.
Monthly electric production of solar PV and GT10.
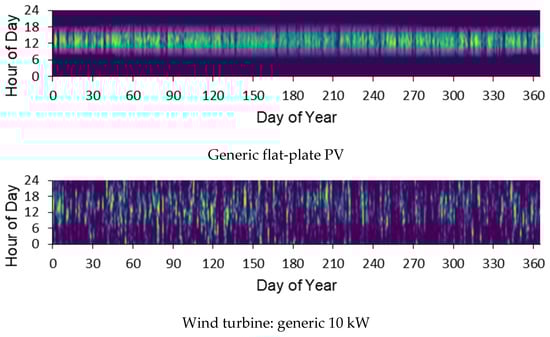
Figure 12.
Solar PV output and generic wind turbine output.
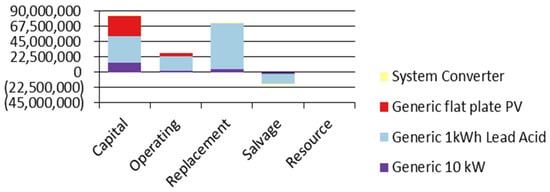
Figure 13.
Cost Graph for Model 1.
Table 6.
Net present costs of Model 1 (USD).
Table 7.
Annualized cost of Model 1 (USD).
3.1.2. Model 2
Results of the optimization for plant 4867+5Q at Gwadar, Pakistan (25′6.6″ N, 62′18.9″ E) demonstrate how the system uses each component. Following a cost study of several system configurations and their capacities, the HOMER PRO selected the model with the lowest COE and maximum percentage of renewable energy. Homer has two control dispatch strategies: cycle charging (CC) and load following (LF) [58]. The dispatch strategy used in Model 2 was cycle charging (CC). The long-term viability of the energy system was assessed using the simulation method. The hourly simulation results are given in several configurations, using the illustrated reference case system in light blue. In this case, four alternative situations were assessed among various energy systems in order to identify the ideal layout for the given configuration system of Gwadar to meet its load demand. Table 8 provides information on the optimized components. The system details for the optimized components with size and electricity production are listed in Table 9. The optimized system architecture of Model 2 is shown in Figure 14.
Table 8.
The optimization results of Model 2.
Table 9.
Optimized components details of Model 2.
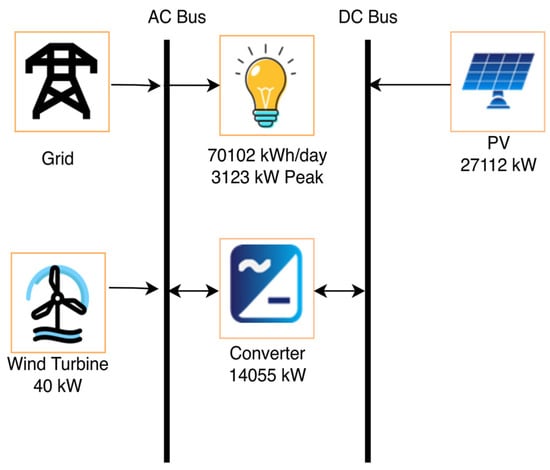
Figure 14.
The optimized system architecture of Model 2.
The total daily electricity consumption in Gwadar is 70,102 kWh, with peak loads of 3123 kW. The planned system used the production sources to handle the electrical load. The findings showed that a Model 2 system had the largest percentage of renewable energy (73.3%) and the lowest COE (0.0347/kWh) over the life of the project.
Electricity Generation, Consumption, and Cost
Table 6 shows that the optimized system would produce 76.6% renewable energy, with solar PV accounting for 43,919,754 kWh per year and wind turbines for 55,545 kWh per year; 13,452,374 kWh per year, or 23.4% of the total energy, would be bought from the grid. The monthly electric output from PVs and the grid are shown in Figure 15 as a summary. A solar photovoltaic system with a typical grid is shown in Figure 16 as its output. The cost analysis for Model 2 is displayed in Figure 17. Table 10 and Table 11 present the annualized and net present costs for Model 2, respectively.
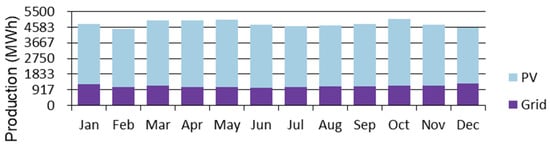
Figure 15.
Monthly electric production of solar PV panels and grid.
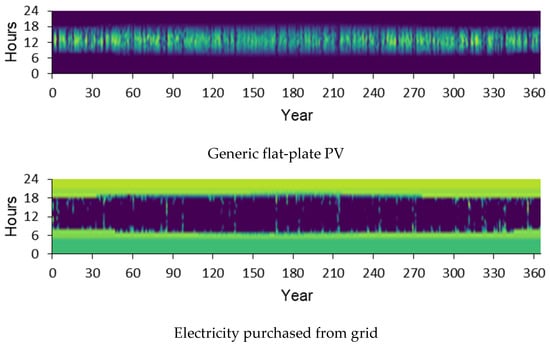
Figure 16.
Solar PV output and grid output.
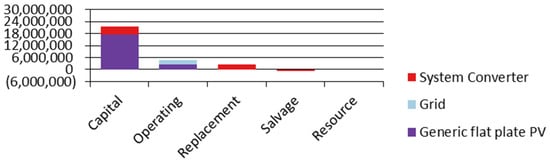
Figure 17.
Cost graph for Model 2.
Table 10.
Net present costs of Model 2 (USD).
Table 11.
Annualized cost of Model 2 (USD).
3.1.3. Model 3
Optimization results for plant 4867+5Q Gwadar, Pakistan (25′6.6″ N, 62′18.9″ E) show how the system makes use of each component. Following a cost analysis of several system configurations and capacities, HOMER PRO chose the model with the lowest COE and the highest percentage of renewable energy. Homer Pro has two control dispatch strategies: cycle charging (CC) and load following (LF) [58]. Cycle charging was the dispatch strategy employed. The simulation method was used to examine the long-term viability of energy systems. Displaying the illustrated reference case system in light blue, the hourly simulation produced a number of possibilities. In this case, four distinct scenarios were evaluated among several created energy systems in order to discover the optimal layout for Gwadar’s given configuration system in order to meet the load demand requirement. Table 12 shows the system with the highest level of optimization. Table 13 lists the system details for the optimized components. The optimized system architecture of Model 3 is shown in Figure 18.
Table 12.
The optimization results of Model 3 (USD).
Table 13.
Optimized component details of Model 3.
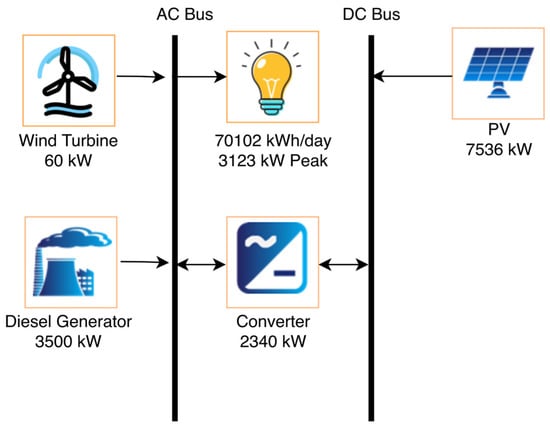
Figure 18.
The optimized system architecture of Model 3.
To meet the required electrical load, the designed system employed the specified sources. The data revealed that a Model 3 system had the lowest percentage of renewable energy (23.7%) and the lowest COE (0.184/kWh) over the course of the project.
Electricity Generation, Consumption, and Cost
Table 9 demonstrates that the optimized system generated 23.7% renewable energy, with solar PV accounting for 11,971,131 kWh per year, wind turbines accounting for 83,317 kWh per year, and diesel generator accounting for 18,347,378 kWh per year. Figure 19 summarizes the monthly power output from the PV panels and diesel generator. Figure 20 depicts the output of a solar photovoltaic system with a diesel generator. Figure 21 depicts the cost analysis for Model 3. Table 14 and Table 15 show the annualized and net current costs for Model 3.
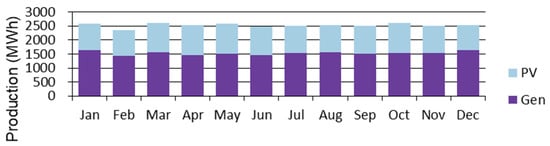
Figure 19.
Monthly electric production of solar PV panels and diesel generator.
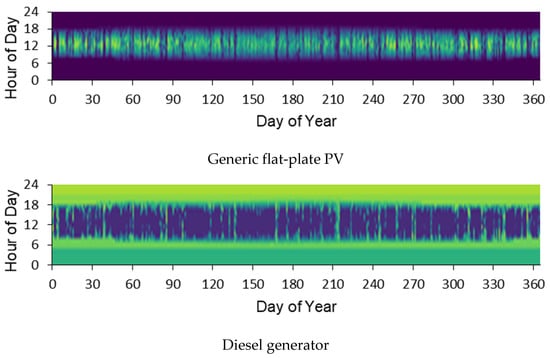
Figure 20.
Solar PV output and diesel generator output.
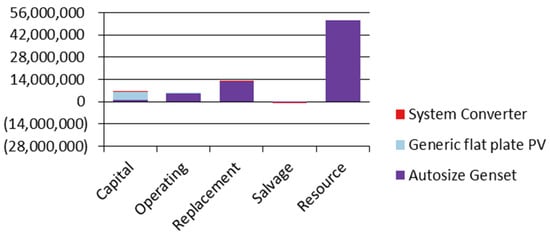
Figure 21.
Cost graph for Model 3.
Table 14.
Net present costs of Model 3 (USD).
Table 15.
Annualized Cost of Model 3 (USD).
4. Sensitivity Analysis
Certain variables can have a direct impact on both the economic and technical performance of the proposed system. As a result, a sensitivity analysis was performed to evaluate the impact of some parameters on the system’s output. Discount rate and wind turbine hub height are two examples. As shown in Figure 22, the effect of the discount rate on the economic viability of the three models is quite significant; the NPC decreases as the discount rate increases. The discounting process is critical in such analyses because it assists decision-makers and investors in understanding the benefits and costs of policies with long-term consequences. Interested parties can use discounting to adjust the difference between present and future values to ensure that the project’s benefits and costs are consistently compared. The NPC of all three models decreases as the discount rate increases, and the LCOE increases as the discount increases. They both have direct relationships. The effect of hub height also impacts on NPC and LCOE. In the table it is clearly shown that if hub height increases, the NPC and LCOE both decrease. The reason is that at height the wind speed is more stable due to which constant electricity is generated, which helps to decrease the NPC and LCOE.
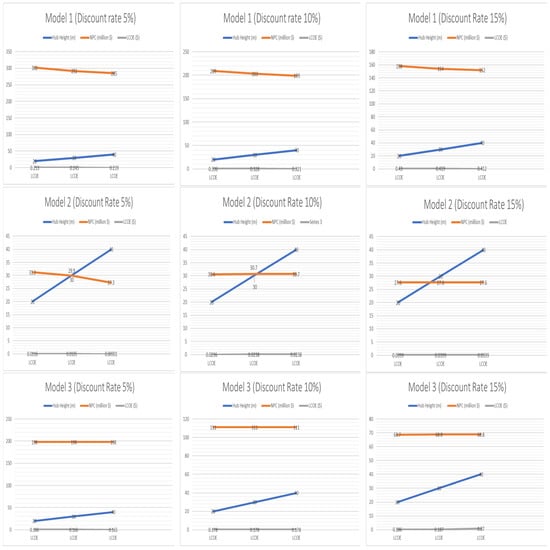
Figure 22.
Sensitivity analysis.
5. Technical Analysis
Model 2 was recognized as an optimum system based on the results, and its features are described in this section. Gwadar receives enough solar radiation and wind to generate electricity, which is why this model was created. These models are PV/wind/battery (Model 1), PV/wind/grid (model 2), and PV/wind/diesel generator (Model 3). This study simulated the technical performance of three models under base case average solar radiation 5.19 kWh/m2/day and wind 4.72 m/s. The results from the simulation showed electricity produced by Model 1, Model 2, and Model 3 would be 81,565,754 kWh/yr, 57,372,128 kWh/yr, and 30,318,510 kWh/yr, respectively. The electricity produced from these models would depend mainly on renewable energy sources. Model 1, Model 2, and Model 3 had 100%, 73.3%, and 28.8% renewable energy fractions, respectively. Model 2 is preferable because the electricity cost would be less than that under the other two models and give 73.3% power from RES.
6. Economic Analysis
The NPC values of Model 1, Model 2, and Model 3 are USD 166 M, USD 28.2 M, and USD 76.4 M respectively. The cost of Model 1 is high due to battery storage attached to the system. In Model 1, a battery is necessary because backup batteries are the only source. For Model 3, a diesel generator is attached due to fuel costs and its NPC is high. Model 2 is preferable in this case. Due to the low NPC of Model 2, its LCOE is also lowest among the 3 models. Model 2′s LCOE is USD 0.0347/kWh; USD 0.401/kWh and USD 0.184/kWh are the LCOE values of Model 1 and Model 3, respectively. The LCOE of Model 1 is less than the current tariff rate of Pakistan [59]. The salvage cost for Model 1 is USD 42,167,420, for Model 2 is USD 1,405,500, and for Model 3 is USD 785,865. This validates what is already known: while renewable energy projects may have a high initial cost, their operating costs after commissioning are significantly lower than those of fossil fuel power plants. Table 16 shows important economic indicators of all selected models. The simple payback period of Model 2 is longer than that of the others, due to the lowest LCOE. That is fine because consumers would have cheap electricity.
Table 16.
Economic indicators.
7. Environmental Impact of Model
Nowadays, electricity generated by renewable energy sources is considered to be eco-friendly because it contributes to decarbonizing the energy sector. RES do not produce carbon dioxide but still can have an impact on environment. That is why RES should be carefully selected for electricity generation at any power plant. Careful analysis of the results shows that if RES is not selected properly, then it will have a very harmful impact on the environment. Table 17 shows the greenhouse gas emissions of all three models. Model 1 uses only RES to generate electricity, which is why it has a 100% renewable fraction, while Model 2 purchases electricity from the grid, due to which its renewable energy fraction is lower at 73.3%. Model 3 completely relies on diesel generators for backup due to which it has a low renewable fraction.
Table 17.
Renewable energy fraction and emissions of models.
To the best of the authors’ knowledge, a techno-economic analysis for Gwadar has never been done before. As a result, the authors are unable to find any existing method with which the results could be compared in the existing literature. This study can be used to analyze the options available for fulfilling the power needs of a certain area using different models with a different set of renewable/conventional sources. This study was for Gwadar, which is a coastal area. So this study can be used to analyze different coastal areas, such as Tanzania, Mozambique, and Cape Town in Africa.
The event-driven tools are beneficial in terms of the computational effectiveness and real-time compression [60,61,62]. The incorporation of optimization algorithms can also enhance assessment studies [63,64,65]. The feasibility of incorporating these tools into the suggested assessment method can be investigated in future.
8. Limitation of Study
Every study has some limitations due to different reasons. In this study, limitations are that this design is only for the location of Gwadar; if the location is changed the results will be different. Another limitation is that Homer software is used to produce results and these results are theoretical results, which are close to actual results but not actual results.
9. Conclusions
Pakistan imports electricity from Iran because of the absence of a national grid in Gwadar city. Pakistan’s electricity constraints are also a hindrance for electricity transmission to Gwadar city. Therefore, microgrids were studied in this research. Wind turbines and PV modules were selected to fulfill the 70 MW load demand.
- (1)
- Three different models have been considered. Model 1 comprised wind turbines, PV cells, a converter and a battery system. Model 2 consisted of wind turbines, PV cells, a grid and a converter, while Model 3 consisted of wind turbines, PV cells, converters and diesel generators.
- (2)
- The LCOEs for Model 1, Model 2, and Model 3 were respectively USD 0.401/kWh, USD 0.0347/kWh, and USD 0.185/kWh.
- (3)
- The simple payback period of Model 1 is 6.70 years, for Model 2 it is 7.77 years, and for Model 3 it is 4.98 years.
- (4)
- Renewable fractions for of Model 1, Model 2, and Model 3 are respectively 100%, 73.3%, and 28.7%.
Due to the high LCOE of Model 1, and significant renewable fraction of Model 2, it is evident that Model 2 is the optimal solution. This study will help the consumers of Gwadar to have cheap electricity. Based on the success of a previously installed 100 MW solar power plant in the city of Bahawalpur, the government of Pakistan can install the devised model in the city of Gwadar. It is a promising approach instead of installing a long-distance, 622.3 km transmission line from the city of Karachi to Gwadar. Under this scenario, Pakistan would not need to import electricity from Iran. Furthermore, when the electricity issue is resolved for Gwadar, new industries will open up and improve the economy and lower Pakistan’s unemployment. The devised method is compared with the previously presented counterparts and a summary is presented in Table 18. It is shown that the devised method has a lower LCOE.
Table 18.
Comparative studies elsewhere.
10. Direction for Future Work
- (1)
- Homer Pro uses mixed integer linear programming to calculate the results. These findings can be also be obtained by using alternate approaches such as heuristic algorithms.
- (2)
- Prediction of renewable energy sources can be done by using artificial intelligence techniques. These techniques can forecast the solar and wind energy requirements and production. In future, these findings can be incorporated into a microgrid to obtain results.
- (3)
- If a microgrid is connected with the national grid and grid of Iran, then it will utilize power accordingly. The values obtained can be compared and checked for feasibility.
- (4)
- A techno-economic analysis of generation can be done focused on load variation.
Author Contributions
Conceptualization, M.S.A., S.U.A., A.W. and S.M.Q.; methodology, M.S.A., S.U.A., A.W. and S.M.Q.; implementation, M.S.A. and S.U.A.; validation, S.U.A., S.M.Q., F.H. and A.W.; formal analysis, M.S.A., S.U.A., F.H. and A.W.; investigation, S.U.A., A.W. and F.H.; resources, A.W. and A.A.; writing—original draft preparation, M.S.A., S.U.A. and A.W.; writing—review and editing, S.M.Q., A.W., F.H. and A.A.; visualization, M.S.A. and S.U.A.; supervision, A.W. and S.M.Q.; project administration, S.M.Q., A.W. and A.A.; funding acquisition, S.M.Q. and A.A. All authors have read and agreed to the published version of the manuscript.
Funding
The authors would like to thank the Deanship of Scientific Research at Najran University for funding this work under the Research Collaboration Funding program grant code (NU/RC/SERC/11/1).
Institutional Review Board Statement
Not applicable.
Informed Consent Statement
Not applicable.
Data Availability Statement
Not applicable.
Acknowledgments
The authors are grateful to Bahria School of Engineering and Applied Sciences, Bahria University Islamabad and Effat University, Jeddah, Saudi Arabia for technical support. The authors also acknowledge financial support from the Deanship of Scientific Research at Najran University for funding this work under the Research Collaboration Funding program grant code (NU/RC/SERC/11/1).
Conflicts of Interest
The authors declare no conflict of interest.
References
- Norouzi, N. The Pahlev Reliability Index: A measurement for the resilience of power generation technologies versus climate change. Nucl. Eng. Technol. 2021, 53, 1658–1663. [Google Scholar] [CrossRef]
- Khan, H.; Khan, I.; BiBi, R. The role of innovations and renewable energy consumption in reducing environmental degradation in OECD countries: An investigation for Innovation Claudia Curve. Environ. Sci. Pollut. Res. 2022, 29, 43800–43813. [Google Scholar] [CrossRef] [PubMed]
- Norouzi, N.; Bozorgian, A.; Dehghani, M.A. Best Option of Investment in Renewable Energy: A Multicriteria Decision-Making Analysis for Iranian Energy Industry. J. Environ. Assess. Policy Manag. 2020, 22, 2250001. [Google Scholar] [CrossRef]
- Bhol, S.; Sahu, N.C. Decarbonizing the grid by optimal scheduling of solar PV-wind turbine-pumped hydro storage considering application on heuristic algorithms: A comprehensive review. Int. J. Energy Res. 2021, 45, 18473–18497. [Google Scholar] [CrossRef]
- Otsuki, T. Costs and benefits of large-scale deployment of wind turbines and solar PV in Mongolia for international power exports. Renew. Energy 2017, 108, 321–335. [Google Scholar] [CrossRef]
- Sunderland, K.; Narayana, M.; Putrus, G.; Conlon, M. Levelised cost of energy analysis: A comparison of urban (micro) wind turbines and solar PV systems. In Proceedings of the 2016 51st International Universities Power Engineering Conference (UPEC), Coimbra, Portugal, 6–9 September 2016; pp. 1–6. [Google Scholar]
- Shoeibi, S. Numerical Analysis of Optimizing a Heat Sink and Nanofluid Concentration Used in a Thermoelectric Solar Still: An Economic and Environmental Study. Environ. Res. Eng. Manag. 2021, 77, 110–122. [Google Scholar] [CrossRef]
- Shoeibi, S.; Kargarsharifabad, H.; Mirjalily, S.A.A.; Zargarazad, M. Performance analysis of finned photovoltaic/thermal solar air dryer with using a compound parabolic concentrator. Appl. Energy 2021, 304, 117778. [Google Scholar] [CrossRef]
- Kazerani, M.; Tehrani, K. Grid of Hybrid AC/DC Microgrids: A New Paradigm for Smart City of Tomorrow. In Proceedings of the 2020 IEEE 15th International Conference of System of Systems Engineering (SoSE), Budapest, Hungary, 2–4 June 2020; pp. 175–180. [Google Scholar]
- Agyekum, E.B.; Nutakor, C. Feasibility study and economic analysis of stand-alone hybrid energy system for southern Ghana. Sustain. Energy Technol. Assess. 2020, 39, 100695. [Google Scholar] [CrossRef]
- Ampah, J.D.; Afrane, S.; Agyekum, E.B.; Adun, H.; Yusuf, A.A.; Bamisile, O. Electric vehicles development in Sub-Saharan Africa: Performance assessment of standalone renewable energy systems for hydrogen refuelling and electricity charging stations (HRECS). J. Clean. Prod. 2022, 376, 134238. [Google Scholar] [CrossRef]
- Das, M.; Singh, M.A.K.; Biswas, A. Techno-economic optimization of an off-grid hybrid renewable energy system using metaheuristic optimization approaches–Case of a radio transmitter station in India. Energy Convers. Manag. 2019, 185, 339–352. [Google Scholar] [CrossRef]
- Baghel, N.S.; Chander, N. Performance comparison of mono and polycrystalline silicon solar photovoltaic modules under tropical wet and dry climatic conditions in east-central India. Clean Energy 2022, 6, 165–177. [Google Scholar] [CrossRef]
- Jiang, S.; Song, Z. A review on the state of health estimation methods of lead-acid batteries. J. Power Sources 2022, 517, 230710. [Google Scholar] [CrossRef]
- Türkay, B.E.; Telli, A.Y. Economic analysis of standalone and grid connected hybrid energy systems. Renew. Energy 2011, 36, 1931–1943. [Google Scholar] [CrossRef]
- IEA. World Energy Outlook; IEA: Paris, France, 2019; Available online: https://www.iea.org/reports/world-energy-outlook-2019 (accessed on 10 July 2022).
- Carvajal-Romo, G.; Valderrama-Mendoza, M.; Rodríguez-Urrego, D.; Rodríguez-Urrego, L. Assessment of solar and wind energy potential in La Guajira, Colombia: Current status, and future prospects. Sustain. Energy Technol. Assess. 2019, 36, 100531. [Google Scholar] [CrossRef]
- Strambo, C.; González Espinosa, A.C. Extraction and development: Fossil fuel production narratives and counternarratives in Colombia. Clim. Policy 2020, 20, 931–948. [Google Scholar] [CrossRef]
- Calderón, S.; Alvarez, A.C.; Loboguerrero, A.M.; Arango, S.; Calvin, K.; Kober, T.; Daenzer, K.; Fisher-Vanden, K. Achieving CO2 reductions in Colombia: Effects of carbon taxes and abatement targets. Energy Econ. 2016, 56, 575–586. [Google Scholar] [CrossRef]
- Valencia, G.; Benavides, A.; Cárdenas, Y. Economic and Environmental Multiobjective Optimization of a Wind–Solar–Fuel Cell Hybrid Energy System in the Colombian Caribbean Region. Energies 2019, 12, 2119. [Google Scholar] [CrossRef]
- Nieves, J.A.; Aristizábal, A.J.; Dyner, I.; Báez, O.; Ospina, D.H. Energy demand and greenhouse gas emissions analysis in Colombia: A LEAP model application. Energy 2019, 169, 380–397. [Google Scholar] [CrossRef]
- Haghighat Mamaghani, A.; Avella Escandon, S.A.; Najafi, B.; Shirazi, A.; Rinaldi, F. Techno-economic feasibility of photovoltaic, wind, diesel and hybrid electrification systems for off-grid rural electrification in Colombia. Renew. Energy 2016, 97, 293–305. [Google Scholar] [CrossRef]
- Ram, M.; Aghahosseini, A.; Breyer, C. Job creation during the global energy transition towards 100% renewable power system by 2050. Technol. Forecast. Soc. Chang. 2020, 151, 119682. [Google Scholar] [CrossRef]
- Abdul-Wahab, S.; Mujezinovic, K.; Al-Mahruqi, A.M. Optimal design and evaluation of a hybrid energy system for off-grid remote area. Energy Sources Part Recover. Util. Environ. Eff. 2019, 44, 4964–4976. [Google Scholar] [CrossRef]
- Al Ghaithi, H.M.; Fotis, G.P.; Vita, V. Techno-Economic Assessment of Hybrid Energy Off-Grid System—A Case Study for Masirah Island in Oman. Int. J. Power Energy Res. 2017, 1, 103–116. [Google Scholar] [CrossRef]
- Iten, M.; Liu, S.; Shukla, A. Experimental validation of an air-PCM storage unit comparing the effective heat capacity and enthalpy methods through CFD simulations. Energy 2018, 155, 495–503. [Google Scholar] [CrossRef]
- Ma, W.; Xue, X.; Liu, G. Techno-economic evaluation for hybrid renewable energy system: Application and merits. Energy 2018, 159, 385–409. [Google Scholar] [CrossRef]
- Haoyang, W.; Lei, G.; Ying, J. The predicament of clean energy technology promotion in China in the carbon neutrality context: Lessons from China’s environmental regulation policies from the perspective of the evolutionary game theory. Energy Rep. 2022, 8, 4706–4723. [Google Scholar] [CrossRef]
- Li, B.; Haneklaus, N. The role of clean energy, fossil fuel consumption and trade openness for carbon neutrality in China. Energy Rep. 2022, 8, 1090–1098. [Google Scholar] [CrossRef]
- Waewsak, J.; Chancham, C.; Mani, M.; Gagnon, Y. Estimation of Monthly Mean Daily Global Solar Radiation over Bangkok, Thailand Using Artificial Neural Networks. Energy Procedia 2014, 57, 1160–1168. [Google Scholar] [CrossRef]
- Waewsak, J.; Ali, S.; Natee, W.; Kongruang, C.; Chancham, C.; Gagnon, Y. Assessment of hybrid, firm renewable energy-based power plants: Application in the southernmost region of Thailand. Renew. Sustain. Energy Rev. 2020, 130, 109953. [Google Scholar] [CrossRef]
- Devrim, Y.; Bilir, L. Performance investigation of a wind turbine–solar photovoltaic panels–fuel cell hybrid system installed at İncek region–Ankara, Turkey. Energy Convers. Manag. 2016, 126, 759–766. [Google Scholar] [CrossRef]
- Suresh, V.; Muralidhar, M.; Kiranmayi, R. Modelling and optimization of an off-grid hybrid renewable energy system for electrification in a rural areas. Energy Rep. 2020, 6, 594–604. [Google Scholar] [CrossRef]
- Mahmoud, F.S.; Diab, A.A.Z.; Ali, Z.M.; El-Sayed, A.-H.M.; Alquthami, T.; Ahmed, M.; Ramadan, H.A. Optimal sizing of smart hybrid renewable energy system using different optimization algorithms. Energy Rep. 2022, 8, 4935–4956. [Google Scholar] [CrossRef]
- Odoi-Yorke, F.; Owusu, J.J.; Atepor, L. Composite decision-making algorithms for optimisation of hybrid renewable energy systems: Port of Takoradi as a case study. Energy Rep. 2022, 8, 2131–2150. [Google Scholar] [CrossRef]
- Aktaş, A.; Kırçiçek, Y. A novel optimal energy management strategy for offshore wind/marine current/battery/ultracapacitor hybrid renewable energy system. Energy 2020, 199, 117425. [Google Scholar] [CrossRef]
- Gao, X.; Wang, L.; Sun, H.; Tian, J.; Wang, Z.; Jiang, J.; Guo, W. Research on optimal configuration of hybrid energy storage system based on improved CEEMDAN. Energy Rep. 2021, 7, 1308–1318. [Google Scholar] [CrossRef]
- Aziz, A.S.; Tajuddin, M.F.N.; Adzman, M.R.; Azmi, A.; Ramli, M.A.M. Optimization and sensitivity analysis of standalone hybrid energy systems for rural electrification: A case study of Iraq. Renew. Energy 2019, 138, 775–792. [Google Scholar] [CrossRef]
- Odoi-Yorke, F.; Woenagnon, A. Techno-economic assessment of solar PV/fuel cell hybrid power system for telecom base stations in Ghana. Cogent Eng. 2021, 8, 1911285. [Google Scholar] [CrossRef]
- Zahedi, R.; Ahmadi, A.; Sadeh, M. Investigation of the load management and environmental impact of the hybrid cogeneration of the wind power plant and fuel cell. Energy Rep. 2021, 7, 2930–2939. [Google Scholar] [CrossRef]
- Halabi, L.M.; Mekhilef, S.; Olatomiwa, L.; Hazelton, J. Performance analysis of hybrid PV/diesel/battery system using HOMER: A case study Sabah, Malaysia. Energy Convers. Manag. 2017, 144, 322–339. [Google Scholar] [CrossRef]
- Hussain, S.; Khan, M.A. CPEC; A Roadmap of Region’s Development. FWU J. Soc. Sci. 2017, 11, 51–59. [Google Scholar]
- Revised Tariff Petition CIHC, National Electric Power Regulatory Authority. 2018. Available online: https://nepra.org.pk/tariff/Tariff/Petitions/2018/Revised%20Tariff%20Petition%20CIHC.pdf (accessed on 25 July 2022).
- Gwadar, Pakistan Map. Available online: https://goo.gl/maps/TMBW8Eyu8huCUyYq6 (accessed on 25 July 2022).
- Approval of the Authority with Respect to Extension of Tariff between NTDC & TAVANIR. Available online: https://nepra.org.pk/tariff/Tariff/CPPAG/2020/PAR-137%20Amendment%2014-01-2020%201062-64.PDF (accessed on 28 July 2022).
- Quetta Electric Supply Company, Electricity Demand Forcast. Available online: https://ntdc.gov.pk/ntdc/public/uploads/services/planning/pms%20load%20forecasts%202014/qesco.pdf (accessed on 5 August 2022).
- Shi, D.; Li, R.; Shi, R.; Li, F. Analysis of the relationship between load profile and weather condition. In Proceedings of the 2014 IEEE PES General Meeting Conference & Exposition, National Harbor, MD, USA, 27–31 July 2014; pp. 1–5. [Google Scholar]
- HOMER Help Files; HOMER Pro Version 3.14.5; HOMER Grid: Boulder, CO, USA, 2021; Available online: https://www.homerenergy.com/pdf/HOMER2_2.8_HelpManual.pdf (accessed on 10 August 2022).
- Tahir, M.U.R.; Amin, A.; Baig, A.A.; Manzoor, S.; Haq, A.U.; Asgha, M.A.; Khawaja, W.A.G. Design and optimization of grid Integrated hybrid on-site energy generation system for rural area in AJK-Pakistan using HOMER software. AIMS Energy 2021, 9, 1113–1135. [Google Scholar] [CrossRef]
- Kamran, M.; Asghar, R.; Mudassar, M.; Ahmed, S.R.; Fazal, M.R.; Abid, M.I.; Zameer, M.Z. Designing and Optimization of Stand-alone Hybrid Renewable Energy System for Rural Areas of Punjab, Pakistan. Int. J. Renew. Energy Res. 2018, 8, 2585–2597. [Google Scholar] [CrossRef]
- Basheer, Y.; Waqar, A.; Qaisar, S.M.; Ahmed, T.; Ullah, N.; Alotaibi, S. Analyzing the Prospect of Hybrid Energy in the Cement Industry of Pakistan, Using HOMER Pro. Sustainability 2022, 14, 12440. [Google Scholar] [CrossRef]
- Icaza-Alvarez, D.; Jurado, F.; Tostado-Véliz, M.; Arevalo, P. Design to include a wind turbine and socio-techno-economic analysis of an isolated airplane-type organic building based on a photovoltaic/hydrokinetic/battery. Energy Convers. Manag. X 2022, 14, 100202. [Google Scholar] [CrossRef]
- Reference Manual for the System Advisor Model’s Wind Power Performance Model (NREL, 2014). Available online: https://www.nrel.gov/docs/fy14osti/60570.pdf (accessed on 15 August 2022).
- Zubair, M. Analysis of net-zero energy housing society in Gwadar Pakistan to mitigate the load shedding problem. J. Renew. Sustain. Energy 2018, 10, 065906. [Google Scholar] [CrossRef]
- Pakistan Interest Rates. Available online: https://countryeconomy.com/key-rates/pakistan (accessed on 19 August 2022).
- Inflation of Pakistan(Report). Available online: https://www.sbp.org.pk/publications/Inflation_Monitor/2022/Aug/IM_Aug_2022.pdf (accessed on 5 September 2022).
- Lu, J.; Wang, W.; Zhang, Y.; Cheng, S. Multi-Objective Optimal Design of Stand-Alone Hybrid Energy System Using Entropy Weight Method Based on HOMER. Energies 2017, 10, 1664. [Google Scholar] [CrossRef]
- Toopshekan, A.; Yousefi, H.; Astaraei, F.R. Technical, economic, and performance analysis of a hybrid energy system using a novel dispatch strategy. Energy 2020, 213, 118850. [Google Scholar] [CrossRef]
- Pakistan Electricity Tariff. Available online: https://nepra.org.pk/consumer%20affairs/Electricity%20Bill.php (accessed on 20 September 2022).
- Qaisar, S.M. A two stage interpolator and multi threshold discriminator for the Brain-PET scanner timestamp calculation. In Nuclear Instruments and Methods in Physics Research Section A: Accelerators, Spectrometers, Detectors and Associated Equipment; Elsevier: Amsterdam, The Netherlands, 2019; Volume 922, pp. 364–372. [Google Scholar] [CrossRef]
- Mian Qaisar, S.; Alsharif, F. Signal piloted processing of the smart meter data for effective appliances recognition. J. Electr. Eng. Technol. 2020, 15, 2279–2285. [Google Scholar] [CrossRef]
- Qaisar, S.M.; Khan, S.I.; Dallet, D.; Tadeusiewicz, R.; Pławiak, P. Signal-piloted processing metaheuristic optimization and wavelet decomposi-tion based elucidation of arrhythmia for mobile healthcare. Biocybernet. Biomed. Eng. 2022, 42, 681–694. [Google Scholar] [CrossRef]
- Abbas, A.; Qaisar, S.M.; Waqar, A.; Ullah, N.; Al Ahmadi, A.A. Min-Max Regret-Based Approach for Sizing and Placement of DGs in Distribution System under a 24 h Load Horizon. Energies 2022, 15, 3701. [Google Scholar] [CrossRef]
- Rani, S.; Koundal, D.; Ijaz, M.F.; Elhoseny, M.; Alghamdi, M.I. An optimized framework for WSN routing in the context of industry 4.0. Sensors. Sensors 2021, 21, 6474. [Google Scholar] [CrossRef]
- Basak, H.; Kundu, R.; Singh, P.K.; Ijaz, M.F.; Woźniak, M.; Sarkar, R. A union of deep learning and swarm-based optimization for 3D human action recognition. Sci. Rep. 2022, 12, 5494. [Google Scholar] [CrossRef] [PubMed]
- Adil Khan, M.; Aziz, M.S.; Khan, A.; Zeb, K.; Uddin, W.; Ishfaq, M. An Optimized Off-gird Renewable AC/DC Microgrid for Remote Communities of Pakistan. In Proceedings of the 2019 International Conference on Electrical, Communication, and Computer Engineering (ICECCE), Swat, Pakistan, 24–25 July 2019; pp. 1–6. [Google Scholar]
Publisher’s Note: MDPI stays neutral with regard to jurisdictional claims in published maps and institutional affiliations. |
© 2022 by the authors. Licensee MDPI, Basel, Switzerland. This article is an open access article distributed under the terms and conditions of the Creative Commons Attribution (CC BY) license (https://creativecommons.org/licenses/by/4.0/).