


Data Type and Data Sources for Agricultural Big Data and Machine Learning

 ,
, 
 ,
,
Abstract
1. Introduction
2. Background
2.1. Agricultural Big Data
2.2. Machine Learning
2.3. Data
2.3.1. Structured Data
2.3.2. Semi-Structured Data
2.3.3. Unstructured Data
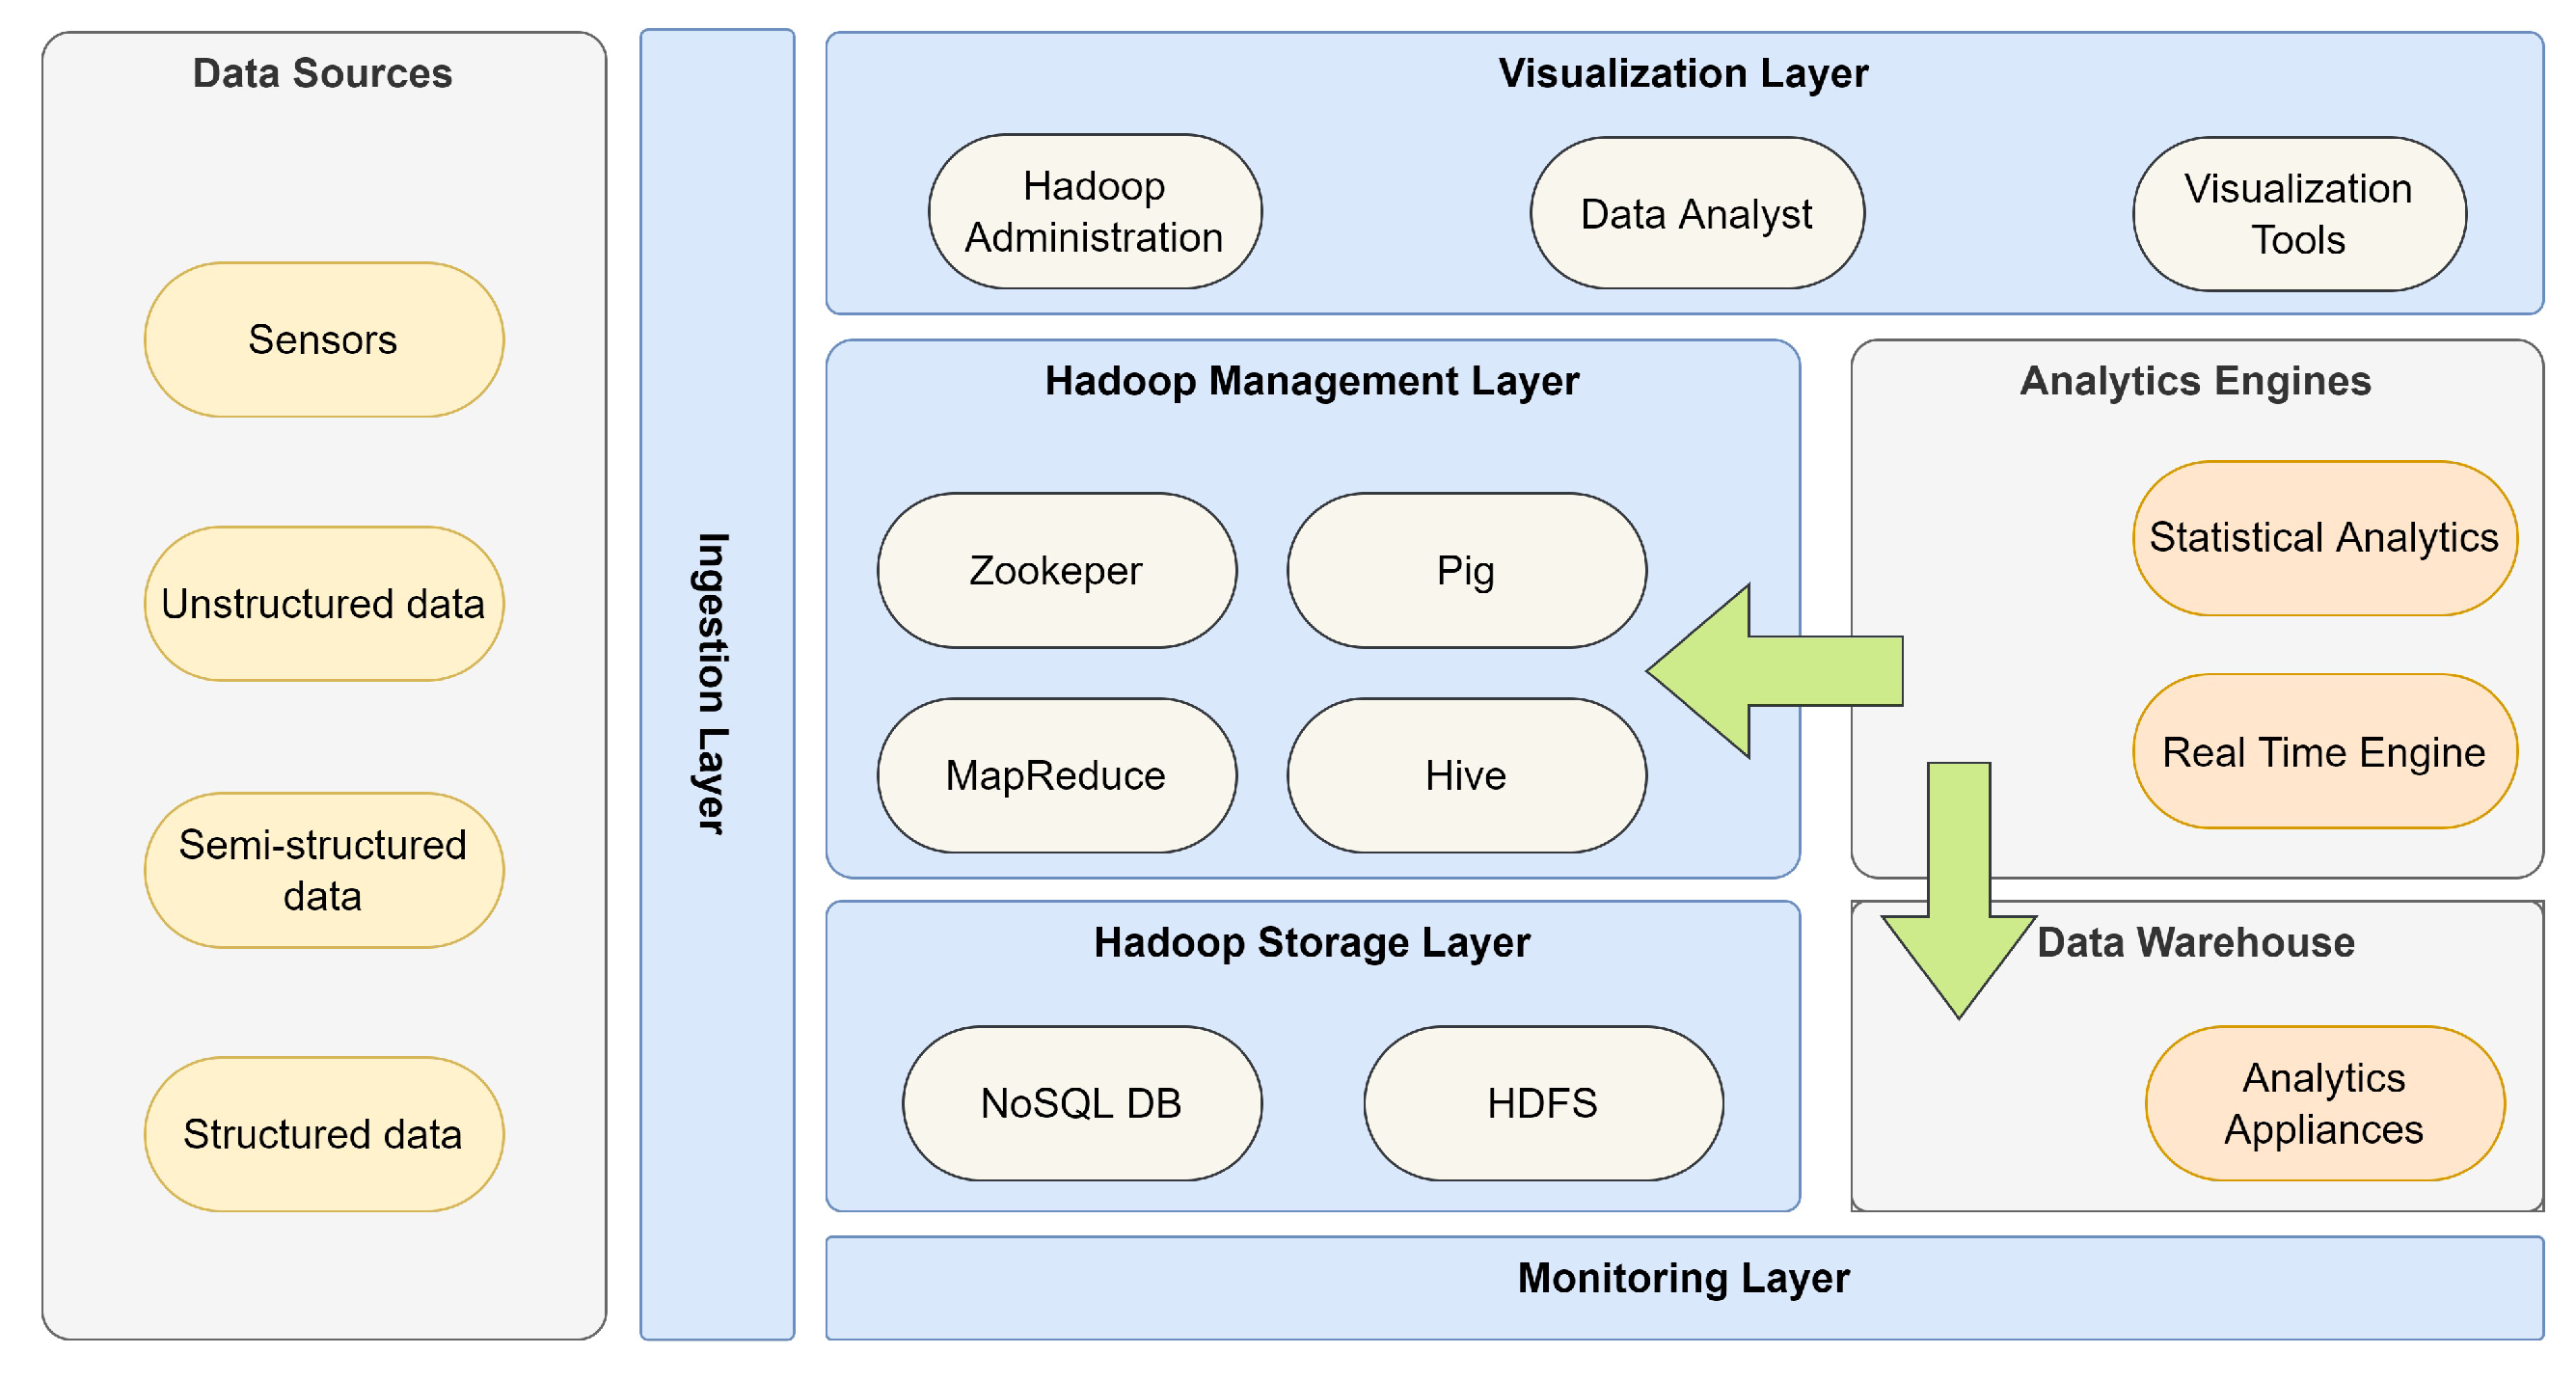
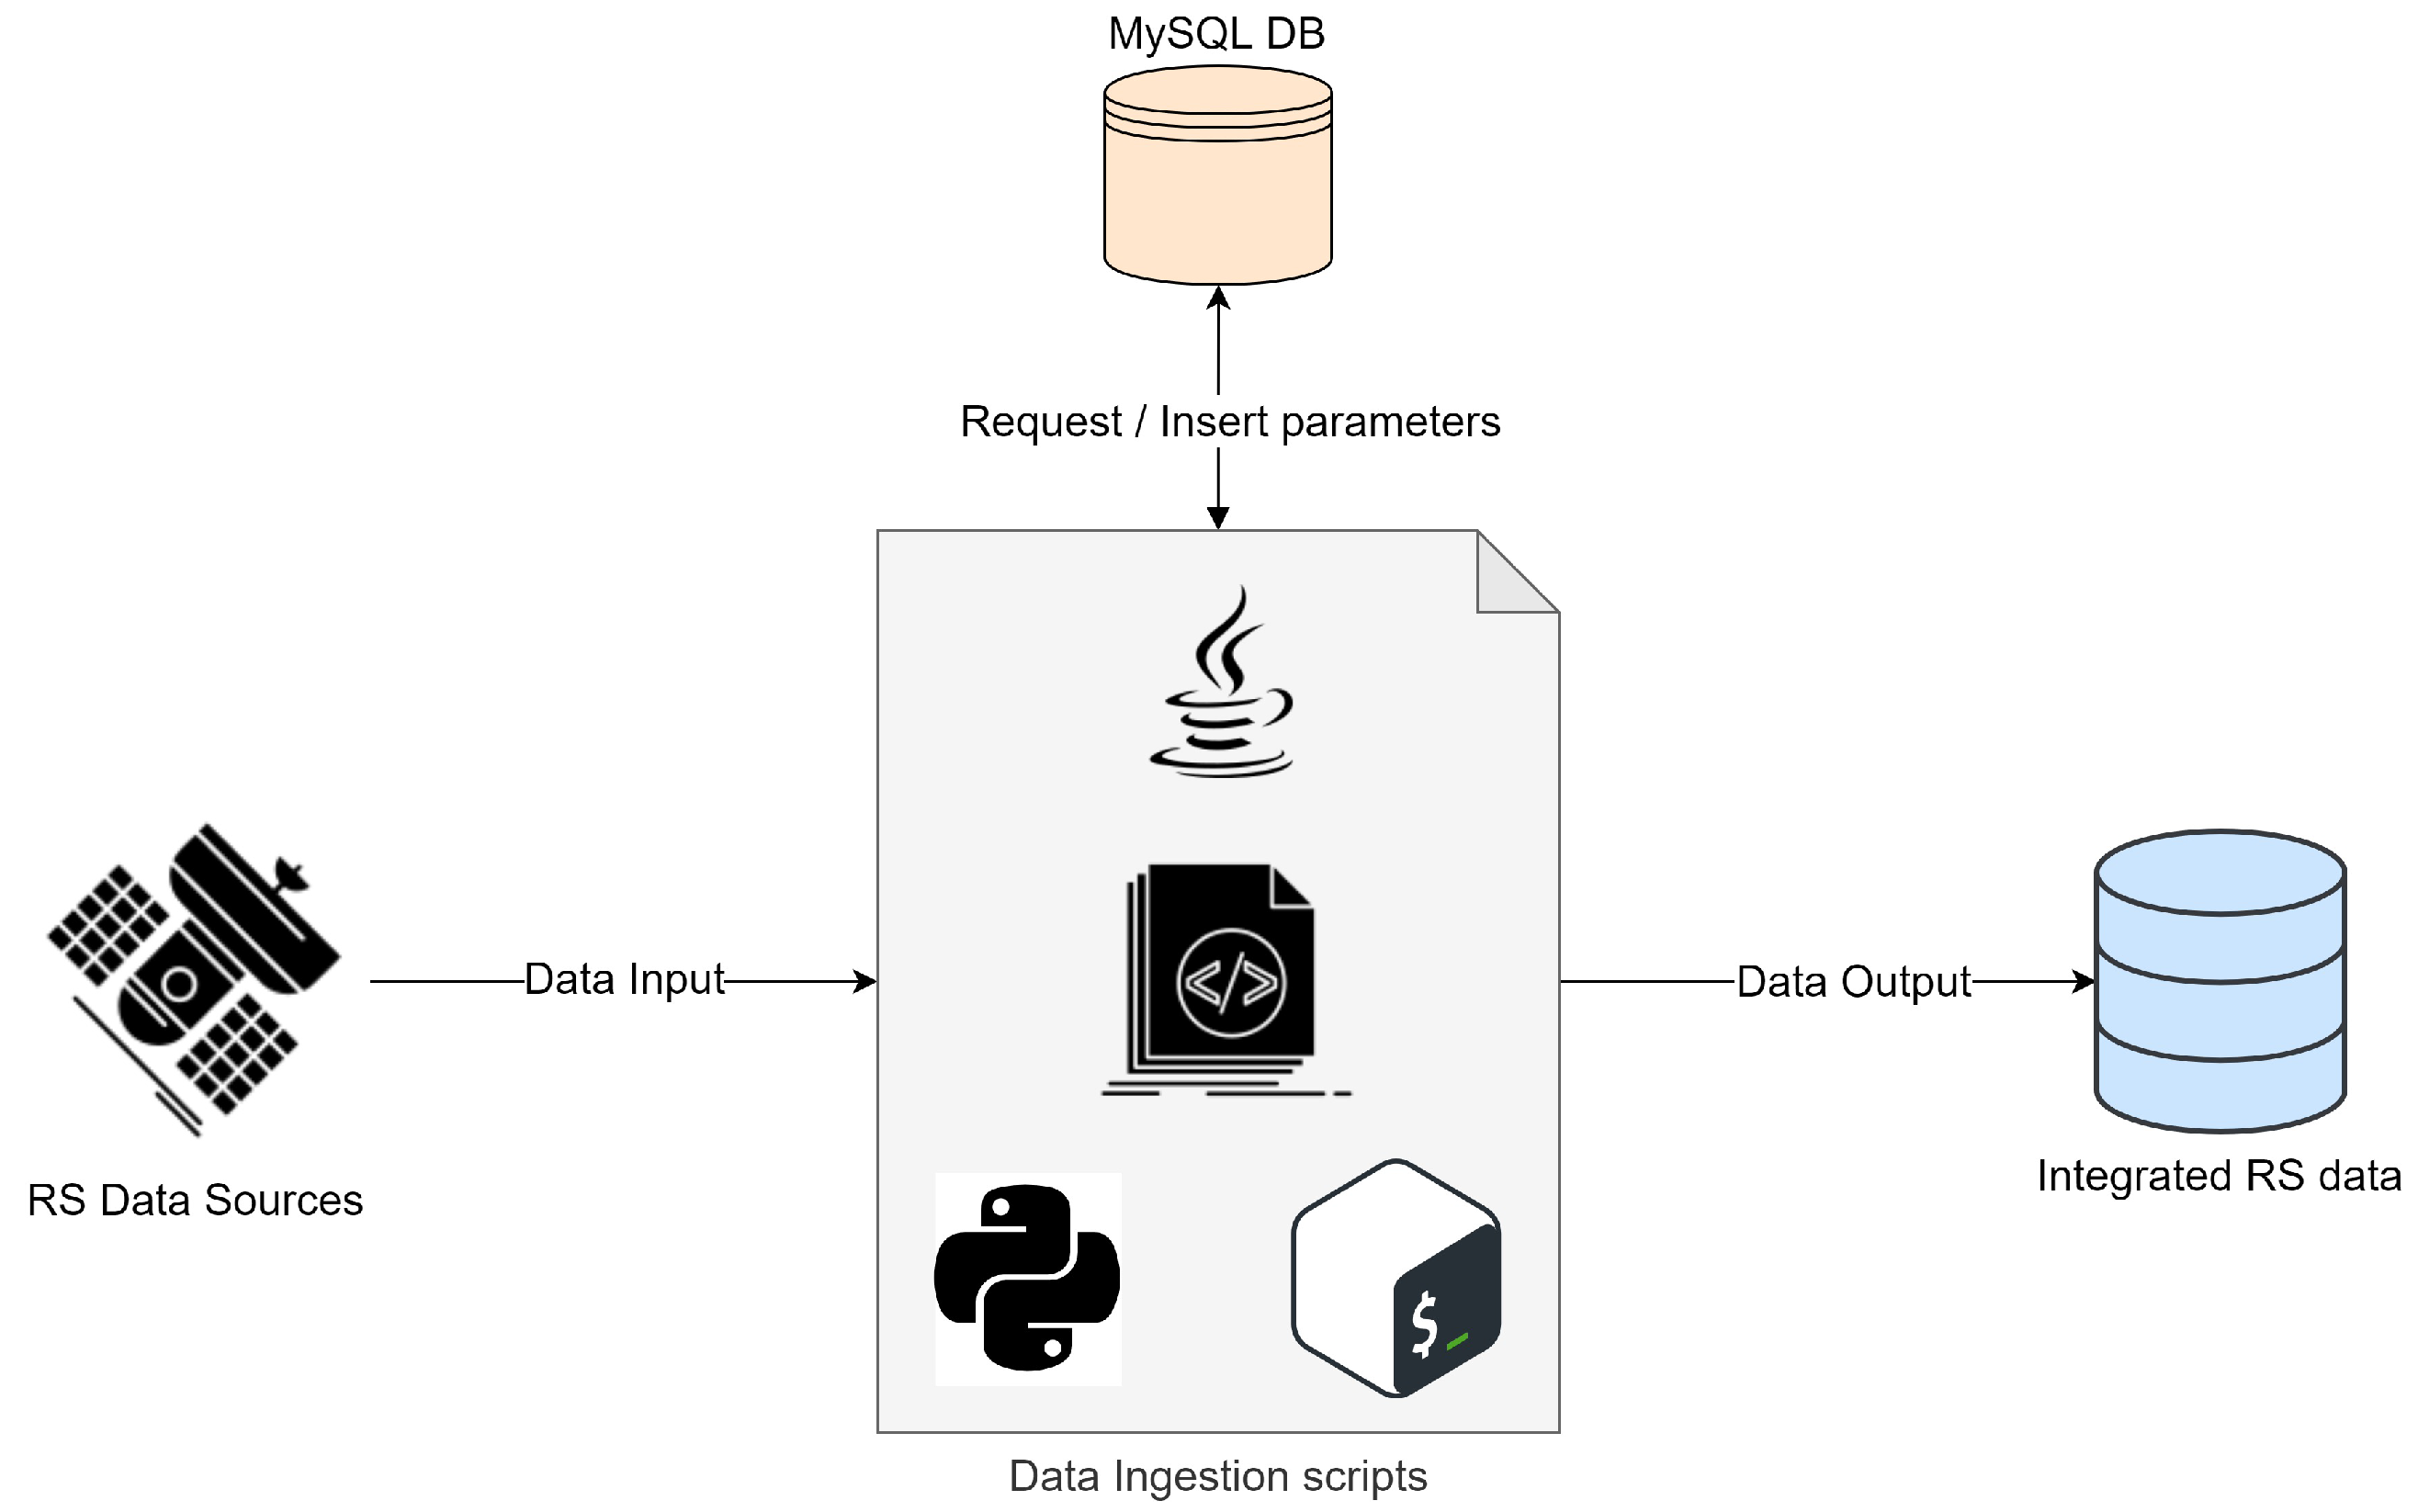
2.4. Massive Storage
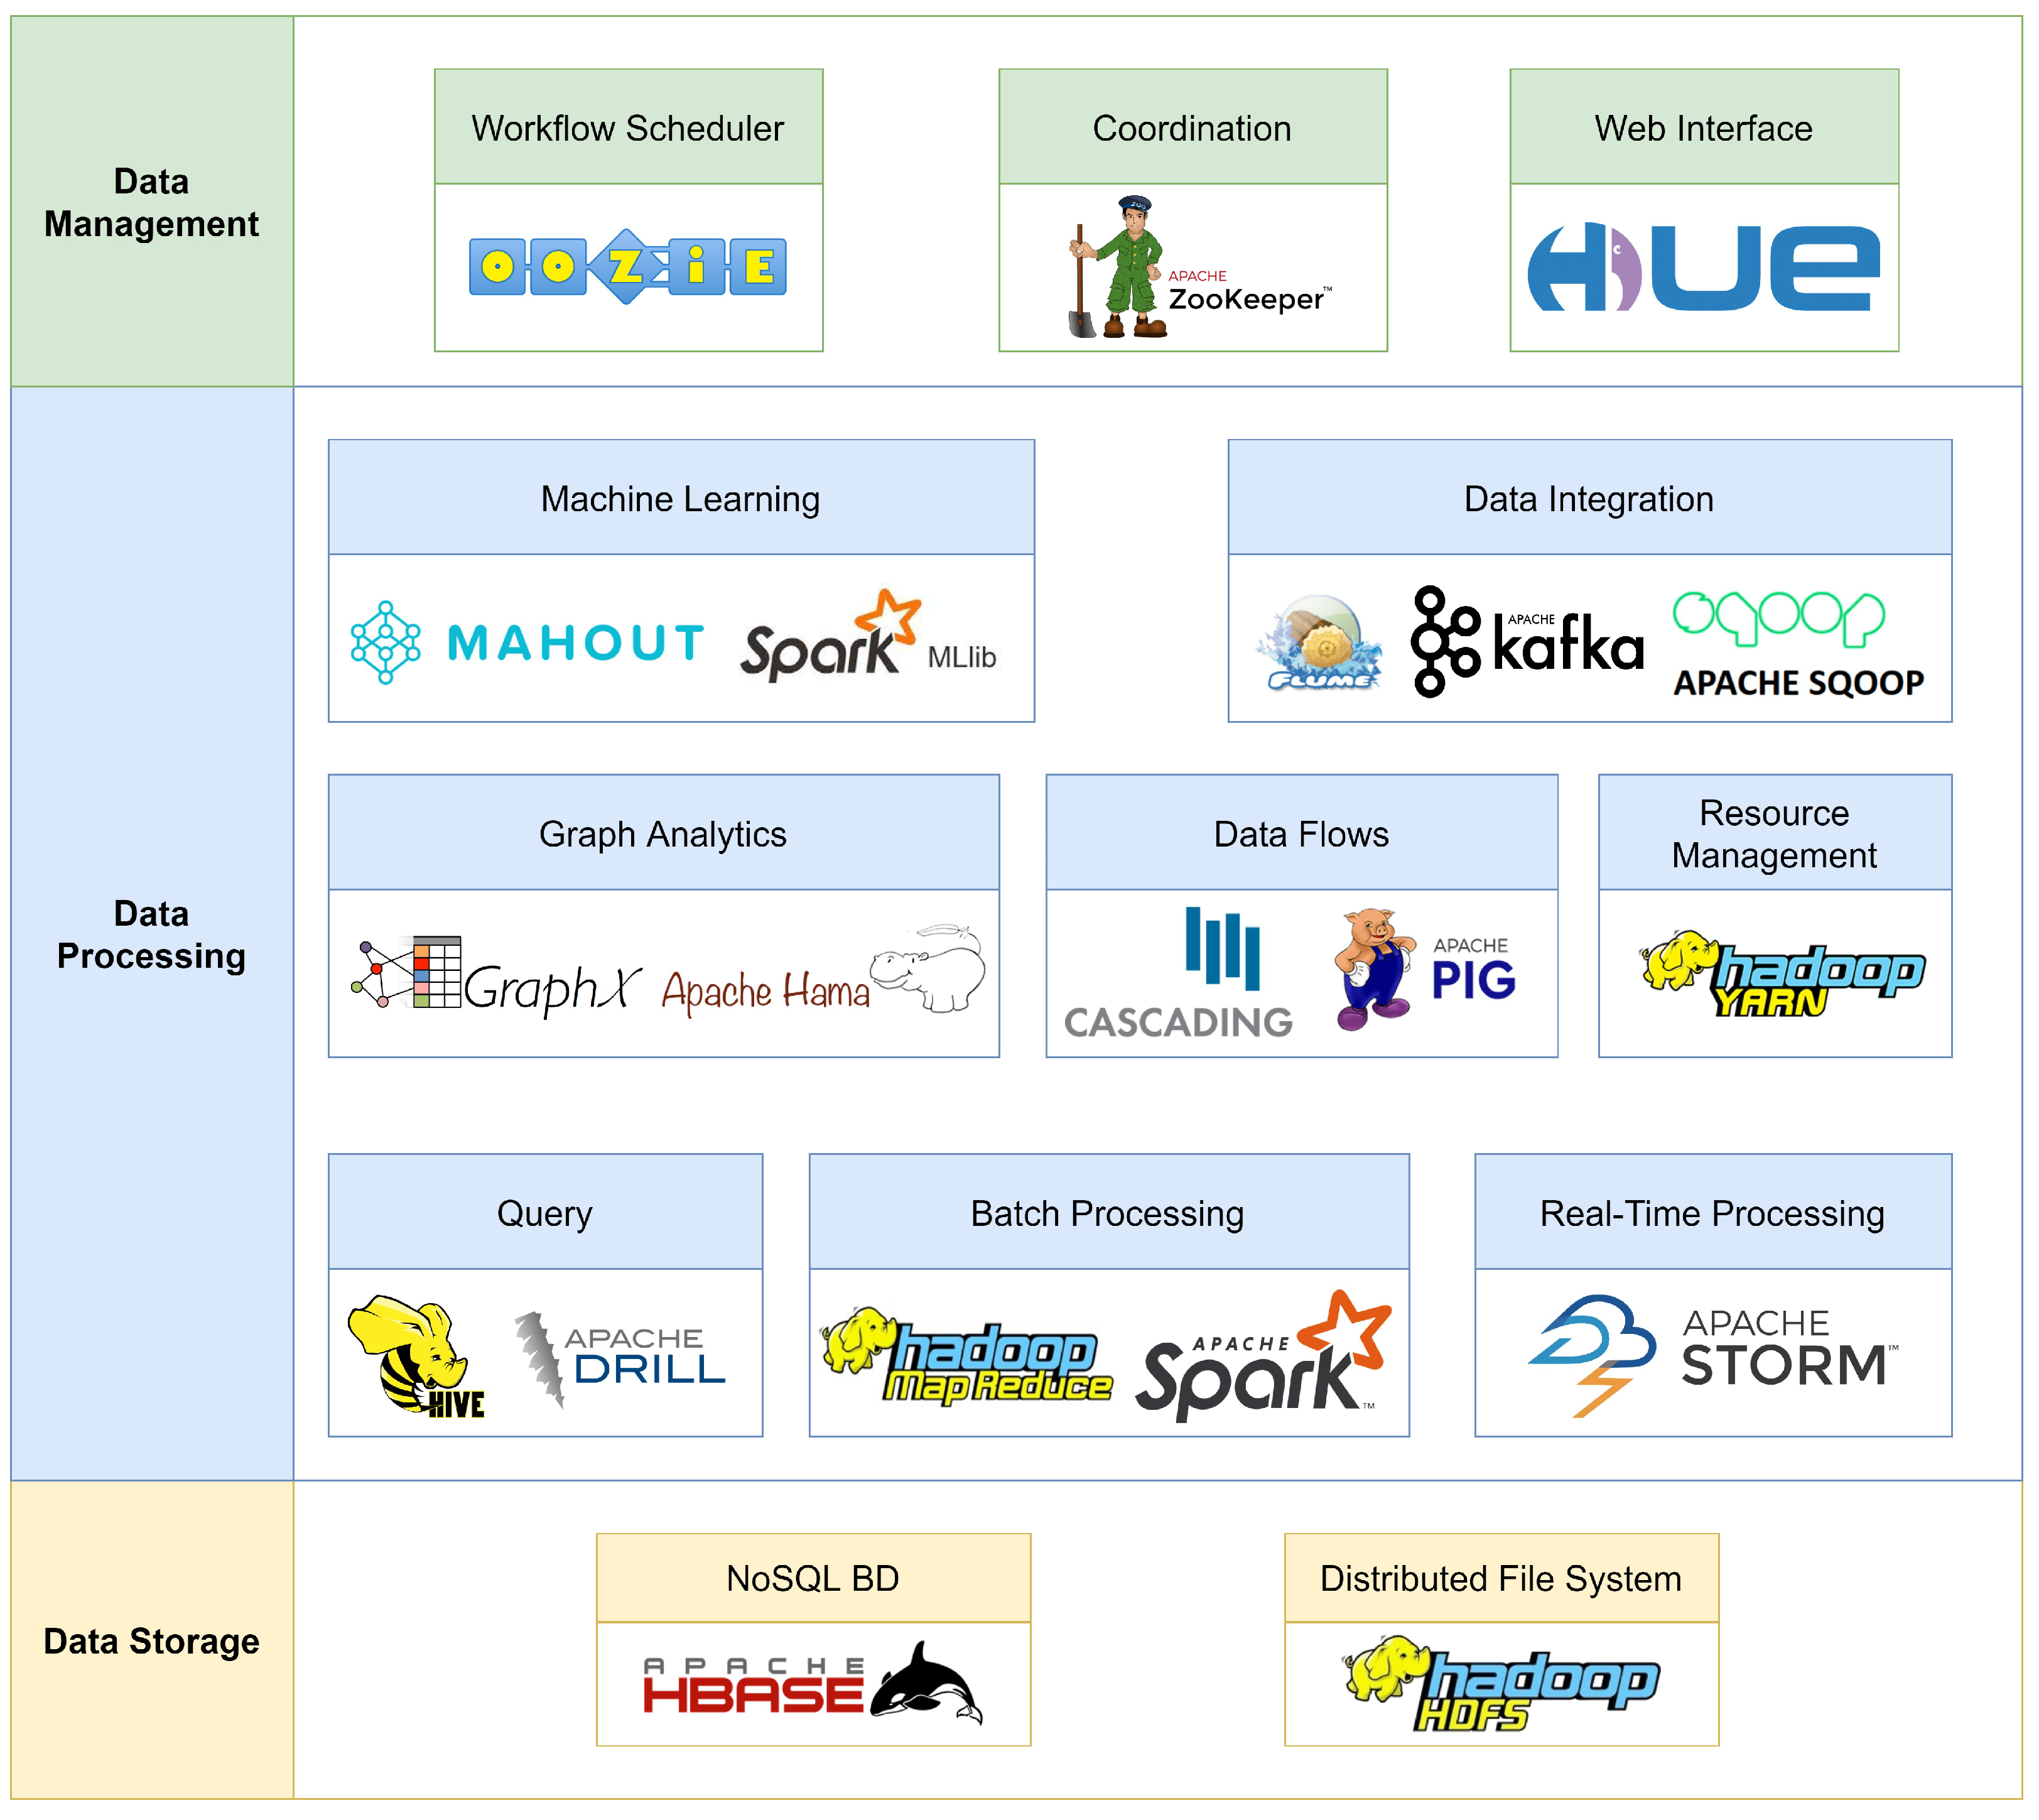
2.4.1. Hadoop
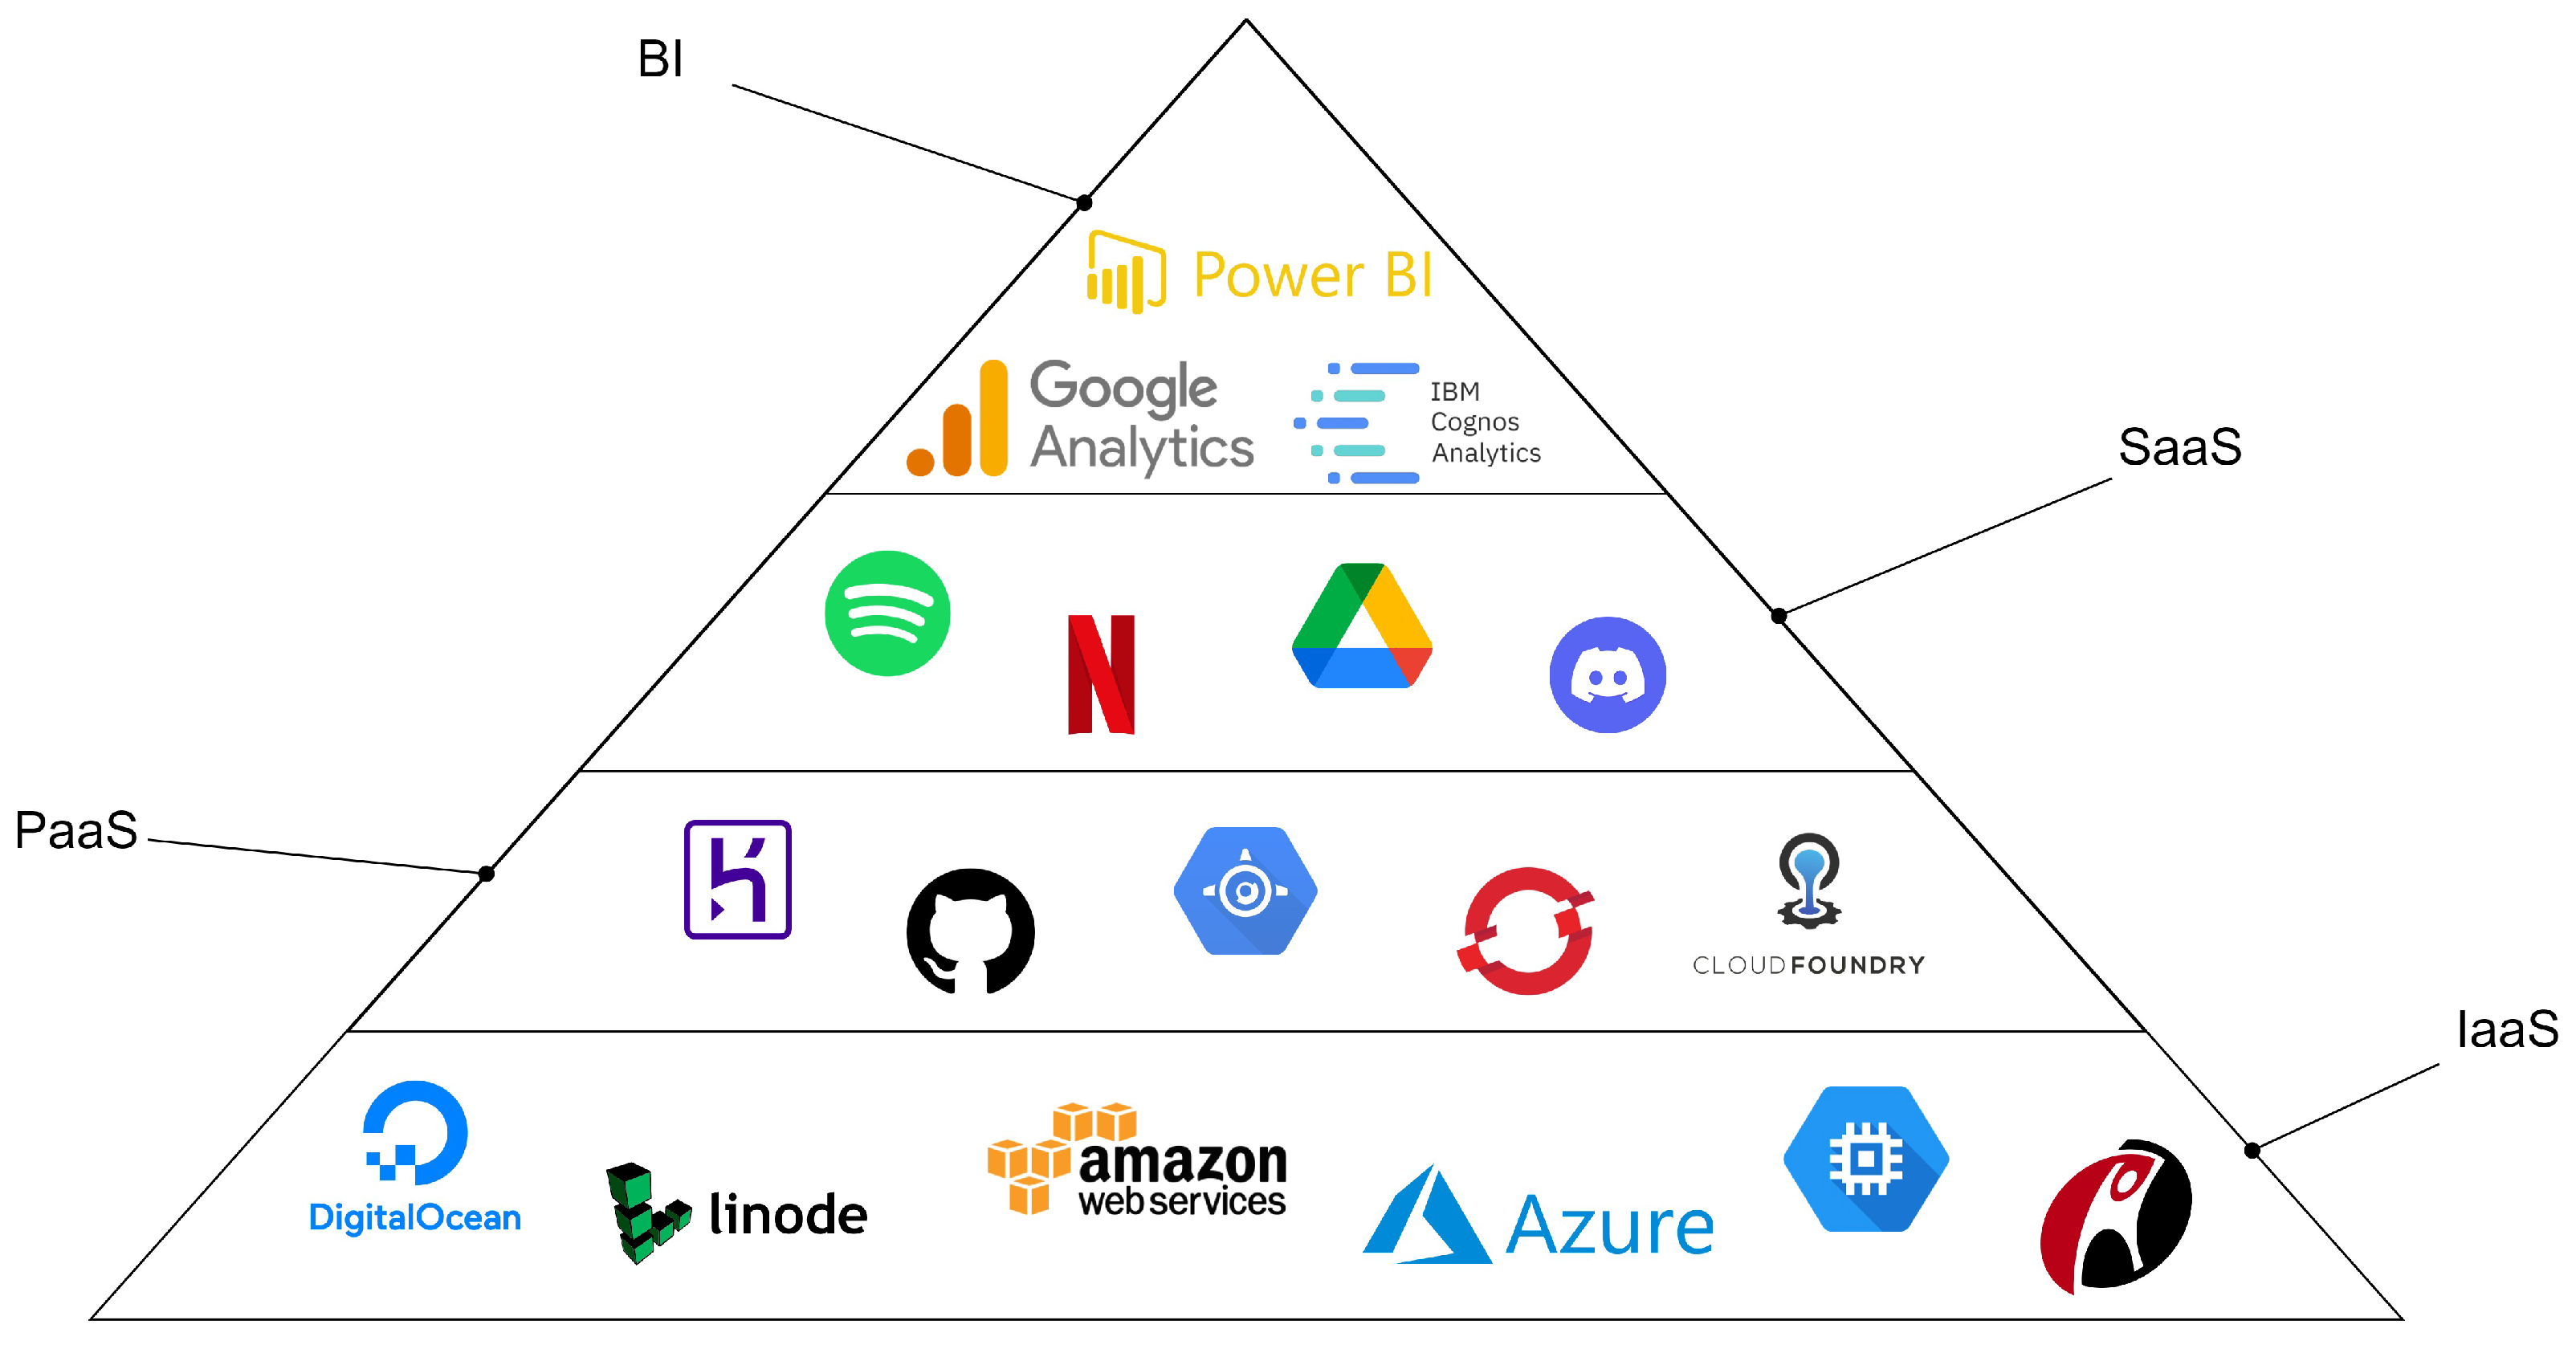
2.4.2. Cloud Computing
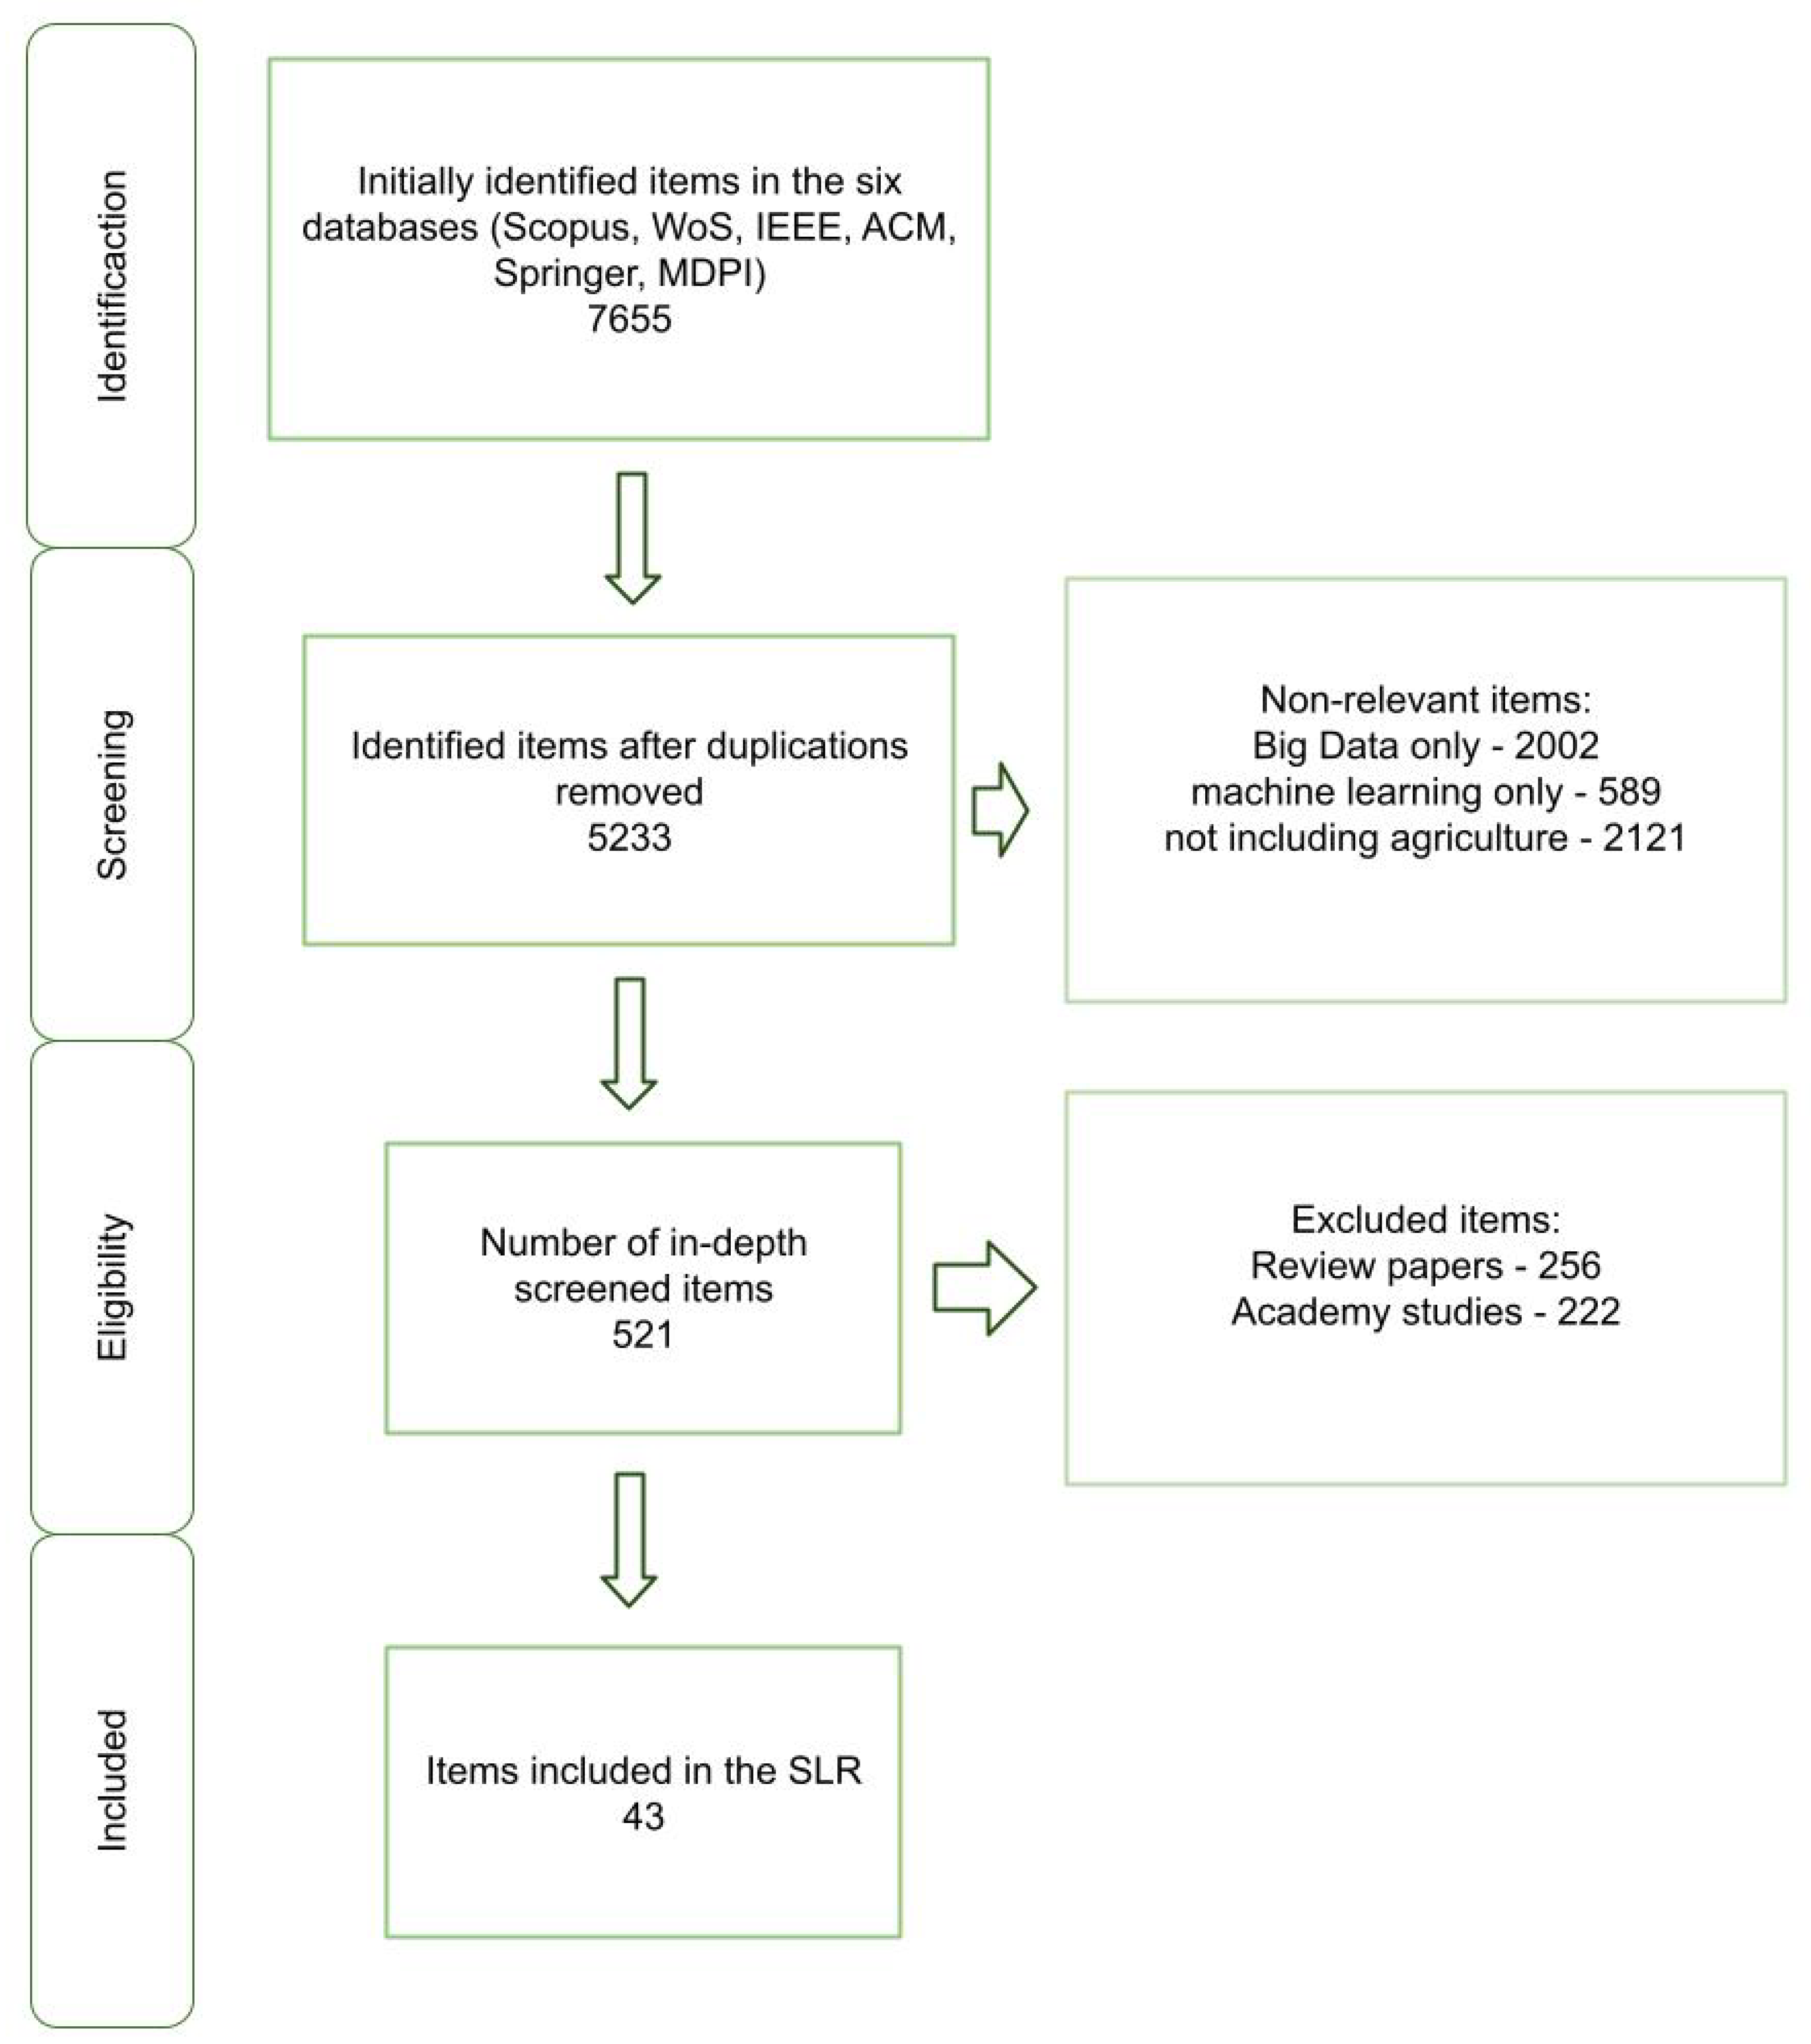
3. Methodology
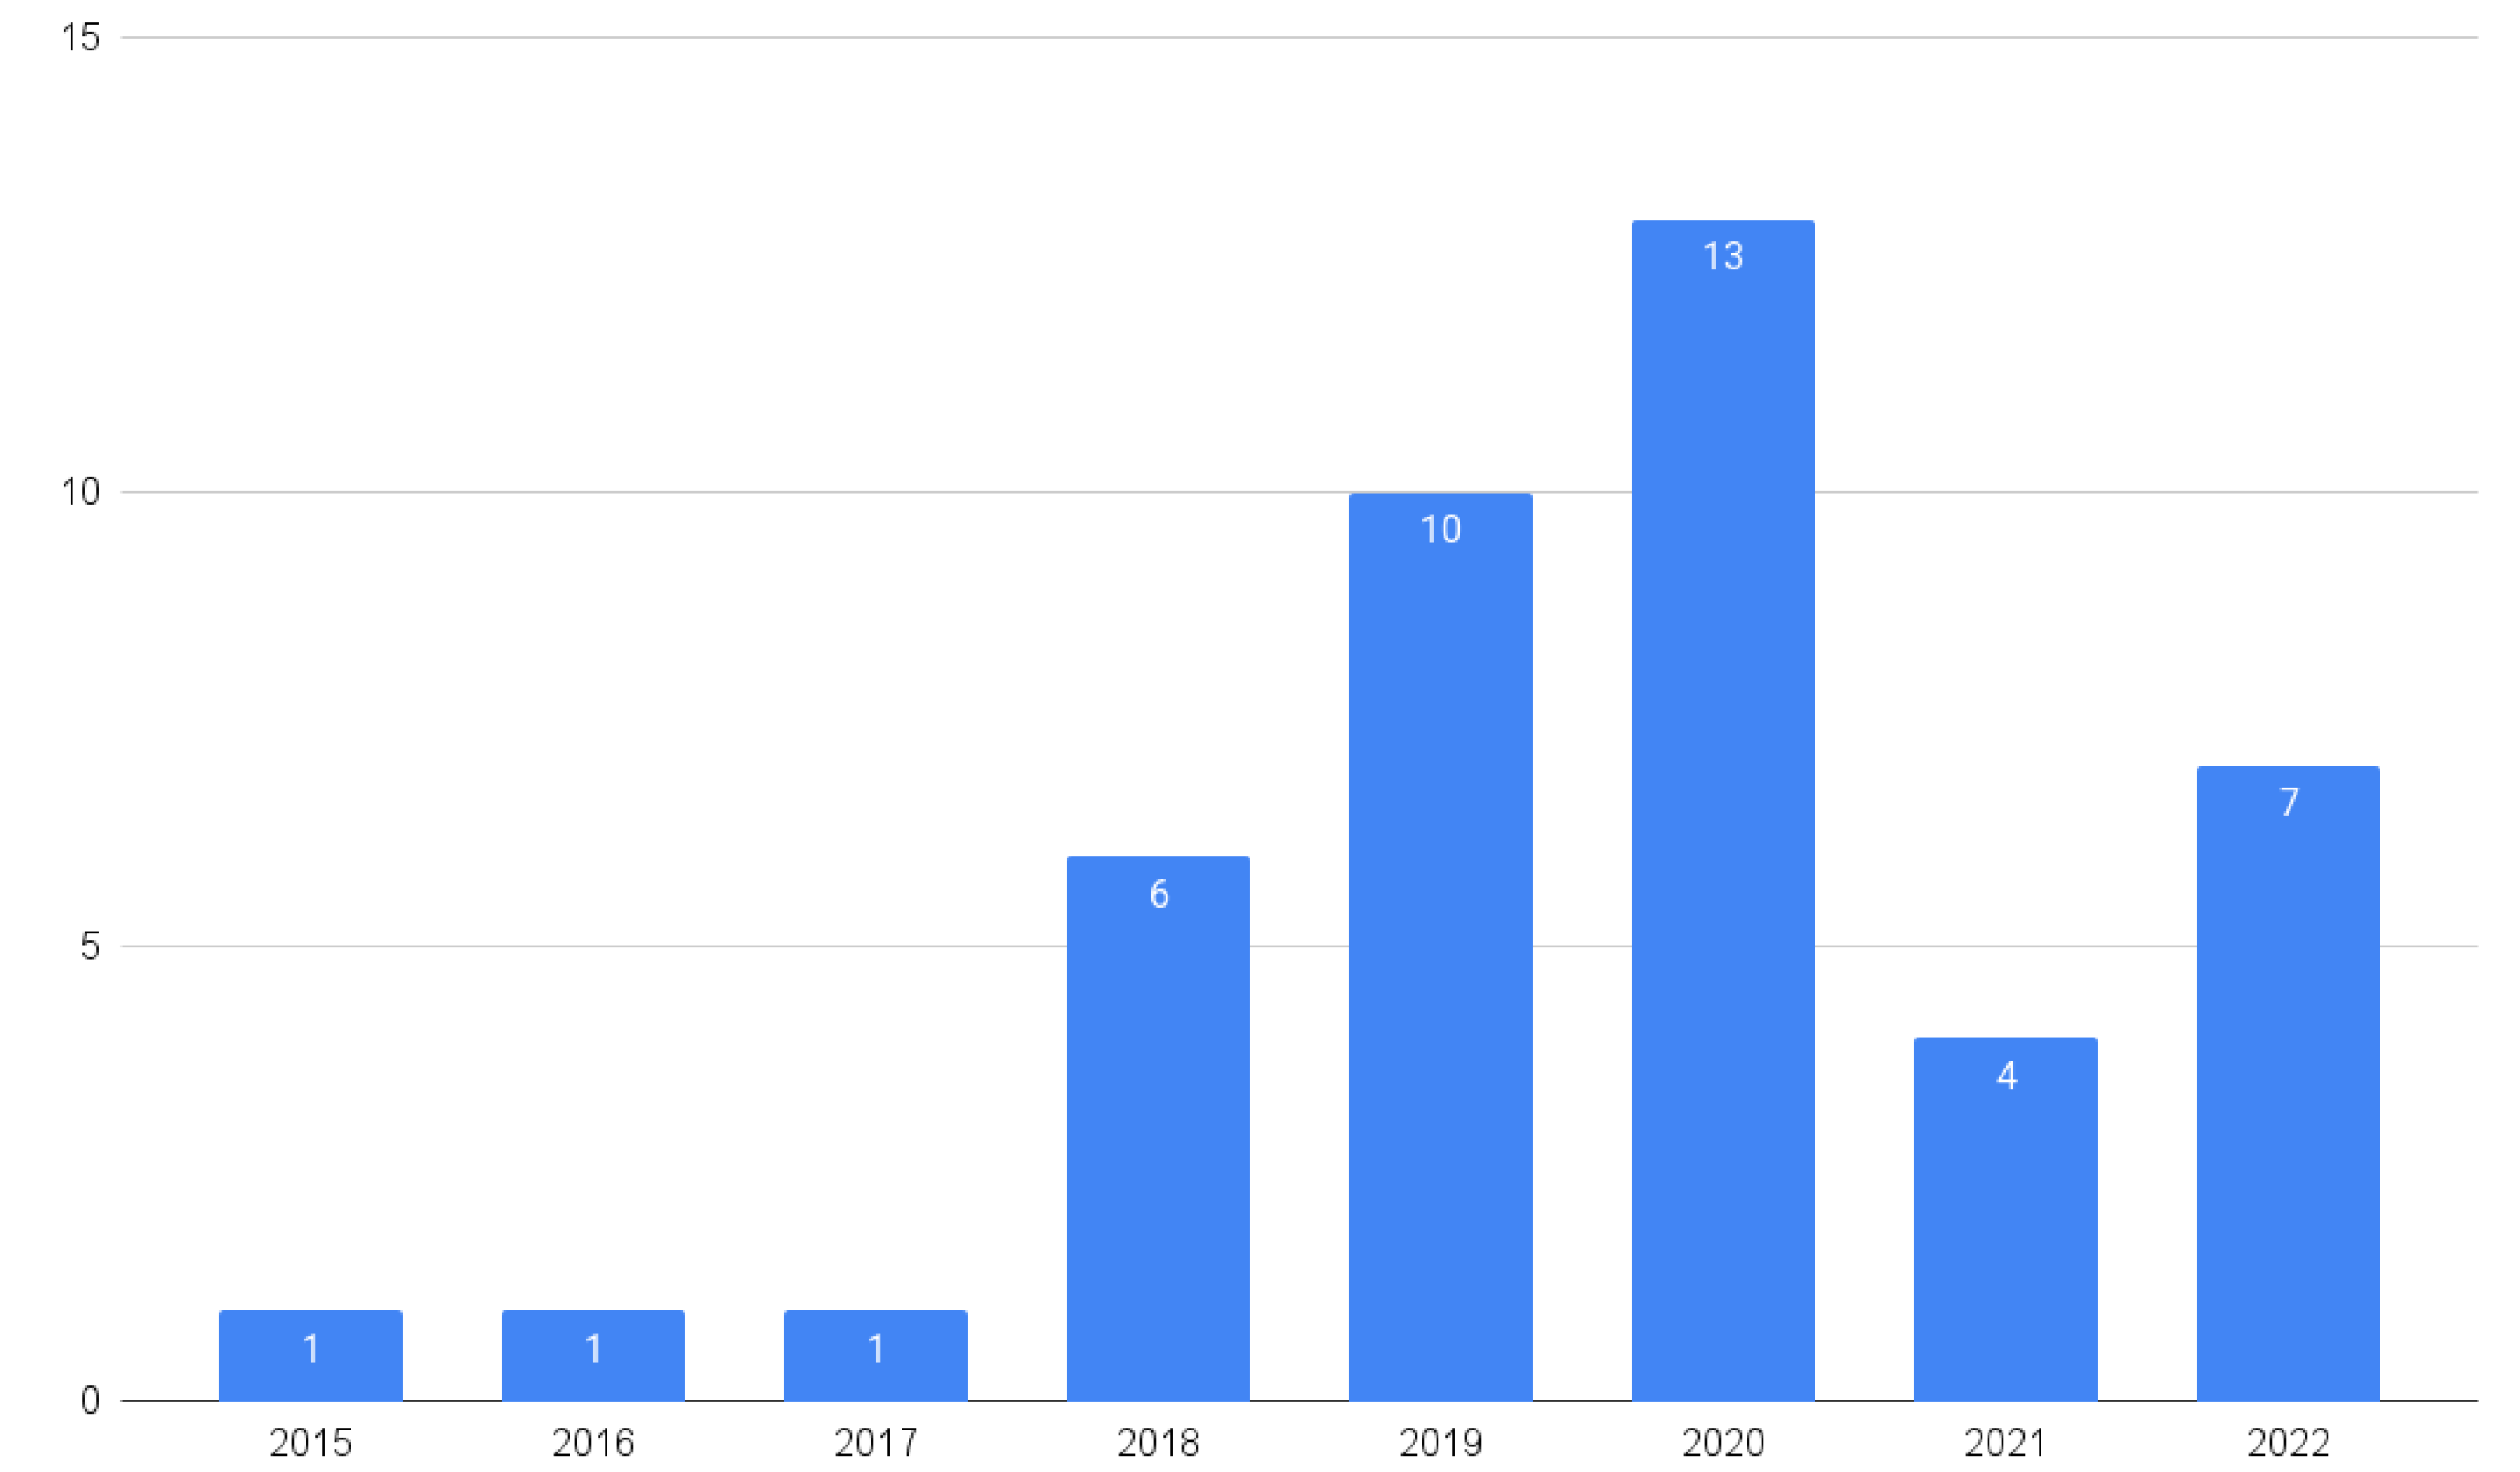
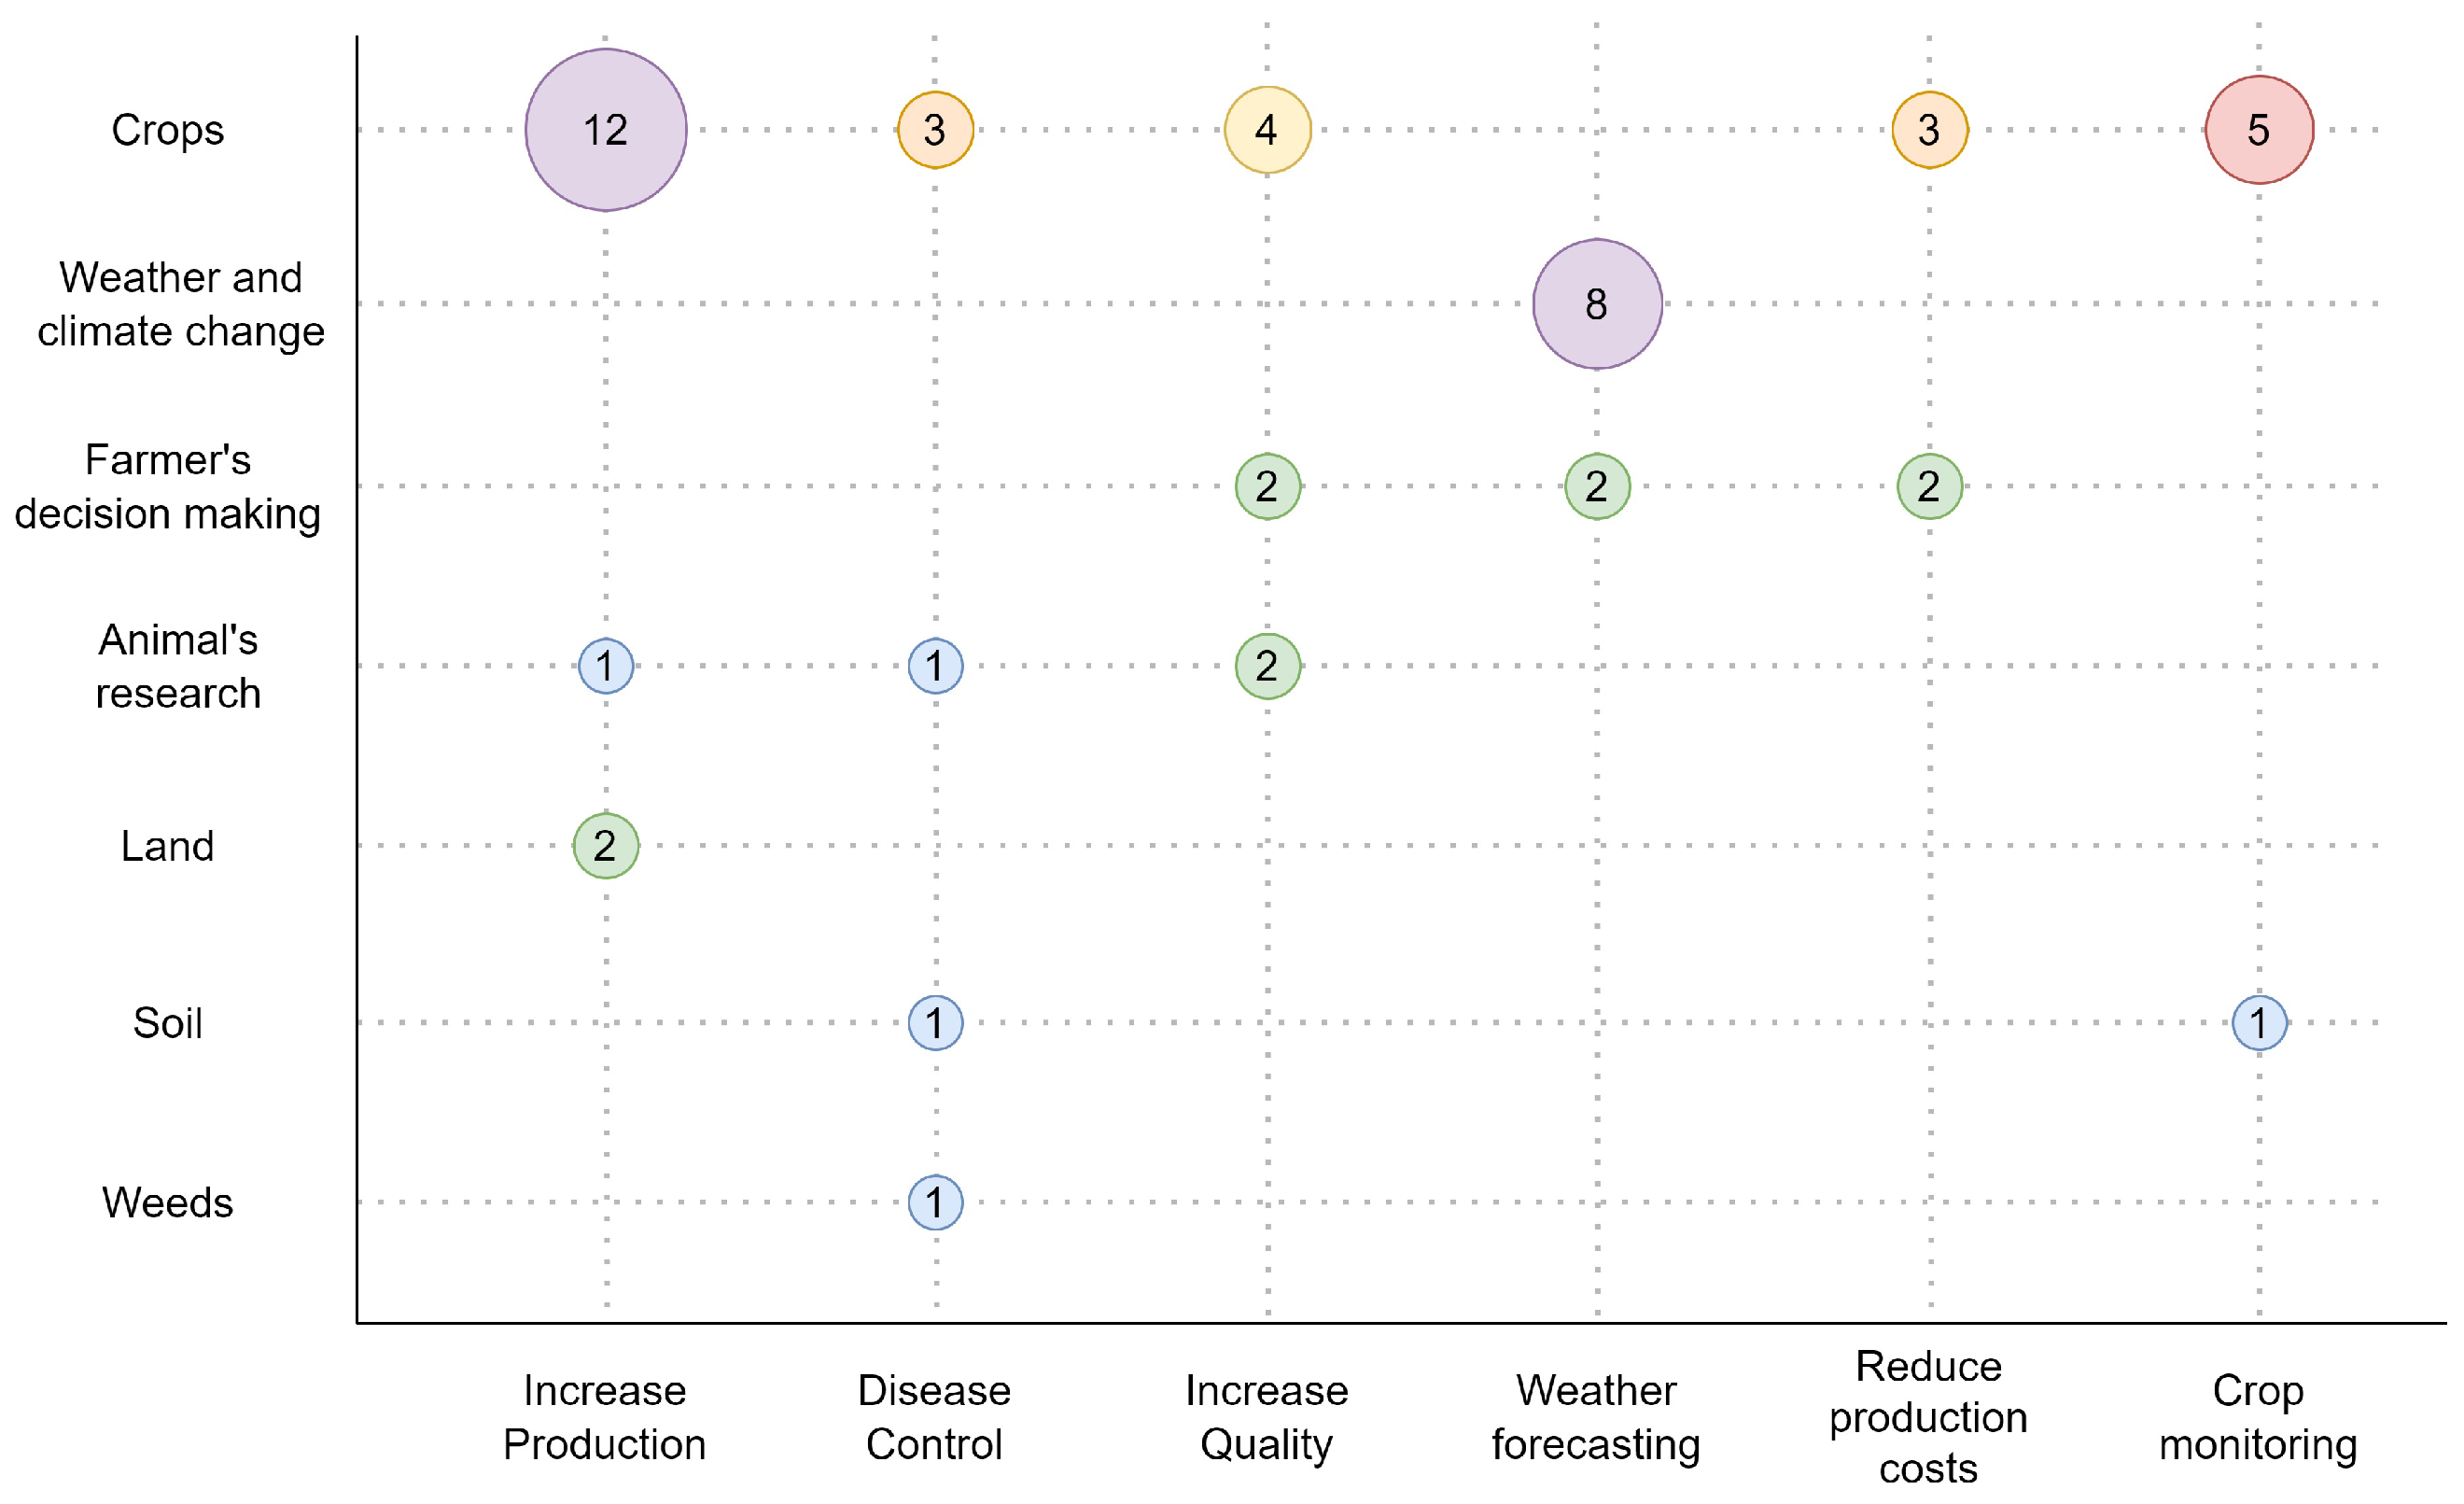
4. Results
4.1. Agricultural Big Data and Machine Learning
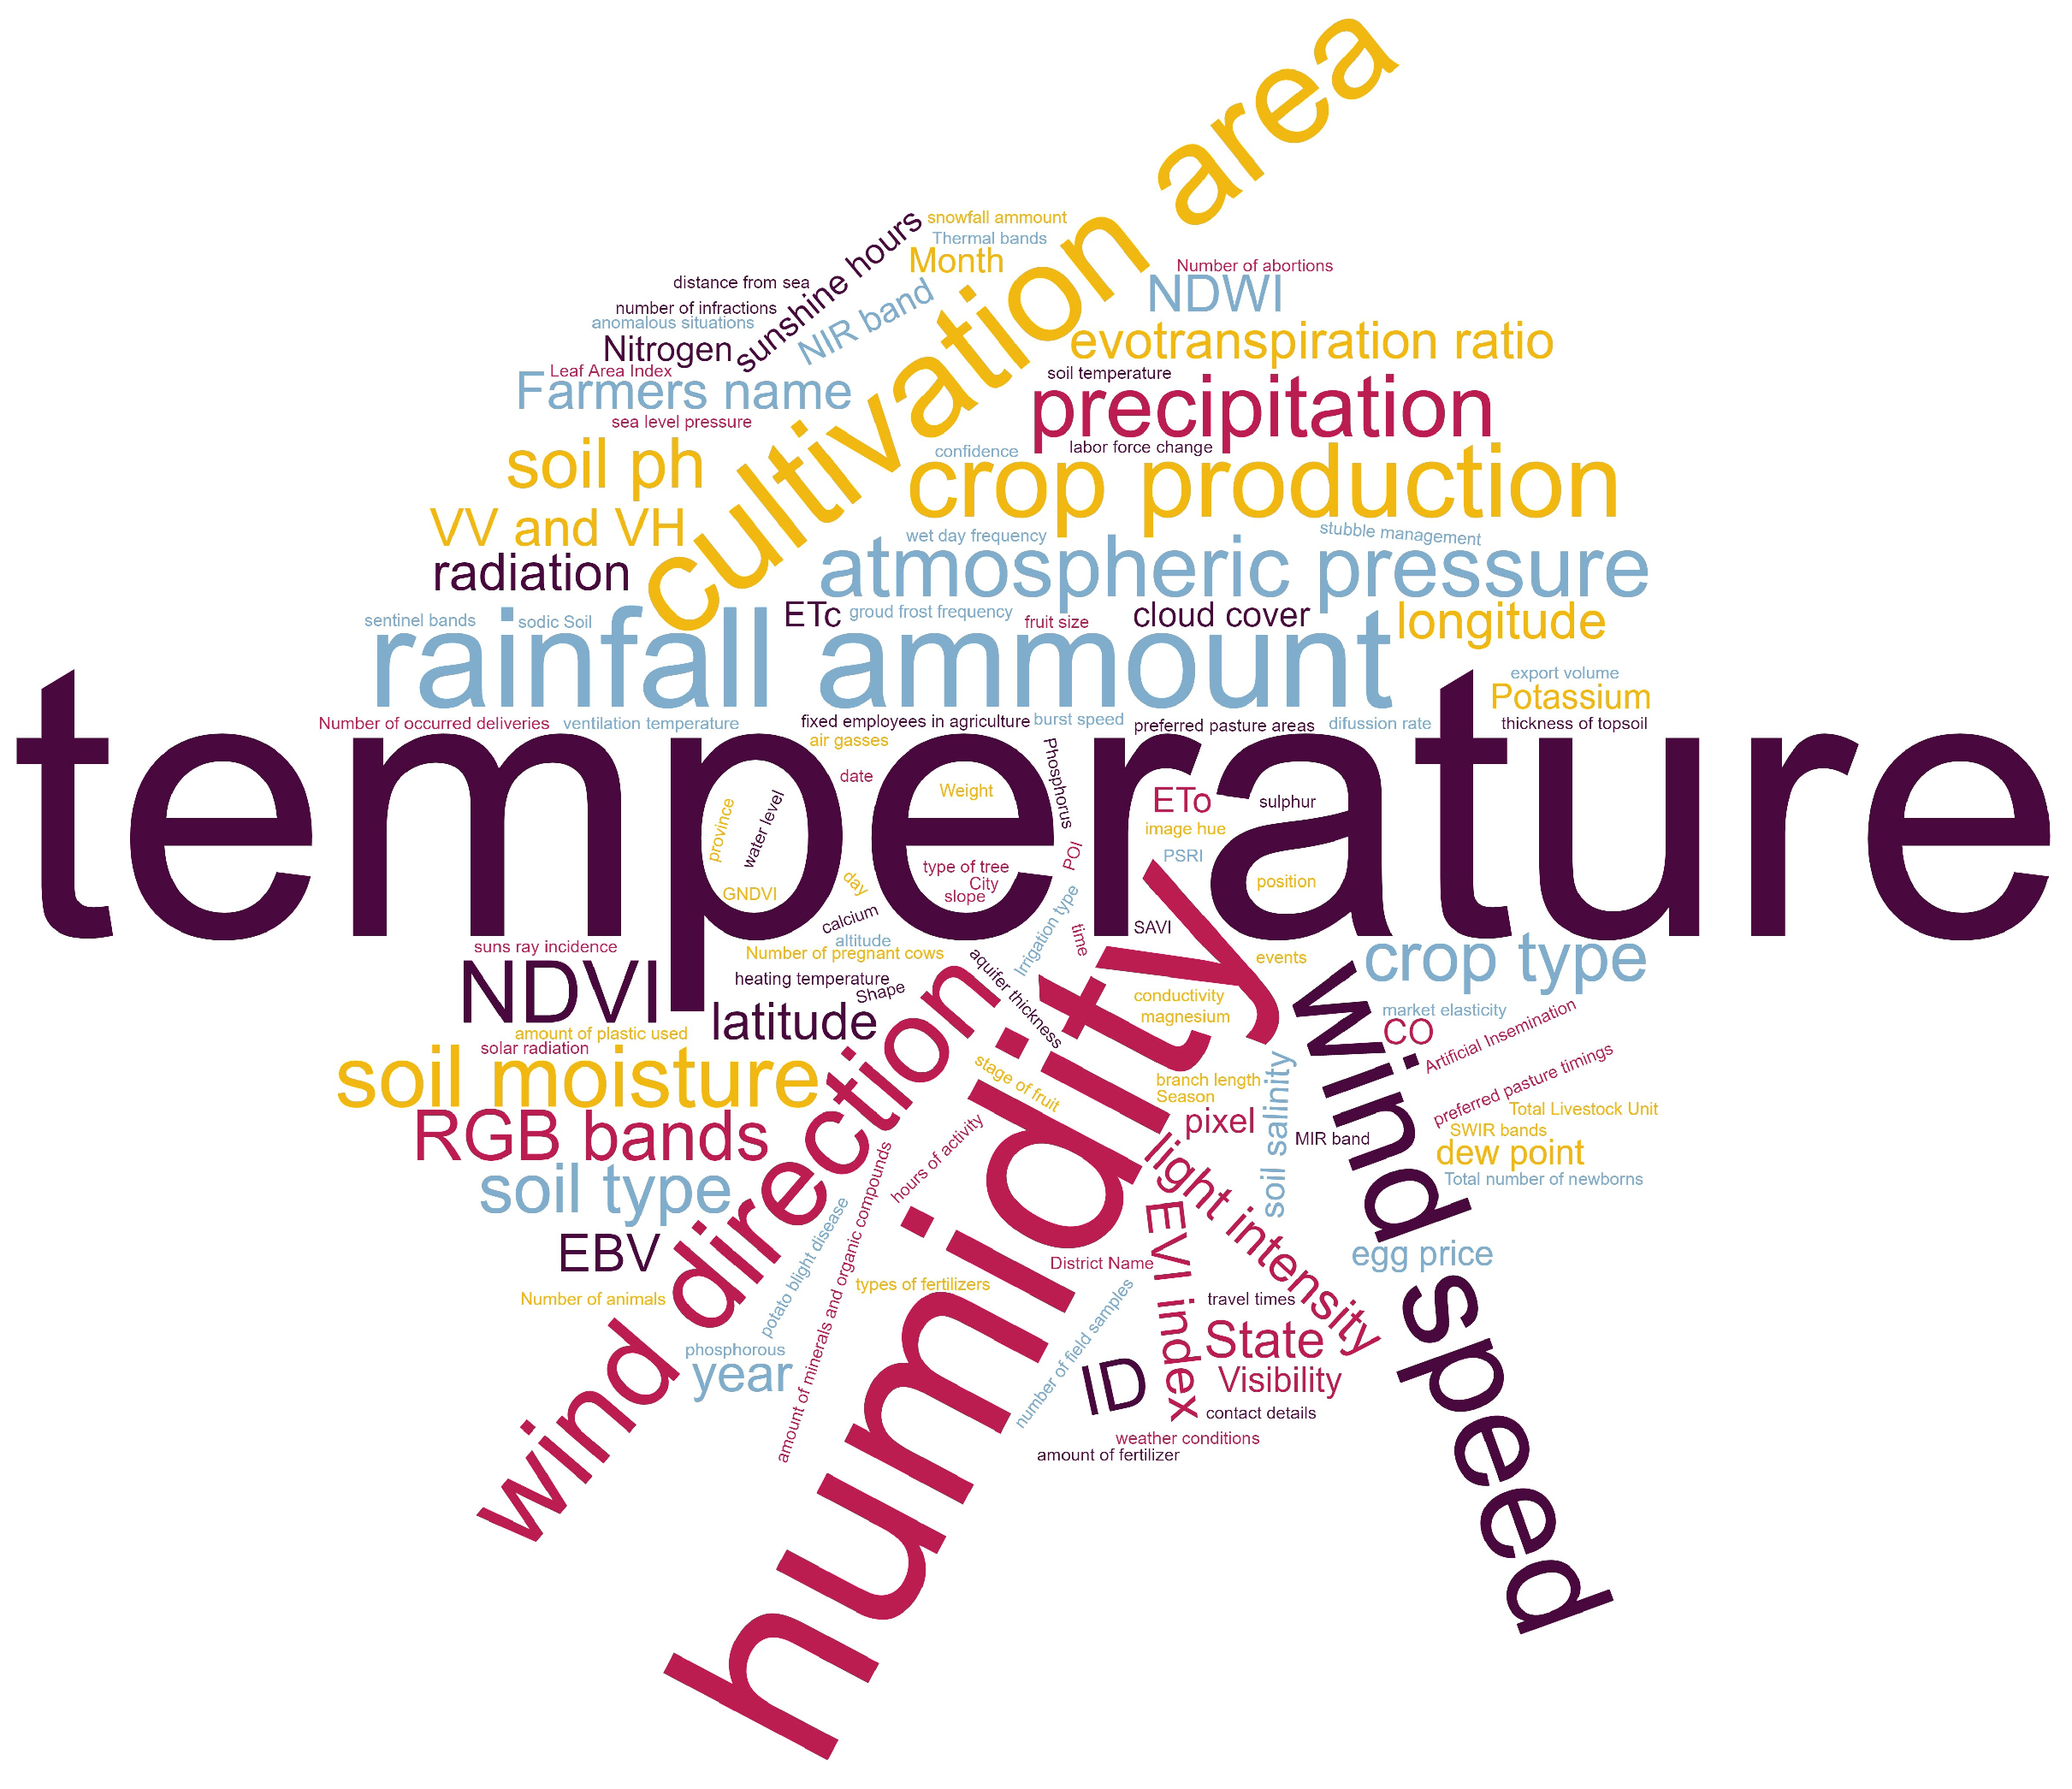
4.2. Data Types
4.2.1. Structured Data

| Author | Data | Type of Data |
|---|---|---|
| [59] | Climate, temperature, humidity, solar radiation, soil condition, shade. | Int, Float, String |
| [81] | pixels | Int |
| [68] | Temperature, light, humidity, and soil moisture. | Int, Float |
| Author | Data | Type of Data |
|---|---|---|
| [82] | cropland class, number of field samples | Int |
| Author | Data | Type of Data |
|---|---|---|
| [57] | Historical crop data. | String, Int |
| [83] | max temp, min temp, precipitation, month, year | Int, Float, Date |
| [61] | temperature, relative humidity, wind speed, wind direction, precipitation accumulation, solar radiation, potato blight disease, cultivar resistance | Int, Float, String |
| [55] | crop yield, farmer’s name, Place–Village–Panchayat–Taluk–District, survey number, contact details, soil type, paddy variety, types of fertilizers used at the different stages of cultivation, field size, irrigation type | String, Int, Float |
| [64] | soil type, aquifer thickness, soil pH, thickness of topsoil, precipitation, temperature, latitude, longitude, distance from sea, rainfall, production area, under, cultivation | Int, String |
| [84] | soil pH, state of Shire, winter crop, amount of cultivation, stubble management | Int, Float |
| [60] | type of tree, x (pixel), y (pixel), size, confidence, land, cover, class, ground cover: impervious surfaces, buildings, low vegetation, trees, cars, and background | Int, String |
| [85] | max air temperature, min air temperature, average temperature, relative humidity, wind speed, solar radiation, sunshine hours, reference evotranspiration | Int, Float |
| [86] | min temperature, max temperature, avg temperature, humidity, wind speed, precipitation, wind direction, cloud cover, visibility, atmosphere pressure | Int, Float |
| [87] | precipitation, temperature (minimum, maximum and average), cloudiness, vapor pressure, frequency of wet days, frequency of frost on the ground. | Int, Float |
| [88] | consistency of all animals, percentage of artificial insemination, mean value of age of cows expressed in days, mean number of parturitions per cow, number of occurred deliveries, mean number of necessary inseminations which resulted in positive pregnancy diagnosis, etc. | Int, Float |
| [82] | NDVI, NDWI | Int |
| [89] | wgg price, duck egg price, export volume, output, market elasticity, labor force change and inventory as variables. | String, Int, Float |
| [90] | crop field dataset, name area | String, Int, Float, Date |
| Author | Data | Type of Data |
|---|---|---|
| [87] | precipitation, min temperature, max temperature, avg temperature, cloud cover, vapor pressure, wet, day frequency, ground frost frequency, color bands | Int, Float |
| [82] | NDVI, NDWI. | Int, Float |
| [91] | NDVI, NDWI, PSRI, B8A, B12, B11, B08, B07, B06, B05, B04, B03, B02 | Int, Float |
| [92] | RGB bands, NIR band, SWIR 1 and SWIR 2 bands, thermal bands, NDVI index, EVI index, NDWI index, latitude, longitude, slope | Int, Float |
| [69] | three-dimensional datasets, NDVI index, Soil-Adjusted Vegetation Index (SAVI), EVI Index, and Green NDVI (GNDVI) | Int, Float |
| [74] | NDVI, EVI, near-Infrared spectral band (NIR), and mid-Infrared spectral band (MIR). | Int, Float |
4.2.2. Semi-Structured Data
4.2.3. Unstructured Data
4.3. Data Generation for Agricultural Big Data
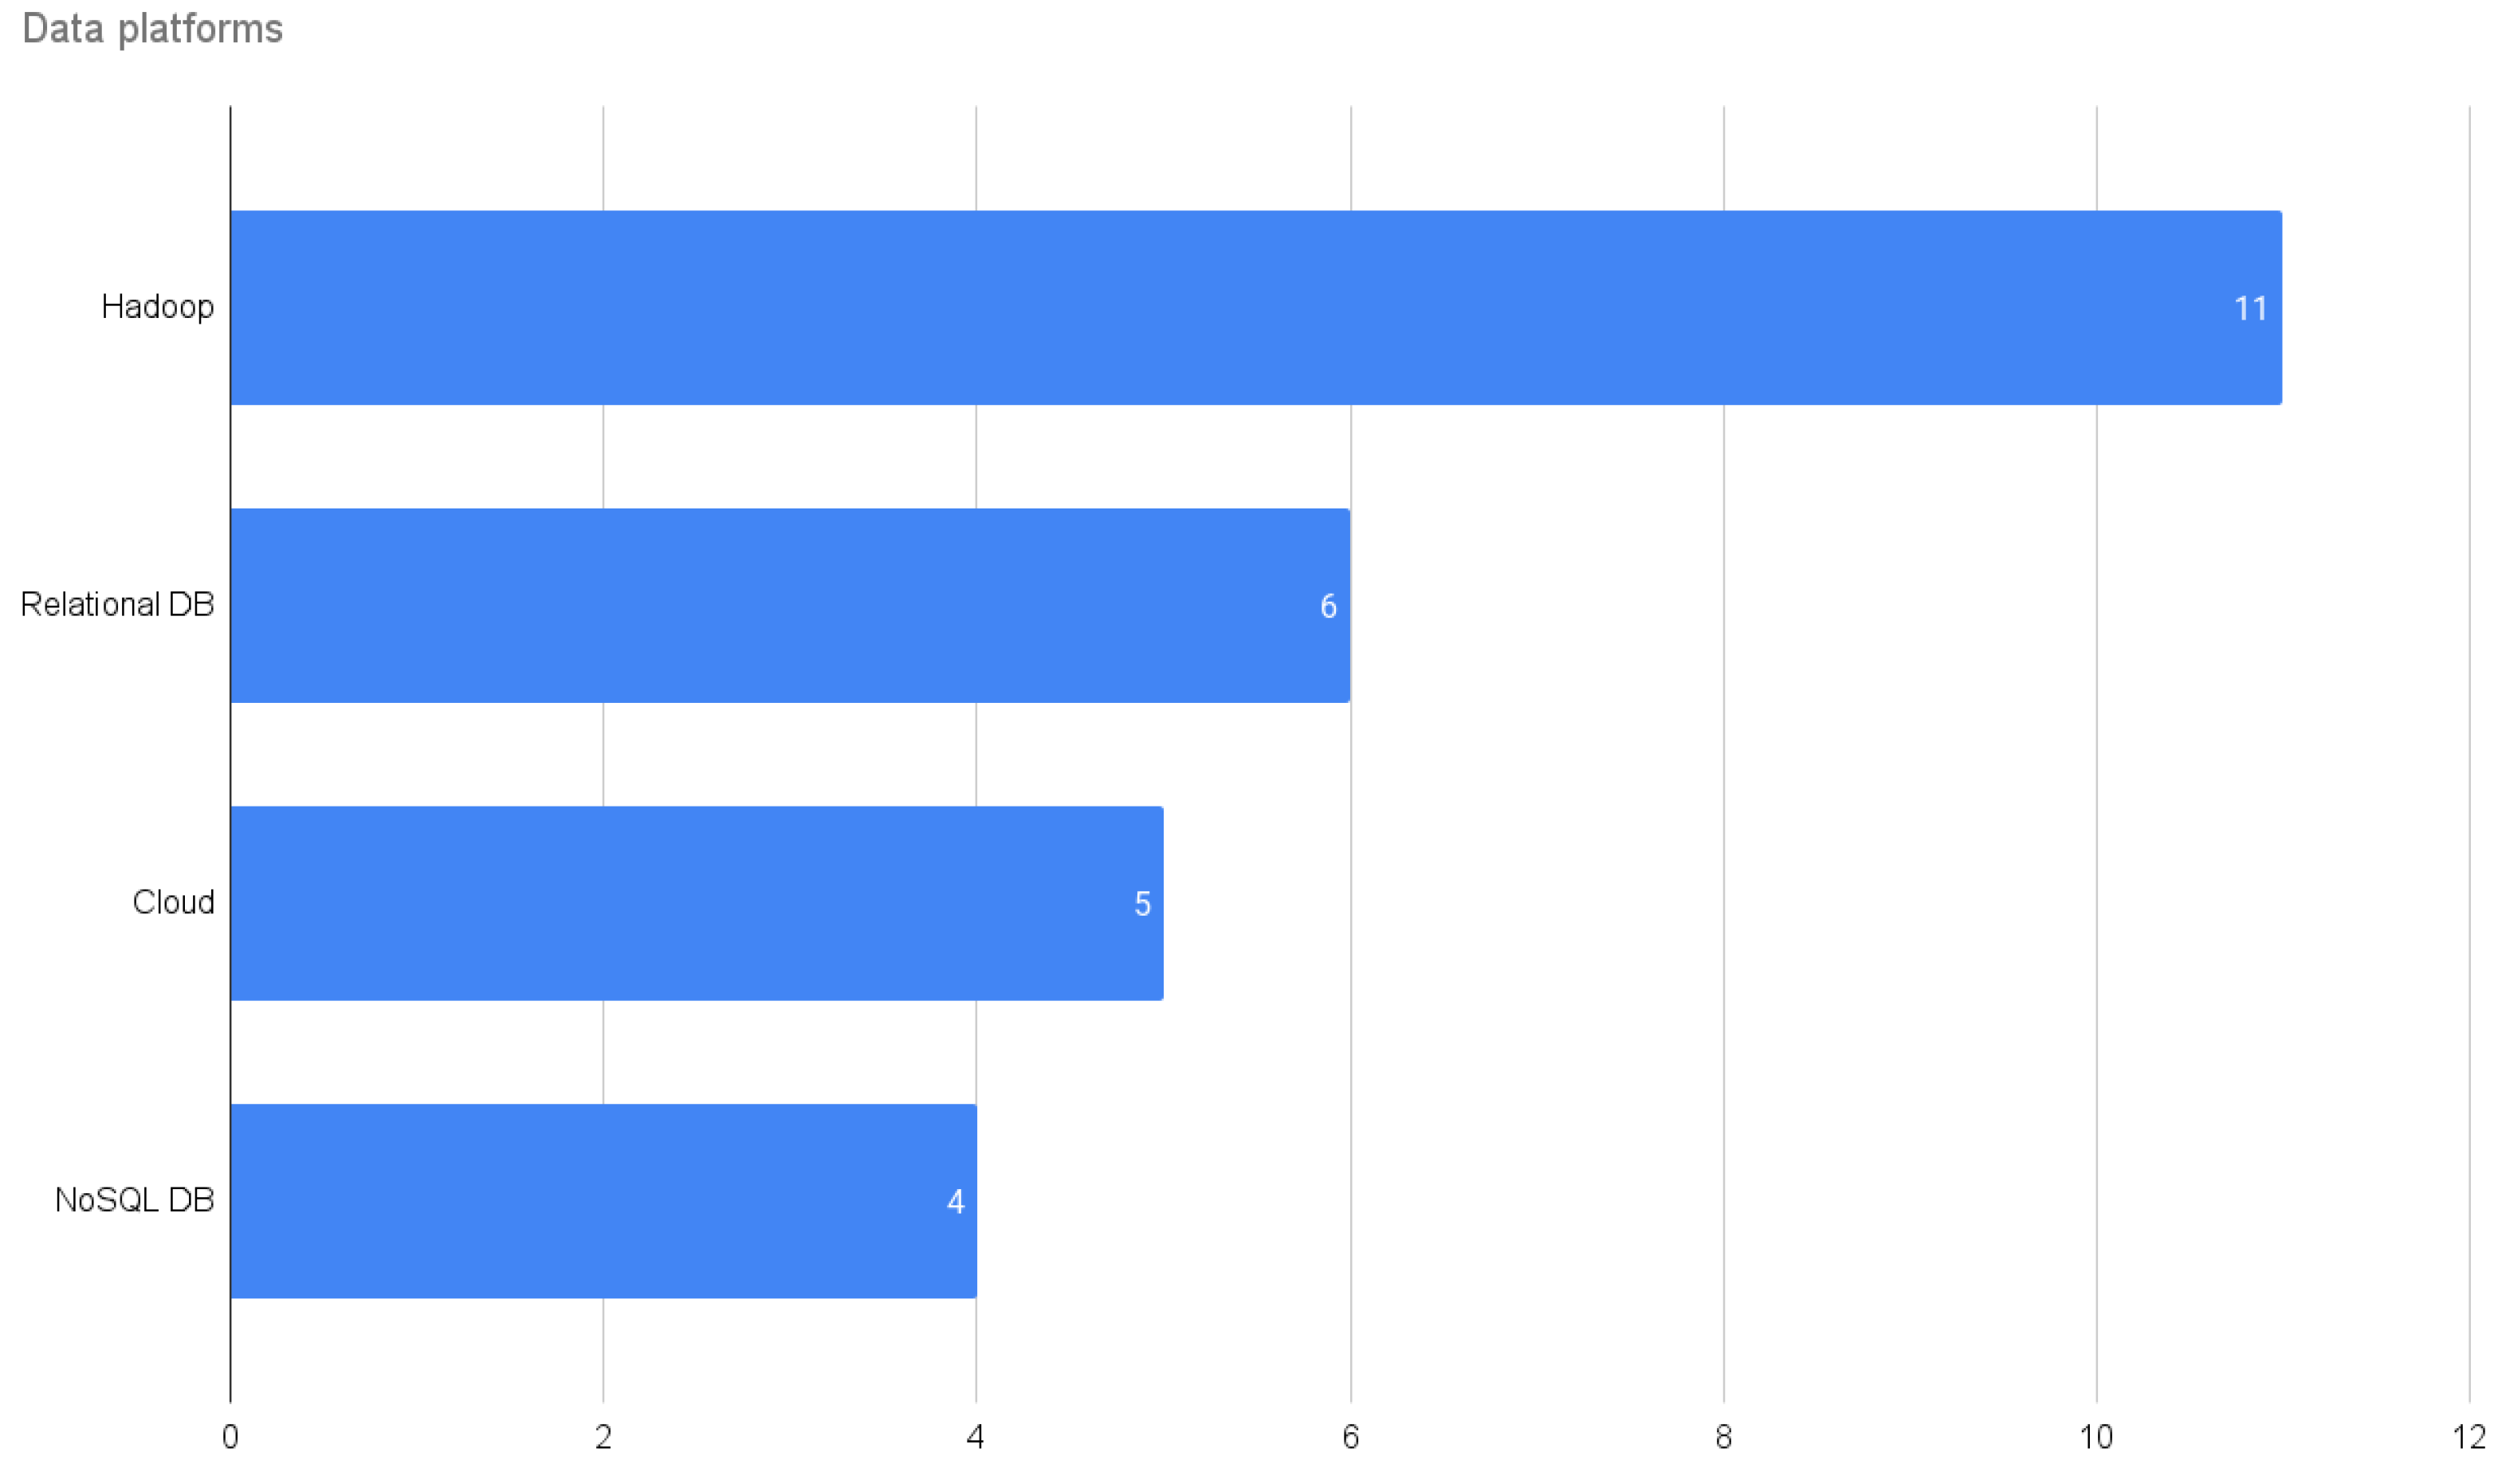
4.3.1. Data Platforms in Agricultural Big Data
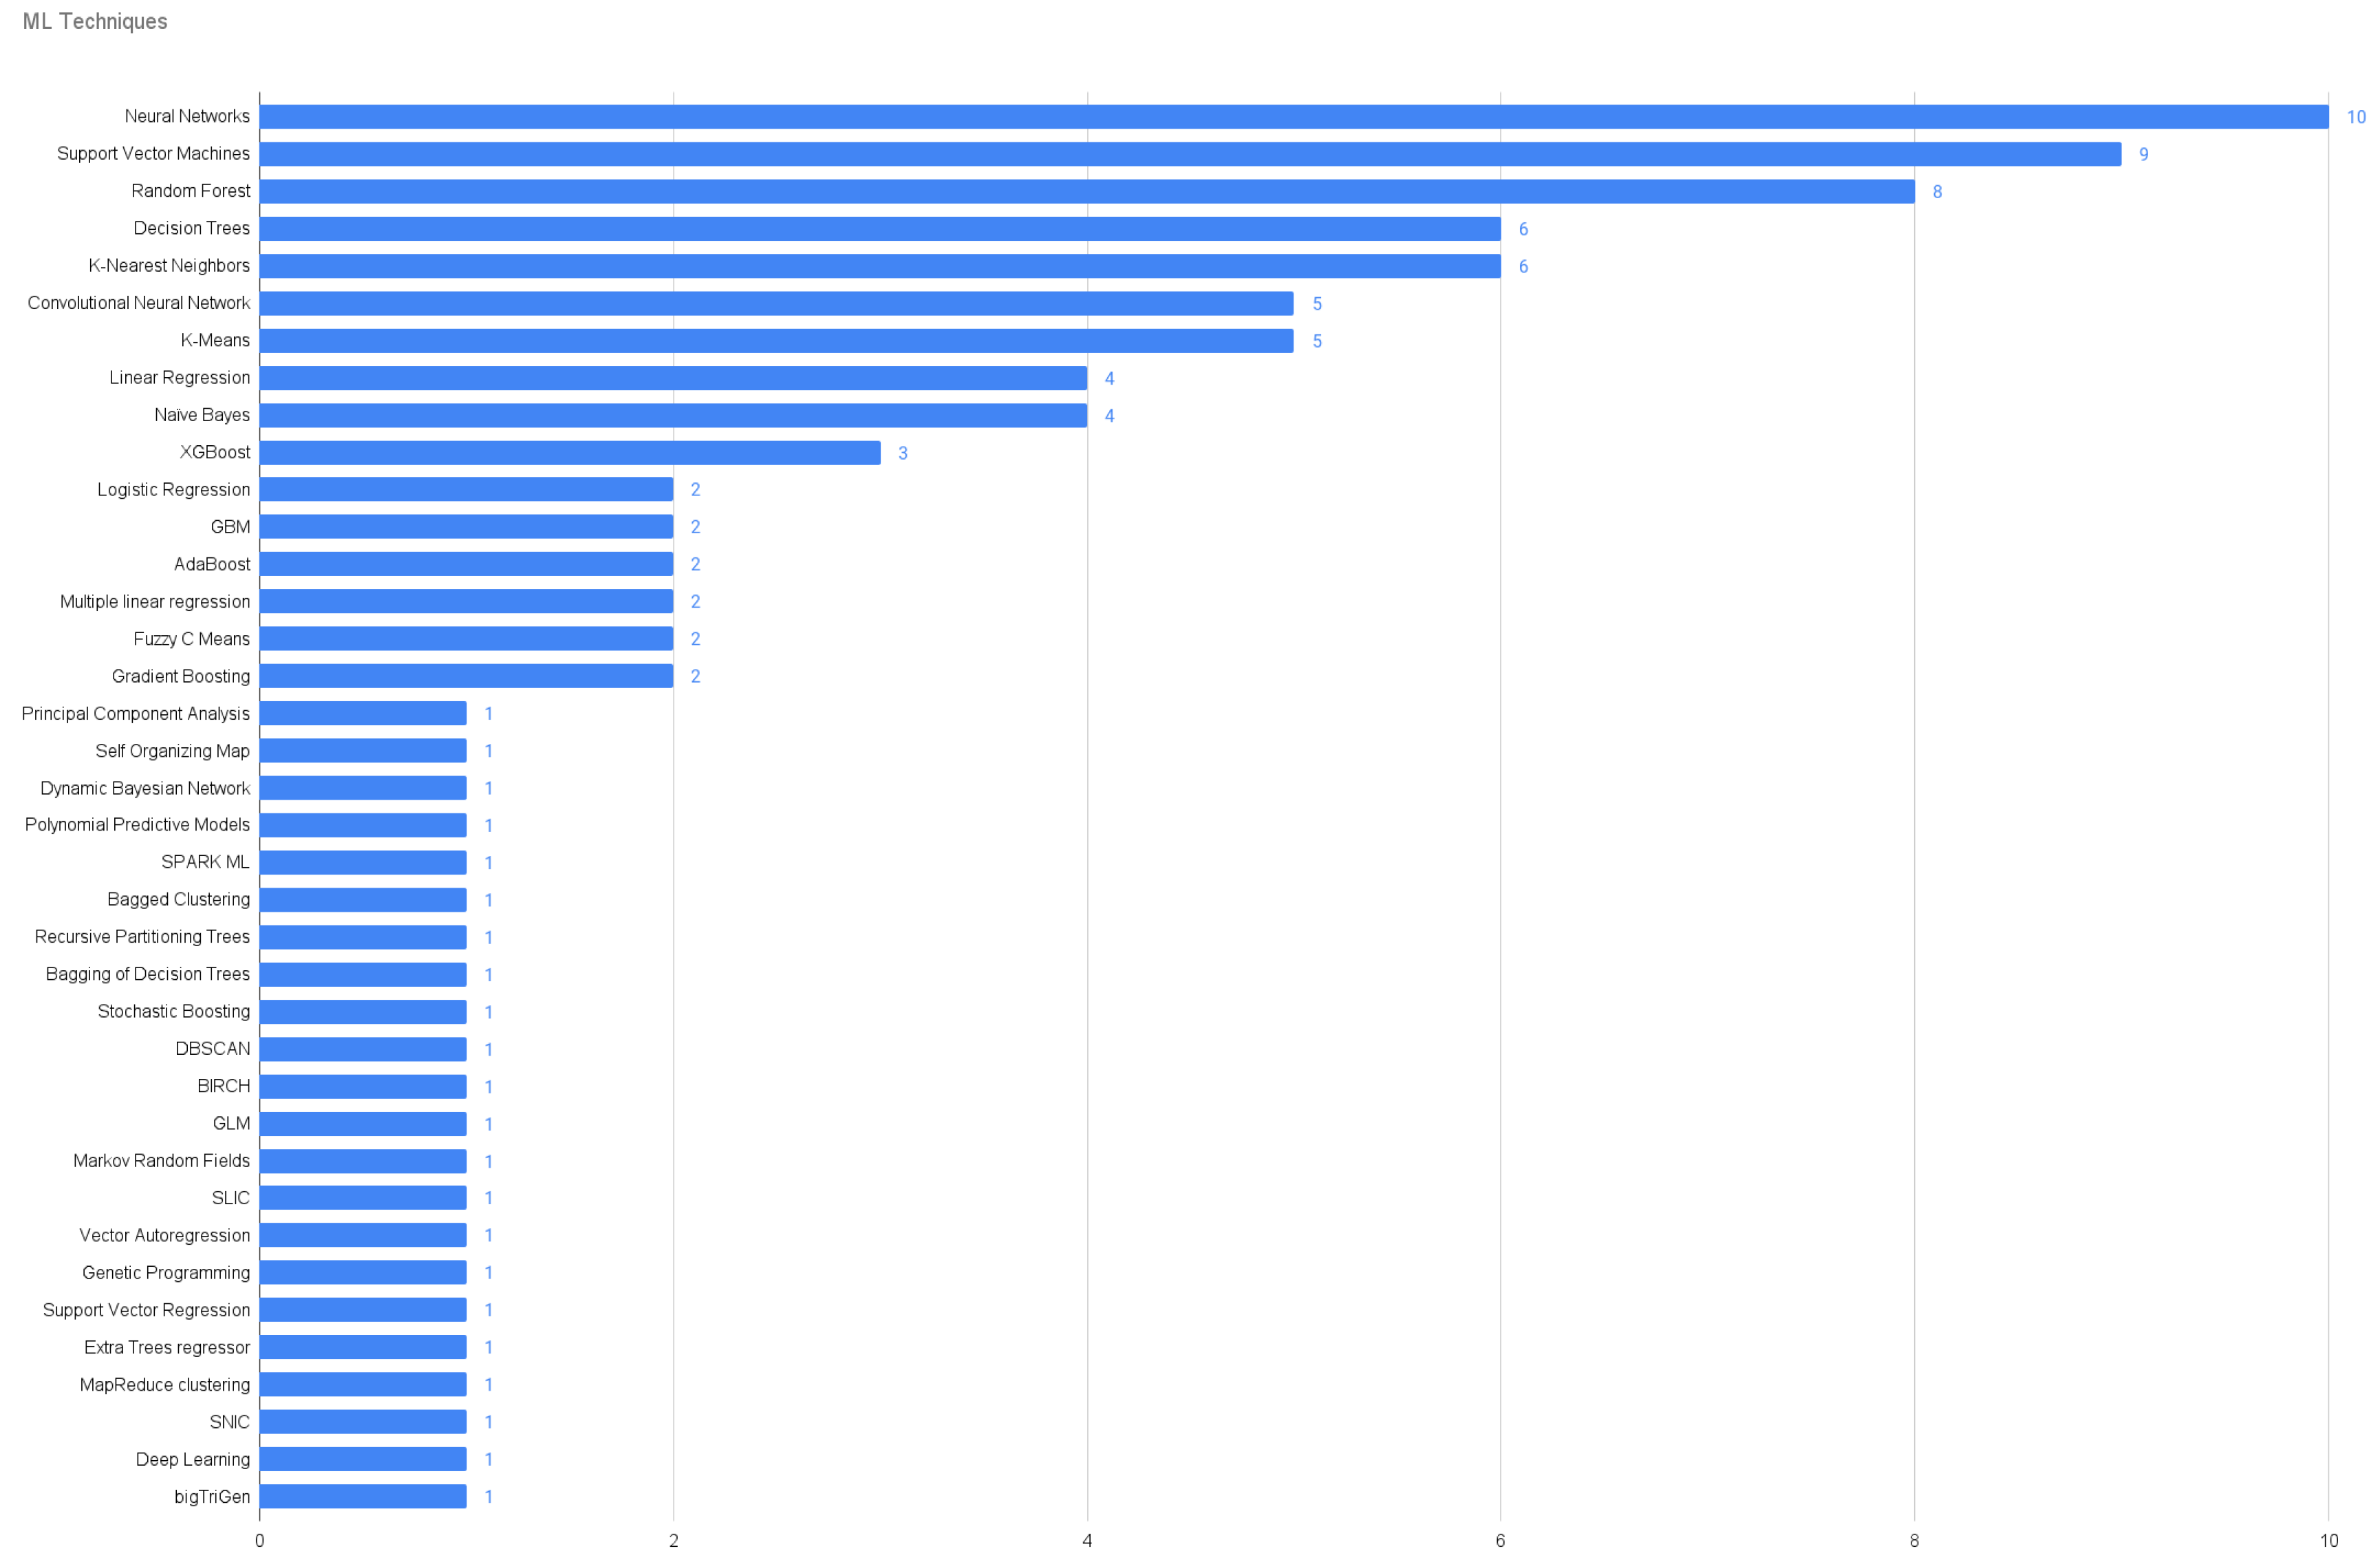
4.3.2. Machine Learning Algorithms
5. Discussion
6. Limitations of the Study
6.1. Construct Validity
6.2. Internal Validity
6.3. External Validity
6.4. Conclusion Validity
7. Conclusions
Author Contributions
Funding
Institutional Review Board Statement
Informed Consent Statement
Acknowledgments
Conflicts of Interest
Appendix A
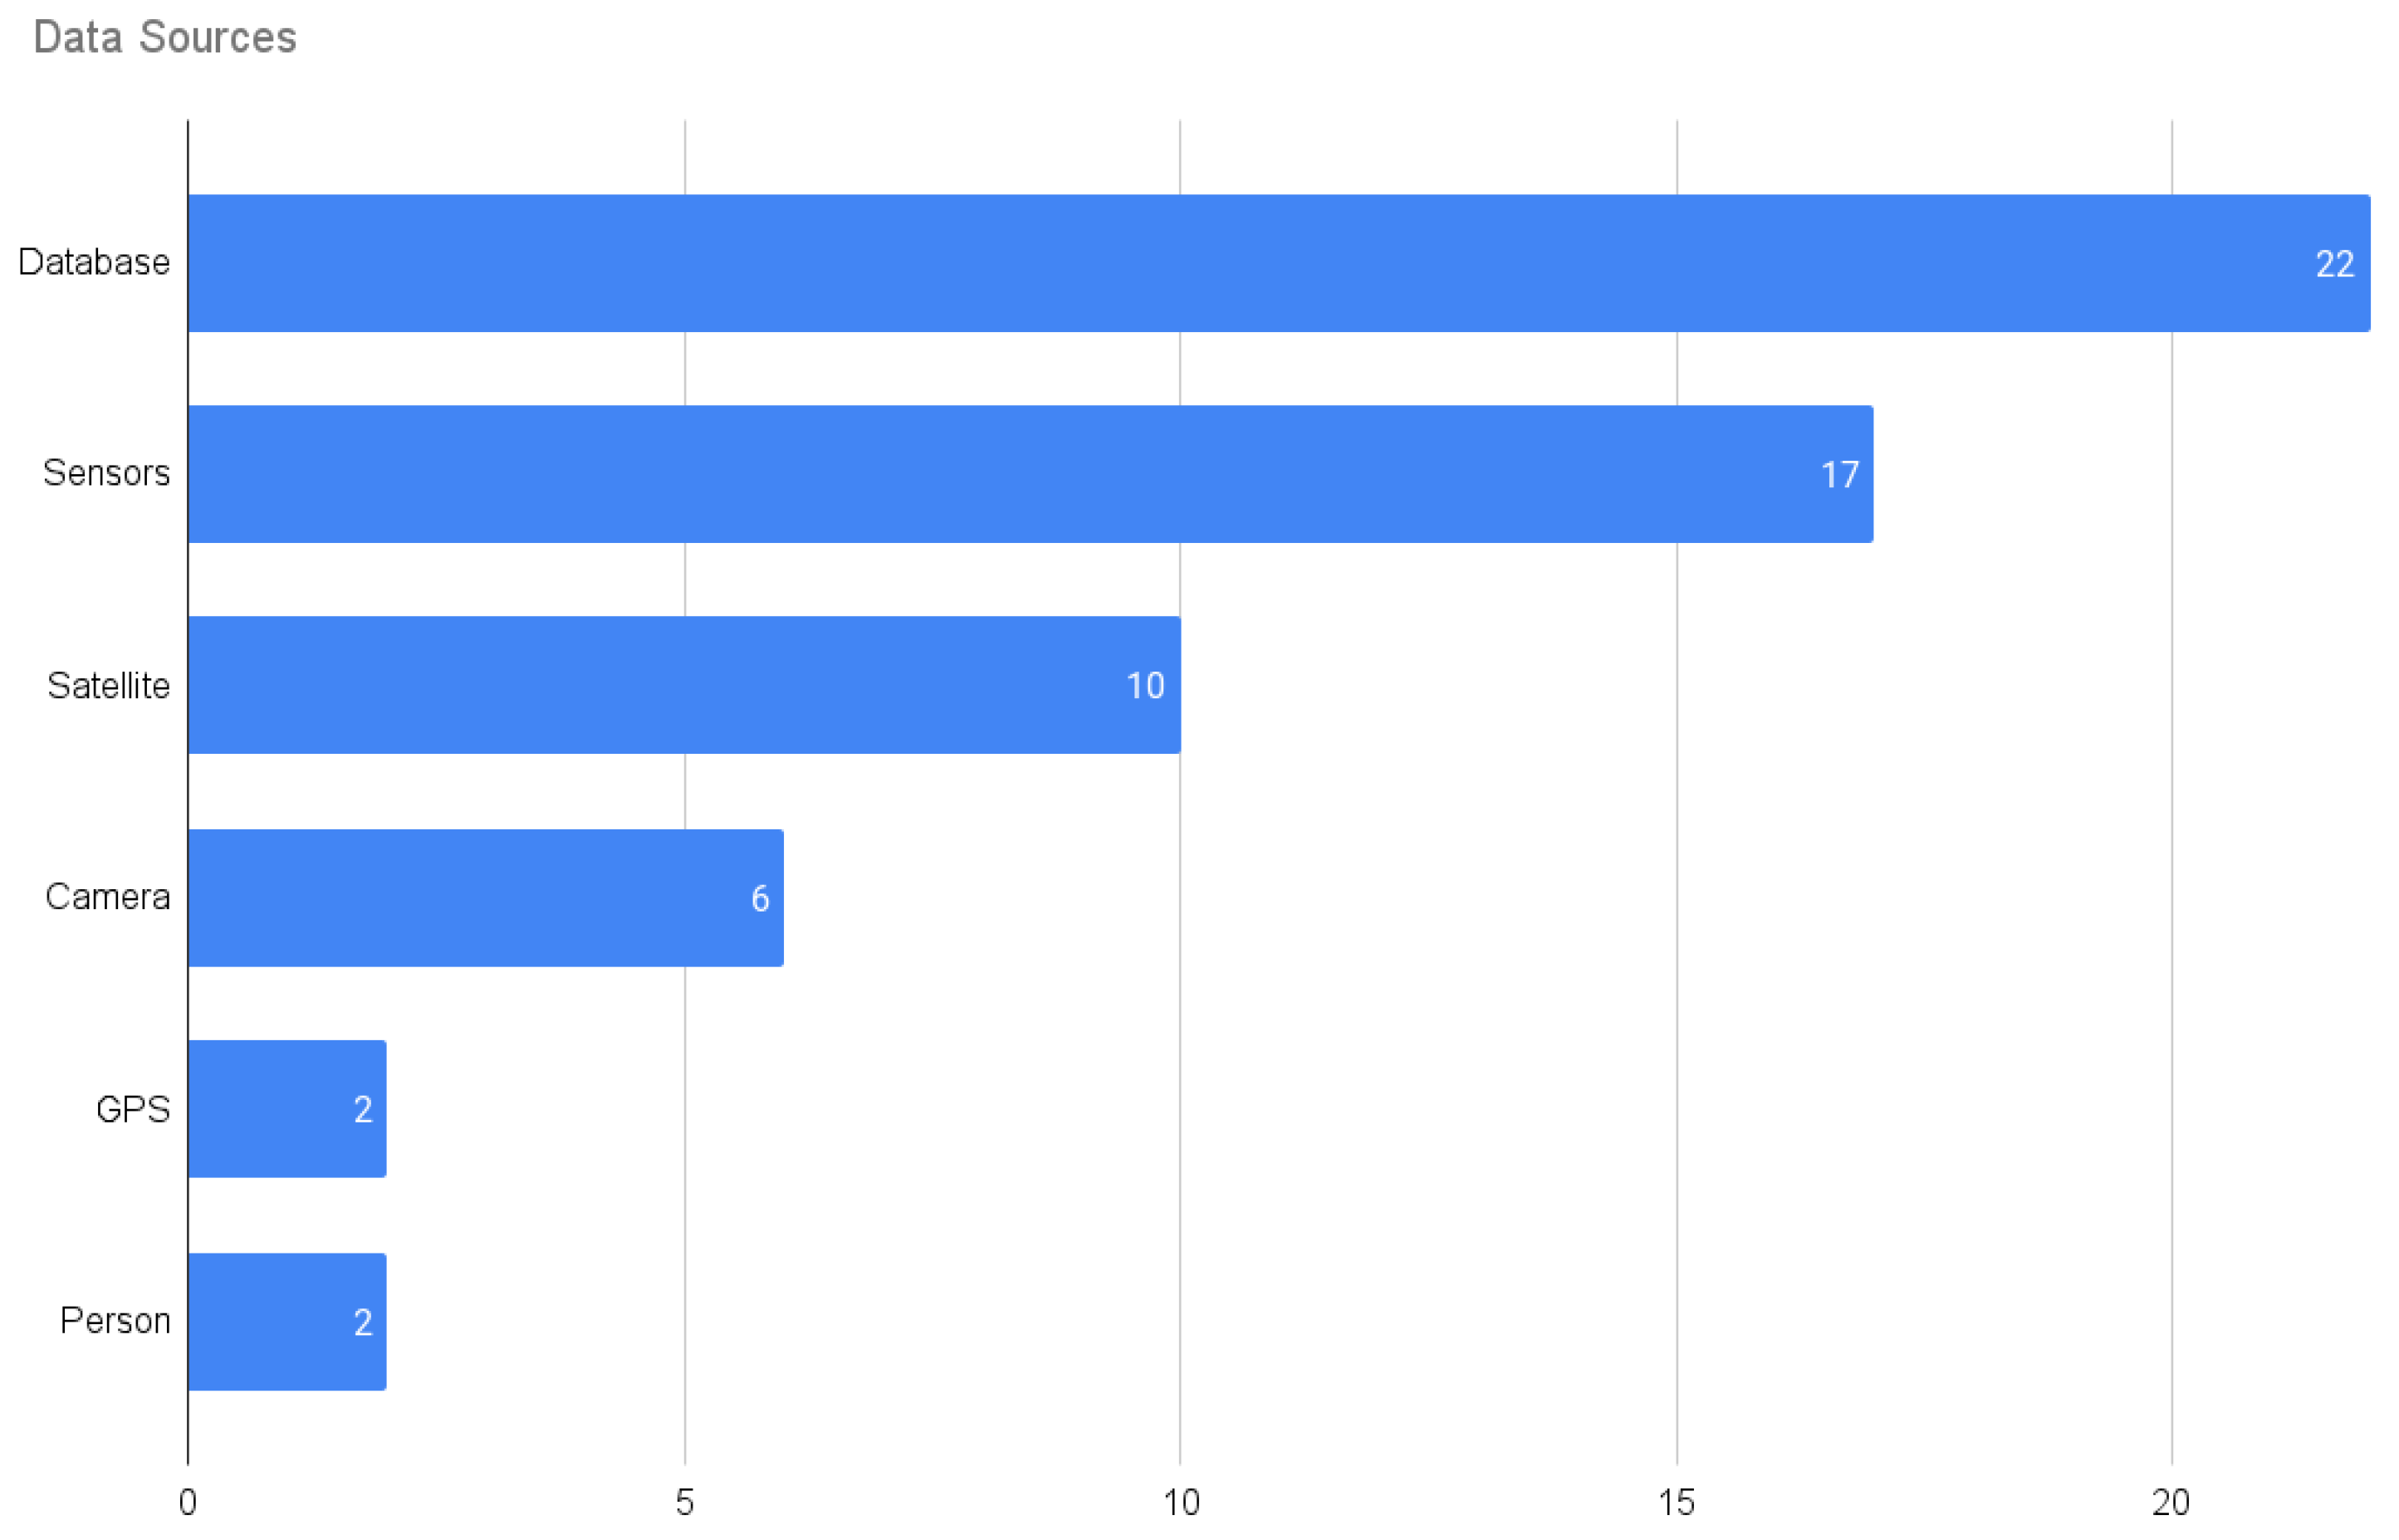
| Title | Category | Unstructured Data | Structured Data |
|---|---|---|---|
| Fruit disease prediction using machine learning over big data | Camera | camera images | stage of diseased fruit. |
| A hybrid machine learning approach to automatic plant phenotyping for smart agriculture | Camera | camera images | image hue, pixels. |
| A framework for the management of agricultural resources with automated aerial imagery detection | Camera, Database | drone images, digital surface models | type of tree, x (pixel), y (pixel), size, confidence, land, cover, class. |
| AgroConsultant: Intelligent Crop Recommendation System Using Machine Learning Algorithms | Database | X | soil type, aquifer thickness, soil pH, thickness of topsoil, precipitation, temperature, latitude, longitude, distance from sea, rainfall, area under cultivation. |
| Record linkage for farm-level data analytics: Comparison of deterministic, stochastic, and machine learning methods | Database | X | state, city, name, state ID, owner’s name. |
| Reference evapotranspiration estimation and modeling of the Punjab Northern India using deep learning | Database | X | max air temperature, min air temperature, average temperature, relative humidity, wind speed, solar radiation, sunshine hours, reference evotranspiration. |
| Big data and machine learning for crop protection | Database | soil pH, state of Shire, winter crop, amount of cultivation, stubble management. | |
| Adaptive and Efficient Streaming Time Series Forecasting with Lambda Architecture and Spark | Database | X | X |
| Towards modeling beef cattle management with Genetic Programming | Database | X | Consistency of all animals, percentage of artificial insemination, mean value of age of cows expressed in days, mean number of parturitions per cow, number of occurred deliveries, mean number of necessary inseminations which resulted in positive pregnancy diagnosis, etc. |
| Enhancement of Convolutional Neural Networks Classifier Performance in the Classification of IoT Big Data | Database | X | X |
| An adaptive model for forecasting seasonal rainfall using predictive analytics | Database | X | min temperature, max temperature, avg temperature, humidity, wind speed, precipitation, wind direction, cloud cover, visibility, atmosphere pressure. |
| Computer Vision for Smart Farming and Sustainable Agriculture | Database, Camera | drone images | X |
| Application of Google Earth Engine cloud computing platform, Sentinel imagery, and neural networks for crop mapping in Canada | Database, GPS, Satellite | SAR images, optical images | cropland class, number of field samples, VV and VH, NDVI and NDWI. |
| Machine Learning Applications on Agricultural Datasets for Smart Farm Enhancement | Database, Sensors | X | crop type, year of the time series, province, altitude total area, cultivation area, total crop production, total harvest production, temperature average, min and max, rainfall amount, amount of phosphate and potash minerals, etc. |
| Predicting climate types for the Continental United States using unsupervised clustering techniques | Database, Sensors | X | max temp, min temp, precipitation, month, year. |
| YieldPredict: A Crop Yield Prediction Framework for Smart Farms | Database, Sensors | X | State Name, district name, crop year, season, crop, area, production, seasonal rainfall, nitrogen, phosphorus, potassium, saline soil (ha), sodic soil (ha). |
| Cloud Approach to Automated Crop Classification Using Sentinel-1 Imagery | Satellite | SAR images | VV and VH polarizations. |
| Scalable distributed random forest classification for paddy rice mapping Asian conference on remote sensing ACRS 2019 | Satellite, Camera, Database | optical images, SAR images | VV and VH coefficients, NDVI, NDWI, PSRI, B8A, B12, B11, B08, B07, B06, B05, B04, B03, B02. |
| Real-Time Big Data Analytics for Agricultural Land Hotspot Prediction | Satellite, database | satellite images, CSV | precipitation, min temperature, max temperature, avg temperature, cloud cover, vapor pressure, wet day frequency, ground frost frequency, color bands ->RGB. |
| Big Data Architecture for Environmental Analytics | Satellite, Database, Person | satellite images, Domain Knowledge | X |
| Crop Prediction on the Region Belts of India: A Naïve Bayes MapReduce Precision Agricultural Model | Satellite, Database, Sensors | satellite images | soil moisture, rainfall, temperature, atmospheric pressure, relative humidity, wind speed, wind direction, soil temperature, radiation, diffusion rate. |
| Agricultural cropland extent and areas of South Asia derived using Landsat satellite 30 m time-series big-data using random forest machine learning algorithms on the Google Earth Engine cloud | Satellite, GPS | satellite images | RGB bands, NIR band, SWIR 1 and SWIR 2 bands, thermal bands, NDVI index, EVI index, NDWI index, latitude, longitude, slope. |
| Evaluation of agricultural climate and regional agricultural economic efficiency based on remote sensing analysis | Satellite, GPS | satellite images | latitude, longitude, position, shape, color, average, temperature, total power of agricultural development machinery, fixed employees in agriculture, forestry, animal husbandry and fishery, area of land used at the end of each year, amount of fertilizer, plastic used. |
| Animal monitoring based on IoT technologies | Sensors | camera video | hours of activity, travel times, preferred pasture areas and timings, anomalous situations, number of fence and posture infractions. |
| Machine learning prediction analysis using IoT for smart farming | Sensors | text, Web data, CSV | temperature, humidity. |
| Big data analytics and artificial intelligence serving agriculture | Sensors | X | temperature, dew point, humidity, pressure, visibility, wind direction, wind speed, burst speed, events, rain, weather conditions, month, day. |
| The Implementation of a Practical Agricultural Big Data System | Sensors | X | air temperature, air humidity, light intensity, soil moisture, fruit size, branch length, soil salinity, wind speed, wind direction, conductivity, soil temperature, CO2, pH. |
| Architecture Design of a Smart Farm System Based on Big Data Appliance Machine Learning | Sensors | X | color, weight, inner temperature, outer temperature, humidity. |
| Intelligent computational techniques for crops yield prediction and fertilizer management over big data environment | Sensors | X | temperature, rainfall, pH, water level, nitrogen, phosphorous, potassium, calcium, magnesium, sulfur. |
| Big data in precision agriculture: Weather forecasting for future farming. | Sensors | X | min temperature, max temperature, humidity, rainfall. |
| Botanical Internet of Things: Toward Smart Indoor Farming by Connecting People, Plant, Data and Clouds | Sensors, Camera | camera video | temperature, humidity, illumination intensity, air gasses (CO2, O2, O3, NO2), plant ID, time. |
| The effective yield of paddy crop in Sivaganga district – An initiative for smart farming | Sensors, Database | X | crop yield, farmer’s name, Place–Village–Panchayat–Taluk–District, survey number, contact details, soil type, paddy variety, types of fertilizers used at the different stages of cultivation, field size, Irrigation type. |
| An application of machine learning technique in forecasting crop disease | Sensors, Database, Person | X | temperature, relative humidity, wind speed, wind direction, precipitation accumulation, solar radiation, potato blight disease. |
| Design of Smart Agriculture Systems using Artificial Intelligence and Big Data Analytics | Camera | images, video, audio, telemetry data, user data, | temperature, light, humidity, and soil moisture. |
| Innovation of agricultural economic management in the process of constructing smart agriculture by big data | Database | GIS Data, social network, GPS Data | egg price, duck egg price, export volume, output, market elasticity, labor force change and inventory as variables. |
| A new big data triclustering approach for extracting three-dimensional patterns in precision agriculture | Satellite | Images | three-dimensional datasets, NDVI index, Soil-Adjusted Vegetation Index (SAVI) and the Enhanced Vegetation Index (EVI), and GNDVI. |
| Agricultural Irrigation Recommendation and Alert (AIRA) system using optimization and machine learning in Hadoop for sustainable agriculture | Sensors | X | temperature (ºC), relative humidity (%), mean sea level pressure (hPa), snowfall amount (cm), sunshine duration (Min), evapotranspiration (Mm), FAO reference evapotranspiration (mm), wind speed (Km/hr), wind direction (Aº), soil temperature (AºC), soil moisture (fraction). |
| Risk monitoring model of intelligent agriculture Internet of Things based on big data | Sensors | X | X |
| Application of Modern GIS and Remote Sensing Technology Based on Big Data Analysis in Intelligent Agriculture | Satellite | Images, document data. | X |
| Superior fuzzy enumeration crop prediction algorithm for big data agriculture applications | Database | X | Crop field dataset, name area. |
| Big Data Scheme from Remote Sensing Applications: Concluding Notes for Agriculture and Forestry Applications | Satellite | X | X |
| A Machine Learning Based Model for Energy Usage Peak Prediction in Smart Farms. | Sensors | X | Internal temperature, internal humidity, ventilation temperature, heating temperature, outside temperature, outside solar temperature, dew point, hourly accumulated light, hourly solar radiation, temperature difference, crop output production. |
| Monitoring Complex Integrated Crop–Livestock Systems at Regional Scale in Brazil: A Big Earth Observation Data Approach. | Satellite | X | NDVI, EVI, Near-Infrared spectral band (NIR) and Mid-Infrared spectral band (MIR). |
References
- Praveen, B.; Sharma, P. A review of literature on climate change and its impacts on agriculture productivity. J. Public Aff. 2019, 19, e1960. [Google Scholar] [CrossRef]
- Yaqoob, N.; Ali, S.A.; Kannaiah, D.; Khan, N.; Shabbir, M.S.; Bilal, K.; Tabash, M.I. The effects of Agriculture Productivity, Land Intensification, on Sustainable Economic Growth: A panel analysis from Bangladesh, India, and Pakistan Economies. Environ. Sci. Pollut. Res. Int. 2022, 1–9. [Google Scholar] [CrossRef]
- Wakelin, S.A.; Gomez-Gallego, M.; Jones, E.; Smaill, S.; Lear, G.; Lambie, S. Climate change induced drought impacts on plant diseases in New Zealand. Australas. Plant Pathol. 2018, 47, 101–114. [Google Scholar] [CrossRef]
- Liakos, K.; Busato, P.; Moshou, D.; Pearson, S.; Bochtis, D. Machine Learning in Agriculture: A Review. Sens. Multidiscip. Digit. Publ. Inst. 2018, 18, 2674. [Google Scholar] [CrossRef]
- Sundmaeker, H.; Verdouw, C.; Wolfert, S.; Pérez Freire, L. Internet of Food and Farm. In Digitising the Industry-Internet of Things Connecting the Physical, Digital and Virtual Worlds; Vermesan, O., Friess, P., Eds.; River Publishers: Delft, Denmark, 2017. [Google Scholar]
- Wolfert, S.; Ge, L.; Verdouw, C.; Bogaardt, M.J. Big data in smart farming–A review. Agric. Syst. 2017, 153, 69–80. [Google Scholar] [CrossRef]
- Nandyala, C.; Kim, H.K. Big and meta data management for U-agriculture mobile services. Int. J. Software Eng. Appl. IJSEIA 2016, 10, 257–270. [Google Scholar] [CrossRef]
- Cravero, A.; Sepúlveda, S. Use and Adaptations of Machine Learning in Big Data—Applications in Real Cases in Agriculture. Electronics 2021, 10, 552. [Google Scholar] [CrossRef]
- Ihde, N.; Marten, P.; Eleliemy, A.; Poerwawinata, G.; Silva, P.; Tolovski, I.; Ciorba, F.M.; Rabl, T. A Survey of Big Data, High Performance Computing, and Machine Learning Benchmarks. In Proceedings of the Technology Conference on Performance Evaluation and Benchmarking; Springer: Berlin/Heidelberg, Germany, 2021; pp. 98–118. [Google Scholar]
- Wu, Y.; Xiang, Y.; Ge, J.; Muller, P. High-performance computing for big data processing. Future Gener. Comput. Syst. 2018, 88, 693–695. [Google Scholar] [CrossRef]
- Sun, A.; Scanlon, B. How can Big Data and machine learning benefit environment and water management: A survey of methods, applications, and future directions. Environ. Res. Lett. IOP Publ. 2019, 14, 73001. [Google Scholar] [CrossRef]
- Cravero, A.; Pardo, S.; Sepúlveda, S.; Muñoz, L. Challenges to Use Machine Learning in Agricultural Big Data: A Systematic Literature Review. Agronomy 2022, 12, 748. [Google Scholar] [CrossRef]
- Saiz-Rubio, V.; Rovira-Más, F. From smart farming towards agriculture 5.0: A review on crop data management. Agronomy 2020, 10, 207. [Google Scholar] [CrossRef]
- Šuman, S.; Poščić, P.; Gligora Marković, M. Big Data Management Challenges. Int. J. Adv. Trends Comput. Sci. Eng. 2020, 9, 717–723. [Google Scholar] [CrossRef]
- Bhatnagar, R. Machine learning and big data processing: A technological perspective and review. In Proceedings of the International Conference on Advanced Machine Learning Technologies and Applications; Springer: Berlin/Heidelberg, Germany, 2018; pp. 468–478. [Google Scholar]
- Rasyid, L.; Andayani, S. Review on clustering algorithms based on data type: Towards the method for data combined of numeric-fuzzy linguistics. In Proceedings of the 5th International Conference on Research, Implementation, & Education of Mathematics and Sciences, 7–8 May 2018, Yogyakarta, Indonesia; IOP Publishing: Bristol, UK, 2018; Volume 1097, p. 012082. [Google Scholar]
- Nandi, G.; Sharma, R.K. Data Science Fundamentals and Practical Approaches: Understand Why Data Science Is the Next; BPB Publications: Uttar Pradesh, India, 2020. [Google Scholar]
- Firdaus, H.; Hassan, S.I. Unsupervised Learning on Healthcare Survey Data with Particle Swarm Optimization. In Machine Learning with Health Care Perspective; Springer: Berlin/Heidelberg, Germany, 2020; pp. 57–89. [Google Scholar]
- Kitchenham, B.; Charters, S. Guidelines for performing systematic literature reviews in software engineering. Thechnical Rep. Ebse´07. 2007. Available online: https://www.researchgate.net/publication/302924724GuidelinesforperformingSystematicLiteratureReviewsinSoftwareEngineering (accessed on 25 September 2022).
- Moher, D.; Liberati, A.; Tetzlaff, J.; Altman, D.G.; PRISMA Group. Preferred reporting items for systematic reviews and meta-analyses: The PRISMA statement. Ann. Intern. Med. 2009, 151, 264–269. [Google Scholar] [CrossRef] [PubMed]
- Lin, C.S.; Wang, Y.Y. Data type and data source preferences for six social sciences subjects in quantitative data reuses. Proc. Assoc. Inf. Sci. Technol. 2018, 55, 867–868. [Google Scholar] [CrossRef]
- Putra, H.Y.; Putra, H.; Kurniawan, N.B. Big data analytics algorithm, data type and tools in smart city: A systematic literature review. In Proceedings of the 2018 International Conference on Information Technology Systems and Innovation (ICITSI), Bandung, Indonesia, 22–26 October 2018; pp. 474–478. [Google Scholar]
- Fassnacht, F.; Hartig, F.; Latifi, H.; Berger, C.; Hernández, J.; Corvalán, P.; Koch, B. Importance of sample size, data type and prediction method for remote sensing-based estimations of aboveground forest biomass. Remote Sens. Environ. 2014, 154, 102–114. [Google Scholar] [CrossRef]
- Roy, D.; Shirazi, F. A Review on Multiple Data Source Based Recommendation Systems. In Proceedings of the 2021 International Conference on Computational Science and Computational Intelligence (CSCI), Las Vegas, NV, USA, 15–17 December 2021; pp. 1534–1539. [Google Scholar]
- Sassi, I.; Ouaftouh, S.; Anter, S. Adaptation of Classical Machine Learning Algorithms to Big Data Context: Problems and Challenges. In Proceedings of the 2019 1st International Conference on Smart Systems and Data Science (ICSSD), Rabat, Morocco, 3–4 October 2019; pp. 1–7. [Google Scholar]
- Elshawi, R.; Sakr, S.; Talia, D.; Trunfio, P. Big Data Systems Meet Machine Learning Challenges: Towards Big Data Science as a Service. Big Data Res. 2018, 14, 1–11. [Google Scholar] [CrossRef]
- Haig, B.D. Big data science: A philosophy of science perspective. In Big Data in Psychological Research; Woo, S.E., Tay, L., Proctor, R.W., Eds.; American Psychological Association: Washington, DC, USA, 2020; pp. 15–33. [Google Scholar]
- Santos, M.; e Sá, J.; Costa, C.; Galváo, J.; Andrade, C.; Martinho, B.; Lima, F.; Costa, E.; Lima, F. A big data analytics architecture for industry 4.0. In Proceedings of the World Conference on Information Systems and Technologies, Madeira, Portugal, 11–13 April 2017; Springer: Berlin/Heidelberg, Germany, 2017; pp. 175–184. [Google Scholar]
- Salma, C.A.; Tekinerdogan, B.; Athanasiadis, I.N. Chapter 4—Domain-Driven Design of Big Data Systems Based on a Reference Architecture; Morgan Kaufmann: Burlington, MA, USA, 2017; pp. 49–68. [Google Scholar] [CrossRef]
- Sowmya, R.; Suneetha, K. Data mining with big data. In Proceedings of the 2017 11th International Conference on Intelligent Systems and Control (ISCO), Coimbatore, India, 5–6 January 2017; pp. 246–250. [Google Scholar]
- Song, I.Y.; Zhu, Y. Big data and data science: What should we teach? Expert Syst. 2016, 33, 364–373. [Google Scholar] [CrossRef]
- Demchenko, Y.; De-Laat, C.; Membrey, P. Defining architecture components of the big data ecosystem. In Proceedings of the 2014 International Conference on Collaboration Technologies and Systems, CTS 2014, Minneapolis, MN, USA, 19–23 May 2014; pp. 104–112. [Google Scholar]
- Semlali, B.E.B.; Amrani, C.E.; Ortiz, G. Hadoop paradigm for satellite environmental big data processing. Int. J. Agric. Environ. Inf. Syst. 2020, 11, 23–47. [Google Scholar] [CrossRef]
- Alex, S.A.; Kanavalli, A. Intelligent computational techniques for crops yield prediction and fertilizer management over big data environment. Int. J. Innov. Technol. Explor. Eng. 2019, 8, 3521–3526. [Google Scholar] [CrossRef]
- Cherkassky, V.; Mulier, F. Learning from Data: Concepts, Theory, and Methods; John Wiley & Sons: Hoboken, NJ, USA, 2007. [Google Scholar]
- Rudin, C.; Wagstaff, K. Machine learning for science and society. Mach Learn. 2014, 95, 1–9. [Google Scholar] [CrossRef]
- Qiu, J.; Wu, Q.; Ding, G.; Xu, Y.; Feng, S. A survey of machine learning for big data processing. Eurasip J. Adv. Signal Process. 2016, 1, 1–16. [Google Scholar]
- Benos, L.; Tagarakis, A.C.; Dolias, G.; Berruto, R.; Kateris, D.; Bochtis, D. Machine Learning in Agriculture: A Comprehensive Updated Review. Sensors 2021, 21, 3758. [Google Scholar] [CrossRef] [PubMed]
- Bal, S.K. Agro-meteorological basis of extremes of temperature with special perspective to livestock and poultry. Clim. Resilient Anim. Husb. 2021, 23. [Google Scholar]
- Malik, A.; Burney, A.; Ahmed, F. A comparative study of unstructured data with SQL and NO-SQL database management systems. J. Comput. Commun. 2020, 8, 59–71. [Google Scholar] [CrossRef]
- Villars, R.L.; Olofson, C.W.; Eastwood, M. Big Data: What It Is and Why You Should Care; White Paper: Framingham, MA, USA, 2011. [Google Scholar]
- Eberendu, A.C.; Madonna University. Unstructured Data: An overview of the data of Big Data. Int. J. Comput. Trends Technol. 2016, 38, 46–50. [Google Scholar] [CrossRef]
- Sánchez, M.; Barrena, M.; Bustos, P.; Campillo, C.; García, P. Arquitectura software basada en tecnologías smart para agricultura de precisión. Jornadas Ing. Softw. Bases Datos 2020, 219, 219–349. [Google Scholar]
- Sambrekar, K.; Rajpurohit, V.S.; Joshi, J. A proposed technique for conversion of unstructured Agro-data to semi-structured or structured data. In Proceedings of the 2018 Fourth International Conference on Computing Communication Control and Automation (ICCUBEA), Pune, India, 16–18 August 2018. [Google Scholar]
- Alkathiri, M.; Jhummarwala, A.; Potdar, M.B. Multi-dimensional geospatial data mining in a distributed environment using MapReduce. J. Big Data 2019, 6, 1–34. [Google Scholar] [CrossRef]
- Guimarães, N.; Pádua, L.; Marques, P.; Silva, N.; Peres, E.; Sousa, J.J. Forestry Remote Sensing from Unmanned Aerial Vehicles: A review focusing on the data, processing and potentialities. Remote Sens. 2020, 12, 1046. [Google Scholar] [CrossRef]
- Press, F.; Siever, R. Earth. 1998. Available online: https://aws.amazon.com/earth/ (accessed on 19 November 2022).
- Gorelick, N.; Hancher, M.; Dixon, M.; Ilyushchenko, S.; Thau, D.; Moore, R. Google Earth Engine: Planetary-scale geospatial analysis for everyone. Remote Sens. Environ. 2017, 202, 18–27. [Google Scholar] [CrossRef]
- Pekel, J.F.; Cottam, A.; Gorelick, N.; Belward, A.S. High-resolution mapping of global surface water and its long-term changes. Nature 2016, 540, 418–422. [Google Scholar] [CrossRef]
- Padarian, J.; Minasny, B.; McBratney, A.B. Using Google’s cloud-based platform for digital soil mapping. Comput. Geosci. 2015, 83, 80–88. [Google Scholar] [CrossRef]
- Landset, S.; Khoshgoftaar, T.M.; Richter, A.N.; Hasanin, T. A survey of open source tools for machine learning with big data in the Hadoop ecosystem. J. Big Data 2015, 2, 1–36. [Google Scholar] [CrossRef]
- Odun-Ayo, I.; Ananya, M.; Agono, F.; Goddy-Worlu, R. Cloud computing architecture: A critical analysis. In Proceedings of the 2018 18th International Conference on Computational Science and Applications (ICCSA), Melbourne, Australia, 2–5 July 2018. [Google Scholar]
- Balducci, F.; Impedovo, D.; Pirlo, G. Machine learning applications on agricultural datasets for smart farm enhancement. Machines 2018, 6, 38. [Google Scholar] [CrossRef]
- Choudhary, N.K.; Chukkapalli, S.S.L.; Mittal, S.; Gupta, M.; Abdelsalam, M.; Joshi, A. YieldPredict: A Crop Yield Prediction Framework for Smart Farms. In Proceedings of the 2020 IEEE International Conference on Big Data (Big Data), Atlanta, GA, USA, 10–13 December 2020; pp. 2340–2349. [Google Scholar] [CrossRef]
- Gnanasankaran, N.; Ramaraj, E. The Effective Yield Of Paddy Crop In Sivaganga District-An Initiative For Smart Farming. Int. J. Sci. Technol. Res. 2020, 9, 2. [Google Scholar]
- Donzia, S.K.Y.; Kim, H.k. Architecture Design of a Smart Farm System Based on Big Data Appliance Machine Learning. In Proceedings of the 2020 20th International Conference on Computational Science and Its Applications (ICCSA), Cagliari, Italy, 1–4 July 2020; pp. 45–52. [Google Scholar] [CrossRef]
- Priya, R.; Ramesh, D.; Khosla, E. Crop Prediction on the Region Belts of India: A Naïve Bayes MapReduce Precision Agricultural Model. In Proceedings of the 2018 International Conference on Advances in Computing, Communications and Informatics (ICACCI), Bangalore, India, 19–22 September 2018; pp. 99–104. [Google Scholar]
- Shelestov, A.; Lavreniuk, M.; Vasiliev, V.; Shumilo, L.; Kolotii, A.; Yailymov, B.; Kussul, N.; Yailymova, H. Cloud Approach to Automated Crop Classification Using Sentinel-1 Imagery. IEEE Trans. Big Data 2019, 6, 572–582. [Google Scholar] [CrossRef]
- Yahata, S.; Onishi, T.; Yamaguchi, K.; Ozawa, S.; Kitazono, J.; Ohkawa, T.; Yoshida, T.; Murakami, N.; Tsuji, H. A hybrid machine learning approach to automatic plant phenotyping for smart agriculture. In Proceedings of the 2017 International Joint Conference on Neural Networks (IJCNN), Anchorage, AK, USA, 4–19 May 2017; pp. 1787–1793. [Google Scholar]
- Ochoa, K.S.; Guo, Z. A framework for the management of agricultural resources with automated aerial imagery detection. Comput. Electron. Agric. 2019, 162, 53–69. [Google Scholar] [CrossRef]
- Fenu, G.; Malloci, F.M. An application of machine learning technique in forecasting crop disease. In Association for Computing Machinery; 2019; pp. 76–82. [Google Scholar] [CrossRef]
- TOMBE, R. Computer Vision for Smart Farming and Sustainable Agriculture. In Proceedings of the 2020 IST-Africa Conference (IST-Africa), Kampala, Uganda, 18–22 May 2020. [Google Scholar]
- Dutta, R.; Li, C.; Smith, D.; Das, A.; Aryal, J. Big Data Architecture for Environmental Analytics. Int. Symp. Environ. Softw. Syst. 2015, 578–588. [Google Scholar]
- Doshi, Z.; Nadkarni, S.; Agrawal, R.; Shah, N. AgroConsultant: Intelligent Crop Recommendation System Using Machine Learning Algorithms. In Proceedings of the 2018 Fourth International Conference on Computing Communication Control and Automation (ICCUBEA), Pune, India, 16–18 August 2018; pp. 1–6. [Google Scholar]
- Rehman, A.; Liu, J.; Keqiu, L.; Mateen, A.; Yasin, M.Q. Machine learning prediction analysis using IoT for smart farming. Int. J. Emerg. Trends Eng. Res. 2020, 8, 6482–6487. [Google Scholar]
- Tarik, H.; Mohammed, O.J. Big Data Analytics and Artificial Intelligence Serving Agriculture. In Proceedings of the Advanced Intelligent Systems for Sustainable Development (AI2SD’2019), Marrakech, Morocco, 8–11 July 2019; Ezziyyani, M., Ed.; Springer International Publishing: Cham, Switzerland, 2020; pp. 57–65. [Google Scholar]
- Kumari, M.; Kumar, A.; Singh, P.; Singh, S. Multidisciplinary Real-Time Model for Smart Agriculture based on Weather Forecasting Using IoT, Machine Learning, Big Data and Cloud. In Proceedings of the 2021 5th International Conference on Information Systems and Computer Networks (ISCON), Mathura, India, 22–23 October 2021; pp. 1–5. [Google Scholar]
- Katyayan, A.; Mashelkar, S.; DC, A.G.; Morajkar, S. Design of Smart Agriculture Systems using Artificial Intelligence and Big Data Analytics. In Proceedings of the 2021 3rd International Conference on Advances in Computing, Communication Control and Networking (ICAC3N), Greater Noida, India, 17–18 December 2021; pp. 592–595. [Google Scholar]
- Melgar-García, L.; Gutiérrez-Avilés, D.; Godinho, M.T.; Espada, R.; Brito, I.S.; Martínez-Álvarez, F.; Troncoso, A.; Rubio-Escudero, C. A new big data triclustering approach for extracting three-dimensional patterns in precision agriculture. Neurocomputing 2022, 500, 268–278. [Google Scholar] [CrossRef]
- Wang, Q.; Mu, Z. Risk monitoring model of intelligent agriculture Internet of Things based on big data. Sustain. Energy Technol. Assess. 2022, 53, 102654. [Google Scholar] [CrossRef]
- Wang, X.; Yu, S.; Wen, Z.; Zhang, L.; Fang, C.; Jiang, L. Application of Modern GIS and Remote Sensing Technology Based on Big Data Analysis in Intelligent Agriculture. J. Indian Soc. Remote. Sens. 2022, 1–11. [Google Scholar] [CrossRef]
- Ahamed, T. Big Data Scheme from Remote Sensing Applications: Concluding Notes for Agriculture and Forestry Applications. In Remote Sensing Application; Springer: Berlin/Heidelberg, Germany, 2022; pp. 351–361. [Google Scholar]
- Venkatesan, S.; Lim, J.; Ko, H.; Cho, Y. A Machine Learning Based Model for Energy Usage Peak Prediction in Smart Farms. Electronics 2022, 11, 218. [Google Scholar] [CrossRef]
- Kuchler, P.C.; Simões, M.; Ferraz, R.; Arvor, D.; de Almeida Machado, P.L.O.; Rosa, M.; Gaetano, R.; Bégué, A. Monitoring Complex Integrated Crop–Livestock Systems at Regional Scale in Brazil: A Big Earth Observation Data Approach. Remote Sens. 2022, 14, 1648. [Google Scholar] [CrossRef]
- Nóbrega, L.; Tavares, A.; Cardoso, A.; Gonzalves, P. Animal monitoring based on IoT technologies. In Proceedings of the 2018 IoT Vertical and Topical Summit on Agriculture-Tuscany (IOT Tuscany), Tuscany, Italy, 8–9 May 2018; pp. 1–5. [Google Scholar]
- Yang, J.; Liu, M.; Lu, J.; Miao, Y.; Hossain, M.A.; Alhamid, M.F. Botanical Internet of Things: Toward Smart Indoor Farming by Connecting People, Plant, Data and Clouds. Mob. Netw. Appl. 2018, 23, 188–202. [Google Scholar] [CrossRef]
- Wang, X.; Yang, K.; Liu, T. The Implementation of a Practical Agricultural Big Data System. In Proceedings of the 2019 IEEE 5th International Conference on Computer and Communications (ICCC), Chengdu, China, 6–9 December 2019; pp. 1955–1959. [Google Scholar]
- Veerachamy, R.; Ramar, R. Agricultural Irrigation Recommendation and Alert (AIRA) system using optimization and machine learning in Hadoop for sustainable agriculture. Environ. Sci. Pollut. Res. 2022, 29, 19955–19974. [Google Scholar] [CrossRef] [PubMed]
- Bendre, M.R.; Thool, R.C.; Thool, V.R. Big data in precision agriculture: Weather forecasting for future farming. In Proceedings of the 2015 1st International Conference on Next Generation Computing Technologies (NGCT) IEEE, Dehradun, India, 4–5 September 2015; pp. 744–750. [Google Scholar]
- Yang, C.; Huang, Q.; Li, Z.; Liu, K.; Hu, F. Big Data and cloud computing: Innovation opportunities and challenges. Int. J. Digit. Earth 2017, 10, 13–53. [Google Scholar] [CrossRef]
- Vasumathi, M.T.; Kamarasan, M. Fruit disease prediction using machine learning over big data. Int. J. Recent Technol. Eng. 2019, 7, 556–559. [Google Scholar]
- Amani, M.; Kakooei, M.; Moghimi, A.; Ghorbanian, A.; Ranjgar, B.; Mahdavi, S.; Davidson, A.; Fisette, T.; Rollin, P.; Brisco, B.; et al. Application of google earth engine cloud computing platform, sentinel imagery, and neural networks for crop mapping in Canada. Remote Sens. 2020, 12, 3561. [Google Scholar] [CrossRef]
- Sathiaraj, D.; Huang, X.; Chen, J. Predicting climate types for the Continental United States using unsupervised clustering techniques. Environmetrics 2019, 30, e2524. [Google Scholar] [CrossRef]
- Ip, R.H.; Ang, L.M.; Seng, K.P.; Broster, J.C.; Pratley, J.E. Big data and machine learning for crop protection. Comput. Electron. Agric. 2018, 151, 376–383. [Google Scholar] [CrossRef]
- Saggi, M.K.; Jain, S. Reference evapotranspiration estimation and modeling of the Punjab Northern India using deep learning. Comput. Electron. Agric. 2019, 156, 387–398. [Google Scholar] [CrossRef]
- Reddy, P.C.; Sureshbabu, A. An adaptive model for forecasting seasonal rainfall using predictive analytics. Int. J. Intell. Eng. Syst. 2019, 12, 22–32. [Google Scholar] [CrossRef]
- Sumalatha, M.R.; Akila, M. Real Time Big Data Analytics for Agricultural Land Hotspot Prediction; Institute of Electrical and Electronics Engineers Inc.: Piscataway, NJ, USA, 2019; pp. 411–416. [Google Scholar] [CrossRef]
- Abbona, F.; Vanneschi, L.; Bona, M.; Giacobini, M. Towards modelling beef cattle management with Genetic Programming. Livest. Sci. 2020, 241, 104205. [Google Scholar] [CrossRef]
- Su, Y.; Wang, X. Innovation of agricultural economic management in the process of constructing smart agriculture by big data. Sustain. Comput. Inform. Syst. 2021, 31, 100579. [Google Scholar] [CrossRef]
- Velmurugan, P.; Kannagi, A.; Varsha, M. Superior fuzzy enumeration crop prediction algorithm for big data agriculture applications. Mater. Today Proc. 2021. [Google Scholar] [CrossRef]
- Sitokonstantinou, V.; Drivas, T.; Koukos, A.; Papoutsis, I.; Kontoes, C. Scalable distributed random forest classification for paddy rice mapping. Zenodo 2020, 11. [Google Scholar] [CrossRef]
- Gumma, M.K.; Thenkabail, P.; Teluguntla, P.; Oliphant, A.; Xiong, J.; Giri, C.; Pyla, V.; Dixit, S.; Whitbread, A. Agricultural cropland extent and areas of South Asia derived using Landsat satellite 30-m time-series big-data using random forest machine learning algorithms on the Google Earth Engine cloud. Giscience Remote Sens. Taylor Fr. 2020, 57, 302–322. [Google Scholar] [CrossRef]
- Mangewa, L.J.; Ndakidemi, P.A.; Alward, R.D.; Kija, H.K.; Bukombe, J.K.; Nasolwa, E.R.; Munishi, L.K. Comparative Assessment of UAV and Sentinel-2 NDVI and GNDVI for Preliminary Diagnosis of Habitat Conditions in Burunge Wildlife Management Area, Tanzania. Earth 2022, 3, 769–787. [Google Scholar] [CrossRef]
- Zhen, Z.; Chen, S.; Yin, T.; Chavanon, E.; Lauret, N.; Guilleux, J.; Henke, M.; Qin, W.; Cao, L.; Li, J.; et al. Using the negative soil adjustment factor of soil adjusted vegetation index (Savi) to resist saturation effects and estimate leaf area index (lai) in dense vegetation areas. Sensors 2021, 21, 2115. [Google Scholar] [CrossRef]
- Aiken, V.C.F.; Dórea, J.R.R.; Acedo, J.S.; de Sousa, F.G.; Dias, F.G.; de Magalhães Rosa, G.J. Record linkage for farm-level data analytics: Comparison of deterministic, stochastic and machine learning methods. Comput. Electron. Agric. 2019, 163, 104857. [Google Scholar] [CrossRef]
- Amaechi, E.S.; Pham, H.V. Enhancement of Convolutional Neural Networks Classifier Performance in the Classification of IoT Big Data. In Proceedings of the 4th International Conference on Machine Learning and Soft Computing, Association for Computing Machinery, Haiphong City, Vietnam, 17–19 January 2020; pp. 25–29. [Google Scholar] [CrossRef]
- Ye, S.; Liu, D.; Yao, X.; Tang, H.; Xiong, Q.; Zhuo, W.; Song, C. RDCRMG: A raster dataset clean & reconstitution multi-grid architecture for remote sensing monitoring of vegetation dryness. Remote Sens. 2018, 10, 1376. [Google Scholar]
- Xu, C.; Du, X.; Yan, Z.; Fan, X. ScienceEarth: A big data platform for remote sensing data processing. Remote Sens. 2020, 12, 607. [Google Scholar] [CrossRef]
- Sawadogo, P.; Darmont, J. On data lake architectures and metadata management. J. Intell. Inf. Syst. 2021, 56, 97–120. [Google Scholar] [CrossRef]
- Batini, C.; Rula, A.; Scannapieco, M.; Viscusi, G. From data quality to big data quality. J. Database Manag. JDM 2015, 26, 60–82. [Google Scholar] [CrossRef]
- Al-Fuqaha, A.; Guizani, M.; Mohammadi, M.; Aledhari, M.; Ayyash, M. Internet of Things: A survey on enabling technologies, protocols, and applications. IEEE Commun. Surv. Tutor. 2015, 17, 2347–2376. [Google Scholar] [CrossRef]
- Farooq, M.S.; Riaz, S.; Abid, A.; Umer, T.; Zikria, Y. Role of IoT Technology in Agriculture: A Systematic Literature Review. Electron. Multidiscip. Digit. Publ. Inst. 2020, 9, 319. [Google Scholar] [CrossRef]


| Classification | Supervised Learning | Unsupervised Learning | Reinforcement Learning |
|---|---|---|---|
| Data processing tasks | Classification Estimation Regression | Prediction Clustering | Decision-making |
| Learning algorithms | Support vector machine Hidden Markov model Naive Bayes Neural networks Bayesian networks | Gaussian mixture model K-means X-means | Q-learning Sarsa learning TD-learning R-learning |
| Source | Examples |
|---|---|
| Radar | Seismic, oceanographic, meteorological, and vehicular. |
| Static | PDF files, printable files, scanned documents, faxes. |
| Dynamics | This type is derived from documents that can be created, edited, reviewed, and approved by many people or groups, such as white papers, policy procedures, business documents, and other office documents. |
| Digital media | Audio, video, animation, and images. |
| Communication documents | Email, social content, web documents, and instant messaging records |
| Location/Geo Data | Remote sensing images, sensors, GPS, weather, traffic. |
| Social Media | Facebook, YouTube, Instagram, LinkedIn. |
| Sensor | Weblogs, Detail Record, equipment longs, smart meters, manufacturing sensors, trading systems, data records. |
| Logs | File log, clickstream |
| Transactions | Web store, Customer information from CRM systems, transactional ERP, general ledger. |
| Micro-Bloggins | Customer feedback streams, Twitter |
| Author | Data | Type of Data |
|---|---|---|
| [53] | Temperature average, min and max, rainfall amount, amount of phosphate and potash minerals, humidity, geo-coordinates (station id, point of presence (Poi), latitude, longitude, altitude), sun’s rays incidence (r_inc), wind speed and direction, atmospheric pressure, etc. | Int |
| [57] | Air temperature, relative humidity, wind speed, wind direction, soil temperature, soil moisture, radiation, diffusion rate, and precipitation. | Int |
| [75] | Hours of activity, travel times, preferred pasture areas and timings, anomalous situations, number of fence and posture infractions. | Int, String |
| [76] | Plant data: temperature, humidity, illumination intensity, air gasses (CO2, O2, O3, NO2), plant ID, time; system user data: such as name, password, and role; video file data: device, location, time, access port. | Int, DateTime, String |
| [77] | Air temperature, air humidity, light intensity, soil moisture, fruit size, branch length, soil salinity, wind speed, wind direction, conductivity, soil temperature, CO2, PH. | Int, Float |
| [34] | Temperature, rainfall, PH, water level, nitrogen, phosphorous, potassium, calcium, magnesium, sulfur | Int, Float |
| [54] | Nitrogen, phosphorus, potassium, saline soil (ha), sodic soil (ha). | Int, Float |
| [65] | Temperature, humidity | Int, Float |
| [66] | Temperature, dew point, humidity, pressure, visibility, wind direction, wind speed, burst speed, events, rain, weather conditions, month, day. | Int |
| [56] | Color, weight, inner temperature, outer temperature, humidity. | String, Int, DateTime |
| [67] | Temperature, humidity, moisture, and rain. | Int, Float |
| [78] | Temperature, relative humidity, mean sea level pressure (hPa), snowfall amount, sunshine duration, evapotranspiration, FAO reference evapotranspiration, wind speed, wind direction, soil temperature, soil moisture. | Int, Float |
| [73] | Internal temperature, internal humidity, ventilation temperature, heating temperature, outside temperature, outside solar temperature, dew point, hourly accumulated light, hourly solar radiation, temperature difference, crop output production | Int, Float, String |
| Author | Data | Type of Data |
|---|---|---|
| [75] | Anomalous situations, preferred pasture areas and timings, posture infractions, and number of fences | JSON |
| [83] | Daily climate datasets from the Applied Climate Information System (ACIS) | Clave-valor |
| [54] | Crop year, season, state name, district name, crop, area, seasonal rainfall, production | RDF triple store |
| [81] | Stage of deseased fruit | JSON |
| [95] | State, city, name, state ID, owner’s name | Spreadsheet |
| Author | Data | Type of Data |
|---|---|---|
| [75] | Referred pasture areas and timings, anomalous situations, patterns of movement, food preferences. | Videos |
| [80] | Videos of the state of growth of plants. | Videos |
| [65] | Text, Web data, CSV | Spreadsheets, Web Data, CSV |
| [63] | Satellite images, domain knowledge | Spectral images, RDF, URI, |
| [59] | Imágenes | RGB image |
| [60] | Drone images, digital surface models, high-resolution UAV imagery | RGB image |
| [87] | Satellite images, archives | RGB image, CSV, GeoTiff |
| [82] | SAR images SGX dual-polarization RADARSAT-2 in the mode Wide, optical images Landsat-8, VV, VH | Spectral image, RGB, ASCII, HDF |
| [58] | SAR images, VV, VH polarizations | Spectral images, ASCII, HDF, GeoTiff |
| [91] | Optical images, SAR images, VV and VH coefficients | Spectral images, RGB |
| [92] | Satellite images | Spectral images, ASCII, HDF, GeoTiff |
| [67] | CSV | CSV |
| [68] | Images, video, audio, telemetry data, user data | Documents, RGB image, CSV, videos |
| [69] | Images | RGB image |
| [71] | Images, GPS, documents data | RGB image, points, PDF |
Publisher’s Note: MDPI stays neutral with regard to jurisdictional claims in published maps and institutional affiliations. |
© 2022 by the authors. Licensee MDPI, Basel, Switzerland. This article is an open access article distributed under the terms and conditions of the Creative Commons Attribution (CC BY) license (https://creativecommons.org/licenses/by/4.0/).
Share and Cite
Cravero, A.; Pardo, S.; Galeas, P.; López Fenner, J.; Caniupán, M. Data Type and Data Sources for Agricultural Big Data and Machine Learning. Sustainability 2022, 14, 16131. https://doi.org/10.3390/su142316131
Cravero A, Pardo S, Galeas P, López Fenner J, Caniupán M. Data Type and Data Sources for Agricultural Big Data and Machine Learning. Sustainability. 2022; 14(23):16131. https://doi.org/10.3390/su142316131
Chicago/Turabian StyleCravero, Ania, Sebastián Pardo, Patricio Galeas, Julio López Fenner, and Mónica Caniupán. 2022. "Data Type and Data Sources for Agricultural Big Data and Machine Learning" Sustainability 14, no. 23: 16131. https://doi.org/10.3390/su142316131
APA StyleCravero, A., Pardo, S., Galeas, P., López Fenner, J., & Caniupán, M. (2022). Data Type and Data Sources for Agricultural Big Data and Machine Learning. Sustainability, 14(23), 16131. https://doi.org/10.3390/su142316131