Exploration of Urban Network Spatial Structure Based on Traffic Flow, Migration Flow and Information Flow: A Case Study of Shanxi Province, China
Abstract
1. Introduction
2. Materials and Methods
2.1. Study Area
2.2. Data Sources
- (1)
- Traffic flow. In the provincial area, there is mainly short—and medium—distance commuting, and railway and road transportation reflect the interactions between cities [27]. Therefore, this study uses frequency data between the two cities as the traffic data source. The frequency of trains, bullet trains, and high-speed rails is obtained from the ticketing system of the China Railway Customer Service Center website (http://www.12306.cn (accessed on 28 June 2022)), and the bus data are obtained from Fliggy Travel. Both road and rail trip frequencies are relatively fixed, and both are selected as representatives of the 28 June 2022 data to calculate inter-city transportation connections.
- (2)
- Migration flow. The migration scale index between the two cities is used. It is derived from the Baidu migration data platform provided by Baidu Map (http://index.baidu.com (accessed on 24 June 2022)), which displays the trajectory of population flow in the selected period in real time, dynamically and intuitively, and shapes the path and intensity of the population flow process. The Baidu migration platform shows the in-migration/out-migration scale index of the provinces and cities in mainland China and provides about 100 of the most popular migration destinations at the prefecture and provincial levels, as well as the highest percentage people moving from/into neighboring regions [28]. The migration size index is used to reflect the size of the in-migration or out-migration population; the popular in-migration/out-migration location ratio is the ratio of the in-migration/out-migration to a city to the total in-migration/out-migration population of the country. In this study, the product of the scale index of in-migration/out-migration and the proportion of the in-migration/out-migration population is used to characterize the scale index of in-migration/out-migration between the two cities.
- (3)
- Information flow. Based on the search volume between the two cities, data are derived from the Baidu Index platform (https://index.baidu.com (accessed on 20 June 2022)), which consist of trend research, demand mapping, and crowd profiling. By using the Baidu index trend research function and taking the input keywords as the statistical object, it can scientifically and effectively analyze and calculate the sum of the search frequency of the searched keywords on the Baidu website, which can be expressed by a visual curve and specific index (the search index includes PC daily mean, moving daily mean, and overall daily mean) [20]. This study adopts the overall daily average between the two cities and obtains the search volume of Baidu users between cities using the place names of cities in Shanxi Province as keywords in the “Classification by region” of the Baidu Index interface. For example, if “Taiyuan” is imputed in the Baidu Index and “Jinzhong” is selected in “classification by region,” Jinzhong can focus its attention on Taiyuan.
2.3. Research Methods
2.3.1. Calculation of Element Flow Intensity
- (1)
- Traffic flow:
- (2)
- Migration flow:
- (3)
- Information flow:
- (4)
- Comprehensiveness flow:
2.3.2. Determination of Element Flow Direction
2.3.3. Spatial Structure Index
2.3.4. Social Network Analysis
3. Results
3.1. City Node Hierarchy
3.2. Element Flow Direction Analysis
3.3. Urban Spatial Pattern
3.4. Social Network Analysis
4. Conclusions and Discussion
4.1. Conclusions
- (1)
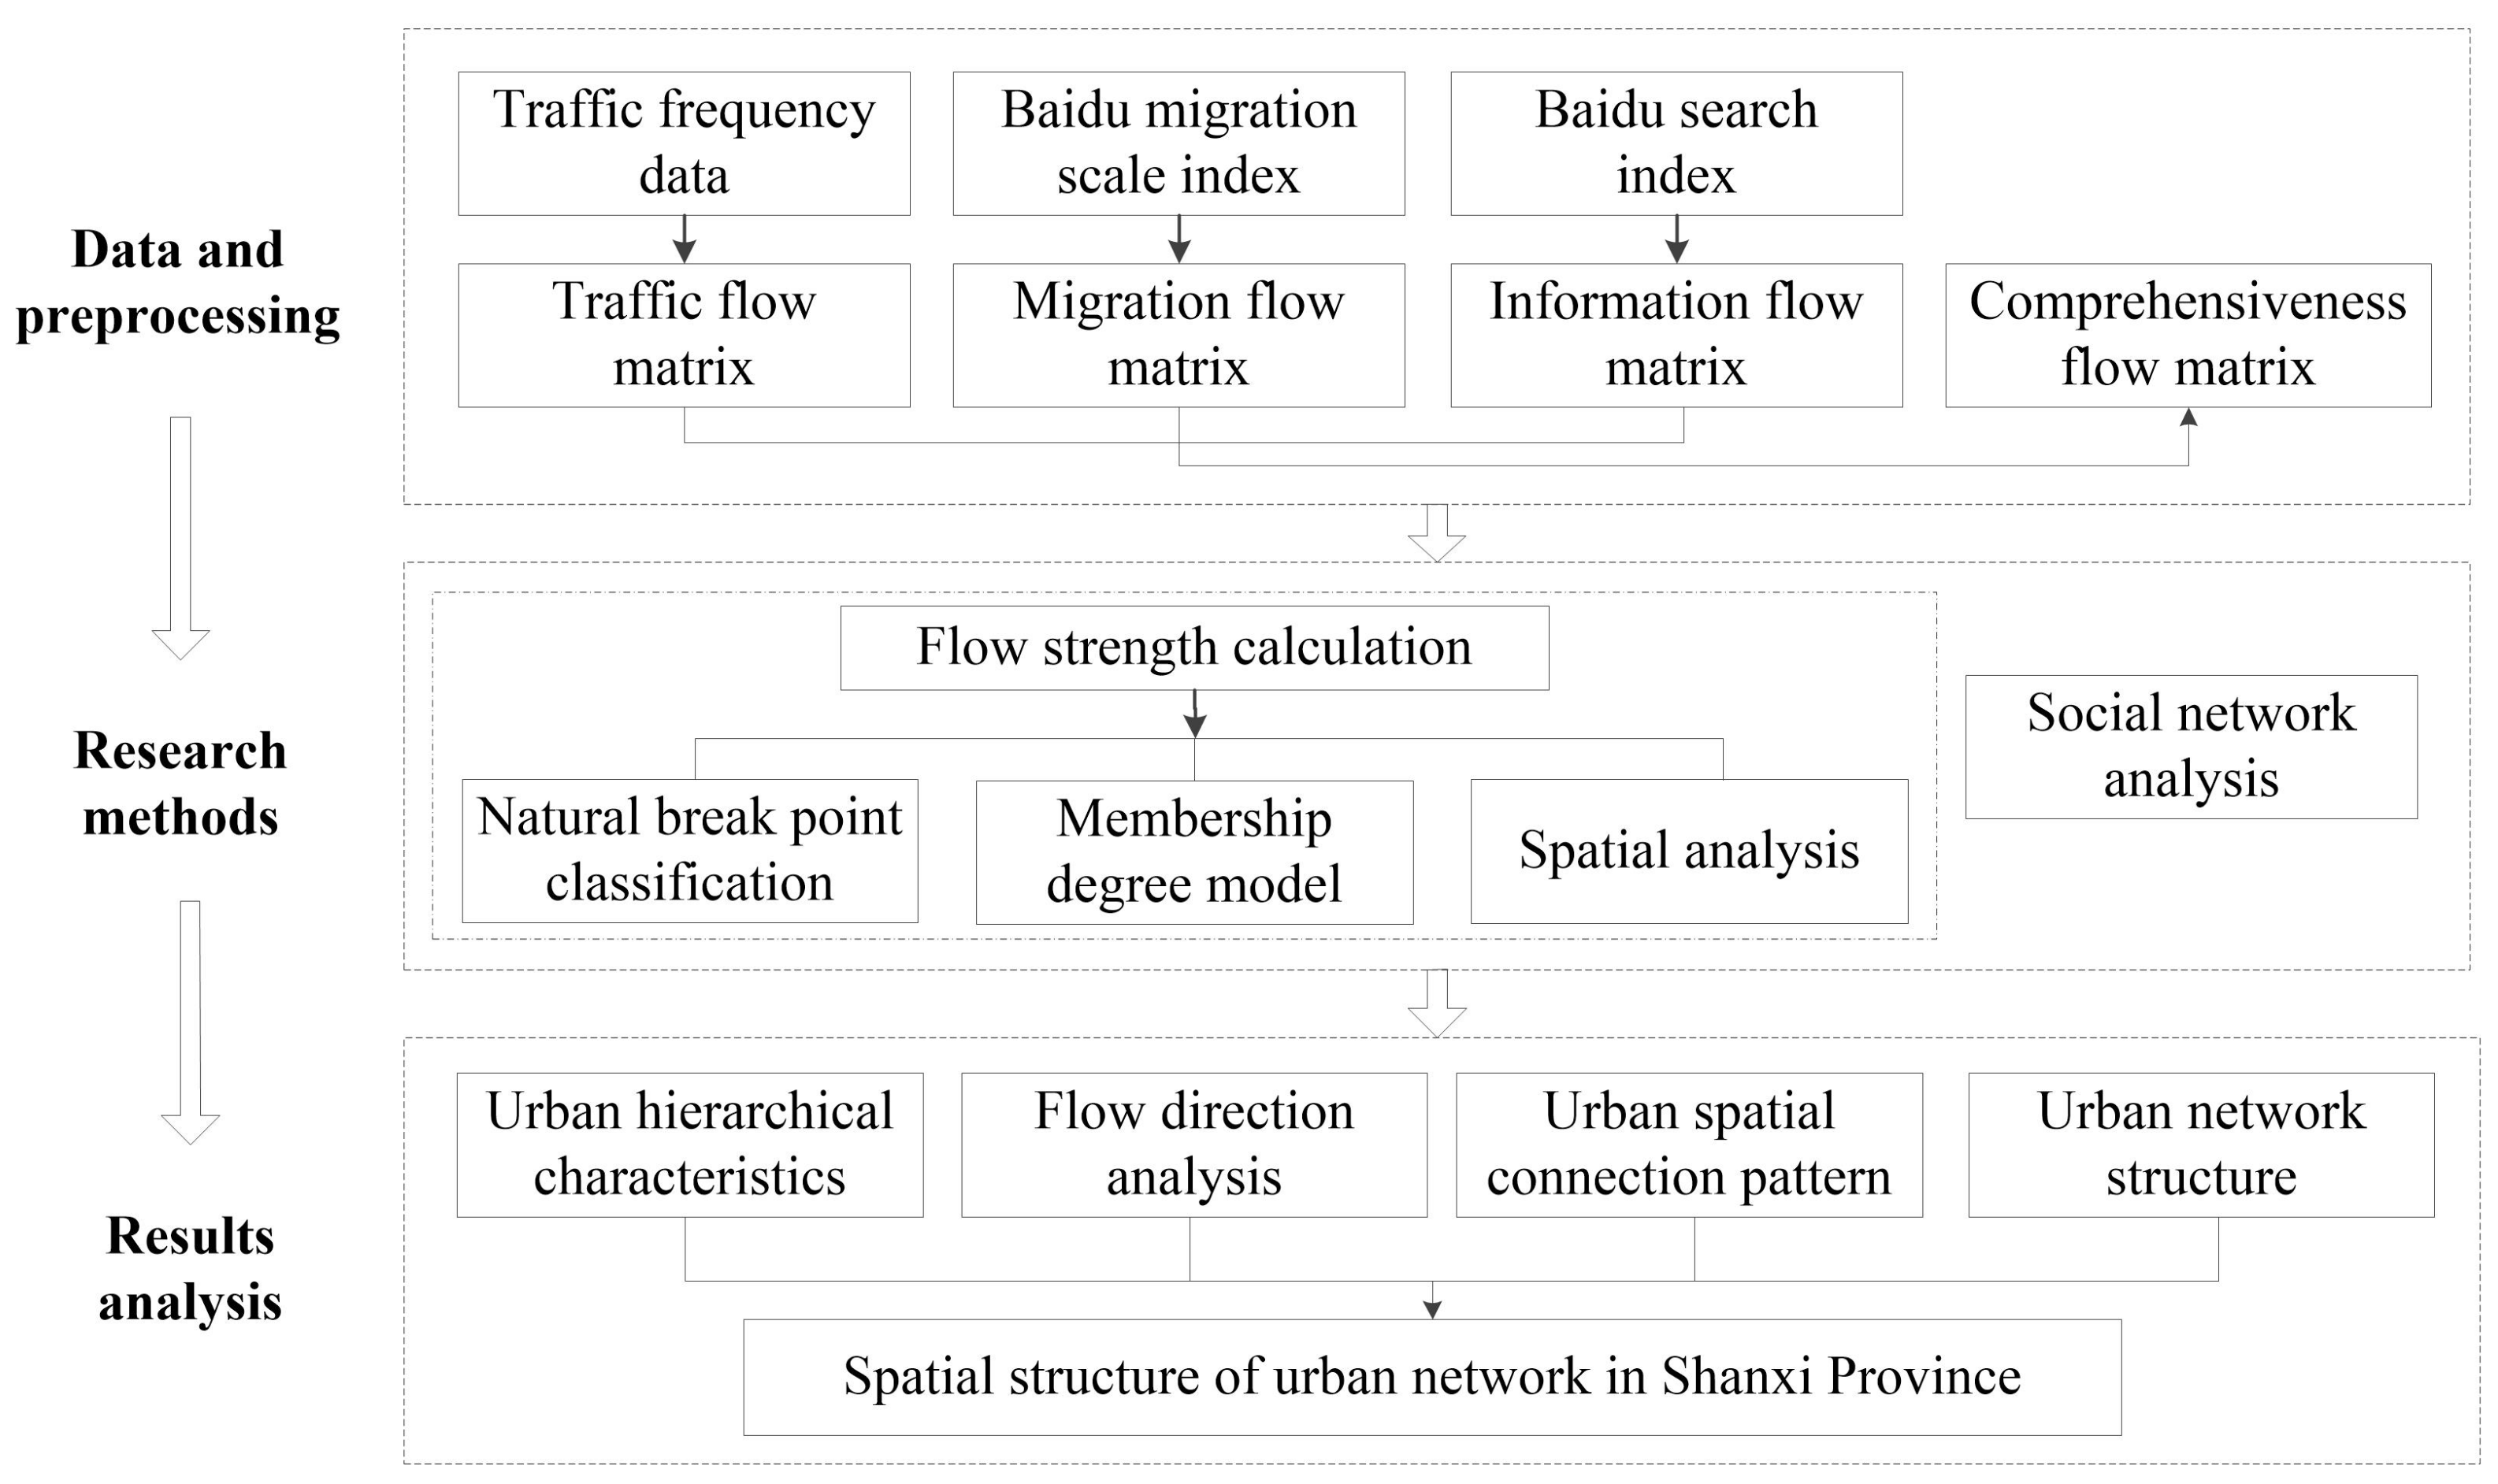
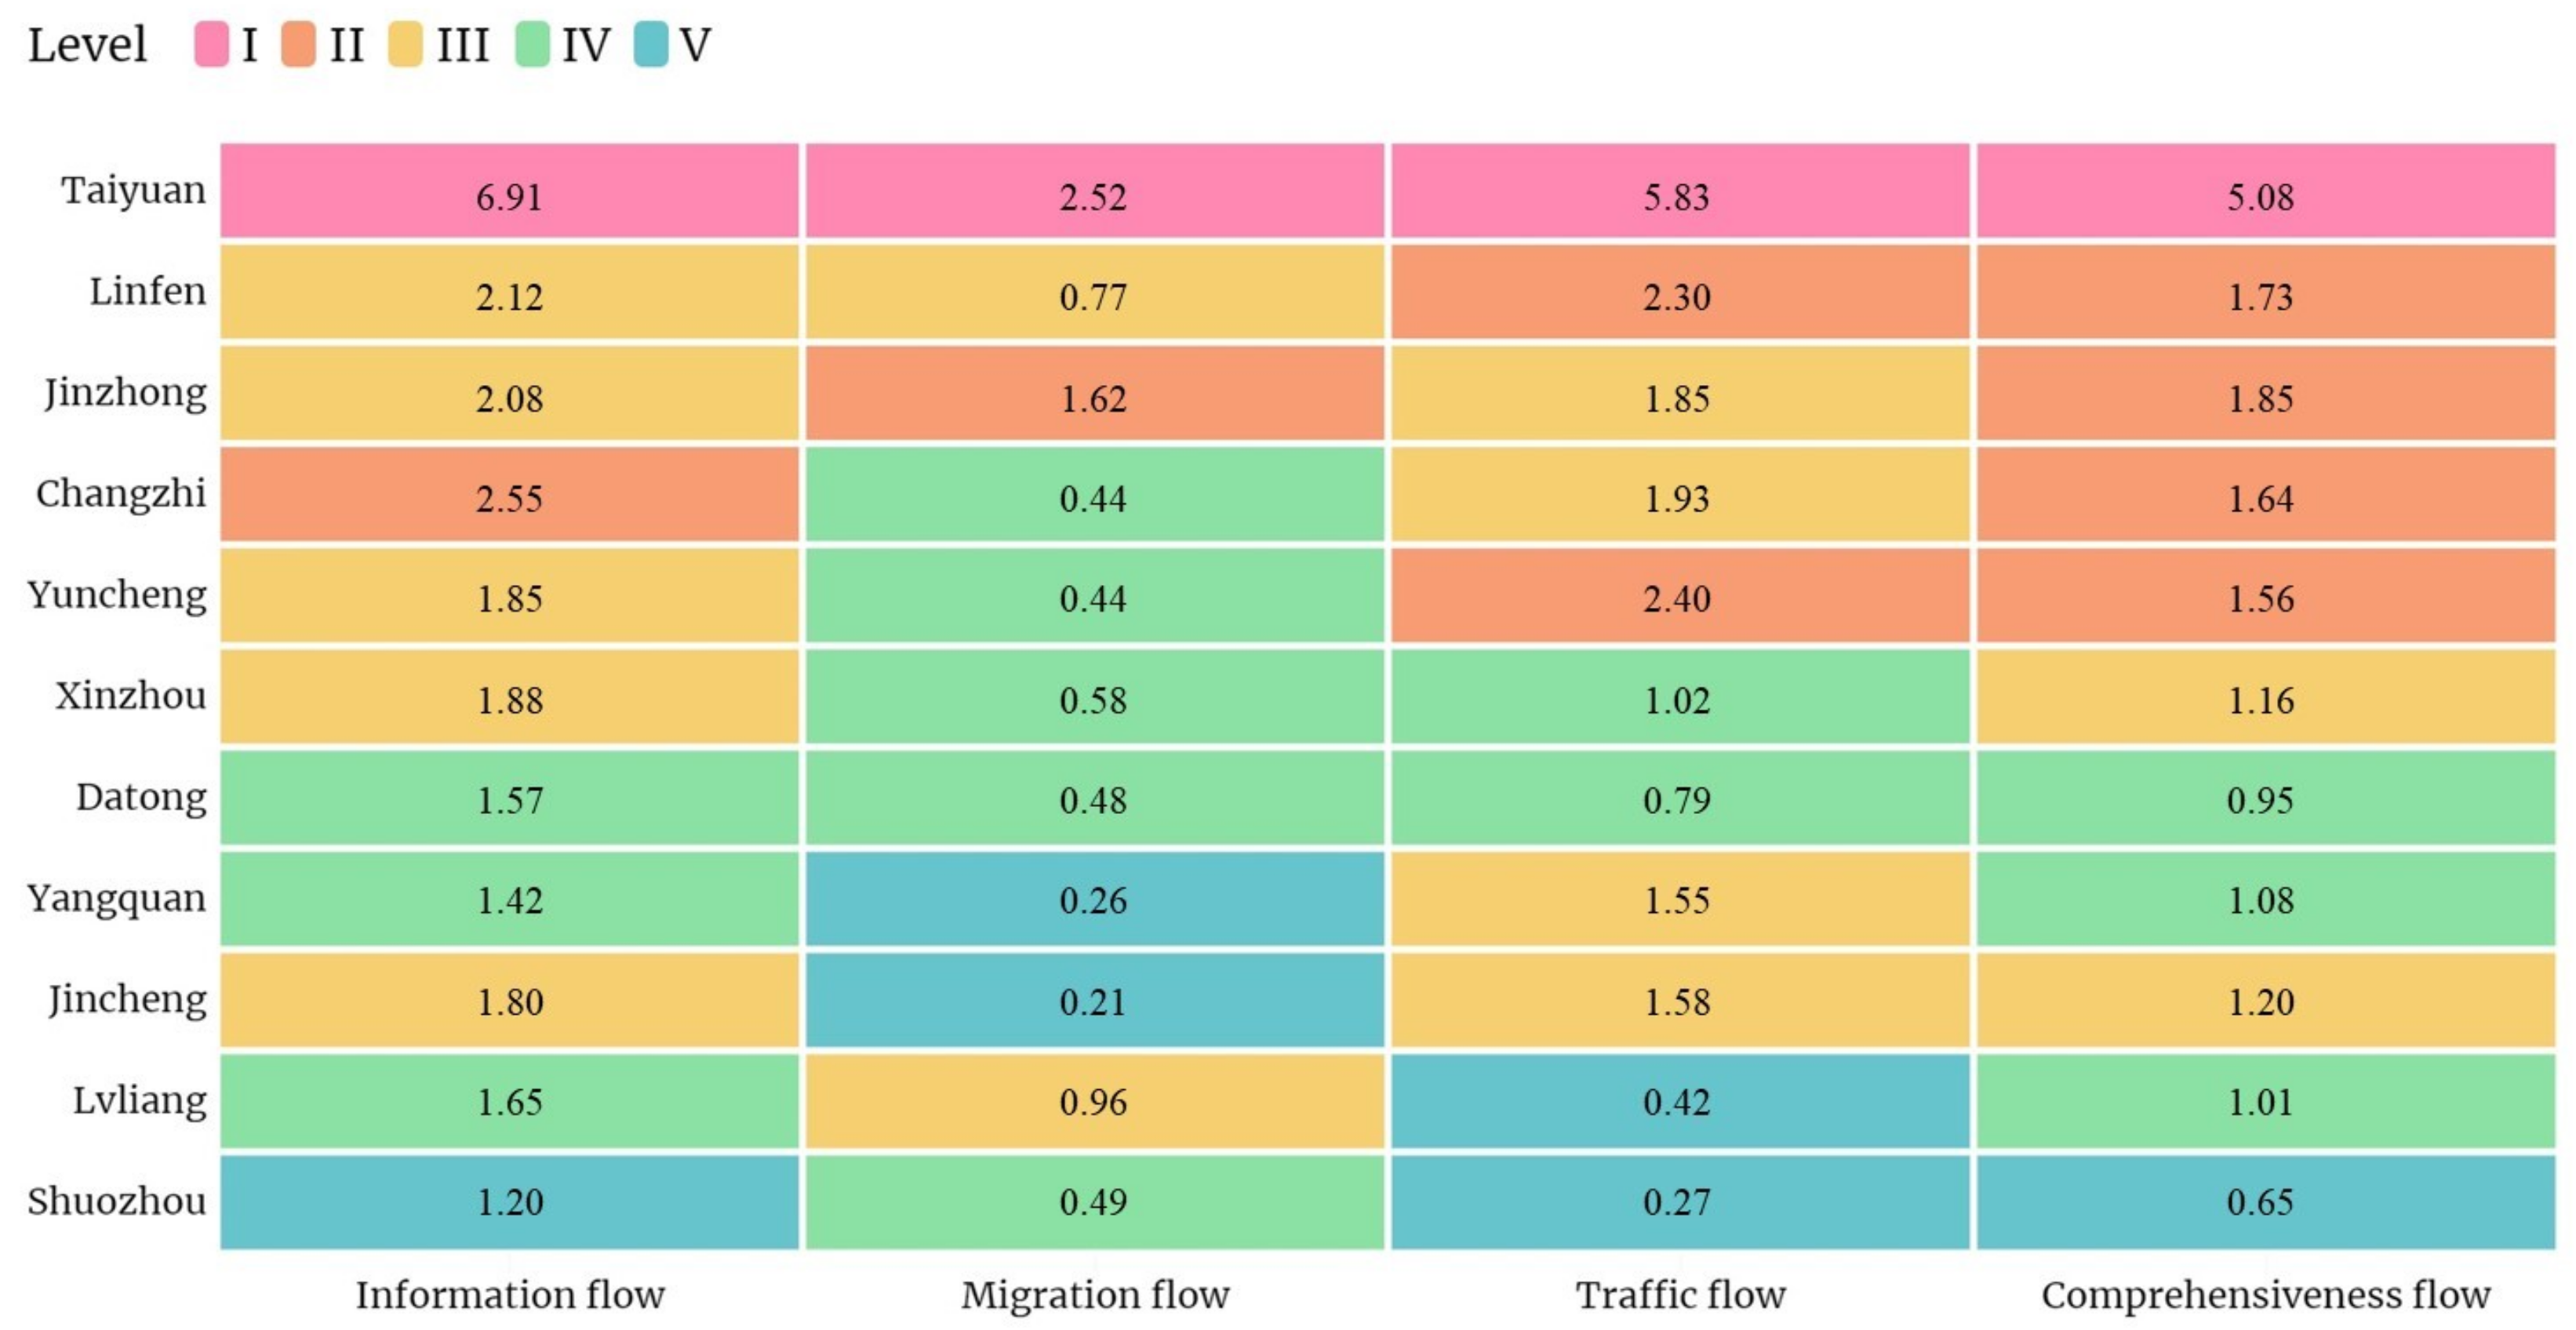
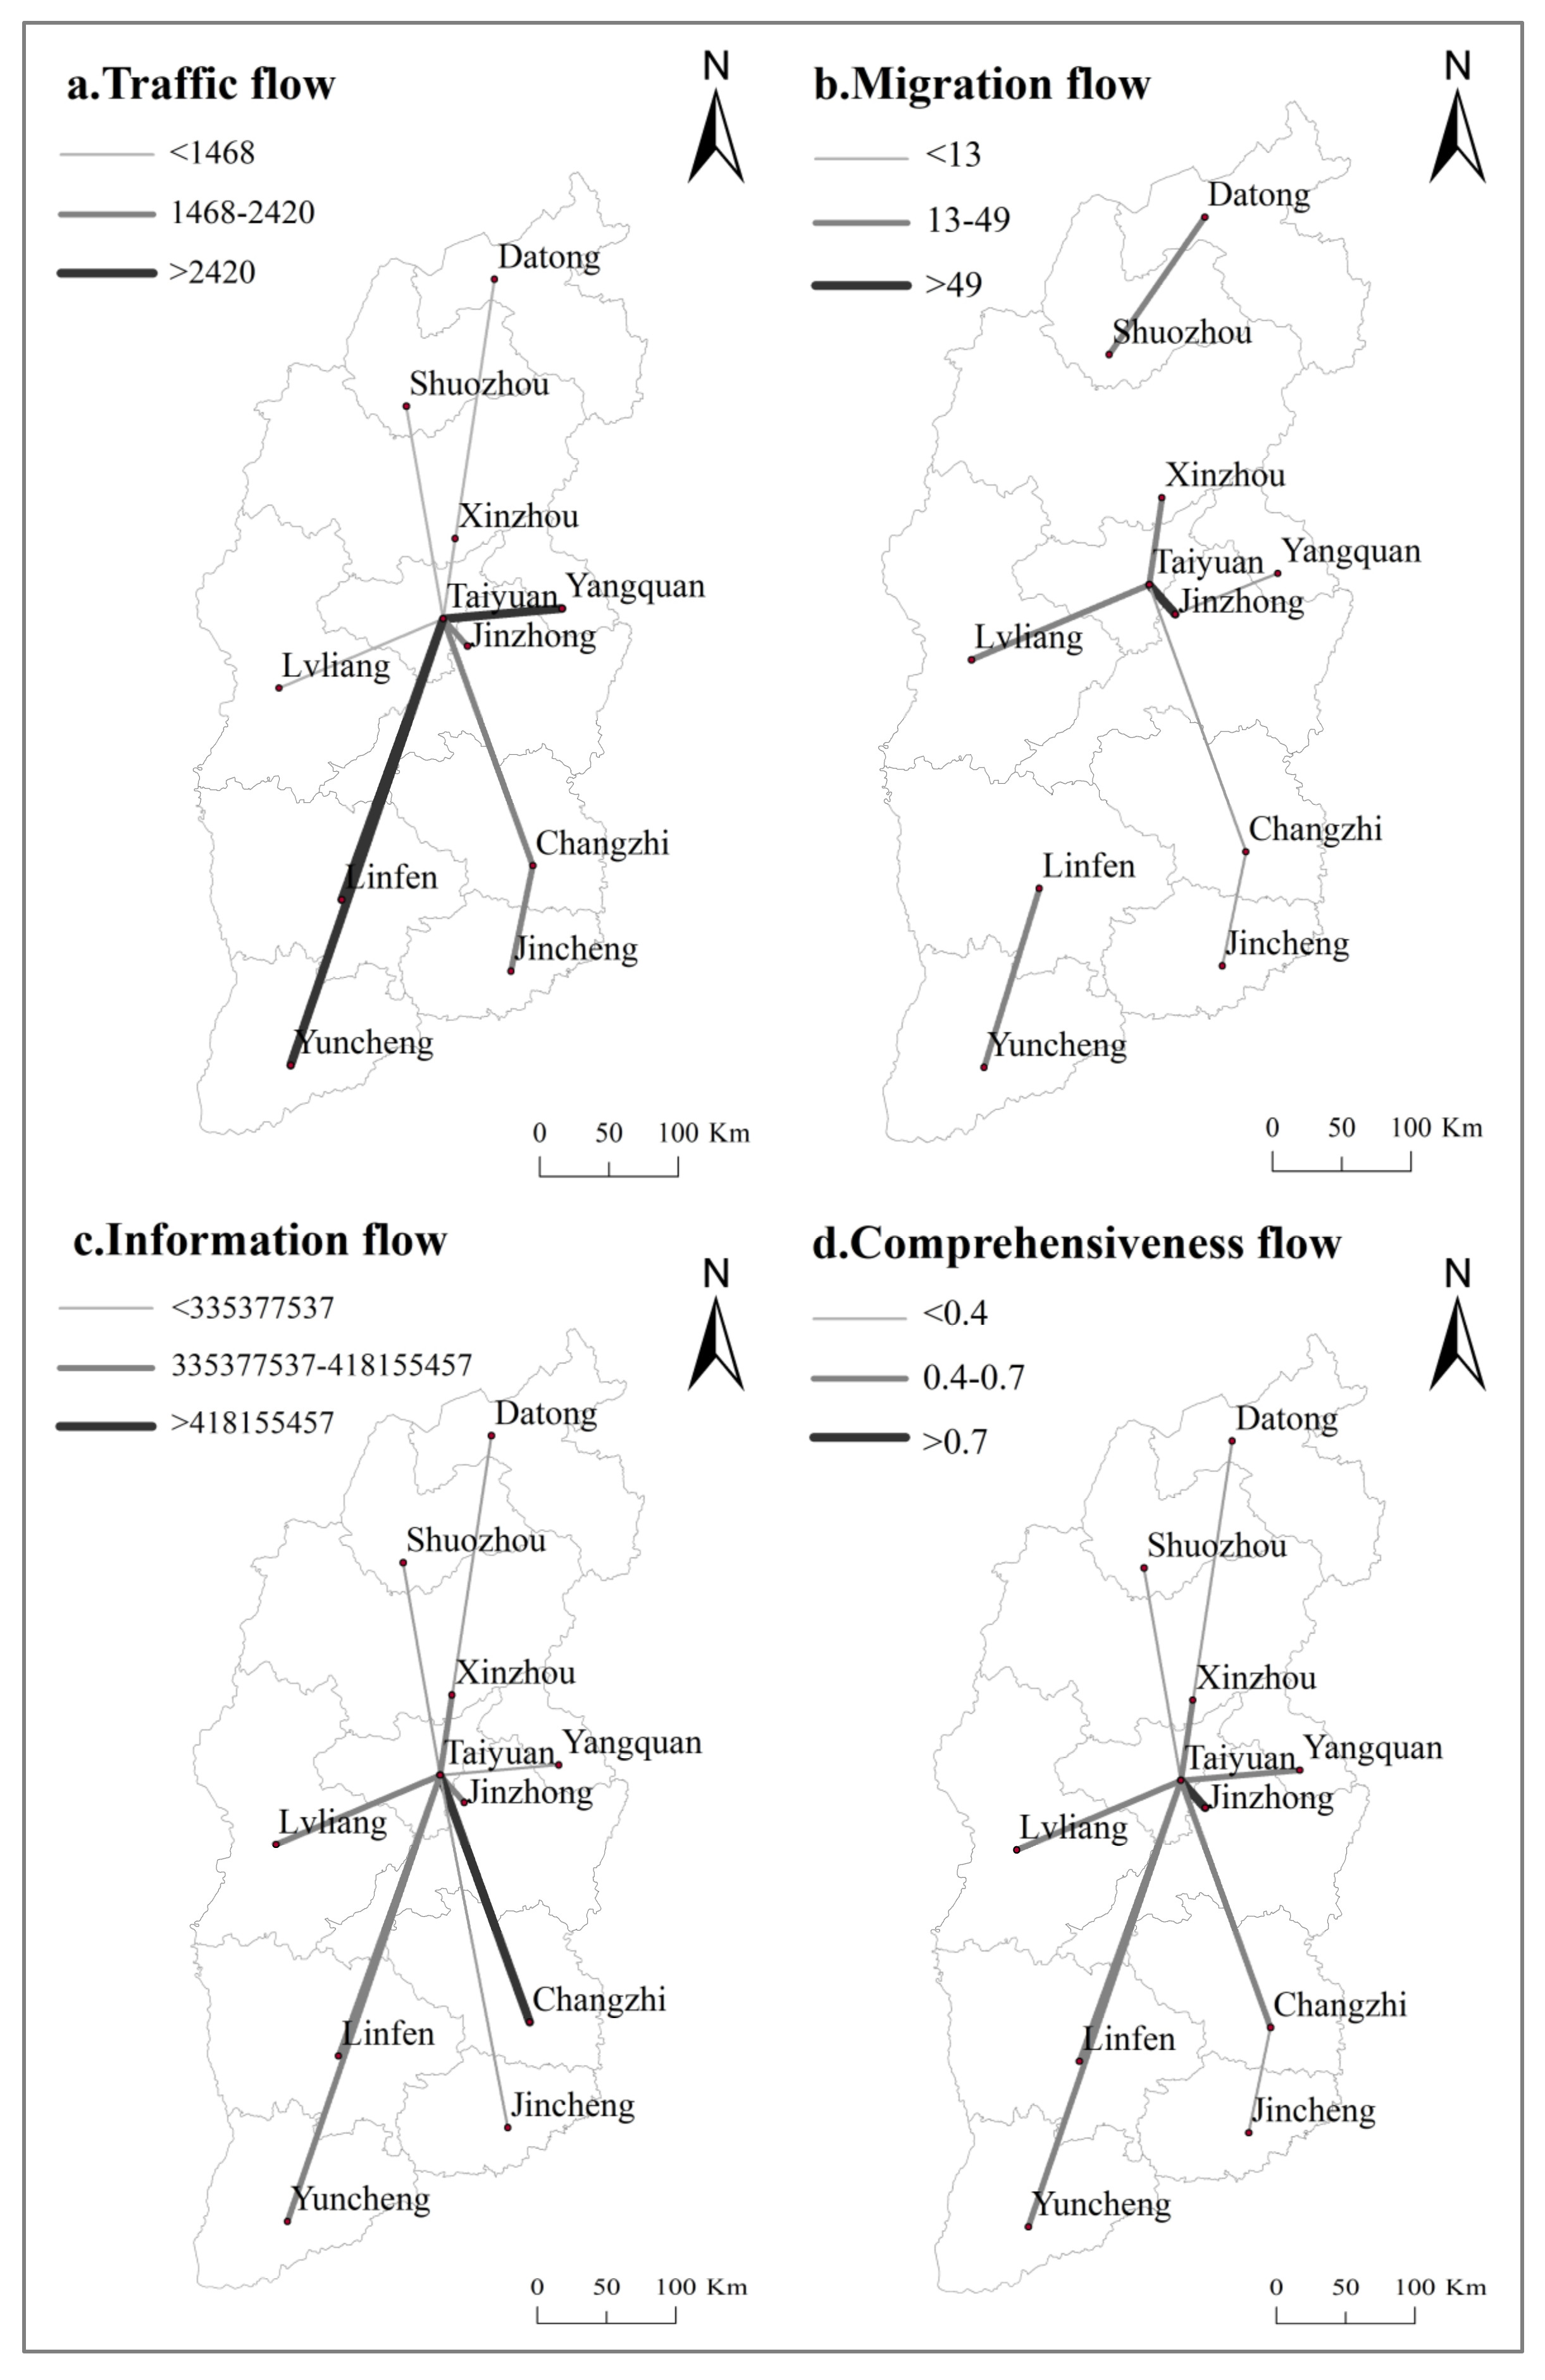
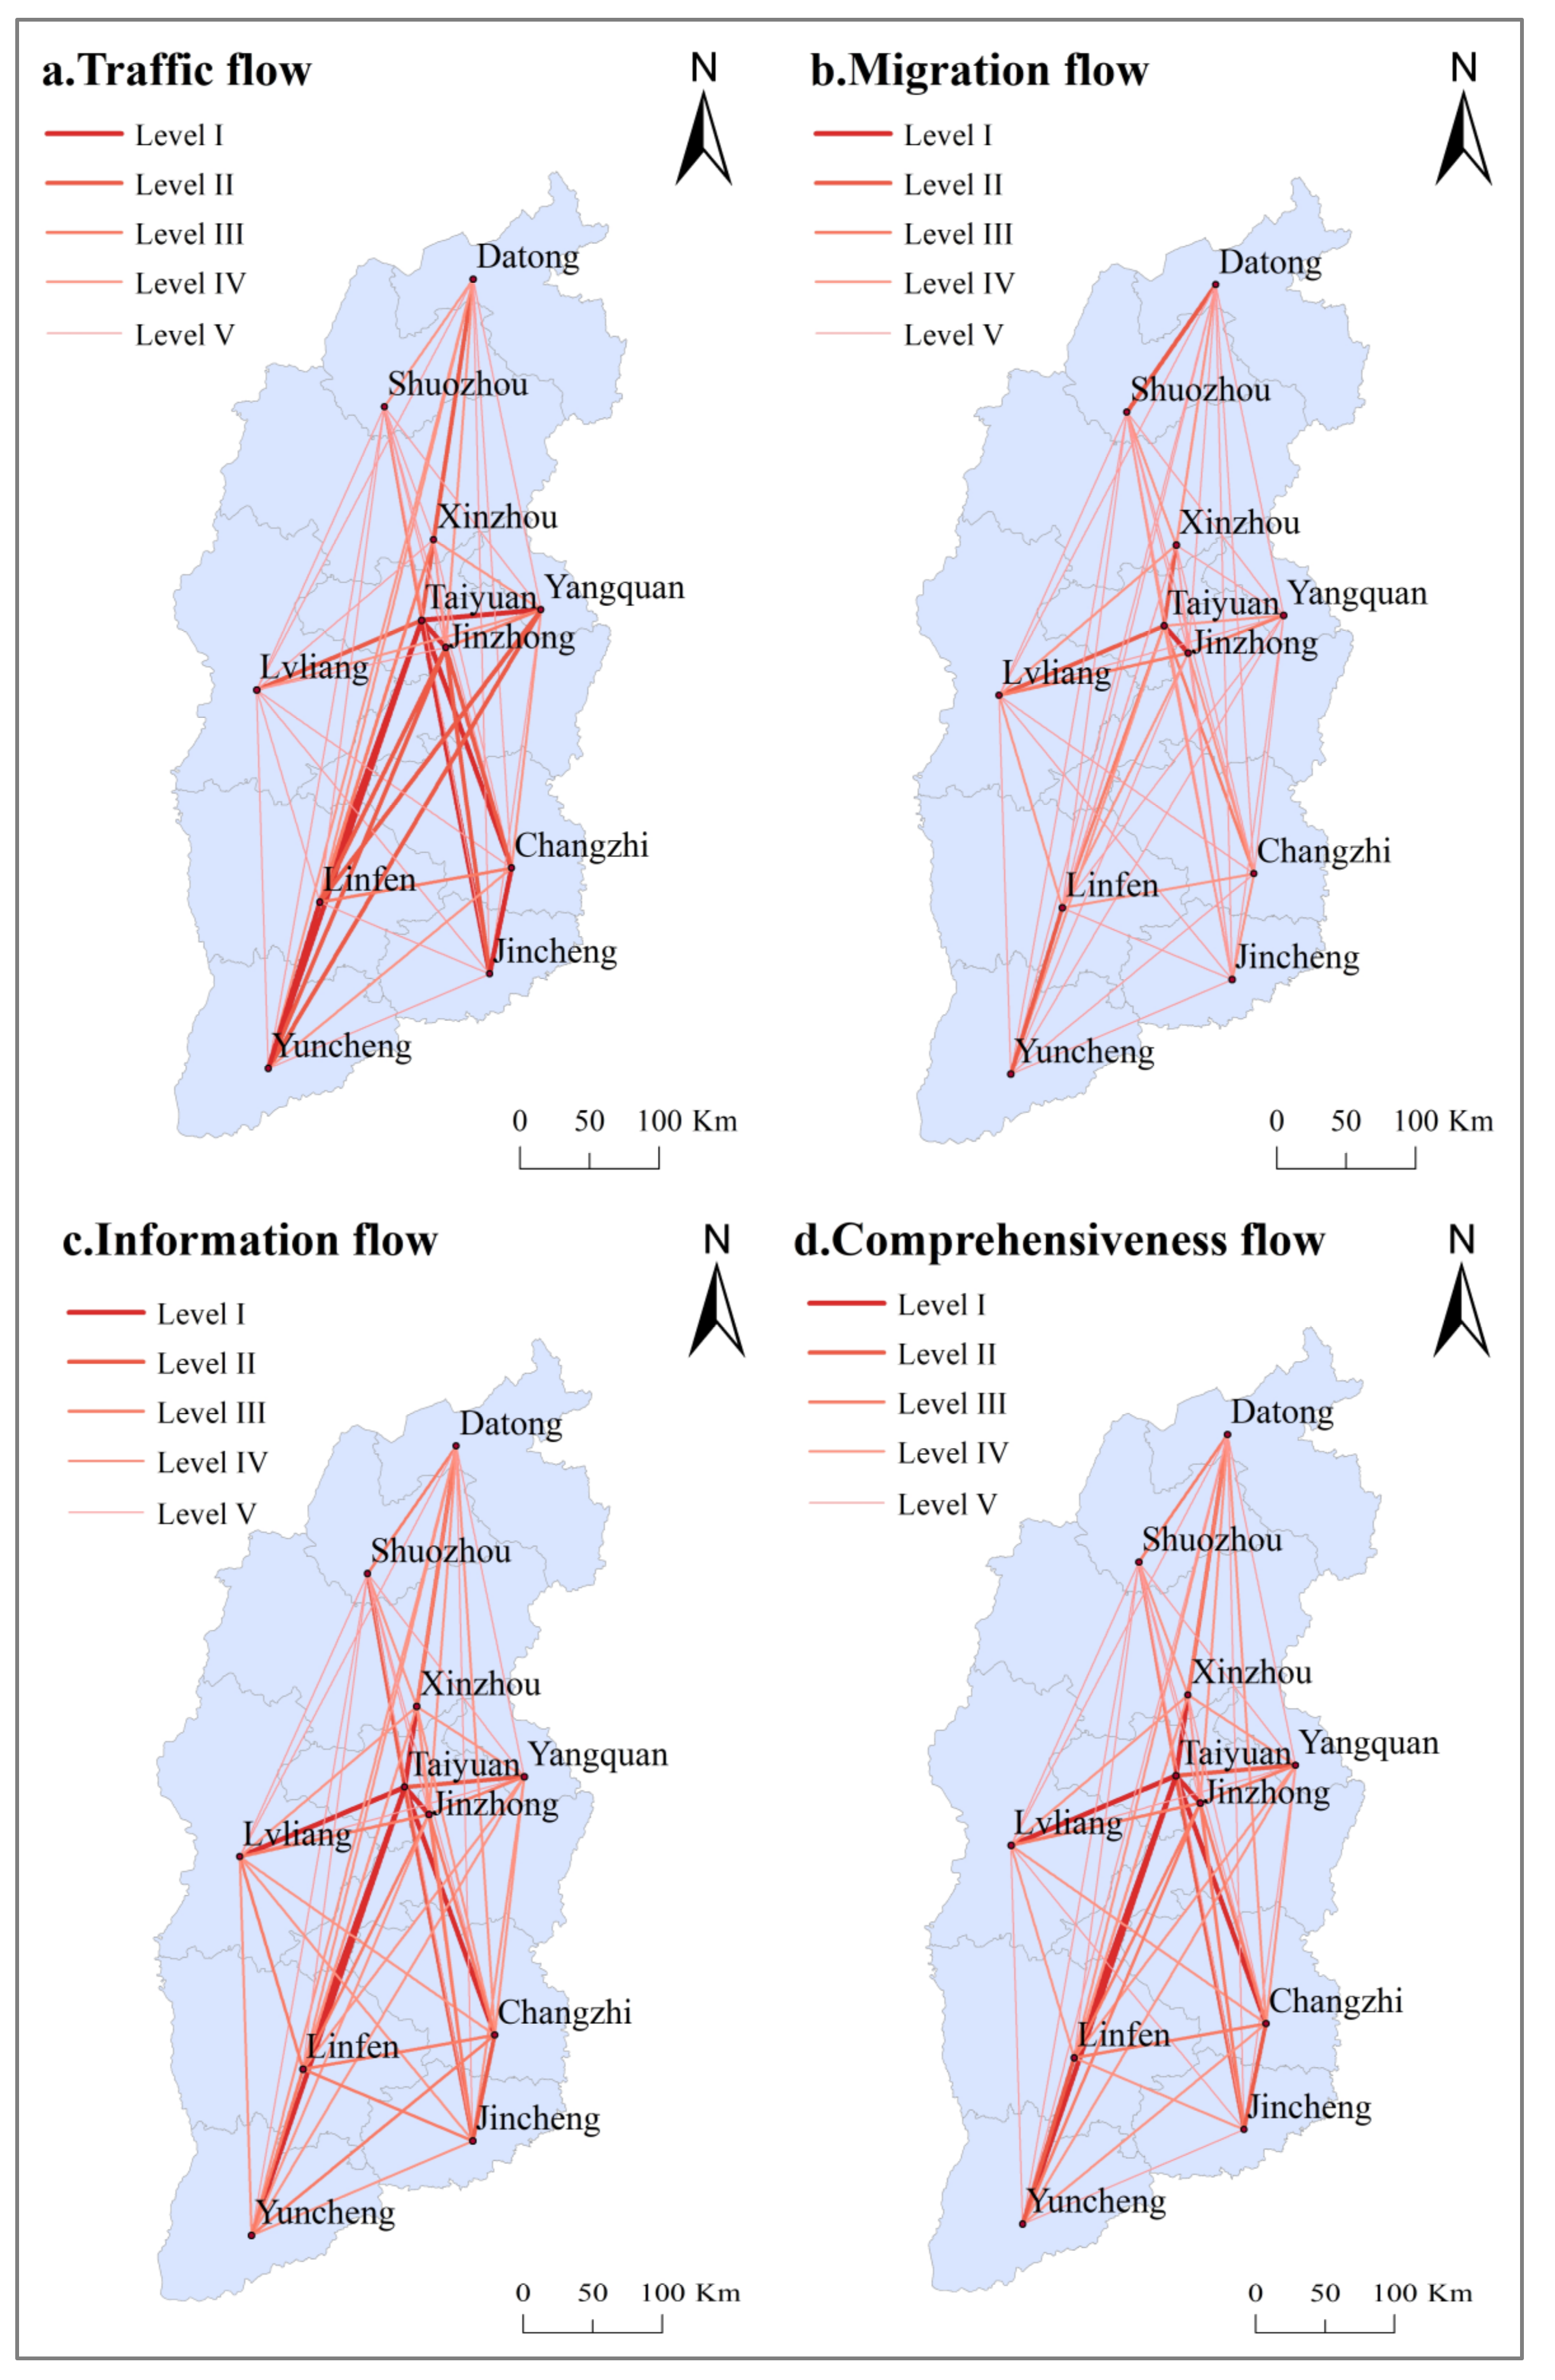
- Shanxi Province presents a development trend of “one core and multiple centers”. Level I traffic, migration, information, and comprehensive networks are all Taiyuan, and levels II, III, IV, and V are significantly different. The main direction of migration flow depends on the directionality of geographical proximity; the main direction of traffic, information and comprehensiveness flow relies on the directionality of the central city. The provincial Taiyuan is the first connecting city of most cities.
- (2)
- Regarding flow space, the urban spatial structure of Shanxi presents an obvious unipolar development trend, and Taiyuan is a comprehensiveness connection hub at the top of the pyramid. The urban network structure presents an “absence-type pyramid structure”, and network maturity is still in the developmental stage. The unbalanced phenomenon of urban network connection strength is prominent; the south is strong and the north is weak, but the strength is lesser and the weakness is greater. Centered on, and radiating from, Taiyuan, the urban network presents a Chinese character “大”—shaped spatial connection pattern.
- (3)
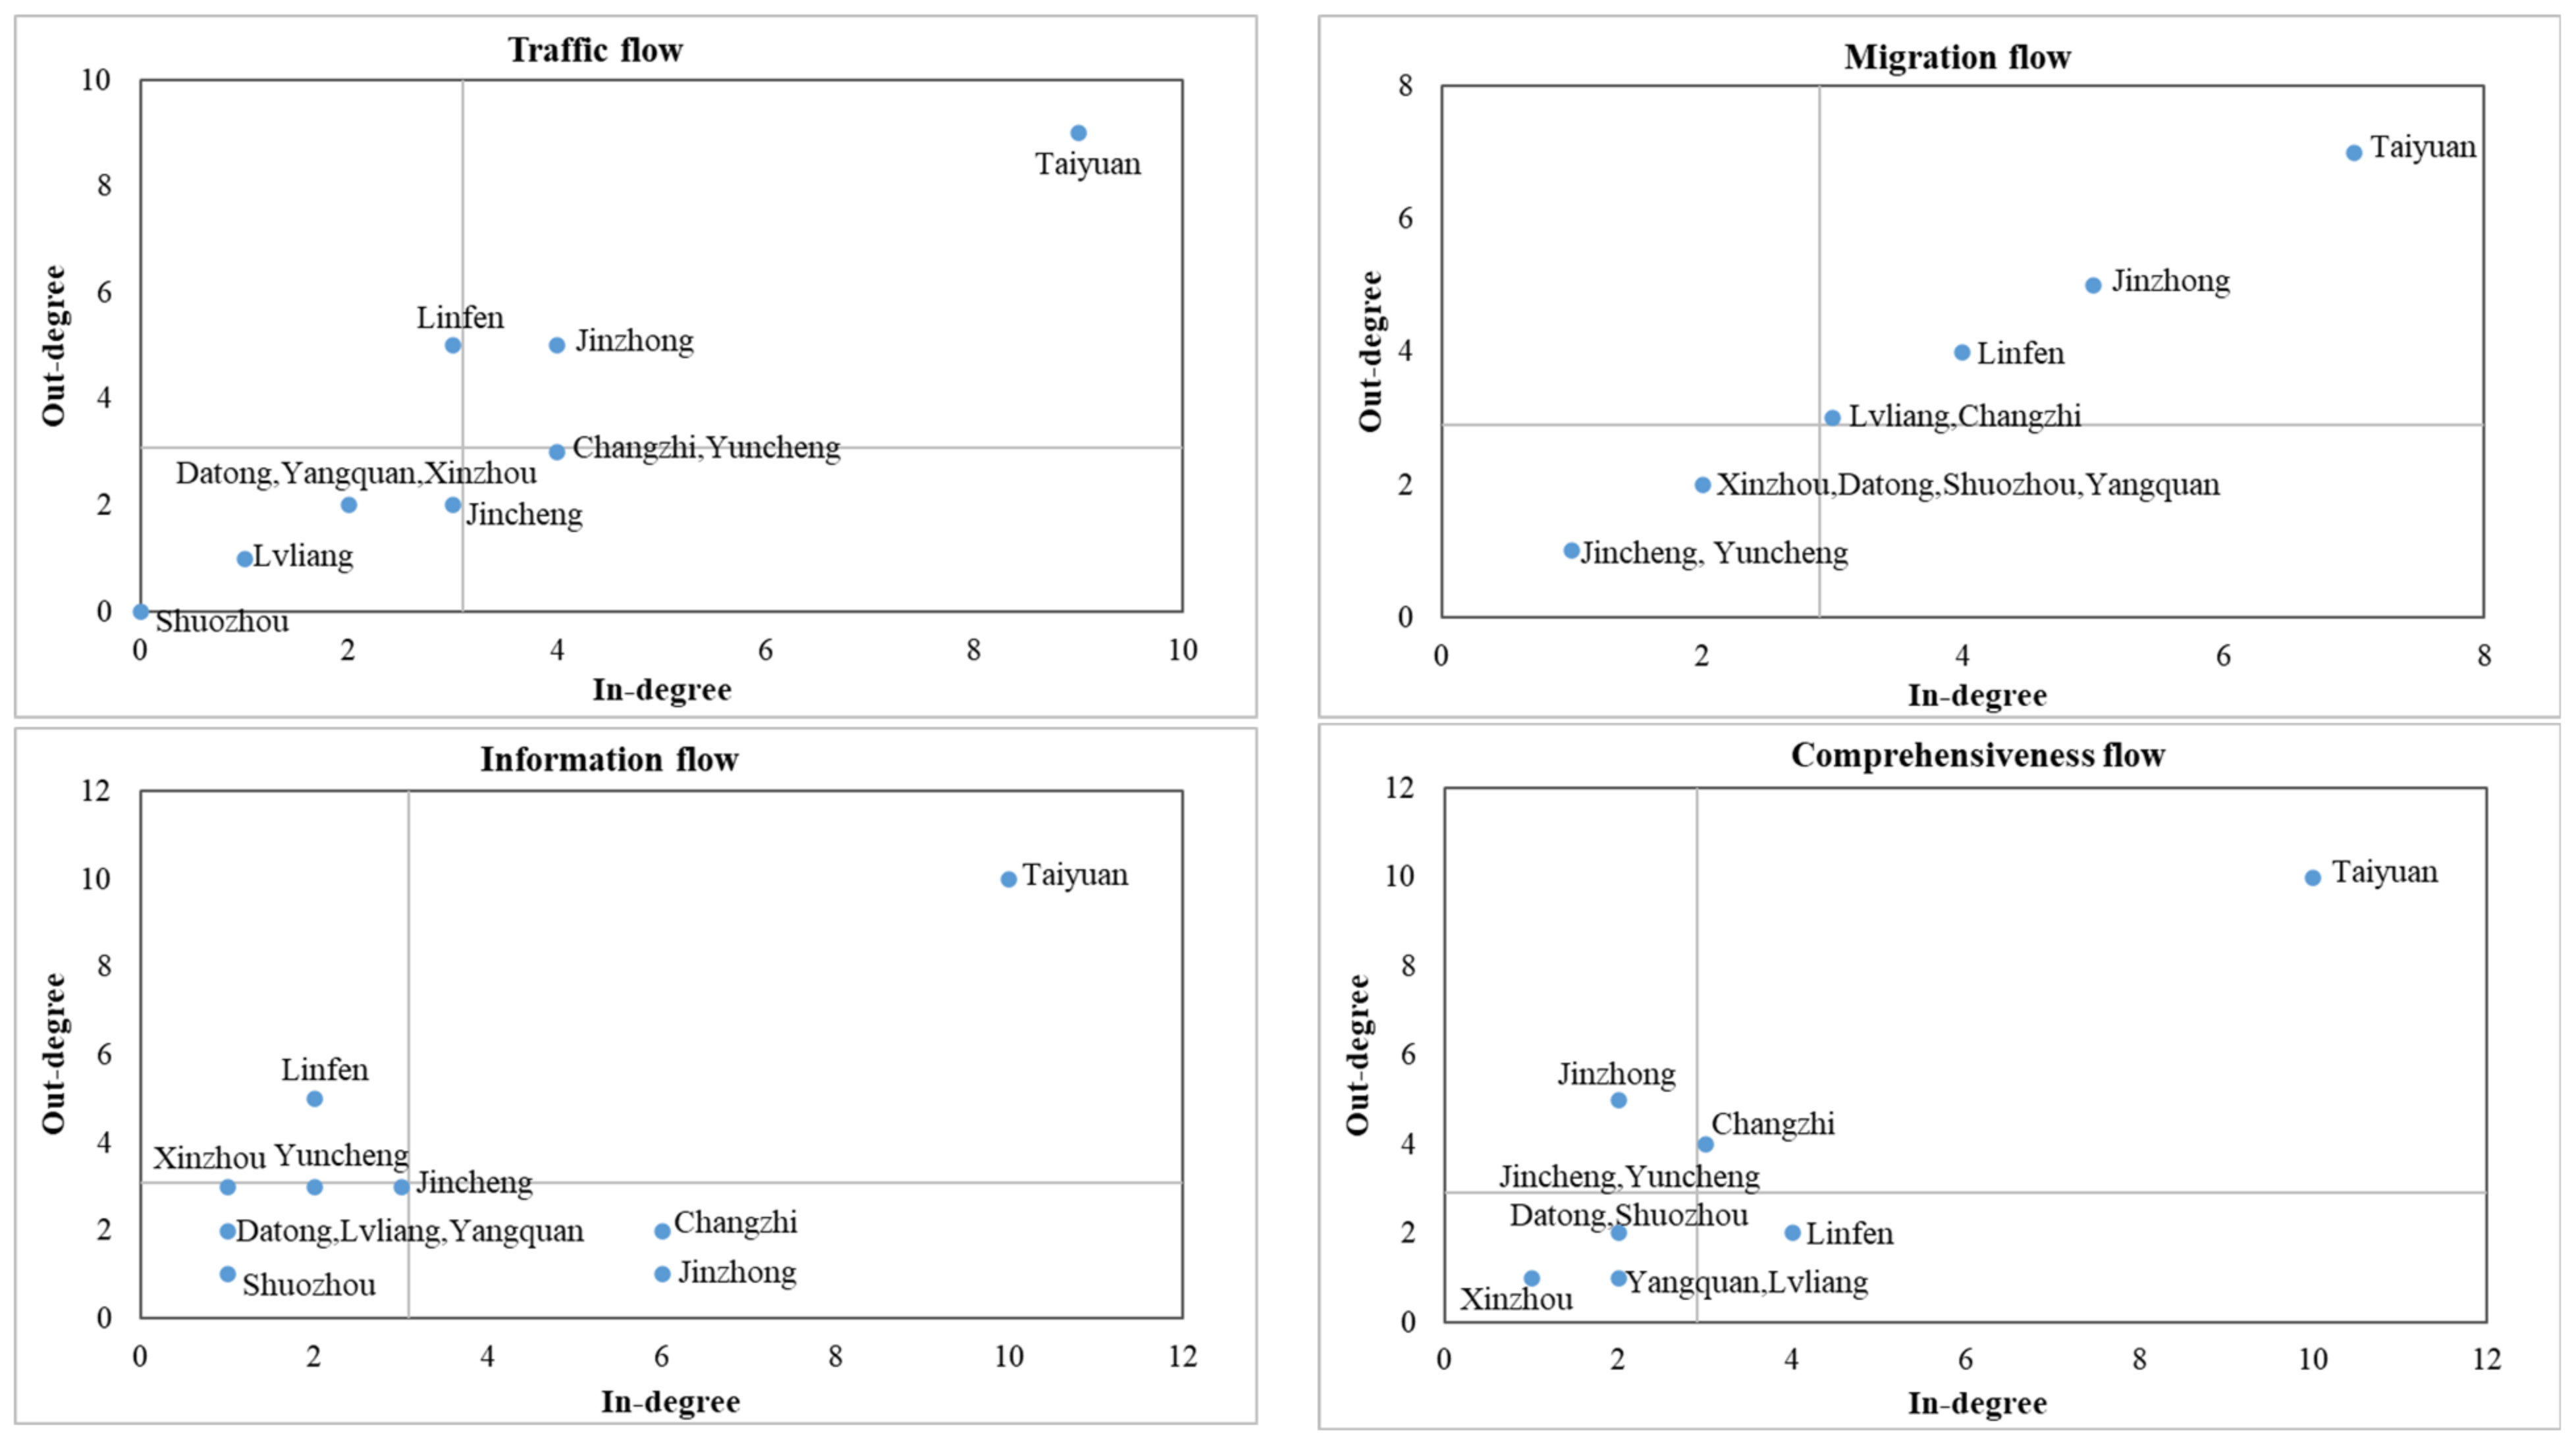
- The network density of each element flow is at a lower level, and network connection is weak. Taiyuan has the largest centrality and the strongest agglomeration and radiating ability, and it is a communication bridge for other cities. Most cities in Shanxi have a low centrality, weak radiation and attractiveness, and their connection strength with other cities is also weak. From the perspective of structural holes, Taiyuan is the least restrictive and is weakly dependent on other cities; Taiyuan’s effective scale has always ranked first and is at the core. The remaining cities have large restrictions and small effective scales, so the phenomenon of urban network polarization in Shanxi is serious.
4.2. Discussion
- (1)
- Based on the above study, it was found that Shuozhou, Yangquan, Datong, and Luliang have weak information flow connections, especially Yangquan and Lvliang; as important cities in the central Shanxi city cluster, they are not closely connected with other cities in Shanxi province. Information technology is a current trend, and communication and cooperation between cities will be the focus of future social development [20]. Therefore, while increasing attention on the central Shanxi city cluster, we must vigorously promote communication and cooperation between neighboring cities in Shanxi Province and the cities in the core region and effectively promote the interaction of information and resource sharing between cities. Yangquan and Jincheng have the weakest migration connections, and their small population bases lead to limited development. In the future, they should attract outsiders and reduce population loss by developing advantageous industries and enhancing the positive impact of population density on urban development. Lvliang, Shuozhou, Xinzhou, and Datong are weakly connected to other cities in terms of traffic flow due to the blockage of the Taihang and Lvliang Mountains, resulting in low accessibility [25]. In the future, the transportation connectivity between cities in the region should be improved by strengthening the construction of transportation infrastructure, improving urban connectivity, and improving transportation modes, such as railroads, highways, and civil aviation [31]. In general, for cities that are currently ranked low in terms of the intensity of all elements of the flow, strengthening the close connections between them and cities in the core area, improving the level of transportation connectivity, and gradually narrowing the gap with cities in the core area. Taiyuan and other cities in the core area still have more room for development, and should keep developing city agglomerations by establishing a reasonable urban spatial pattern, relying on the central cities, and realizing inter-city linkage development so that they can radiate the surrounding cities more widely and strongly.
- (2)
- This study explores the spatial patterns of information, population, traffic, and comprehensiveness connection networks among provincial cities using multi-dimensional element flow data with 11 prefecture-level cities in Shanxi Province as research objects. Previous studies have mostly explored the spatial structure of 19 urban agglomerations in China, including the central Shanxi urban agglomeration [32,33] and the Yellow River Basin urban agglomeration [34,35], without focusing on the urban spatial structure of Shanxi Province from the perspective of multi-dimensional element flow. This closely relates to that of Cao [25] on the coordinated development of urban agglomerations in central Shanxi. Both conclude that Taiyuan is developing rapidly and differs greatly from the development of other cities in Shanxi Province. There are three main differences: one is the overlapping study area between the two. Cao concluded that Taiyuan has the strongest economic connection with Jinzhong, followed by Xinzhou and Lvliang in the central Shanxi urban agglomeration; Jinzhong and Yangquan are also stronger. In addition to its similar conclusion, this study finds that the traffic flow connection yields a stronger connection between Taiyuan and Yangquan, indicating that although the economic connection between Taiyuan and Yangquan is weak, its traffic connection can lead to gradual economic improvement. The migration and information flow connections conclude that Jinzhong is strongly connected to Lvliang, indicating that future economic development between the two cities can be promoted through population flow and information exchange. The comprehensive flow also shows that Taiyuan and Yangquan, Jinzhong, and Lvliang are strongly connected, which confirms that the multi-dimensional element flow can be used for a comprehensive study and perspective of the urban network structure. Second, this study uses the dynamic spatial data of information, population, and traffic flow between two cities in Shanxi Province to explore the spatial pattern of urban networks and uses the “flow” data as the basis to reflect the interconnection between cities; therefore, the study of regional spatial structure changes from the morphology and hierarchy of cities to the structure, function, and connection of urban networks [5]. In contrast, Cao’s article uses the population, industry, and economic statistics of five cities in the Central Urban Agglomeration to calculate the strength of inter-city connections through a gravity model, which only characterizes the connections between the two, but is objectively different from the actual “flow” data. Third, the study area includes the central Shanxi urban agglomeration and explores the spatial network connections among cities in Shanxi Province as a whole. The research results are richer, and the spatial structure among provincial cities was explored from four aspects: hierarchical distribution, factor flow direction, spatial pattern, and network structure. Overall, it seems that this study has a rich variety of data, the study area is typical, and the region contains the central Shanxi urban agglomeration and the surrounding cities, which have important theoretical and practical value for the development of Shanxi provincial cities to fully realize the strategy of taking the lead in central China.
- (3)
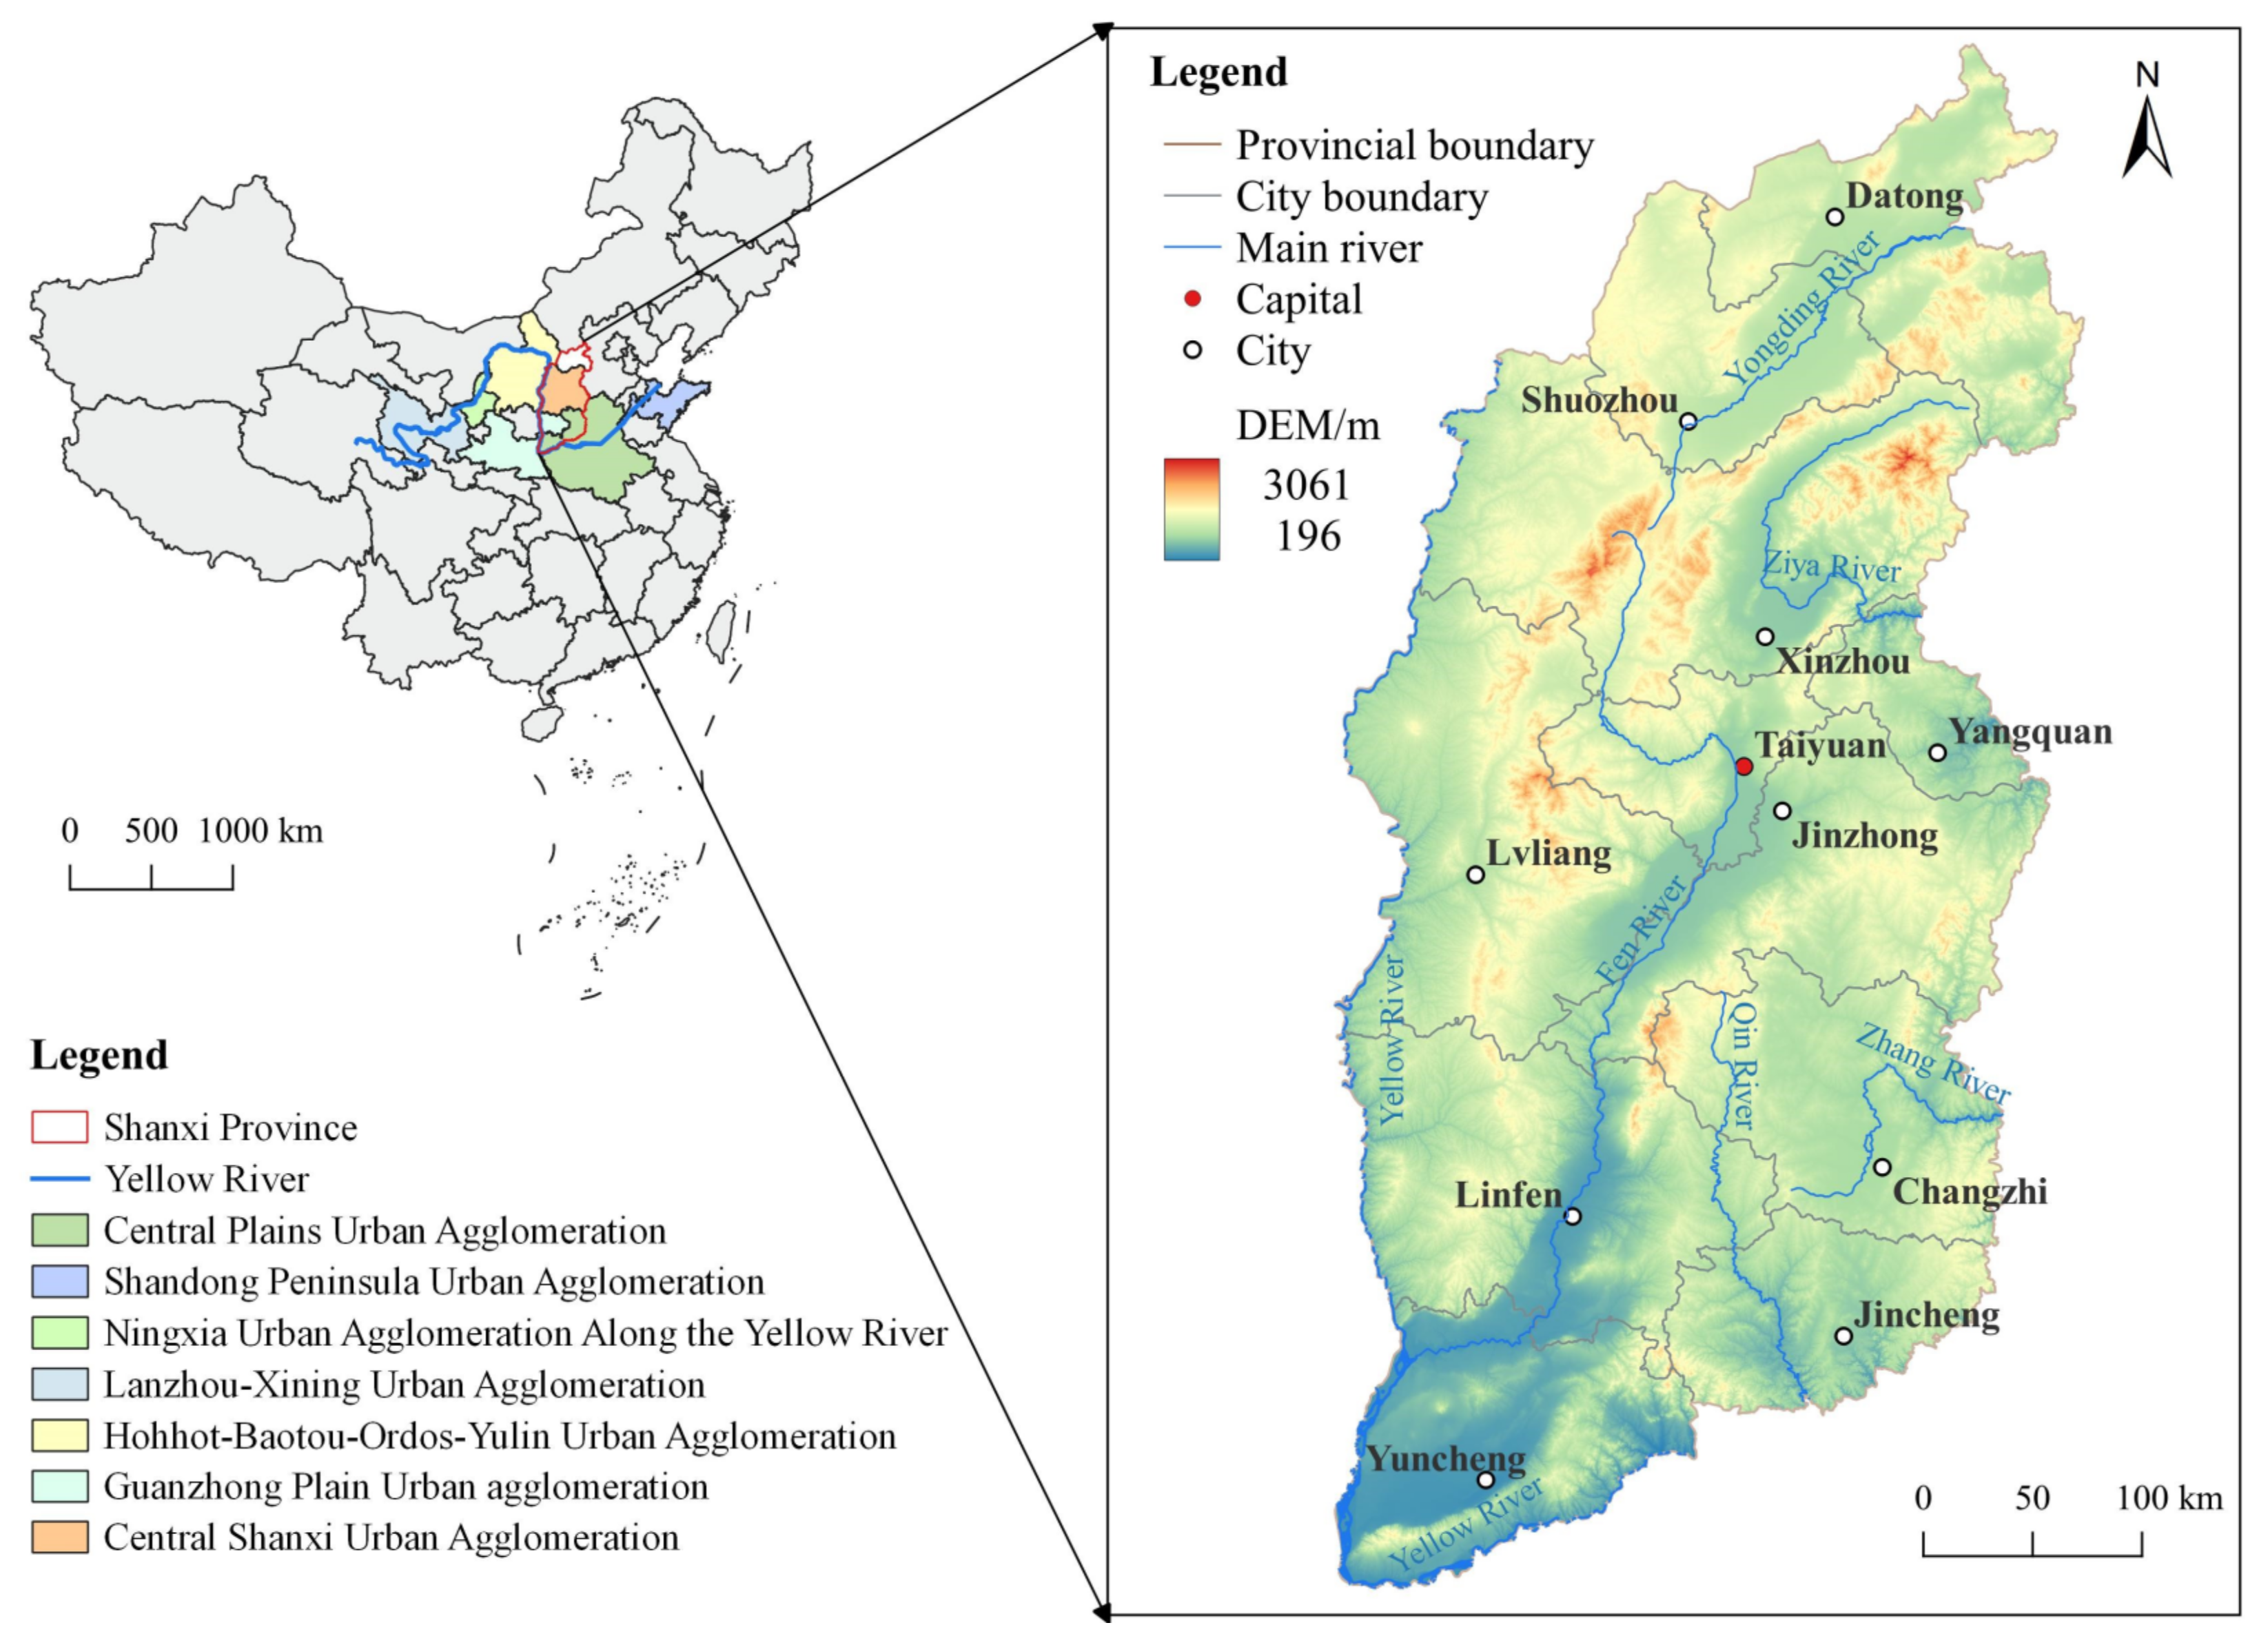
- In October 2021, the “Outline of the Plan for Ecological Protection and High-Quality Development of the Yellow River Basin” by the State Council of the CPC Central Committee elevated the ecological protection and high-quality development of the Yellow River Basin as a major national strategy, highlighting the strategic position of the Yellow River Basin in the overall development of the country and overall socialist modernization. The Fourteenth Five-Year Plan of National Economic and Social Development and the Outline of Vision 2035 have clarified that the seven major urban agglomerations in the Yellow River Basin cover the majority of the basin and can play a radiating role in ecological protection and economic development. The 20th National Congress of the Communist Party of China emphasized the construction of a coordinated development pattern of large, medium, and small cities based on urban agglomerations and metropolitan areas, promoting the accelerated rise of the central region and advancing the high-quality development of the Yellow River Basin. Shanxi Province is a central province in the interior of China, located on the Loess Plateau on the east bank of the middle reaches of the Yellow River and west of the North China Plain [36], and this case study area enriches the current research on the urban network structure and urbanization in the Yellow River Basin, which is a major national strategy for ecological protection and high-quality development of the Yellow River Basin. According to China’s new urbanization strategy, the rapidly developing provincial capital city of Taiyuan should take the lead in coordinating the steady development of the central Shanxi urban agglomeration and driving neighboring cities to develop together. This study found that Taiyuan is ranked first in all element flows and is moving toward high-quality development. However, the central Shanxi urban agglomeration, as one of the six new regional urban agglomerations that China is guiding to cultivate [37], fails to form a strong network connection through Taiyuan’s central leading role, indicating that Taiyuan’s level of synergy with the central Shanxi urban agglomeration and driving the development of neighboring cities is not high. Therefore, to solve the problem of unipolarity, it is necessary not only to strengthen the core function of Taiyuan, but also to promote the construction of provincial sub-center cities (Datong, Changzhi, Linfen) and urban agglomeration in central Shanxi, strengthen urban networks, gather development momentum, and accelerate the formation of an intensive and efficient, open, and synergistic urbanization development pattern. In the future, Taiyuan should focus on synergistically driving the development of neighboring regions and strengthening cross-regional connections. Simultaneously, it should promote the common construction and sharing of key industries and open platforms, accelerate the construction of national regional center cities, continuously enhance the agglomeration and diffusion effect of Taiyuan, and promote the balanced, connected, and overall development of cities in Shanxi Province.
Author Contributions
Funding
Institutional Review Board Statement
Informed Consent Statement
Data Availability Statement
Conflicts of Interest
References
- Qiu, J.; Liu, Y.; Chen, H.; Gao, F. Urban network structure of Guangdong-Hong Kong-Macao greater bay area with the view of space of flows: A comparison between information flow and transportation flow. Econ. Geogr. 2019, 39, 7–15. [Google Scholar]
- Castells, M. The Informational City: Information Technology, Economic Restructuring and the Urban-Regional Progress; Blackwell: Hoboken, NJ, USA, 1989; Volume 1, pp. 76–77. [Google Scholar] [CrossRef]
- Castells, M. The Rise of Network Society; Blackwell: Oxford, UK, 1996. [Google Scholar]
- Xia, J.; Sun, G. A model of urban economic resilience development with multisource data fusion. Math. Probl. Eng. 2022, 2022, 6490194. [Google Scholar] [CrossRef]
- Batten, D.F. Network cities: Creative urban agglomerations for the 21st century. Urban. Stud. 1995, 32, 313–327. [Google Scholar] [CrossRef]
- Yang, L.; Wang, J.; Yang, Y. Spatial evolution and growth mechanism of urban networks in western China: A multi-scale perspective. J. Geogr. Sci. 2022, 32, 517–536. [Google Scholar] [CrossRef]
- Zhang, C. Toward the data and measurement in urban network research. Mod. Econ. Sci. 2009, 31, 106–120. [Google Scholar]
- Grubesic, T.; O’kelly, M. Using points of presence to measure accessibility to the commercial internet. Prof. Geogr. 2002, 54, 259–278. [Google Scholar] [CrossRef]
- Malecki, E.J. The economic geography of the Internet’s infrastructure. Econ. Geogr. 2002, 78, 399–424. [Google Scholar] [CrossRef]
- Mitchelson, R.L.; Wheeler, J.O. The flow of information in a global economy: The role of the American urban system in 1990. Ann. Assoc. Am. Geogr. 1994, 84, 87–107. [Google Scholar] [CrossRef]
- Derudder, B.; Witlox, F.; Faulconbridge, J.; Beaverstock, J. Airline data for global city network research: Reviewing and refining existing approaches. Geojournal 2008, 71, 5–18. [Google Scholar] [CrossRef][Green Version]
- Goetz, A.R. Air passenger transportation and growth in the U.S. urban system, 1950–1987. Growth. Change 1992, 23, 217–238. [Google Scholar] [CrossRef]
- Matsumoto, H. International urban systems and air passenger and cargo flows: Some calculations. J. Air Transp. Manag. 2004, 10, 239–247. [Google Scholar] [CrossRef]
- Zambrano-Martinez, J.L.; Calafate, C.T.; Soler, D.; Cano, J.C.; Manzoni, P. Modeling and characterization of traffic flows in urban environments. Sensors 2018, 18, 2020. [Google Scholar] [CrossRef]
- Taylor, P.J. Specification of the World City Network. Geogr. Anal. 2001, 33, 181–194. [Google Scholar] [CrossRef]
- Ye, Q.; Wu, D.; Dai, T.; Guo, Q.; Bao, J. A comparative analysis of hierarchy and regional system of domestic air passenger transport network between China and USA. Geogr. Res.-Aust. 2013, 32, 1084–1094. [Google Scholar]
- Zhang, L.; Zhao, Y.; Dessein, B.; De Maeyer, P. Determinants of intercity air-passenger flows in the “belt and road” region. Complexity 2021, 2021, 5514135. [Google Scholar] [CrossRef]
- Su, X.; Zheng, C.; Yang, Y.; Yang, Y.; Zhao, W.; Yu, Y. Spatial structure and development patterns of urban traffic flow network in less developed areas: A sustainable development perspective. Sustainability 2022, 14, 8095. [Google Scholar] [CrossRef]
- Lin, Q.; Xiang, M.; Zhang, L.; Yao, J.; Wei, C.; Ye, S.; Shao, H. Research on urban spatial connection and network structure of urban agglomeration in Yangtze River Delta—Based on the perspective of information flow. Int. J. Env. Res. Public Health 2021, 18, 10288. [Google Scholar] [CrossRef]
- Wu, C.; Zhuo, L.; Chen, Z.; Tao, H. Spatial spillover effect and influencing factors of information flow in urban agglomerations—Case study of China based on baidu search index. Sustainability 2021, 13, 8032. [Google Scholar] [CrossRef]
- Wang, X.; Ding, S.; Cao, W.; Fan, D.; Tang, B. Research on network patterns and influencing factors of population flow and migration in the Yangtze River Delta urban agglomeration, China. Sustainability 2020, 12, 6803. [Google Scholar] [CrossRef]
- Zong, H.; Lyu, R. The spatial characteristics and evolution of Chinese urban network based on logistics enterprise data in 2007–2017. Sci. Geogr. Sin. 2020, 40, 760–767. [Google Scholar]
- Zhen, F.; Qin, X.; Ye, X.; Sun, H.; Luosang, Z. Analyzing urban development patterns based on the flow analysis method. Cities 2019, 86, 178–197. [Google Scholar] [CrossRef]
- Chang, Y.Z.; Dong, S.C. Evaluation of sustainable development of resources-based cities in Shanxi province based on unascertained measure. Sustainability 2016, 8, 585. [Google Scholar] [CrossRef]
- Cao, Y.; Zhang, Z.; Fu, J.; Li, H. Coordinated development of urban agglomeration in central Shanxi. Sustainability 2022, 14, 9924. [Google Scholar] [CrossRef]
- Wei, S.; Pan, J. Resilience of urban network structure in China: The perspective of disruption. Isprs. Int. J. Geo-Inf. 2021, 10, 796. [Google Scholar] [CrossRef]
- Ke, W.; Chen, W.; Yu, Z. Uncovering spatial structures of regional city networks from expressway traffic flow data: A case study from Jiangsu Province, China. Sustainability 2017, 9, 1541. [Google Scholar] [CrossRef]
- Wang, F.; Guo, M.; Guo, X.; Niu, F.; Zhang, M. Research on the hierarchical spatial structure of the urban agglomeration of the Yellow River Ji-shaped bend. Complexity 2021, 2021, 2293524. [Google Scholar] [CrossRef]
- Miao, C.; Wang, H. On the direction and intensity of urban economic contacts in Henan province. Geogr. Res. 2006, 25, 222–232. [Google Scholar]
- Hanssens, H.; Derudder, B.; Witlox, F.A.V.S. Assessing the functional polycentricity of the mega-city region of Central Belgium based on advanced producer service transaction links. Reg. Stud. 2013, 4848, 1939–1953. [Google Scholar] [CrossRef]
- Xue, D.; Yue, L.; Ahmad, F.; Draz, M.U.; Chandio, A.A.; Ahmad, M.; Amin, W. Empirical investigation of urban land use efficiency and influencing factors of the Yellow River basin Chinese cities. Land Use Policy 2022, 117, 106117. [Google Scholar] [CrossRef]
- Zhou, C.; Li, M.; Zhang, G.; Chen, J.; Zhang, R.; Cao, Y. Spatiotemporal characteristics and determinants of internal migrant population distribution in China from the perspective of urban agglomerations. PLoS ONE 2021, 16, e0246960. [Google Scholar] [CrossRef]
- Lan, F.; Da, H.; Wen, H.; Wang, Y. Spatial structure evolution of urban agglomerations and its driving factors in mainland China: From the monocentric to the polycentric dimension. Sustainability 2019, 11, 610. [Google Scholar] [CrossRef]
- Chai, D.; Zhang, D.; Sun, Y.; Yang, S.; Xiong, F. Research on the city network structure in the Yellow River basin in China based on two-way time distance gravity model and social network analysis method. Complexity 2020, 2020, 6680954. [Google Scholar] [CrossRef]
- Liu, H.; Shi, X.; Yuan, P.; Dong, X. Study on the evolution of multiple network resilience of urban agglomerations in the Yellow River basin. Sustainability 2022, 14, 11174. [Google Scholar] [CrossRef]
- Zhang, J.; Guo, C.; Zhang, Y.; Han, P.; Zhang, Q. Spatial characteristics of nitrogen flows in the crop and livestock production system of Shanxi Province, China. Acta Ecol. Sin. 2016, 36, 99–107. [Google Scholar] [CrossRef]
- Fang, C.; Yu, D. The Spatial pattern of selecting and developing China’s urban agglomerations. In China’s Urban Agglomerations; Springer: Singapore, 2020; pp. 65–126. [Google Scholar] [CrossRef]
- Kong, X.; Xing, W.; Wei, X.; Bao, P.; Zhang, J.; Lu, W. STGAT: Spatial-temporal graph attention networks for traffic flow forecasting. IEEE Access 2020, 8, 134363–134372. [Google Scholar] [CrossRef]
- Zhang, Y.; Zheng, X.; Chen, M.; Li, Y.; Yan, Y.; Wang, P. Urban fine-grained spatial structure detection based on a new traffic flow interaction analysis framework. Isprs. Int. J. Geo-Inf. 2021, 10, 227. [Google Scholar] [CrossRef]
| City | Traffic Flow | Migration Flow | Information Flow | Comprehensiveness Flow | ||||
|---|---|---|---|---|---|---|---|---|
| First Connection City | Membership Degree | First Connection City | Membership Degree | First Connection City | Membership Degree | First Connection City | Membership Degree | |
| Taiyuan | Yuncheng | 17.1% | Jinzhong | 39.5% | Changzhi | 14.4% | Jinzhong | 16.0% |
| Datong | Taiyuan | 37.2% | Shuozhou | 65.1% | Taiyuan | 38.6% | Taiyuan | 35.6% |
| Shuozhou | Taiyuan | 51.9% | Datong | 63.6% | Taiyuan | 38.3% | Taiyuan | 35.5% |
| Xinzhou | Taiyuan | 43.1% | Taiyuan | 55.8% | Taiyuan | 40.5% | Taiyuan | 44.8% |
| Yangquan | Taiyuan | 53.2% | Jinzhong | 51.1% | Taiyuan | 35.8% | Taiyuan | 44.5% |
| Lvliang | Taiyuan | 77.1% | Taiyuan | 55.6% | Taiyuan | 44.3% | Taiyuan | 53.7% |
| Jinzhong | Taiyuan | 35.7% | Taiyuan | 61.3% | Taiyuan | 36.4% | Taiyuan | 44.0% |
| Changzhi | Taiyuan | 37.5% | Taiyuan | 29.0% | Taiyuan | 38.3% | Taiyuan | 37.7% |
| Jincheng | Changzhi | 45.1% | Changzhi | 48.9% | Taiyuan | 28.4% | Changzhi | 33.0% |
| Linfen | Taiyuan | 37.2% | Yuncheng | 40.6% | Taiyuan | 33.5% | Taiyuan | 48.9% |
| Yuncheng | Taiyuan | 41.7% | Linfen | 70.0% | Taiyuan | 34.9% | Taiyuan | 48.4% |
| Rank | City | Rm | rc |
|---|---|---|---|
| 1 | Taiyuan | 5.085 | 1 |
| 2 | Jinzhong | 1.849 | 0.5 |
| 3 | Linfen | 1.732 | 0.333 |
| 4 | Changzhi | 1.637 | 0.25 |
| 5 | Yuncheng | 1.563 | 0.2 |
| 6 | Jincheng | 1.196 | 0.167 |
| 7 | Xinzhou | 1.159 | 0.143 |
| 8 | Yangquan | 1.078 | 0.125 |
| 9 | Lvliang | 1.011 | 0.111 |
| 10 | Datong | 0.946 | 0.1 |
| 11 | Shuozhou | 0.654 | 0.091 |
| Standard deviation | 1.149 | 0.257 | |
| Space structure index | 0.112 | ||
| City | Traffic Flow | Migration Flow | Information Flow | Comprehensiveness Flow | ||||
|---|---|---|---|---|---|---|---|---|
| In-Degree | Out-Degree | In-Degree | Out-Degree | In-Degree | Out-Degree | In-Degree | Out-Degree | |
| Taiyuan | 50 | 50 | 76.92 | 76.92 | 100 | 100 | 100 | 100 |
| Linfen | 41.67 | 38.46 | 55.56 | 55.56 | 66.67 | 55.56 | 62.5 | 55.56 |
| Changzhi | 38.46 | 40 | 52.63 | 52.63 | 55.56 | 71.43 | 58.82 | 62.5 |
| Datong | 37.04 | 37.04 | 50 | 50 | 55.56 | 52.63 | 55.56 | 55.56 |
| Jincheng | 37.04 | 38.46 | 35.71 | 35.71 | 58.82 | 58.82 | 55.56 | 55.56 |
| Lvliang | 35.71 | 35.71 | 52.63 | 52.63 | 55.56 | 52.63 | 55.56 | 52.63 |
| Jinzhong | 41.67 | 40 | 62.5 | 62.5 | 52.63 | 71.43 | 55.56 | 66.67 |
| Shuozhou | 9.09 | 9.09 | 37.04 | 37.04 | 52.63 | 52.63 | 55.56 | 55.56 |
| Yuncheng | 38.46 | 40 | 37.04 | 37.04 | 58.82 | 55.56 | 55.56 | 55.56 |
| Yangquan | 37.04 | 37.04 | 47.62 | 47.62 | 55.56 | 52.63 | 55.56 | 52.63 |
| Xinzhou | 37.04 | 37.04 | 50 | 50 | 58.82 | 52.63 | 52.63 | 52.63 |
| City | Traffic Flow | Migration Flow | Information Flow | Comprehensiveness Flow |
|---|---|---|---|---|
| Taiyuan | 56.30 | 60 | 81.48 | 82.78 |
| Jinzhong | 2.41 | 12.22 | 0 | 1.11 |
| Changzhi | 0.93 | 20 | 1.48 | 1.67 |
| Jincheng | 0 | 0 | 0.56 | 0 |
| Linfen | 1.48 | 20 | 0.93 | 1.11 |
| Yuncheng | 1.11 | 0 | 0 | 0 |
| Datong | 0 | 8.89 | 0 | 0 |
| Shuozhou | 0 | 1.11 | 0 | 0 |
| Xinzhou | 0 | 8.89 | 0 | 0 |
| Yangquan | 0 | 0 | 0 | 0 |
| Lvliang | 0 | 0 | 0 | 0 |
| City | Traffic Flow | Migration Flow | Information Flow | Comprehensiveness Flow | ||||
|---|---|---|---|---|---|---|---|---|
| Efficiency Size | Constraint | Efficiency Size | Constraint | Efficiency Size | Constraint | Efficiency Size | Constraint | |
| Taiyuan | 7.22 | 0.28 | 5.57 | 0.34 | 8.6 | 0.24 | 8.8 | 0.23 |
| Jinzhong | 2.33 | 0.63 | 3 | 0.59 | 3.71 | 0.72 | 2.93 | 0.73 |
| Changzhi | 1.71 | 0.76 | 2.33 | 0.61 | 3.56 | 0.64 | 2.21 | 0.73 |
| Linfen | 2.19 | 0.68 | 2.5 | 0.58 | 2.5 | 0.68 | 2 | 0.78 |
| Xinzhou | 1 | 1.13 | 2 | 0.5 | 1.5 | 1.04 | 1 | 1 |
| Datong | 1 | 1.13 | 2 | 0.5 | 1 | 1.24 | 1 | 1.13 |
| Shuozhou | 1 | 1.13 | 2 | 0.5 | 1 | 1 | 1 | 1.13 |
| Jincheng | 1 | 0.97 | 1 | 1 | 1.92 | 0.79 | 1 | 1.13 |
| Yuncheng | 1.64 | 0.78 | 1 | 1 | 1.3 | 0.95 | 1 | 1.13 |
| Yangquan | 1 | 1.02 | 1 | 1.13 | 1 | 1.24 | 1 | 1.24 |
| Lvliang | 1 | 1 | 1 | 0.93 | 1 | 1.24 | 1 | 1.24 |
Publisher’s Note: MDPI stays neutral with regard to jurisdictional claims in published maps and institutional affiliations. |
© 2022 by the authors. Licensee MDPI, Basel, Switzerland. This article is an open access article distributed under the terms and conditions of the Creative Commons Attribution (CC BY) license (https://creativecommons.org/licenses/by/4.0/).
Share and Cite
Li, S.; Zhang, X.; Wu, X.; Xu, E. Exploration of Urban Network Spatial Structure Based on Traffic Flow, Migration Flow and Information Flow: A Case Study of Shanxi Province, China. Sustainability 2022, 14, 16130. https://doi.org/10.3390/su142316130
Li S, Zhang X, Wu X, Xu E. Exploration of Urban Network Spatial Structure Based on Traffic Flow, Migration Flow and Information Flow: A Case Study of Shanxi Province, China. Sustainability. 2022; 14(23):16130. https://doi.org/10.3390/su142316130
Chicago/Turabian StyleLi, Sujuan, Xiaohui Zhang, Xueling Wu, and Erbin Xu. 2022. "Exploration of Urban Network Spatial Structure Based on Traffic Flow, Migration Flow and Information Flow: A Case Study of Shanxi Province, China" Sustainability 14, no. 23: 16130. https://doi.org/10.3390/su142316130
APA StyleLi, S., Zhang, X., Wu, X., & Xu, E. (2022). Exploration of Urban Network Spatial Structure Based on Traffic Flow, Migration Flow and Information Flow: A Case Study of Shanxi Province, China. Sustainability, 14(23), 16130. https://doi.org/10.3390/su142316130


