


Benefits and Challenges of Making Data More Agile: A Review of Recent Key Approaches in Agriculture

 ,
,
Abstract
1. Introduction
2. Materials and Methods
| COSA Definition: Agile Data is a Monitoring, Evaluation and Learning (MEL) approach that provides timely insights to facilitate adaptive learning and improve investment or intervention outcomes by rapidly deploying short-duration surveys that can be conducted at various fre-quencies and at relatively low cost. It applies targeted and context-appropriate field technologies such as IVR, apps, chatbots, or SMS and employs human or artificial intelligence to provide automated data validation, analysis, and feedback loops to users. Used in rural development programs or supply chains, it is configured to deliver higher-quality, real-time data, reducing survey fatigue among beneficiaries. It differs from most monitoring and evaluation by actively engaging data subjects more purposefully for more accurate information and mutual iterative learning during an engagement rather than after its completion. |
3. Results
3.1. Non-Agile Data versus Agile Data
- Measurement errors due to recall questions embedded in low-frequency surveys
- 2.
- Low comparability at portfolio level due to limited interoperability (non-standardized metrics)
- 3.
- Limited inclusivity due to lack of both a farmer-centric approach and open data principle
- 4.
- High costs of conducting face-to-face surveys in the field
3.2. The Status of the Literature: Agile Data and Semi-Agile Approaches
4. Discussion
4.1. Lack of Digital and Physical Infrastructure: Potential Bias and Solutions
4.2. Adoption of Digital Technologies and Related Incentives: Toward a Farmer-Centric Approach Characterized by Data Democracy
4.3. Data Protection Challenges: Need for Clearly Defined Data Rights
5. Conclusions
- To understand the effect of these digital technologies on inclusivity
- To determine data accuracy, provenance, and veracity
- To what extent approaches can be designed as interoperable to accommodate advanced data approaches such as those employed by the LSMS and CGIAR centers
- To better understand the potential and limitations of the range of benefits related to a farmer-centric approach including the progression to shared local or regional data eco-systems.
Author Contributions
Funding
Institutional Review Board Statement
Informed Consent Statement
Data Availability Statement
Conflicts of Interest
References
- Carletto, C. Better data, higher impact: Improving agricultural data systems for societal change. Eur. Rev. Agric. Econ. 2021, 48, 719–740. [Google Scholar] [CrossRef]
- Food and Agriculture Organization. Investing in Data for SGDs: Why Good Numbers Matter; FAO: Rome, Italy, 2019. [Google Scholar]
- UN. The Sustainable Development Goals Report; United Nation: Rome, Italy, 2021. [Google Scholar]
- UNECE. Measuring and Monitoring Progress toward the Sustainable Development Goals; UNECE: Geneva, Switzerland, 2020. [Google Scholar]
- Fraval, S.; Hammond, J.; Wichern, J.; Oosting, S.J.; De Boer, I.J.M.; Teufel, N.; Lannerstad, M.; Waha, K.; Pagella, T.; Rosenstock, T.S.; et al. Making the most of imperfect data: A critical evaluation of standard information collected in farm household surveys. Exp. Agric. 2019, 55, 230–250. [Google Scholar] [CrossRef]
- Dillon, A.; Lakshman, R. Land Measurement Bias: Comparisons from Global Positioning System, Self-Reports, and Satellite Data. SSRN Electron. J. 2018, 10, 2139. [Google Scholar]
- Gaddis, I.; Gbemisola, O.; Amparo, P.L.; Janneke, P. Measuring Farm Labor: Survey Experimental Evidence from Ghana; World Bank Policy Research Working Paper; The World Bank: Washington, DC, USA, 2019. [Google Scholar]
- Wollburg, P.; Tiberti, M.; Zezza, A. Recall Length and Measurement Error in Agricultural Surveys; World Bank Working Paper; The World Bank: Washington, DC, USA, 2020. [Google Scholar]
- World Bank. Conducting Rapid Response Phone Surveys (RRPS) to Fill Data Gaps; The World Bank: Washington, DC, USA, 2020. [Google Scholar]
- World Bank. Capitalizing on the World Bank LSMS-ISA Program for High-Frequency Phone Surveys on COVID-19; The World Bank: Washington, DC, USA, 2020. [Google Scholar]
- World Bank. High Frequency Mobile Phone Surveys of Households to Assess the Impacts of COVID-19; Guidelines on Sampling Design; The World Bank: Washington, DC, USA, 2020. [Google Scholar]
- World Bank. Iterative Beneficiary Monitoring (IBM) as a Cost-Effective Tool for Improving Project Effectiveness; The World Bank: Washington, DC, USA, 2019. [Google Scholar]
- World Bank. Survey of Well-Being via Instant and Frequent Tracking (SWIFT): Estimating Consumption for Household Poverty Measurement; A Rapid Assessment Tool; The World Bank: Washington, DC, USA, 2015. [Google Scholar]
- World Bank. The World Bank Listening to LAC (L2L) Pilot Final Report; The World Bank: Washington, DC, USA, 2012. [Google Scholar]
- USAID. Rapid Feedback Monitoring, Evaluation, Research and Learning; USAID: Arlington, TX, USA, 2021.
- USAID. Lab Evaluation, Research and Learning Plan; Evidence Brief; USAID: Arlington, TX, USA, 2019.
- USAID. Bridging Real-Time Data and Adaptive Management: Case Study Report; USAID: Arlington, TX, USA, 2017.
- CGIAR. The 5Q Approach for Gender Data on Empowerment in Climate Adaptation Projects: Case Study in Ghana; CGIAR: Washington, DC, USA, 2022. [Google Scholar]
- CGIAR. Collecting Development Data with Mobile Phone: Key Considerations from a Review of the Evidence; CGIAR: Washington, DC, USA, 2017. [Google Scholar]
- World Food Program. Remote Food Security Monitoring. Introduction to Mobile Vulnerability Analysis and Mapping; The World Bank: Washington, DC, USA, 2017. [Google Scholar]
- Acumen. The Lean Data Field Guide; Acumen: Durham, UK, 2015. [Google Scholar]
- Acumen; Unilever. A Lean Data How to Guide. Understanding Gender Impact Phase 2; Acumen: Durham, UK; Unilever: London, UK, 2015. [Google Scholar]
- Acumen; Unilever. A Lean Data How to Guide. Understanding Gender Impact Phase 1; Acumen: Durham, UK; Unilever: London, UK, 2015. [Google Scholar]
- Committee On Sustainability Assessment. Data Democracy: How to Radically Alter the World of Small Farmers; Blog Series; COSA: Philadelphia, PA, USA, 2020. [Google Scholar]
- Barder, O. Science to Deliver, but “No Science of Delivery”. Center for Global Development Blog; SSRN: Washington, DC, USA, 2013. [Google Scholar]
- Sommer, A.F.; Dukovska-Popovska, I.; Steger-Jensen, K. Barriers towards integrated product development—Challenges from a holistic project management perspective. Int. J. Proj. Manag. 2013, 32, 970–982. [Google Scholar] [CrossRef]
- Bassil, Y. A simulation model for the waterfall software development life cycle. Int. J. Eng. Technol. 2012, 2, 742–749. [Google Scholar]
- Gourlay, S.; Kilic, T.; Lobell, D. A new spin on an old debate: Errors in farmer-reported production and their implications for inverse scale—Productivity relationship in Uganda. J. Dev. Econ. 2019, 141, 102376. [Google Scholar] [CrossRef]
- Carletto, C.; Sydney, G.; Siobhan, M.; Alberto, Z. Cheaper, Faster, and More Than Good Enough: Is GPS the New Gold Standard in Land Area Measurement? 2017. Available online: https://policycommons.net/artifacts/1291524/cheaper-faster-and-more-than-good-enough/1894488/ (accessed on 23 August 2022).
- Sourav, A.I.; Emanuel, A.W.R. Recent Trends of Big Data in Precision Agriculture: A Review. In Proceedings of the IOP Conf. Series: Materials Science and Engineering, Jakarta, Indonesia, 20 October 2020. [Google Scholar]
- Anderson, J.; Karuppusamy, R.; Paul Enrico Neumann, P.E.; Howard Miller, H.; Tamara, R. Smallholder Households: Distinct Segments, Different Needs; CGAP Focus Note: Washington, DC, USA, 2019; Volume 111. [Google Scholar]
- Carletto, C.; Zezza, A.; Banerjee, R. Towards Better Measurement of Household Food Security: Harmonizing Indicators and the Role of Household Surveys. Glob. Food Secur. 2013, 2, 30–40. [Google Scholar] [CrossRef]
- Dabalen, A.L.; Etang Ndip, A.; Hoogeveen, J.G.; Mushi, E.; Schipper, Y.; Engelhardt, J.V. Mobile Phone Panel Surveys in Developing Countries: A Practical Guide for Microdata Collection; World Bank Group: Washington, DC, USA, 2016. [Google Scholar]
- Velthausz, D.; Donco, R.; Skelly, H.; Eichleay, M. Mozambique Mobile Access and Usage Study: Computer-Assisted Telephone Interview (CATI) Survey Results. United States Agency for International Development: Washington, DC, USA, 2016. [Google Scholar]
- Zilberman, D.; Khanna, M.; Lipper, L. Economics of Sustainable Agriculture. Aust. J. Agric. Res. Econ. 1997, 41, 63–80. [Google Scholar] [CrossRef]
- Bauer, J.M.; Akakpo, K.; Enlund, M.; Passeri, S. Tracking vulnerability in real time. Mobile text for food surveys in Eastern Democratic Republic of Congo. Afr. Policy J. 2014, 9, 36. [Google Scholar]
- Catholic Relief Service. Measurement Indicators for Resilience Analysis (MIRA II Phase II); Final Report; Catholic Relief Service: Baltimore, MD, USA, 2017. [Google Scholar]
- Harvey, C.A.; Rakotobe, Z.L.; Rao, N.S.; Dave, R.; Razafimahatratra, H.; Rabarijohn, R.H.; Rajaofara, H.; MacKinnon, J.L. Extreme vulnerability of smallholder farmers to agricultural risks and climate change in Madagascar. Philos. Trans. R. Soc. B 2014, 369, 20130089. [Google Scholar] [CrossRef]
- McCarthy, H.; Potts, H.W.W.; Fisher, A. Physical Activity Behavior Before, During, and After COVID-19 Restrictions: Longitudinal Smartphone-Tracking Study of Adults in the United Kingdom. J. Med. Internet Res. 2021. Available online: https://www.jmir.org/2021/2/e23701/PDF (accessed on 23 August 2022).
- Wanjala, M.Y.; Iravo, M.A.; Odhiambo, R.; Shalle, N.I. Effect of Monitoring Techniques on Project Performance of Kenyan State Corporations. Eur. Sci. J. 2017, 13, 269. [Google Scholar]
- Akers, J.C. Dial “A” for agriculture: A review of information and communication technologies for agricultural extensions in developing countries. J. Agric. Econ. 2011, 6, 631–647. [Google Scholar] [CrossRef]
- Fabregas, R.; Kremer, M.; Schilbach, F. Realizing the potential of digital development. The case of agricultural advice. Science 2019, 366, eaay3038. [Google Scholar] [CrossRef]
- Schroeder, K.; Lampietti, J.; Elabed, G. What’s Cooking: Digital Transformation of the Agrifood System; Agriculture and Food Series; World Bank: Washington, DC, USA, 2021. [Google Scholar] [CrossRef]
- Raissa, F.; Michael Kremer, M.; Schilbach, F. Realizing the Potential of Digital Development: The Case of Agricultural Advice. Science 2019, 366, 30–38. [Google Scholar]
- Garlick, R.; Orkin, K.; Quinn, S. Call me maybe: Experimental evidence on frequency and medium effects in microenterprise surveys. World Bank Econ. Rev. 2020, 34, 418–443. [Google Scholar] [CrossRef]
- Talip, K.; Moylan, H.; Ilukor, J.; Mtengula, C.; Pangapanga-Phiri, I. Root for the tubers: Extended-harvest crop production and productivity measurement in surveys. Food Policy 2021, 102, 102033. [Google Scholar]
- Fabregas, R.; Kremer, M.; Lowes, M.; On, R.; Zane, G. SMS-Extension and Farmer Behavior: Lessons from Six RCT in East Africa; ATAI Working Paper; ATAI: Cambridge, UK, 2019. [Google Scholar]
- Lamanna, C.; Hachhethu, K.; Chesterman, S.; Singhal, G.; Mwongela, B.; Ng’endo, M.; Passeri, S.; Farhikhtah, A.; Kadiyala, S.; Bauer, J.-M.; et al. Strengths and limitations of computer assisted telephone interviews (CATI) for nutrition data collection in rural Kenya. PLoS ONE 2019, 14, e0210050. [Google Scholar] [CrossRef]
- Carletto, C.; Savastano, S.; Zezza, A. Fact or artifact: The impact of measurement errors on the farm size–productivity relationship. J. Dev. Econ. 2013, 103, 254–261. [Google Scholar] [CrossRef]
- Furbush, A.; Josephson, A.; Kilic, T.; Michler, J.D. The Evolving Socioeconomic Impacts of COVID 19 in Four African Countries; World Bank Policy Research Paper; The World Bank: Washington, DC, USA, 2021. [Google Scholar]
- Arthi, V.; Kathleen Beegle, K.; De Weerdt, J.; Palacios-López, A. Not your average job: Measuring farm labor in Tanzania. J. Dev. Econ. 2017, 130, 160–172. [Google Scholar] [CrossRef]
- Benami, E.; Carter, M.R. Can digital technologies reshape rural microfinance? Implications for savings, credit, & insurance. Appl. Econ. Perspect. Policy 2021, 43, 1196–1220. [Google Scholar]
- Lau, C.Q.; Cronberg, A.; Leenisha Marks, L.; Ashley Amaya, A. In Search of the Optimal Mode for Mobile Phone Surveys in Developing Countries. A Comparison of IVR, SMS, and CATI in Nigeria. Surv. Res. Method 2019, 13, 305–318. [Google Scholar]
- Sampaio, F.G.; Araújo, C.A.S.; Dallago, B.S.L.; Stech, J.L.; Lorenzetti, J.A.; Alcantara, E.; Losekann, M.E.; Marin, D.B.; Leão, J.Q.A.; Bueno, G.W. Unveiling low to high frequency data sampling caveats for aquaculture environmental monitoring and management. Aquac. Rep. 2021, 20, 100764. [Google Scholar] [CrossRef]
- Abay, K.A.; Abate, G.T.; Barrett, C.B.; Bernard, T. Correlated non-classical measurement errors, ‘second best’ policy inference, and the inverse size-productivity relationship in agriculture. J. Dev. Econ. 2019, 139, 171–184. [Google Scholar] [CrossRef]
- Bevis, L.; Barrett, C. Close to the edge: High productivity at plot peripheries and the inverse size-productivity relationship. J. Dev. Econ. 2020, 143, 102377. [Google Scholar] [CrossRef]
- Carletto, C.; Gourlay, S.; Winters, P. From guesstimates to GPS estimates: Land area measurement and implications for agricultural analysis. J. Afr. Econ. 2015, 24, 593–628. [Google Scholar] [CrossRef]
- Desiere, S.; Jolliffe, D. Land productivity and plot size: Is measurement error driving the inverse relationship? J. Dev. Econ. 2018, 130, 84–98. [Google Scholar] [CrossRef]
- Casaburi, L.; Kremer, M.; Ramrattan, R. Crony Capitalism, Collective Action, and ICT: Evidence from Kenyan Contract Farming. PEDL Research Paper. 2019. Available online: https://www.atai-research.org/crony-capitalism-collective-action-and-ict-evidence-from-kenyan-contract-farming/ (accessed on 23 August 2022).
- Lobell, D.; Tommaso, S.; You, C.; Djima, I.; Burke, M.; Kilic, T. Sight for Sorghums: Comparisons of satellite- and ground-based sorghum yield estimates in Mali. Remote Sens. 2019, 12, 100. [Google Scholar] [CrossRef]
- Carter, M.R.; de Janvry, A.; Sadoulet, E.; Sarris, A. Index Insurance for Developing Country Agriculture: A Reassessment. Annu. Rev. Resou. Econ. 2017, 9, 421–438. [Google Scholar] [CrossRef]
- Flatnes, J.E.; Michael, R.; Carter, M.R.; Mercovich, R. Improving the Quality of Index Insurance with a Satellite-Based Conditional Audit Contract; Working Paper; Department of Agricultural and Resource Economics, University of California: Berkeley, CA, USA, 2018. [Google Scholar]
- Amankwah, A.; Gourlay, S. Household Agriculture and Food Security in the Face of COVID 19. Evidence from Five Sub-Saharan Countries. In Proceedings of the International Association of Agricultural Economists Virtual Conference, New Delhi, India, 17 August 2021. [Google Scholar]
- Hoogeveen, J.; Utz Pape, U. Data Collection in Fragile States. Innovations from Africa and Beyond; Palgrave MacMillan Edition; Springer Nature: Cham, Switzerland, 2020. [Google Scholar]
- Security Information Network (FSIN). Quantitative Analyses for Resilience Measurement; FSIN: Singapore, 2016. [Google Scholar]
- Theobald, S.; Diebold, P. Interface Problems of Agile in a Non-Agile Environment. In Proceedings of the Agile Processes in Software Engineering and Extreme Programming 18th International Conference, Cologne, Germany, 22–26 May 2017; pp. 123–130. [Google Scholar]
- Saner, R.; Yiu, L.; Nguyen, M. Monitoring the SDGs: Digital and Social Technologies to ensure citizen participation, inclusiveness and transparency. Dev. Policy Rev. 2019, 38, 483–500. [Google Scholar] [CrossRef]
- Benjamin, L.; Morello, R.; Mellon, J.; Peixoto, T.; Davenport, S.T. Do Mobile Phone Surveys Work in Poor Countries? Center for Global Development Working Paper; SSRN: Washington, DC, USA, 2015. [Google Scholar]
- Food and Agriculture Organization of the United Nations, International Telecommunication Union. E-agriculture Strategy Guide: Piloted in Asia-Pacific Countries; FAO; ITU: Bangkok, Thailand, 2016. [Google Scholar]
- Giovannucci, D. How New Metrics for Sustainable Agriculture Can Align the Roles of Government and Business; UN Global Sustainable Development Report Science Briefs; United Nations: Brussels, Belgium, 2015. [Google Scholar]
- Blundo, C.G.; Faure, G.; Hainzelin, E.; Monier, C.; Triomphe, B.; Vall, E. Impress Ex Ante. An Approach for Building Ex Ante Impact Pathways; CIRAD: Montpellier, France, 2018; 64p. [Google Scholar]
- Food and Agriculture Organization. Rima-II. Resilience Index Measurement and Analysis; FAO: Rome, Italy, 2016. [Google Scholar]
- Data for Development. A Need Assessment for SDG Monitoring and Statistical Capacity Development; Sustainable Development Solutions Network: New York, NY, USA, 2015. [Google Scholar]
- European Parliamentary Research Service. Precision Agriculture in Europe: Legal, Social, and Ethical Considerations; European Union: Brussels, Belgium, 2017. [Google Scholar]
- Jarvis, A.; Eitzinger, A.; Koningstein, M.; Benjamin, T.; Howland, F.; Andrieu, N.; Twyman, J.; Corner-Dolloff, C. Less Is More: The 5Q Approach; CIAT Scientific Report; International Center for Tropical Agriculture: Cali, Colombia, 2015. [Google Scholar]
- Angrist, N.; Bergam, P.; Brewster, C.; Matsheng, M. Stemming Learning Loss during the Pandemic: A Rapid Randomized Control Trial of a Low-Tech Intervention in Botswana; CSAE Working Paper; SSRN: Rochester, NY, USA, 2020. [Google Scholar]
- IPA and Northwestern. Remote Surveying in a Pandemic: Research Synthesis; IPA and Northwestern: Washington, DC, USA, 2020. [Google Scholar]
- Pariyo, G.W.; Greenleaf, A.R.; Gibson, D.G.; Ali, J.; Selig, H.; Labrique, A.B.; Al Kibria, G.M. Does mobile phone survey method matter? Reliability of computer-assisted telephone interviews and interactive voice response non-communicable diseases risk factor surveys in low and middle income countries. PLoS ONE 2019, 14, e0214450. [Google Scholar] [CrossRef]
- Benson, T. Can Mobile Phone-Based Household Surveys in Rural Papua New Guinea Generate Information Representative of Population Surveyed? IFPRI Project Paper; Intl Food Policy Res Inst: Washington, DC, USA, 2019. [Google Scholar]
- Dillon, B. Using mobile phones to collect panel data in developing countries. J. Int. Dev. 2012, 4, 518–527. [Google Scholar] [CrossRef]
- Kilic, T.; Moylan, H.; Koolwal, G. Getting the (Gender-Disaggregated) lay of the land: Impact of survey respondent selection on measuring land ownership and rights. World Dev. 2021, 146, 105545. [Google Scholar] [CrossRef]
- Özler, B.; Cuevas, P.F. Reducing Attrition in Phone Surveys; World Bank Blogs; The World Bank: Washington, DC, USA, 2019. [Google Scholar]
- De Beer, J. Ownership of Open Data: Governance Options for Agriculture and Nutrition. GODAN (Global Open Data for Agriculture and Nutrition). 2017. Available online: https://www.godan.info/sites/default/files/documents/Godan_Ownership_of_Open_Data_Publication_lowres.pdf (accessed on 23 August 2022).
- Young, A.; Verhulst, S. Aclímate Colombia: Open Data to Improve Agricultural Resiliency. Open Data’s Impact. 2017. Available online: http://odimpact.org/files/case-aclimate-colombia.pdf (accessed on 23 August 2022).
- Open Data Institute. How Can We Improve Agriculture, Food and Nutrition with Open Data; Working Paper; Open Data Institute: London, UK, 2015; Available online: https://theodi.org/article/improving-agriculture-and-nutrition-with-open-data (accessed on 23 August 2022).
- Gabella, C.; Durinx, C.; Appel, R. Funding Knowledge Bases: Towards a Sustainable Funding Model for the UniProt Use Case; F100 Research 6 (ELIXIR): 2051; Swiss Institute of Bioinformatics: Lausanne, Switzerland, 2017. [Google Scholar]
- DLG. Digital Agriculture: Opportunities, Risks, Acceptance; A DLG Position Paper; DLG: Frankfurt, Germany, 2018. [Google Scholar]
- UN. UN Common Guidance on Helping Build Resilient Societies; United Nation: Rome, Italy, 2020. [Google Scholar]
- Food and Agriculture Organization. Evaluation of the Information on Nutrition, Food Security and Resilience for Decision Making (INFORMED) Programme; FAO Programme Evaluation Series; FAO: Rome, Italy, 2021. [Google Scholar]
- Rainaw, F.R.; Susanti, A.I.; Amelia, I.; Ardisasmita, M.; Widarti; Dewi, R.K.; Ferdian, D.; Gusdya, W.; Purbasari, A. Understanding mobile application development and implementation for monitoring Posyandu data in Indonesia: A 3-year hybrid action study to build “a bridge” from the community to the national scale. BMC Public Health 2021, 21, 1024. [Google Scholar]
- Farm Radio International. The Listening Post; Farm Radio International: Ottawa, IL, USA, 2020. [Google Scholar]
- Hoffecker, E.; Leith, K.; Wilson, K. The Lean Research Framework: Principles for Human-Centered Field Research; D-Lab: Cambridge, MA, USA, 2015. [Google Scholar]
- Leith, K.; McCreless, M. Lean Research Field Guide; MIT D-Lab: Cambridge, MA, USA, 2018. [Google Scholar]
- Green Climate Fund. Funding Proposal-Acumen Resilience Agriculture Fund (ARAF); Green Climate Fund: Incheon, Korea, 2018. [Google Scholar]
- IDS. Exploring the Potential for Interactive Radio to Improve Accountability and Responsiveness to Small-Scale Farmers in Tanzania; Institute of Development Studies Administrators: Kota Kinabalu, Sabah, Malaysia, 2016. [Google Scholar]
- ITU. Measuring the Information Society Report; ITU: Geneva, Switzerland, 2018. [Google Scholar]
- Keusch, F.; Bähr, S.; Haas, G.C.; Kreuter, F.; Trappmann, M. Coverage Error in Data Collection Combining Mobile Surveys with Passive Measurement Using Apps: Data from a German National Survey. Sociol. Methods. Res. 2020. [Google Scholar] [CrossRef]
- Kilic, T.; Moylan, H. Methodological Experiment on Measuring Asset Ownership from a Gender Perspective; World Bank Technical Report; The World Bank: Washington, DC, USA, 2016. [Google Scholar]
- GSMA. Connected Women: The Mobile Gender Gap Report 2020; GSMA Association: London, UK, 2020. [Google Scholar]
- Beegle, K.; Carletto, C.; Himelein, K. Reliability of recall in Agricultural data. J. Dev. Econ. 2012, 98, 34–41. [Google Scholar] [CrossRef]
- Leo, B.; Robert, M. Practical Considerations with Using Mobile Phone Survey Incentives: Experiences in Ghana and Tanzania; Center for Global Development Working Paper; Center for Global Development: Washington, DC, USA, 2016. [Google Scholar]
- National Research Council. 8 Potential Sources of Error: Nonresponse, Specification, and Measurement. In Estimating the Incidence of rape and Sexual Assault; Candace Kruttschnitt, K., Kalsbeek, W.D., House, C.C., Eds.; The National Academies Press: Washington, DC, USA, 2014. [Google Scholar]
- Ballivian, A.; João Pedro Azevedo, J.P.; Durbin, W. Using Mobile Phones for High- Frequency Data Collection. In Mobile Research Methods: Opportunities and Challenges of Mobile Research Methodologies; Ubiquity Press: London, UK, 2015; pp. 21–39. [Google Scholar]
- Hughes, S.; Velyvis, K. Tips to Quickly Switch from Face-to-Face to Home-Based Telephone Interviewing; Mathematica (Blog); JPAL: Cambridge, UK, 2020. [Google Scholar]
- Eitziger, A. Data collection Smart and Simple: Evaluation and Meta Analysis of Call Data from Studies Applying the 5Q Approach. Front. Sustain. Food Syst. 2021, 5, 727058. [Google Scholar] [CrossRef]
- Kasy, M.; Sautmann, A. Adaptive Treatment Assignment in Experiments for Policy Choice. Econometrica 2019, 89, 113–132. [Google Scholar]
- Sabates-Wheeler, R.; Devereux, S.; Mitchell, T.; Tanner, T.; Davies, M.; Leavy, J. Rural Disaster Risk: Poverty Interface; Institute of Development Studies, University of Sussex: Brighton, UK, 2008. [Google Scholar]
- World Bank. Economic Effects of COVID-19. Rapid Surveys of Rural Households in India; IDinsight and Development Data Lab: Washington, DC, USA, 2021. [Google Scholar]


| Type | DHS | MICS | LSMS | Labor | Agricultural | Supp. |
|---|---|---|---|---|---|---|
| Operations | 800,186 | 716,040 | 1,235,852 | 331,204 | 1,117,303 | 319,002 |
| Field | 805,027 | 340,985 | 495,427 | 133,128 | 431,135 | 125,974 |
| Total | 1,605,213 | 1,057,025 | 1,731,279 | 464,333 | 1,548,438 | 444,977 |
| Technology Mode | Key Attributes | ||||
|---|---|---|---|---|---|
| Mode | Physical Set Up | Hardware Requirements | Time Saving—Low Costs | High Frequency | Feedback Loops |
| CAPI | Face to Face Operator | Mobile Phone/Computers | |||
| CATI | Live Operator Call centers | Mobile phone | |||
| SMS | Automated & Manual | Mobile phone | if manual | ||
| Mobile App | Automated | Smartphone or feature phone | |||
| IVR | Pre-Recorded Messages | Mobile phone | |||
| Sensors | Automated | Satellite | |||
| Agile | Non-Agile | Reference to the Literature | |
|---|---|---|---|
| 1 | Diverse technology modes | Surveys administered face-to-face or by telephone = Higher costs | [3,4,12,33,73,77,78] |
| 2 | Short duration, and high frequency | Long duration of data gathering and processing = Less actionable knowledgeLow frequency = Measurement errors, non-timely information and greater attrition rates | [1,5,6,17,30,35,40,45,66,79,80,81,82] |
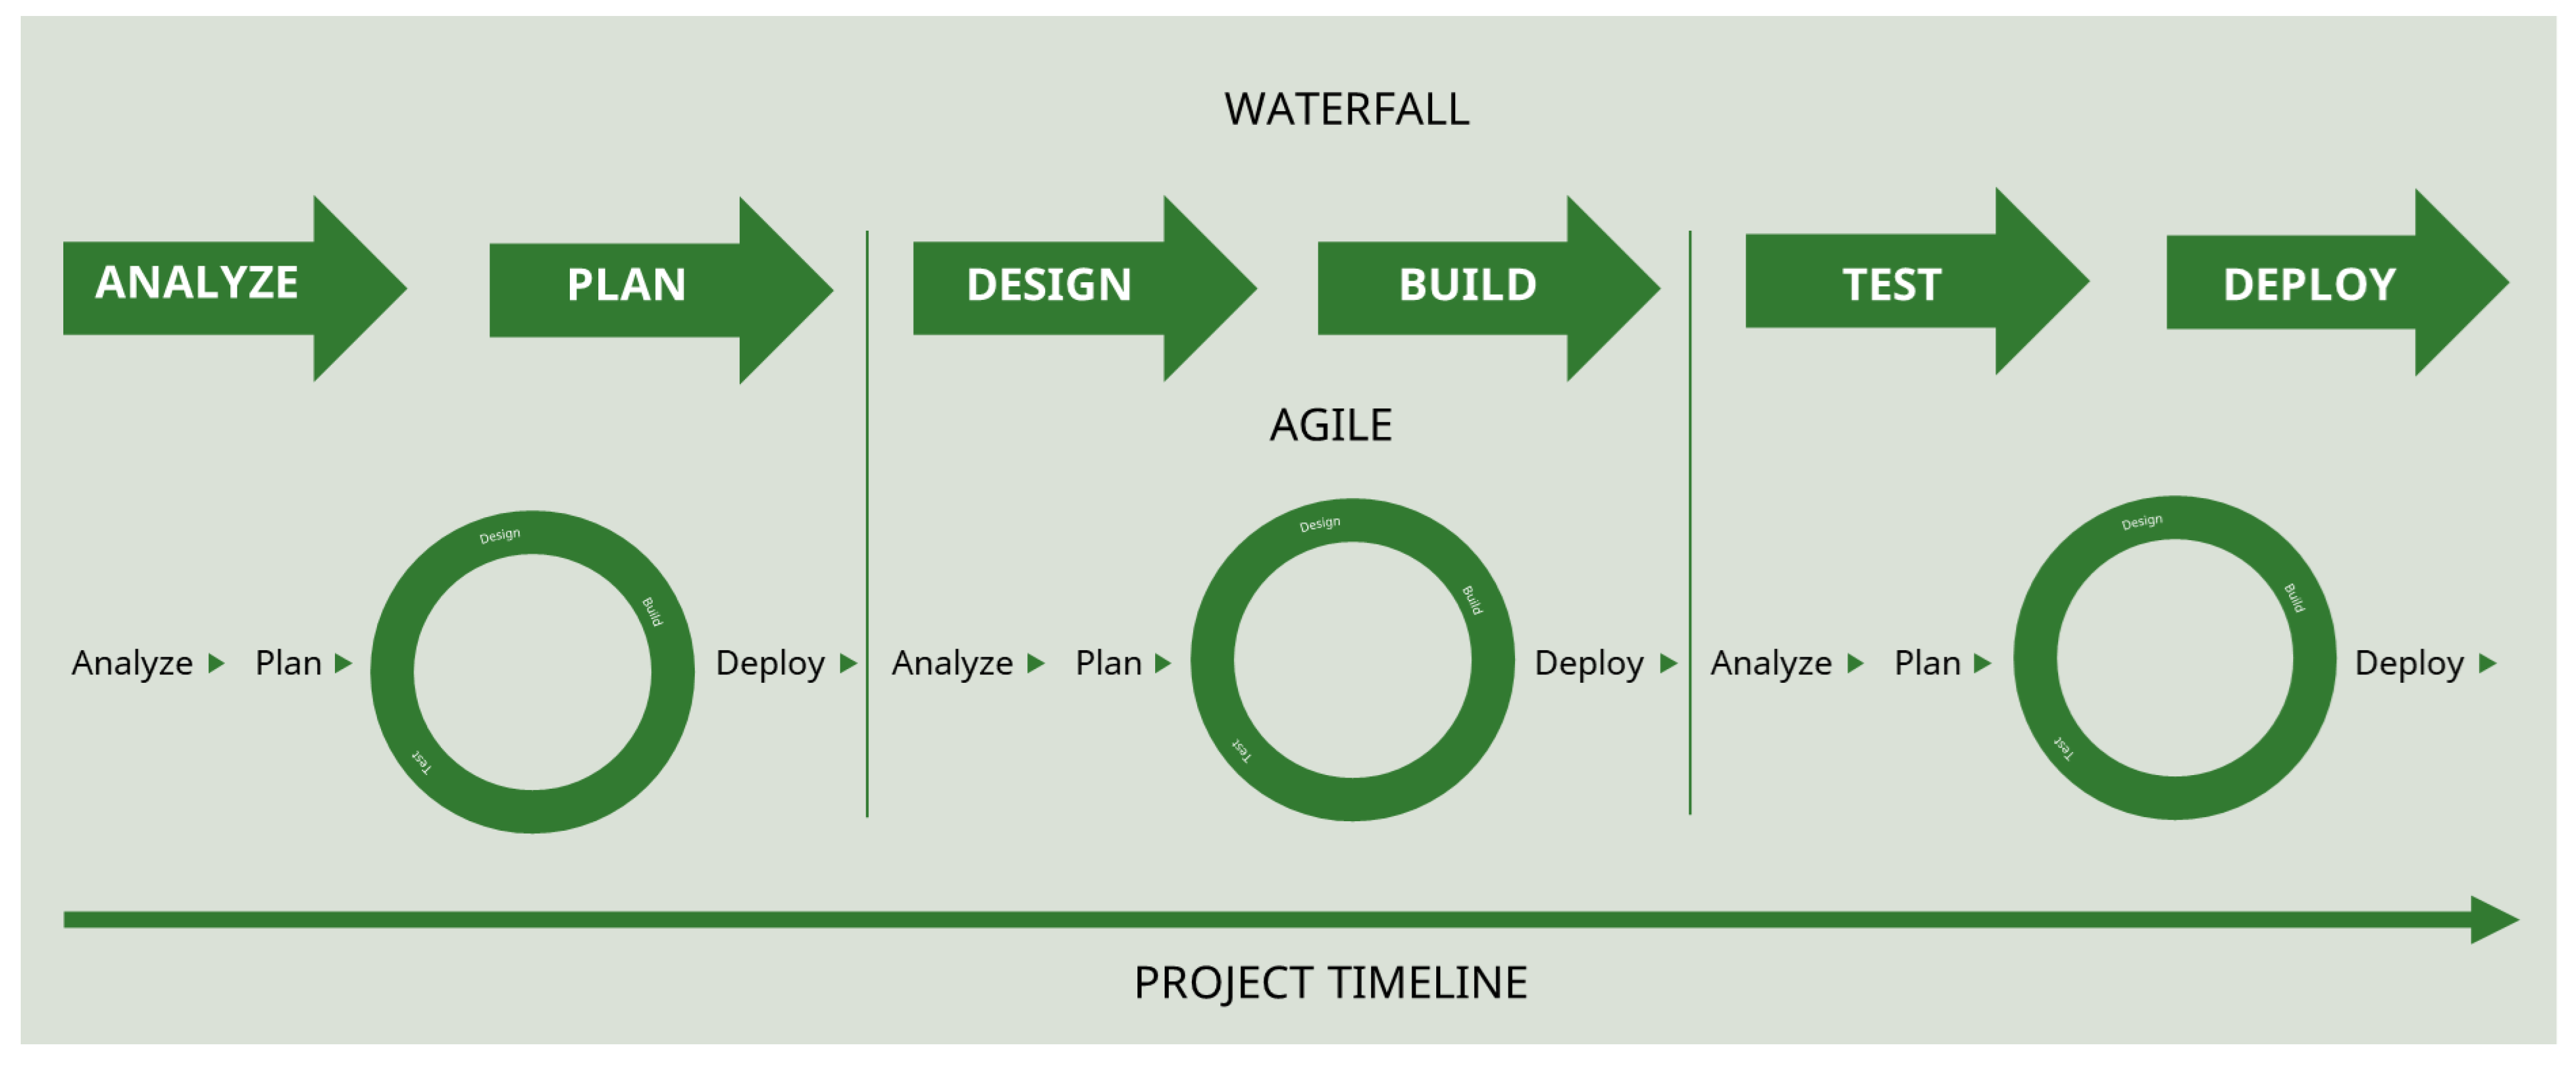
| 3 | Agile design and monitoring based on rapid feedback loops and adaptive behavior | Waterfall or linear management model is more static and less interactive, thus reducing flexibility and rapid learning or decision-making | [12,15,17,20] |
| 4 | Open data principles | Closed data ecosystem = Limited exchange of data to farmers and between the public and private sector | [74,83,84,85,86]; |
| 5 | Farmer-centric approach to Data Democracy | Limited ongoing farmer engagement | [20,24,43,48,87,88] |
| 6 | Interoperability | Limited integration between different data types and sources. Non-standardized metrics that challenge verification and can limit the topics and levels of analysis set in the beginning | [1,40,71,89] |
| Organization | Diverse Tech Modes | High Frequency | Short Duration | Agile Design and Monitoring | Farmer Centric | Open Data Principles |
|---|---|---|---|---|---|---|
| World Bank | CATI | RRPS: Multiple rounds LSMS-ISA: monthly | RRPS: 20 m LSMS-ISA: 20 m SWIFT: 7–10 m | IBM | LSMS-ISA: RRPS: Interactive country dashboard | |
| USAID | IVR, mobile app | RTD4AM: monthly or weekly | RTD4AM: rapid | RTD4AM MERL | RTD4AM | RTD4AM |
| World Food Program | SMS, CATI, IVR, chatbot, Facebook | mVAM | mVAM: rapid | mVAM | mVAM dashboard | mVAM |
| CGIAR | IVR | 5Q: Daily | 5Q: 15 min | 5Q: Dashboard | ||
| Acumen | CATI |
Publisher’s Note: MDPI stays neutral with regard to jurisdictional claims in published maps and institutional affiliations. |
© 2022 by the authors. Licensee MDPI, Basel, Switzerland. This article is an open access article distributed under the terms and conditions of the Creative Commons Attribution (CC BY) license (https://creativecommons.org/licenses/by/4.0/).
Share and Cite
Serfilippi, E.; Giovannucci, D.; Ameyaw, D.; Bansal, A.; Wobill, T.A.N.; Blankson, R.; Mishra, R. Benefits and Challenges of Making Data More Agile: A Review of Recent Key Approaches in Agriculture. Sustainability 2022, 14, 16480. https://doi.org/10.3390/su142416480
Serfilippi E, Giovannucci D, Ameyaw D, Bansal A, Wobill TAN, Blankson R, Mishra R. Benefits and Challenges of Making Data More Agile: A Review of Recent Key Approaches in Agriculture. Sustainability. 2022; 14(24):16480. https://doi.org/10.3390/su142416480
Chicago/Turabian StyleSerfilippi, Elena, Daniele Giovannucci, David Ameyaw, Ankur Bansal, Thomas Asafua Nketsia Wobill, Roberta Blankson, and Rashi Mishra. 2022. "Benefits and Challenges of Making Data More Agile: A Review of Recent Key Approaches in Agriculture" Sustainability 14, no. 24: 16480. https://doi.org/10.3390/su142416480
APA StyleSerfilippi, E., Giovannucci, D., Ameyaw, D., Bansal, A., Wobill, T. A. N., Blankson, R., & Mishra, R. (2022). Benefits and Challenges of Making Data More Agile: A Review of Recent Key Approaches in Agriculture. Sustainability, 14(24), 16480. https://doi.org/10.3390/su142416480