Article

Measuring CO2 Emissions in E-Commerce Deliveries: From Empirical Studies to a New Calculation Approach

by
Damian Dubisz
1,
Paulina Golinska-Dawson
1,* and
Przemysław Zawodny
2
1
Institute of Logistics, Poznan University of Technology, 60-965 Poznan, Poland
2
Łukasiewicz Research Network—Poznan Institute of Technology, 60-654 Poznan, Poland
*
Author to whom correspondence should be addressed.
Sustainability 2022, 14(23), 16085; https://doi.org/10.3390/su142316085
Submission received: 25 October 2022 / Revised: 19 November 2022 / Accepted: 26 November 2022 / Published: 1 December 2022
(This article belongs to the Collection Sustainable E-commerce)

Abstract

:
The rapid development of e-commerce during the COVID-19 pandemic has caused an increase in the demand for urban deliveries. In this study, we conduct an exploratory analysis to identify factors that influence the fuel consumption and related greenhouse gas emissions (GHG) of vans and trucks used for e-commerce delivery. The novelty of this research results from the proposal of a new actionable approach to calculate CO2 emissions from heterogeneous fleets in e-commerce deliveries. Through a literature review, a survey of transport managers, and a case study on e-commerce deliveries, we have found that the heterogeneous fleet structure impacts direct emissions from urban deliveries. We have taken into account the parameters of a heterogeneous fleet structure, such as gross weight, mass, fuel type, engine size, fuel consumption (liters/100 km), and the age of a vehicle. Through numerical experiments, we have identified that the age of a vehicle results in increased fuel consumption of 1.31% year-to-year for vans and 1.01% year-to-year for 18-t trucks. For that reason, we proposed a novel formula to calculate the direct CO2 emissions from heterogeneous fleets in e-commerce deliveries, which takes into consideration the age-related fuel consumption factor and the structure of a fleet.

1. Introduction

E-commerce has developed rapidly during the COVID-19 pandemic resulting in an increased demand for last-mile deliveries [1,2,3]. In 2021, retail e-commerce sales were 5.2 trillion US dollars worldwide in comparison to 3.4 trillion U.S. dollars in 2019 [4]. For example, in 2020 alone, e-commerce sales resulted in 125 billion parcel and courier shipments [5]. The e-commerce market has become very competitive, and to be attractive to customers, companies offer services related to shortening delivery times (e.g., same-day delivery or a less than 24 h guarantee for delivery) [6]. The relationship between cost, speed, and carbon emission values in e-commerce is recently under investigation by researchers [7]. Speed-oriented distribution services in e-commerce result in lower consolidation levels, and therefore negative externalities [8], such as congestion and air pollution. In e-commerce, outbound logistics (e-commerce-related deliveries) are responsible for almost half of the direct and indirect greenhouse gas emissions in the value chain [9].
In the European Union, more than 75% of the population lives in cities; thus, most e-commerce deliveries take place in urban areas. Urban deliveries generate more than 25% of CO2 emissions in a city [10]. Due to the rapid development of e-commerce, a considerable share of urban deliveries is made directly to individual customers, so the use of traditional trucks is less effective [11]. Urban freight transport generates more pollution per km traveled than long-distance transport, due to higher fuel consumption, as there are more frequent stops (stop-and-go movements) and a higher share of idle times per trip [12,13]. The lower fuel efficiency of the last-mile operations also results from a spatial distribution of recipients. Urban e-commerce deliveries are more frequent and smaller with different time windows and non-optimal rescheduling due to the absence of recipients [14].
According to the European Commission [10], approximately 20.3% of the world′s emissions are from the transportation sector. Previous empirical studies have shown that more than 20% of CO2 emissions related to transport come from urban freight vehicles [15].
Many researchers have focused on the decarbonization of urban freight through its electrification [16,17,18], and the use of alternative modes of transportation such as cargo bikes/tricycles [19], and drones [14,20]. However, in business practices, most urban deliveries are still made by trucks and vans.
Therefore, there is a strong need for an actionable approach to measuring the CO2 emissions created by trucks and vans [21,22]. In this paper, we derive from theory and practice (focused survey) the parameters that are relevant for fuel consumption in urban areas and are related to the characteristics of the fleet. To our knowledge, existing theoretical studies do not provide a direct answer about specific methods of CO2 emissions calculated within supply chains in terms of various truck parameters. Therefore, our research contributes to this knowledge gap. The main objective of the study is to propose a practice-oriented method for calculating the total CO2 emissions in a supply chain with parameters relevant to e-commerce deliveries with a heterogeneous fleet. We focus on fuel consumption (energy efficiency) and its relation to the structure of a fleet. In this study, we aim to answer two research questions:
  • RQ1: What factors influence the CO2 emissions of vehicles in e-commerce distribution?
  • RQ2: How can direct CO2 emissions be calculated in e-commerce deliveries in an actionable way taking into account the heterogeneous fleet structure?
We search for the answer to RQ1 through the literature review and empirical studies (focused survey) among freight managers, who specialized in e-commerce deliveries.
In order to answer RQ2, a calculation formula is proposed that is useful for determining the direct CO2 emissions for a heterogeneous fleet that delivers goods in e-commerce. We performed numerical examples to test the proposed formula using real-life data and DEKRA emission′s factors.
The novelty of this research results from the proposal of a new actionable approach to calculate CO2 emissions from heterogeneous fleets in e-commerce deliveries. Through a literature review, a survey among transport managers, and a case study on e-commerce delivery, we found that the heterogeneous fleet structure impacts direct emissions from urban deliveries. We have taken into account the parameters of the heterogeneous fleet structure, such as gross weight, mass, fuel type, engine size, fuel consumption (liters/100 km), and the age of a vehicle.
The remainder of the paper is organized as follows: The research approach and methods are described in Section 2. The results of the focused survey and numerical experiments are presented in Section 3. The discussion on the application of the proposed approach is provided in Section 4. The final conclusions are stated in Section 5.

2. Literature Review

2.1. Environmental Impact of E-Commerce

Previous studies on the environmental impact of e-commerce have focused on:
  • Comparison of online versus offline shopping and related trade-offs [9,23,24].
  • Returns management and packing [25,26].
  • Last-mile logistics [1,5,27].
The negative economic, social, and environmental impact of e-commerce-related deliveries in urban areas can be summed up, as follows [23,24,25,26,27,28,29,30,31]:
  • Higher costs of km (mile) traveled per delivery.
  • Increased traffic congestion and related accidents.
  • Increased emissions of CO2 and other Green House Gases (GHG).
  • Waste, such as tires, oil, and other waste products related to the maintenance of the transport infrastructure.
  • Increased noise and vibrations.
There is an ongoing academic discussion about whether the environmental impact of e-commerce-related deliveries is more or less negative than traditional in-store shopping [7,9,25]. According to previous research, the sustainability of the last mile of e-commerce depends on two main factors: (1) The substitution of personal shopping trips by freight deliveries and (2) the energy efficiency (level of fuel consumption) of freight vehicles [1]. In this paper, we focus on the energy efficiency of freight vehicles.
Due to the complexity of the measurement and the difficulties in collecting empirical data, it is necessary to identify the key parameters that determine the final levels of energy efficiency of vehicles used for e-commerce deliveries and related CO2 emissions.

2.2. Carbon Footprint

Emissions in the supply chain are often expressed by carbon footprint (CF) and presented as the CO2 equivalent (CO2e). The carbon footprint is ‘a measure of the exclusive total amount of carbon dioxide emissions that are directly and indirectly caused by an activity or are accumulated over the life stages of a product’ [32].
It consists of carbon dioxide (CO2) and other greenhouse gasses such as CH4 (Methane) and N2O (Nitrous oxide). In such a context, actual CF is expressed as the sum of kilograms of all greenhouse gas ingredients equivalent (kgCO2e) [15]. Such an aggregated value allows one to indicate the overall carbon footprint of the supply chain in internationally recognizable standards. Therefore, precise GHG calculation supports the assessment of the specific contribution of SC to climate change and parametrizes it in terms of further optimization.
In a supply chain, the carbon footprint is commonly measured [33]:
  • To identify the most energy-consuming processes.
  • To determine how to optimize processes and reduce energy consumption.
  • To define the level of emissions so that the obtained results can be compared with competitors in their business sector or reported to authorities.
The well-established method for the calculation of the carbon footprint is the LCA (life cycle assessment), as it allows the estimation of the GHGs emitted (and embodied) at each identified step of the product (or service) life cycle [34]. Approaches to carbon footprint calculation can be top-down using the Input–Output Framework for corporate or regional CF accounting [35], or a bottom-up approach with the LCA approach (or hybrid IO-LCA) for product-level CF accounting [36,37,38]. The accounting of CO2 emissions [39,40], as follows, requires:
  • Selecting the GHGs to be included in calculations (direct and indirect).
  • Defining the organizational and operational boundaries (stakeholder analysis).
  • Collecting relevant data on GHG emissions.
Measuring CF is a very complex and data-intensive task; therefore, companies usually perform it at the aggregate level [41]. Then structural decomposition analysis and structural path analysis are needed to identify the main areas of emissions [33]. This approach is very work-intensive and requires dedicated resources. The main issue related to CF calculation is data collection, which can be obtained by real-time measurements or by estimation based on emission factors and models [40]. To simplify the CF calculation, companies often use specific emission factors from general databases with respect to the consumption of fuels/energy and other inputs [42]. This situation can result in differences in carbon footprint calculations. In recent years, much has been accomplished regarding measuring CF in various business sectors, but there are still gaps to be filled [43]. Access to comprehensive and reliable data is a major challenge. The existing bottom-up approach relies strongly on the LCA methodology, which is time- and resource-intensive. Das and Jharkharia [18] found that the identification of the scope, boundaries, and data for LCA is very problematic in a supply chain. Thus, a more actionable approach is needed [34].
We contribute to this research gap by providing an actionable method for measuring direct CO2 emissions in e-commerce deliveries.

2.3. Factors Influencing Emissions in E-Commerce

Previous studies have explored a number of factors that may influence emissions in e-commerce. The majority of the reviewed literature shows that greenhouse gas emissions are directly related to the increased consumption of fuels and energy demand [44,45,46,47].
Furthermore, the distance traveled, traffic congestion (traffic density), and traffic distribution over time (traffic restriction) have been identified as key factors related to emissions in urban deliveries for e-commerce [16,48]. Rudi et al. [47] identified the distance, load factor, and trans-shipment schedule as crucial factors in terms of their contribution to vehicle-related emissions. Many studies have investigated the organization of traffic over time as an influencing factor. For example, the impact of the toll system in the Spanish highway network on fuel consumption and related emissions was examined by Perez-Martinez et al. [49]. Moufad and Jawab [50] proposed a new methodology to calculate the emissions from urban deliveries and include the following important factors: Speed according to the capacity of the road network and information on geography, topography, and climate. Zamboni et al. [51] analyzed various speed patterns in cities and on motorways to link the dynamics of speed changes in various traffic density conditions in terms of overall fuel consumption. Some researchers have pointed out that the carbon footprint is directly related to traffic density [10,52]. Gao et al. [53] identified that fuel economy and CO2 emissions are significantly dependent on the road grade, coolant temperature, vehicle velocity, and mass. They also identified driver-controllable factors, such as high vehicle velocity and low road grade (through route choice), which are favorable to achieving low fuel consumption and emissions.
Some studies focus further on cargo characteristics and their relationship with fuel consumption and emissions. Luo et al. [42] have identified the dependencies between the weight (and the volume) of the cargo and energy consumption and the increase in CO2 emissions. Volume and density (for example, low-density goods) must also be considered as they influence the average load capacity [54,55]. Shorter delivery times for logistics companies result in more frequent and carbon-intensive delivery trips with a lower utilization rate of vehicle load capacity [7]. The low vehicle utilization rate in e-commerce is a common problem, and it results in an increase in the number of trips and the number of vehicles needed [56].
Studies on fuel characteristics focused mainly on the type of fuel and its quality. Siragusa et al. [48] indicated the level of fuel consumption and the fuel type as the main factors that influence the environmental assessment of the distribution in e-commerce. Venkataram and Rao [57] analyzed biofuel combustion and noted that fuel quality has a primary impact on greenhouse emissions within supply chains. The change from combustion engines to electric or hybrid engines and the reduction of fossil fuel consumption in terms of reducing the carbon footprint has been recently investigated by many researchers [17,19,58,59,60].
Studies on fleet characteristics and their relationship to CO2 emissions are underrepresented in the literature. In business practice, the fleet used in urban deliveries for e-commerce purposes is often heterogeneous [61,62]. E-commerce companies use various logistics providers; therefore, the fleet structure differs between them [63,64]. In their current work, Grythe et al. [65] identified factors that allow for the parametrization of a heterogeneous fleet, such as vehicle type, vehicle size, technology type (Euro standard), and fuel type. Wang et al. [66] highlighted vehicle weight as one of the crucial factors.
The summary of the findings of the literature review on the crucial factors that influence vehicle CO2 emissions in the distribution of e-commerce is presented in Table 1. Furthermore, we indicate in Table 1 the novelty of this study compared to the existing literature.
The relevant literature (Table 1) does not present a general consensus on the classification of the relevant factors in terms of the environmental impact of transportation activities related to B2C e-commerce.
Most studies take into account homogeneous fleets and focus on fuel- and road-related factors. There is a research gap on heterogeneous fleet parameters that, in practice, influence direct CO2 emissions from e-commerce deliveries. The novelty of this study results from the proposal of a new actionable approach to calculate CO2 emissions from heterogeneous fleets in e-commerce deliveries. The next section presents the research methods that are used in this study to identify the parameters of the structure of a heterogonous fleet, such as gross weight, mass, fuel type, engine size, fuel consumption (liters/100 km), and the age of a vehicle.

3. Materials and Methods

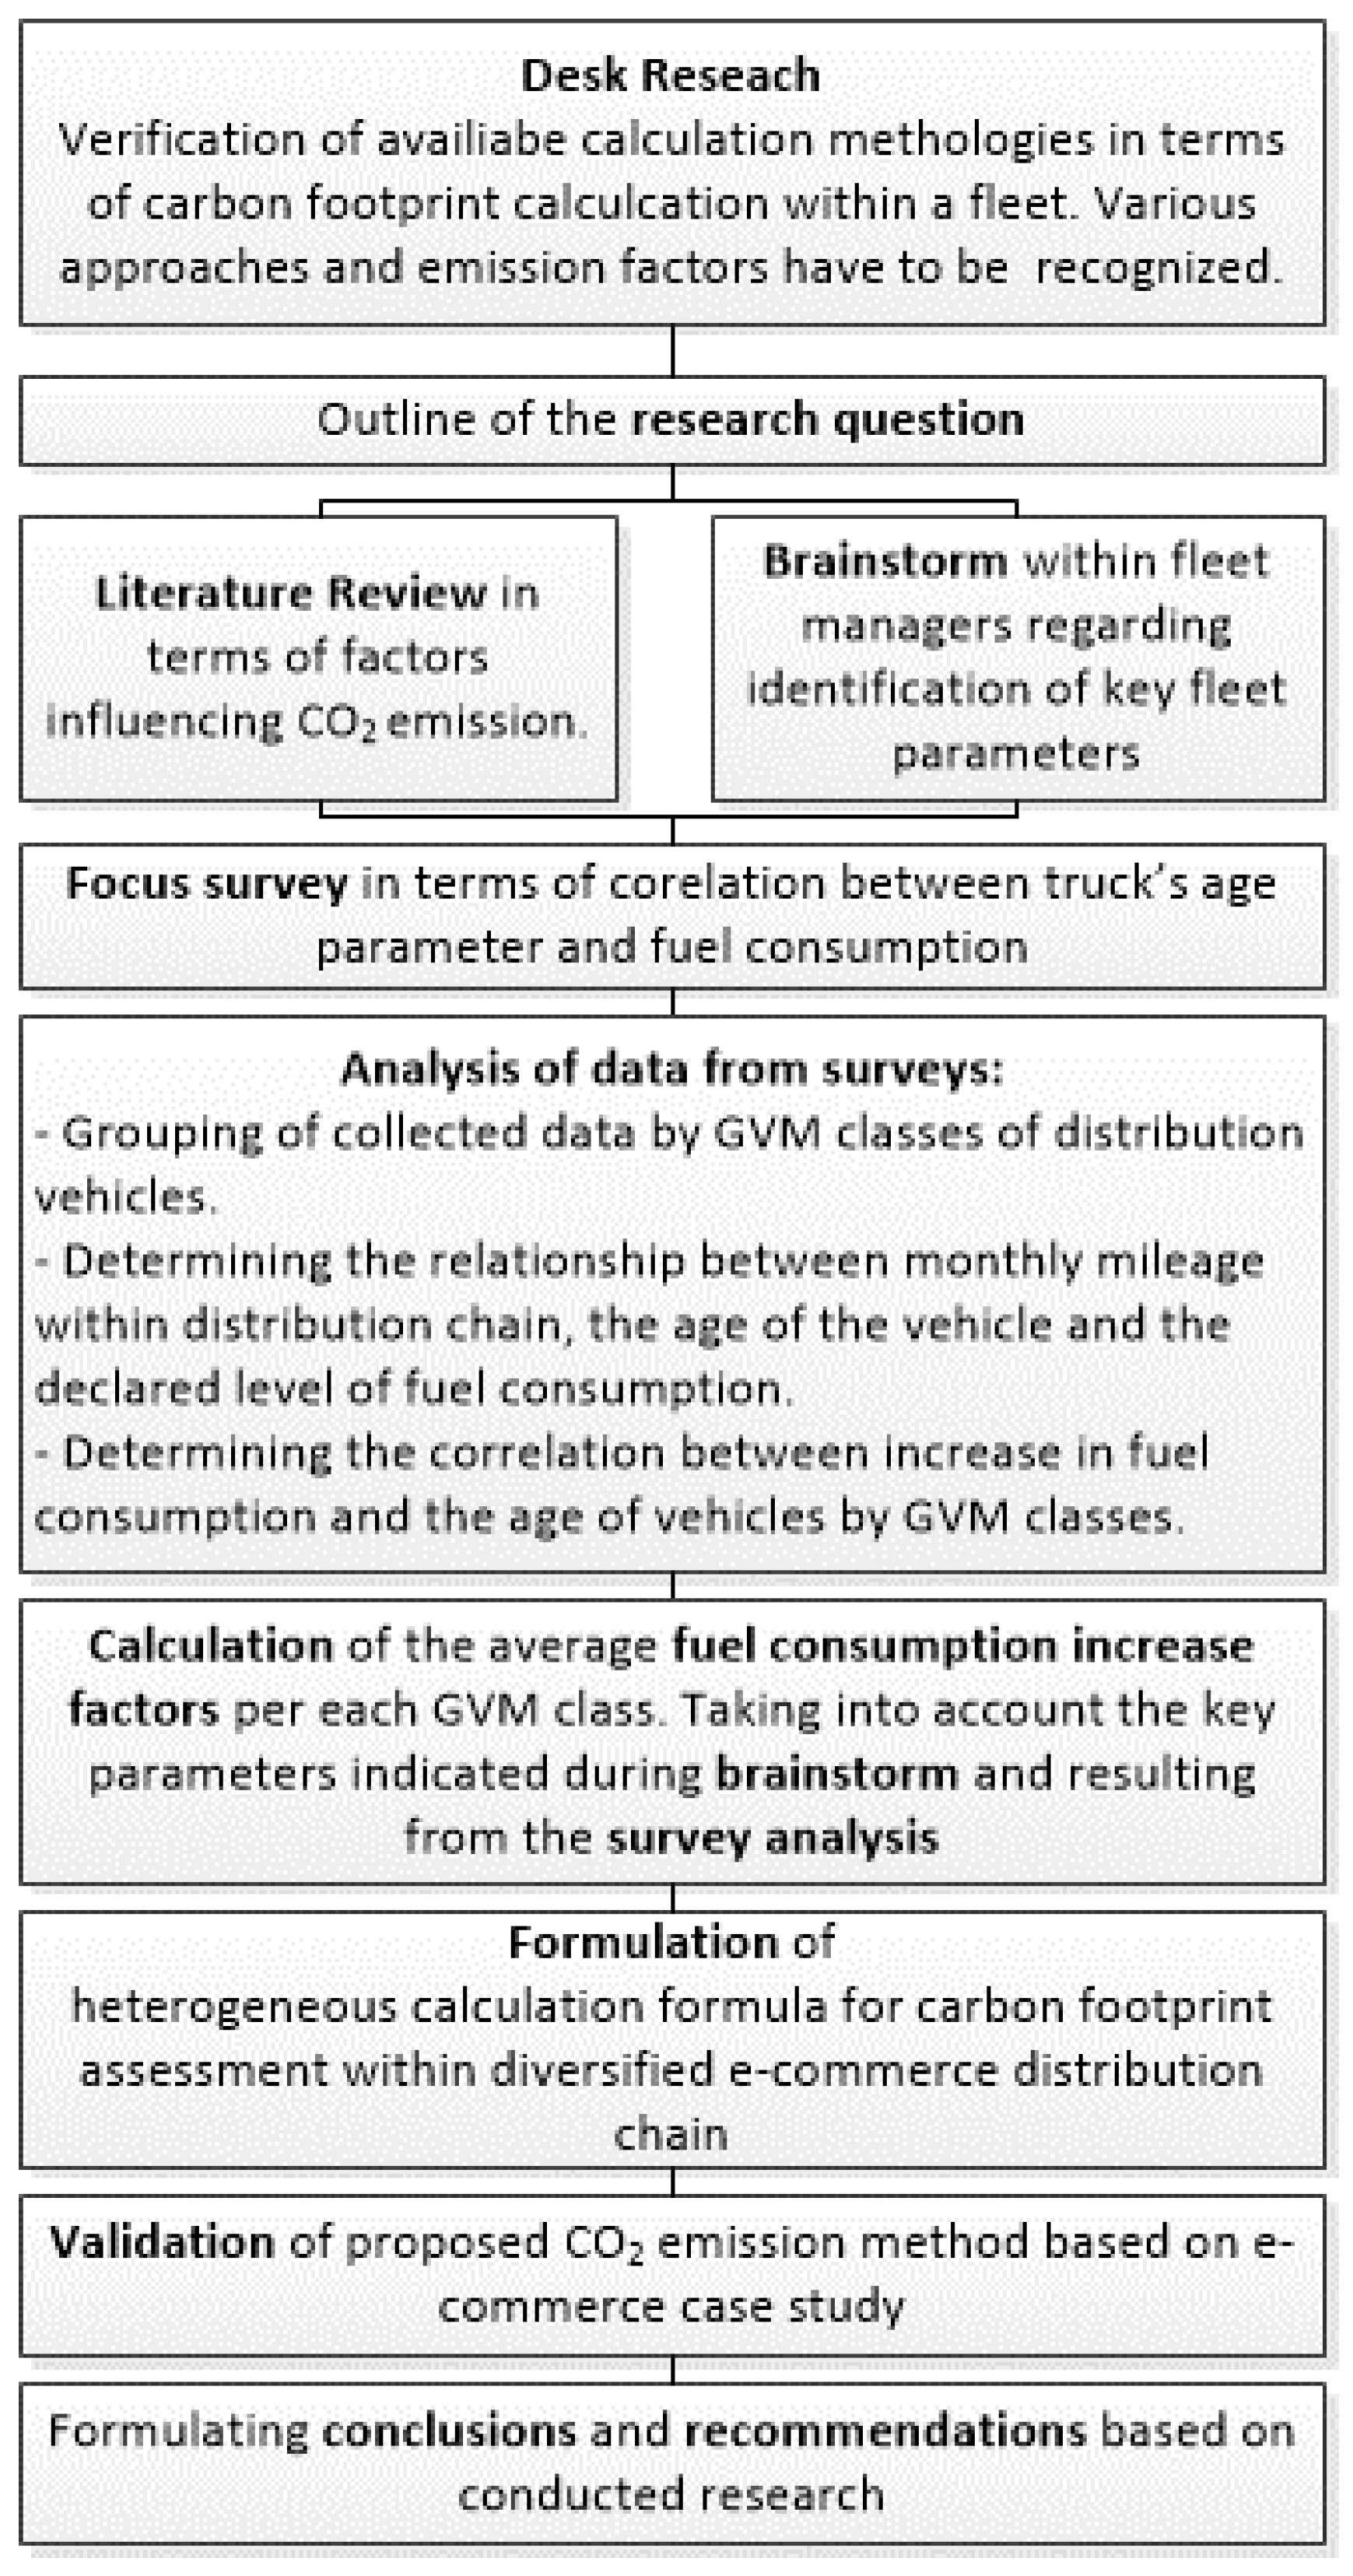
3.1. Research Approach

Our research methodology combines a literature review, a survey among transport managers, and a case study on e-commerce delivery. The research approach is presented in Figure 1.

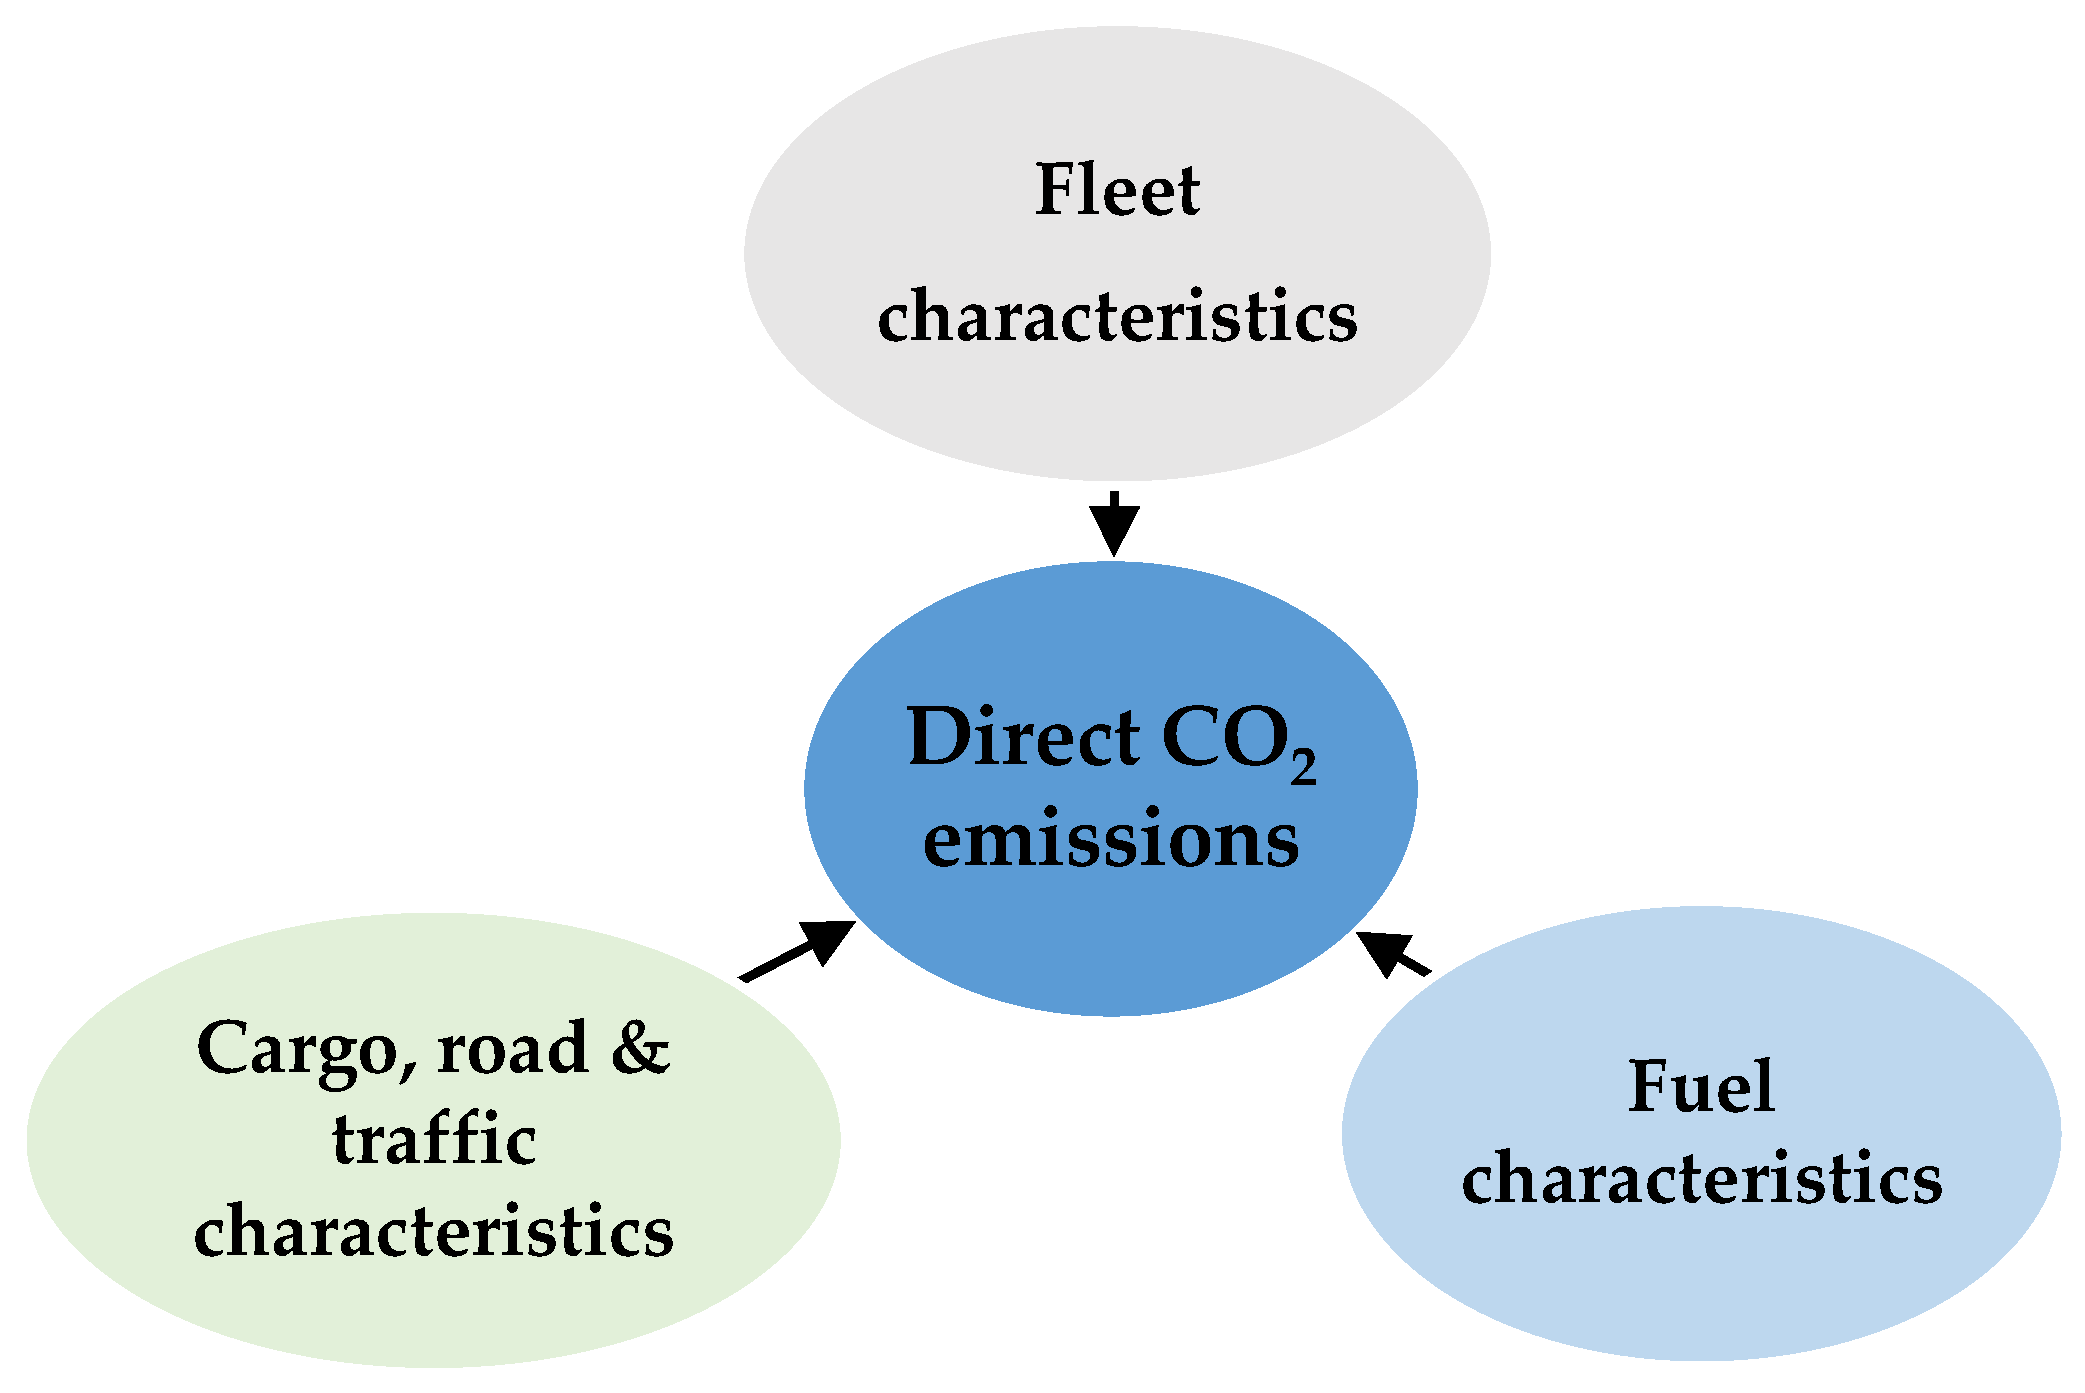
3.2. Classification of Factors

Based on the literature review (see Section 2.3), we classify the factors in Table 1 into three categories and present them in Figure 2. The literature review was not conclusive on the characteristics of the fleet. For that reason, we determined the characteristics during a brainstorming session with five fleet managers (with a minimum of 5 years of professional experience in distribution for e-commerce purposes) from two major logistics companies in Poland, which are responsible for fleet management in urban deliveries for e-commerce purposes. During the brainstorming session, they identified the parameters that are relevant to describe the fleet, as follows:
  • Vehicle type.
  • GVM (gross vehicle mass).
  • Engine type.
  • Truck body type.
  • Tires’ type and size.
  • Age of vehicle.
  • Vehicle wear and tear in the vehicle.
The information obtained was investigated in the focus-group survey.

3.3. Survey

To measure the carbon footprint in an actionable way, it is necessary to obtain reliable data on the characteristics of the fleet. A focused survey has been conducted among transport managers (TM) responsible for fleet management for e-commerce distribution. The scope of the survey covered only trucks that were dedicated to daily domestic deliveries (Polish) of e-commerce parcels.
Data were collected regarding the daily distance travelled and the fleet characteristics. The experts had to provide a complete set of information on the truck type, GVM, engine type, vehicle age, and average fuel consumption (liters per 100 km).
The survey was carried out among carriers with various subcontractors with different means of transport (a heterogeneous fleet). The scope of the survey included experts (transport managers) from 2 distribution companies and their 13 subcontracted carriers.
The experts included the Director of the Transportation Department, Director of Logistics and Technologies, Logistics Director, Supply Chain Development Director, and Managing Director. The responsibilities of the individual experts are presented in Table 2.
The fleet under consideration included trucks and vans used for urban distribution in e-commerce. In total, 22 types of vehicles were analyzed. In consequence, 56 datasets were collected across nine different vehicle brands. Additionally, data on fuel consumption were recorded for each truck. The data were stored in a database supported by the MS Excel tool. All records containing the manufacturer name, brand, and truck type name were anonymized. The data collected as a result of the surveys contained detailed parameters related to the average monthly mileage of the vehicle, its age, and the average fuel consumption. The surveys also collected data on the brand and model of the vehicle, as well as its weight (GVM). However, due to the purpose of processing the collected data, this information was anonymized. Data were collected in a tabular form, which made it easier to verify the interdependencies between the various parameters of the vehicles in the next part of this study.
The data were also used for the assessment of the total fuel consumption and direct CO2 emissions from distribution activities.

4. Results

4.1. Notations Used in the Calculations

The notation used in the calculations is presented in Table 3. The assumptions of this study are the following:
  • The structure of a fleet is given and constant in the analyzed period of time.
  • The yearly average increase in the fuel consumption factor is the same within the homogeneous group of vehicles.
  • The structure of a fleet can be described by the parameters given (as derived from the literature review in Table 1).

4.2. Calculation

The feedback from the focus group was that the age of the vehicle is an important factor with respect to fuel consumption and related emissions. In our opinion, this topic has not been sufficiently explored in the literature. For that reason, we focused on it in our empirical research. The average fuel consumption of vehicles within specific GVM groups was determined on surveys among carriers. The respondents had to provide information on the vehicle type, engine capacity, vehicle age, GVM, fuel type, and average fuel consumption in liters per 100 km. In the case of data gaps, the fuel consumption level was calculated based on the dynamics of changes in the consumption level over time (age of the vehicle). Statistical estimation was conducted using the MS Excel tool regarding the average fuel consumption. In terms of the statistical methodology, evaluation limits were outlined by Dempster et al. [67]. Based on the collected data and the calculations performed, it was possible to create a statistical model that represents the average fuel consumption with respect to the age factor for each analyzed GVM range. Due to the quality of the data obtained in the surveys and the level of quantitative representation of the vehicle groups, the results were finally calculated for the GVM categories of 3500 kg (3.5 t), 12,000 kg (12 t), and 18,000 kg (18 t). The calculations were carried out on the basis of real data from 56 cases in various categories of GVM. The data from the surveys were compared with the average fuel consumption, which was declared by the manufacturers of 31 new vehicles (suitable for e-commerce deliveries in urban areas) currently (Q4 2021) available on the market. The results are presented in Table 4.
Due to differences in the dynamics of fuel consumption in each GVM class, the average consumption level was presented separately for each group.
The average annual increase in fuel consumption between vehicles used in the daily distribution was calculated according to the logic presented within Formula (1) below.
I ¯ a = i = 1 k I i k
I ¯ a —Average yearly fuel consumption increase indicator per each GVM truck class. i = 1 k I i —Total fuel consumption. I i —Fuel consumption of each truck. k—Number of trucks.
As a result of the calculation, the yearly average increase in fuel consumption is presented in Figure 3 and Table 5.
In order to validate the structure of the fleet from the empirical studies, we compared the results with manufacturers’ data regarding the fuel consumption of new trucks/vans. Fuel consumption data sourced from truck/van manufacturers were gathered and sorted by GVM class. Actual data sourced among various dealers and brands are presented in Appendix A. According to the information collected from manufacturers, the average fuel consumption of a new vehicle for each GVM class was calculated. The results are presented in Figure 4.
To verify the correctness of survey-based results, we compared them with the market data in Table 6. The results obtained in the survey were slightly higher than those provided by the manufacturers. Truck manufacturers often provide fuel consumption data that correspond to stable weather conditions and ideal eco-driving style, etc. Due to this approach, published data tend to be lower than the actual outcome for a used, partially loaded truck. The data provided in our survey (by transport managers) represent fuel consumption in a more diverse manner based on daily e-commerce deliveries.
Analyzing the collected data, it can be observed that the highest increase in fuel consumption appears for vehicles with a GVM of 3500 kg. According to research, the annual increase in fuel consumption for this GVM class is 1.31%. At the same time, heavier vehicles are characterized by a slower yearly growth rate of this factor. In Appendix B, we present the comparison of the fleet of the empirical study (in terms of the engine capacity and GVM) with the structure offered by manufacturers in Q4 2021. It allows us to assume that the fleet structure in our study reflects the standard market conditions (structure of the current new truck models) in terms of engine size, GVM, and fuel consumption. Thus, the calculated age–fuel consumption factor can be used for the calculation of the carbon footprint.

4.3. New Approach to Calculate Direct Emissions for E-Commerce Deliveries

The proposed approach allows for calculating the emissions in a simplified and actionable way for a group of vehicles of the same characteristics (GVM and age), and then for the whole heterogeneous fleet. The calculations are based on the essential parameter (as was indicated in the literature review), namely the distance travelled for each vehicle class (with the same GVM and age). The calculation of the distance has to be performed according to the logic presented in Formula (2) below.
R α = i = 1 k R i
According to the results of the survey and the obtained results, a comprehensive formula has been created to evaluate direct CO2 emissions from e-commerce deliveries. Formula (3) is proposed for calculating the total equivalent GHG emissions of a group of trucks with the same age and GVM (homogeneous). Therefore, regarding different GVM classes and vehicle ages, CF can be assessed using the related average yearly increase in fuel consumption. The total final emissions are expressed as kgCO2e equivalent. Formula (3) is defined as:
H o m o g e n i u s   F l e e t     E m i s s i o n s   [ kg   CO 2 e ] = R α   ( F C ¯ α 100 ) ( ( I ¯ a   V ) + 1 ) F c f
To provide a solution for the estimation of direct emissions of the heterogeneous fleet of vehicles used in a company, an extension of the previous formula is prepared. Formula (4) proposed below allows us to determine the level of the carbon footprint for the entire heterogeneous fleet with different GVMs and ages of the vehicles.
H e t e r o g e n i o u s   F l e e t   E m i s s i o n   [ kg   CO 2 e ] = a = 1 n [ R α   ( F C ¯ α 100 ) ( ( I ¯ a   V ) + 1 ) F c f ]

4.4. Verification—Case Study

To verify the correctness and usefulness of the proposed approach, the calculation of the carbon emissions of e-commerce deliveries is carried out. We apply the case study approach, which allows us to explore “what”, “how”, and “why” the analyzed phenomenon works [68]. Moreover, a case study allows for an early-stage explanatory investigation, even if the variables are not fully understood [69]. The case study covers a network of e-commerce deliveries with a heterogeneous fleet (different GVM classes and different ages of vehicles). The analyzed distribution network includes the Distribution Centre (DC) and local Cross Docks (CDs). It is assumed that the network is optimized, as designed based on the center of gravity method [70].
First, transport processes have been mapped and key emission points have been identified. For simulation purposes, a simplified model of vehicles with a GVM of 18 tons has been proposed for daily deliveries from the Distribution Centre to the Cross Docks. On their way back to DC, linehaul trucks carry rejected goods or returns from local CDs. Due to the presence of Reverse Logistics (RL) elements within this SC, the calculated distance has to include roundtrips for the linehauls. The final customers can send returns back to the producer using carrier services or bring them back directly to pick-up points that are visited by local van drivers on a daily basis. Last-mile distribution is carried out from the local Cross Docks with a GVM of only 3.5 tons. The vans (3.5t GVM) start daily trips from CDs and are left there for overnight parking; thus, no additional distance needs to be considered for them. A general and simplified view of the modelled distribution network is presented in Figure 5.
In order to conduct accurate calculations in the first step, an exact distance has been identified between the distribution center and the local cross-docks. In the created model, linehaul trucks operate only between DC and one specific cross dock, therefore, the travelled distance does not have to include any extra distance for co-loading or extra drop-off points. The average distance for a roundtrip is presented in Table 7.
The daily distance travelled by 3.5 t vehicles is more variable due to differences in delivery schedules (depending on the location of the final customer). Thus, an average daily distance was calculated. The results are presented in Table 8.
The structure of the heterogeneous fleet in terms of vehicle type and age is presented in Table 9. In the proposed approach, not only are the number of vehicles grouped by type (Truck or van) and the gross vehicle mass (18,000 kg or 3500 kg) important but also the age of the vehicle in use. Therefore, the heterogeneous fleet presented in Table 9 contains all the key parameters to estimate direct CO2 emissions of e-commerce distribution.
The number of daily departures from the specific cross dock and the distribution center to local cross docks in terms of linehaul routes is presented in Table 10.
All the above parameters have been taken into account, as shown in the proposed calculation Formula (1). To ensure reliable results, an up-to-date conversion factor of the dataset by UK DEFRA was used for calculations. Calculations were performed separately for each GVM class. The results are presented in Table 11.
The results show the difference between the GHG emission of the linehauls and smaller van trucks, which are used for the last-mile deliveries (final delivery leg). The dependencies between the age of the vehicle and overall kgCO2e are noticeable. The results are comparable to the GHG calculation within an actual fleet. The calculation confirms that the age of the vehicle influences the overall level of greenhouse gases within the supply chain. The calculation allows for calculating an average CO2 emission per kilometer. The results are presented in Table 12 for the final delivery legs in the e-commerce distribution.

5. Discussion

Studies on CO2 emissions in a supply chain focus mainly on manufacturing [71,72] and sourcing activities [73]. Empirical studies on emissions related to distribution in commerce deliveries are very limited [18,34,56].
Our previous studies [74] have shown that the reported CO2 emissions values depend on the method used for the calculation. Methods for measuring the carbon footprint do not fully reflect real-life needs. Theoretical studies focus mainly on the LCA-based approach, which is very complex and requires a significant amount of internal and external data. Most studies take into account the homogeneous fleet and focus on fuel- and road-related factors. In this study, we focused on empirical research in order to identify factors that are relevant for the calculation of direct CO2 emissions in e-commerce deliveries and are the responsibility of fleet managers. We focus on a heterogeneous fleet structure, as it is common in real life and is not sufficiently investigated in the literature. Real-life e-commerce deliveries are performed with a heterogeneous fleet, as transport activities are often outsourced to different partners in a supply chain [61,62]. In our approach, we determined factors based on previous studies on fleet characteristics and their relationship to CO2 emissions [65,66,68], which identified factors that allow for the parametrization of a heterogeneous fleet, such as vehicle type, vehicle size/weight, technology type (Euro standard), and fuel type. Through an exploratory analysis, we additionally identified the age of a vehicle as a factor that influences fuel consumption and related CO2 emissions. In this study, we determined the answers to two research questions. As a result of the literature review and a survey with transportation management, we obtained additional information on fuel consumption and its link to the characteristics of the fleet. Through numerical experiments, we identified that the age of a vehicle results in increased fuel consumption of 1.31% year-to-year for vans and 1.01% year-to-year for 18-t trucks. For that reason, we proposed a novel formula to calculate the direct CO2 emissions from heterogeneous fleets in e-commerce deliveries, which takes into consideration the age-related fuel consumption factor and the structure of a fleet.
The results have theoretical and practical implications. The theoretical contribution is a novel actionable approach for the calculation of the direct CO2 emissions from a heterogeneous fleet in e-commerce deliveries. Previous studies highlight the role of logistics service providers in the development of a sustainable supply chain and the need for further investigation in this area [75,76]. Most existing studies refer to the fuel efficiency of vehicles, e.g., [77], in relation to different environmental conditions. In this article, we conducted an exploratory analysis (a focused survey) on the structure (GVM and vehicle age) as a factor influencing emissions levels, which extends the existing body of literature.
This work has managerial implications, as it highlights the role of the fleet structure in the calculation of CO2 emissions. The structure of the fleet is the responsibility of transport managers. They can benefit from the findings of this paper in short- and long-term managerial decision making. First, the proposed formula is actionable as it does not require conducting complex and time-consuming data collection. We based our CO2 emissions calculations on information available to fleet managers on a daily basis or can be easily extracted from the internal database of a company, such as the number of vehicles, ages of vehicles, GVM, distance travelled, and fuel consumption. The fleet manager can use the proposed approach to manage direct fleet emissions in the urban distribution network for e-commerce purposes. They can use the simplified formula for the simulation of the preferred fleet structure (how many trucks, how many vans, and the ages of vehicles) for a particular customer from the e-commerce sector or for a particular period of time, in order to meet the goal of CO2 reduction. Second, the decision can be used in the long term to support fleet renewal decisions in terms of the potential reduction of CO2 emissions.
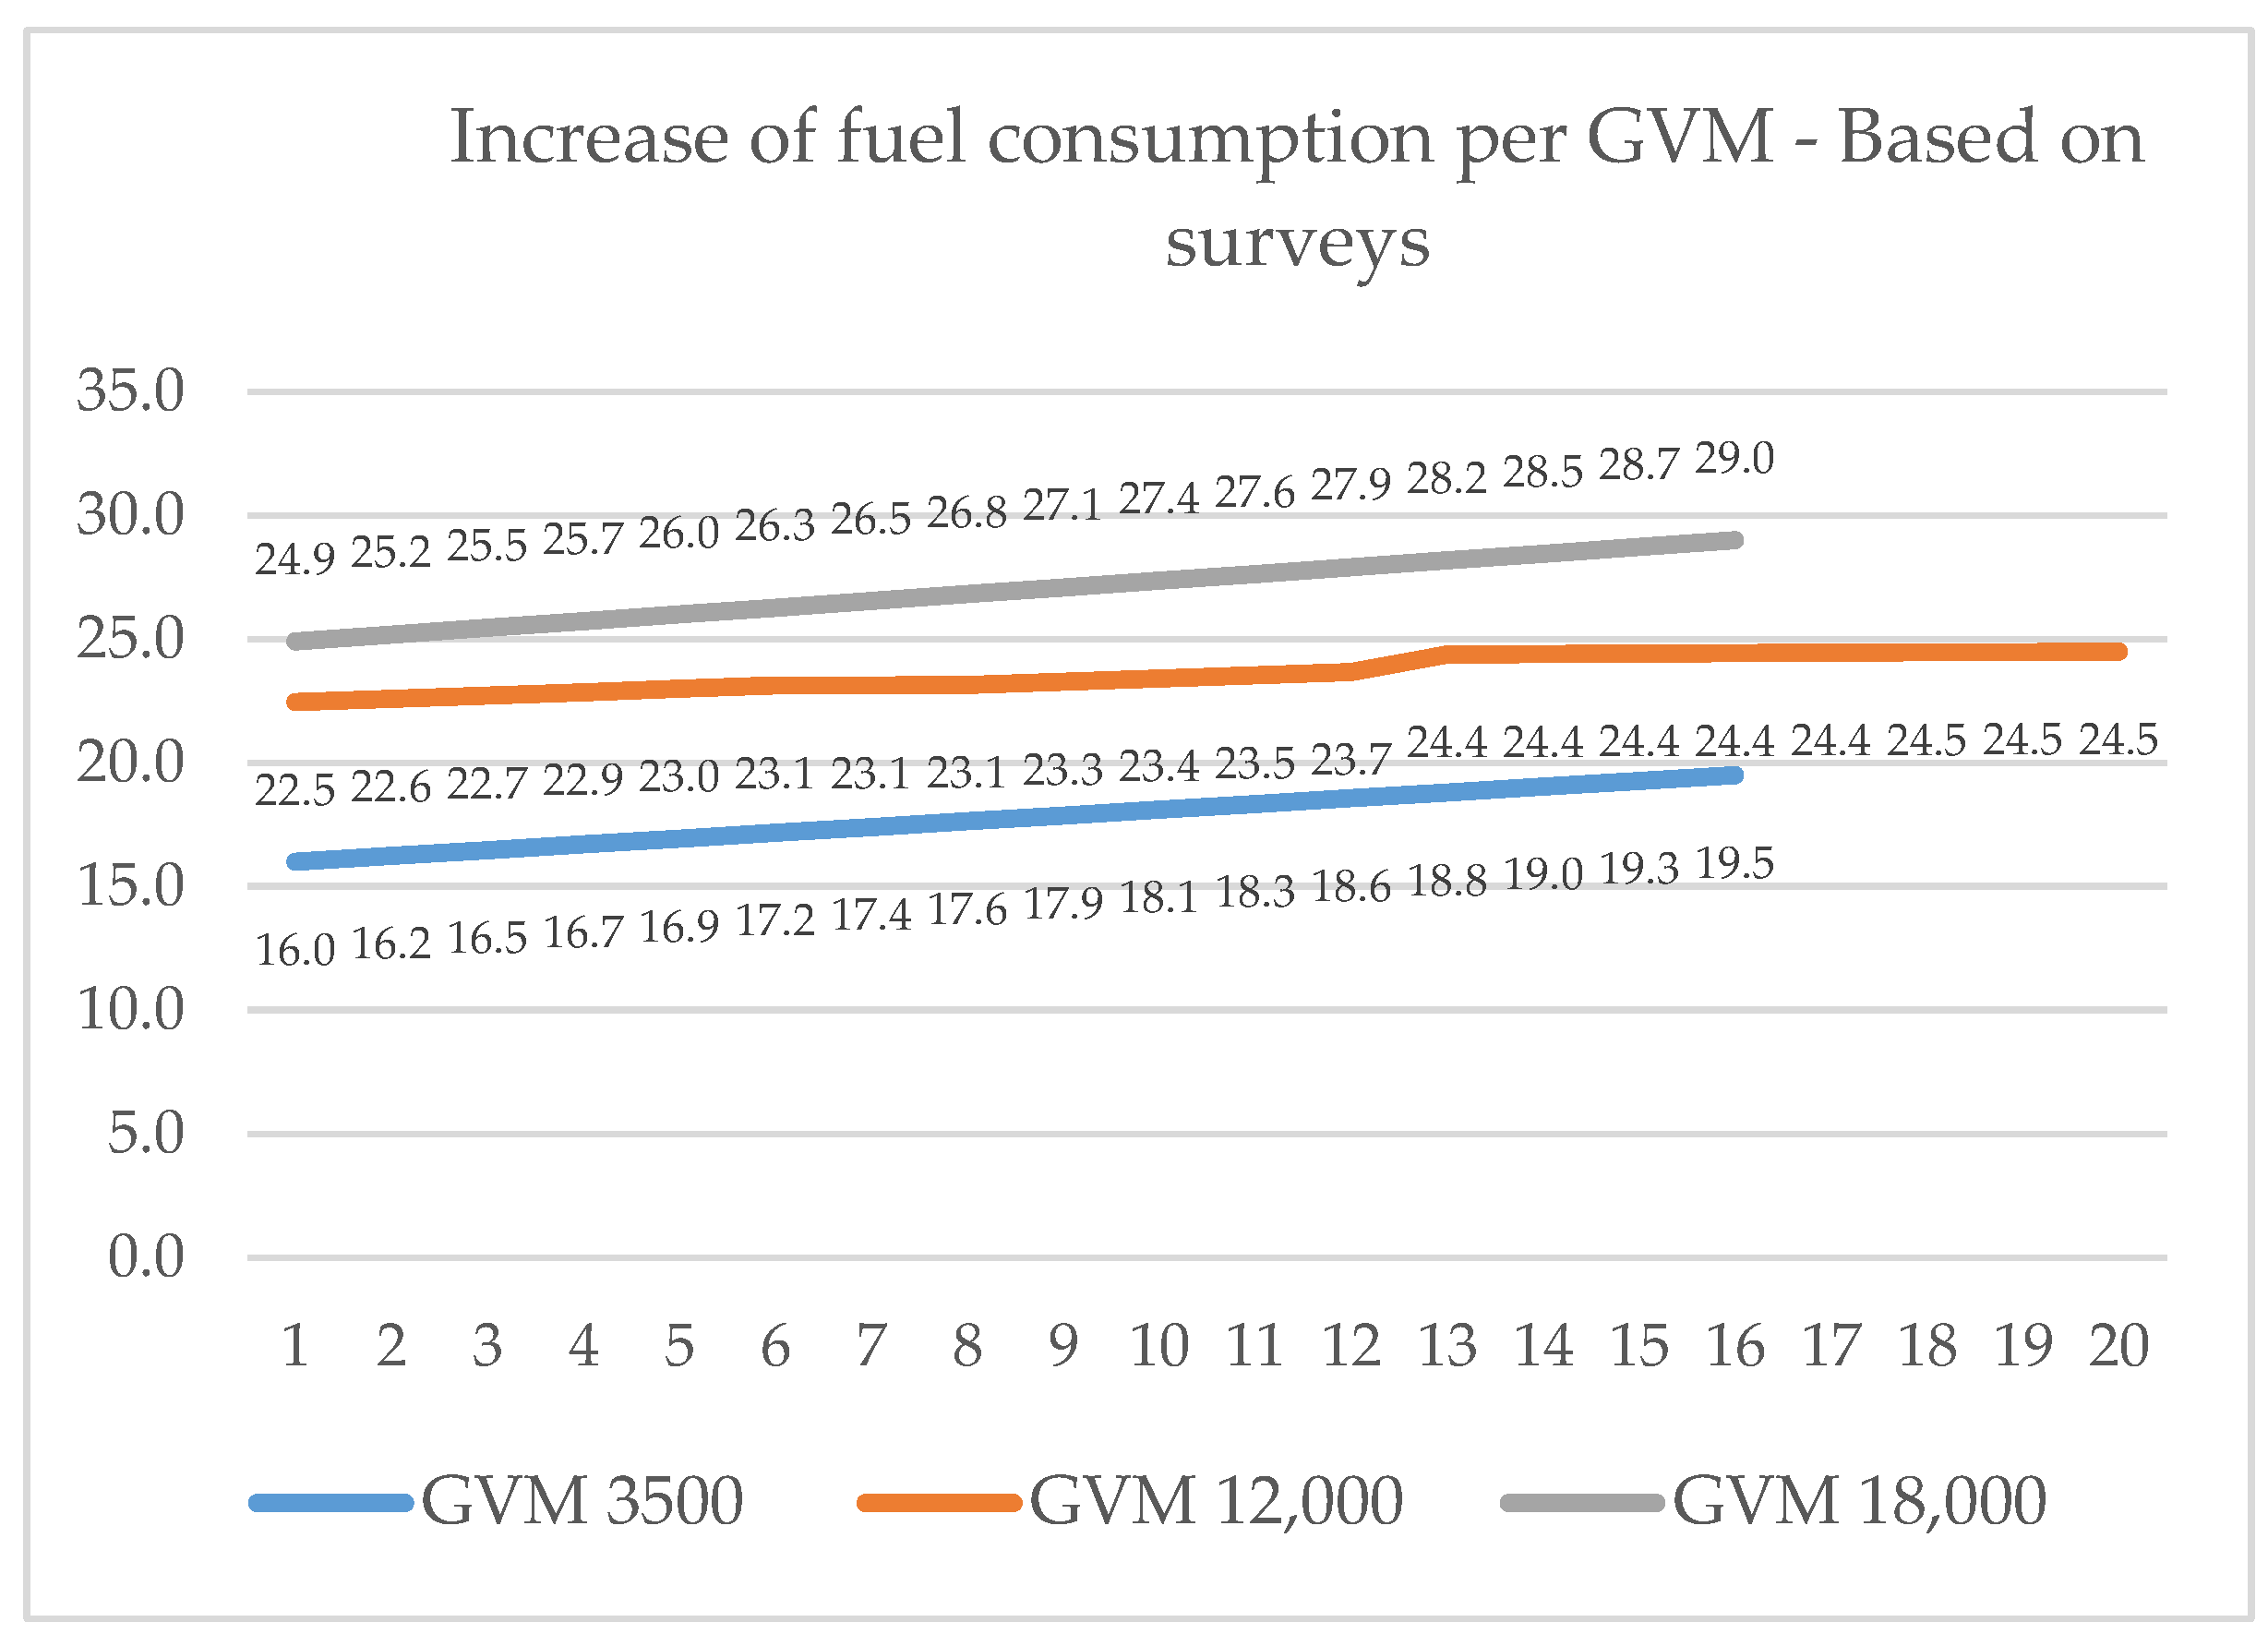
6. Conclusions

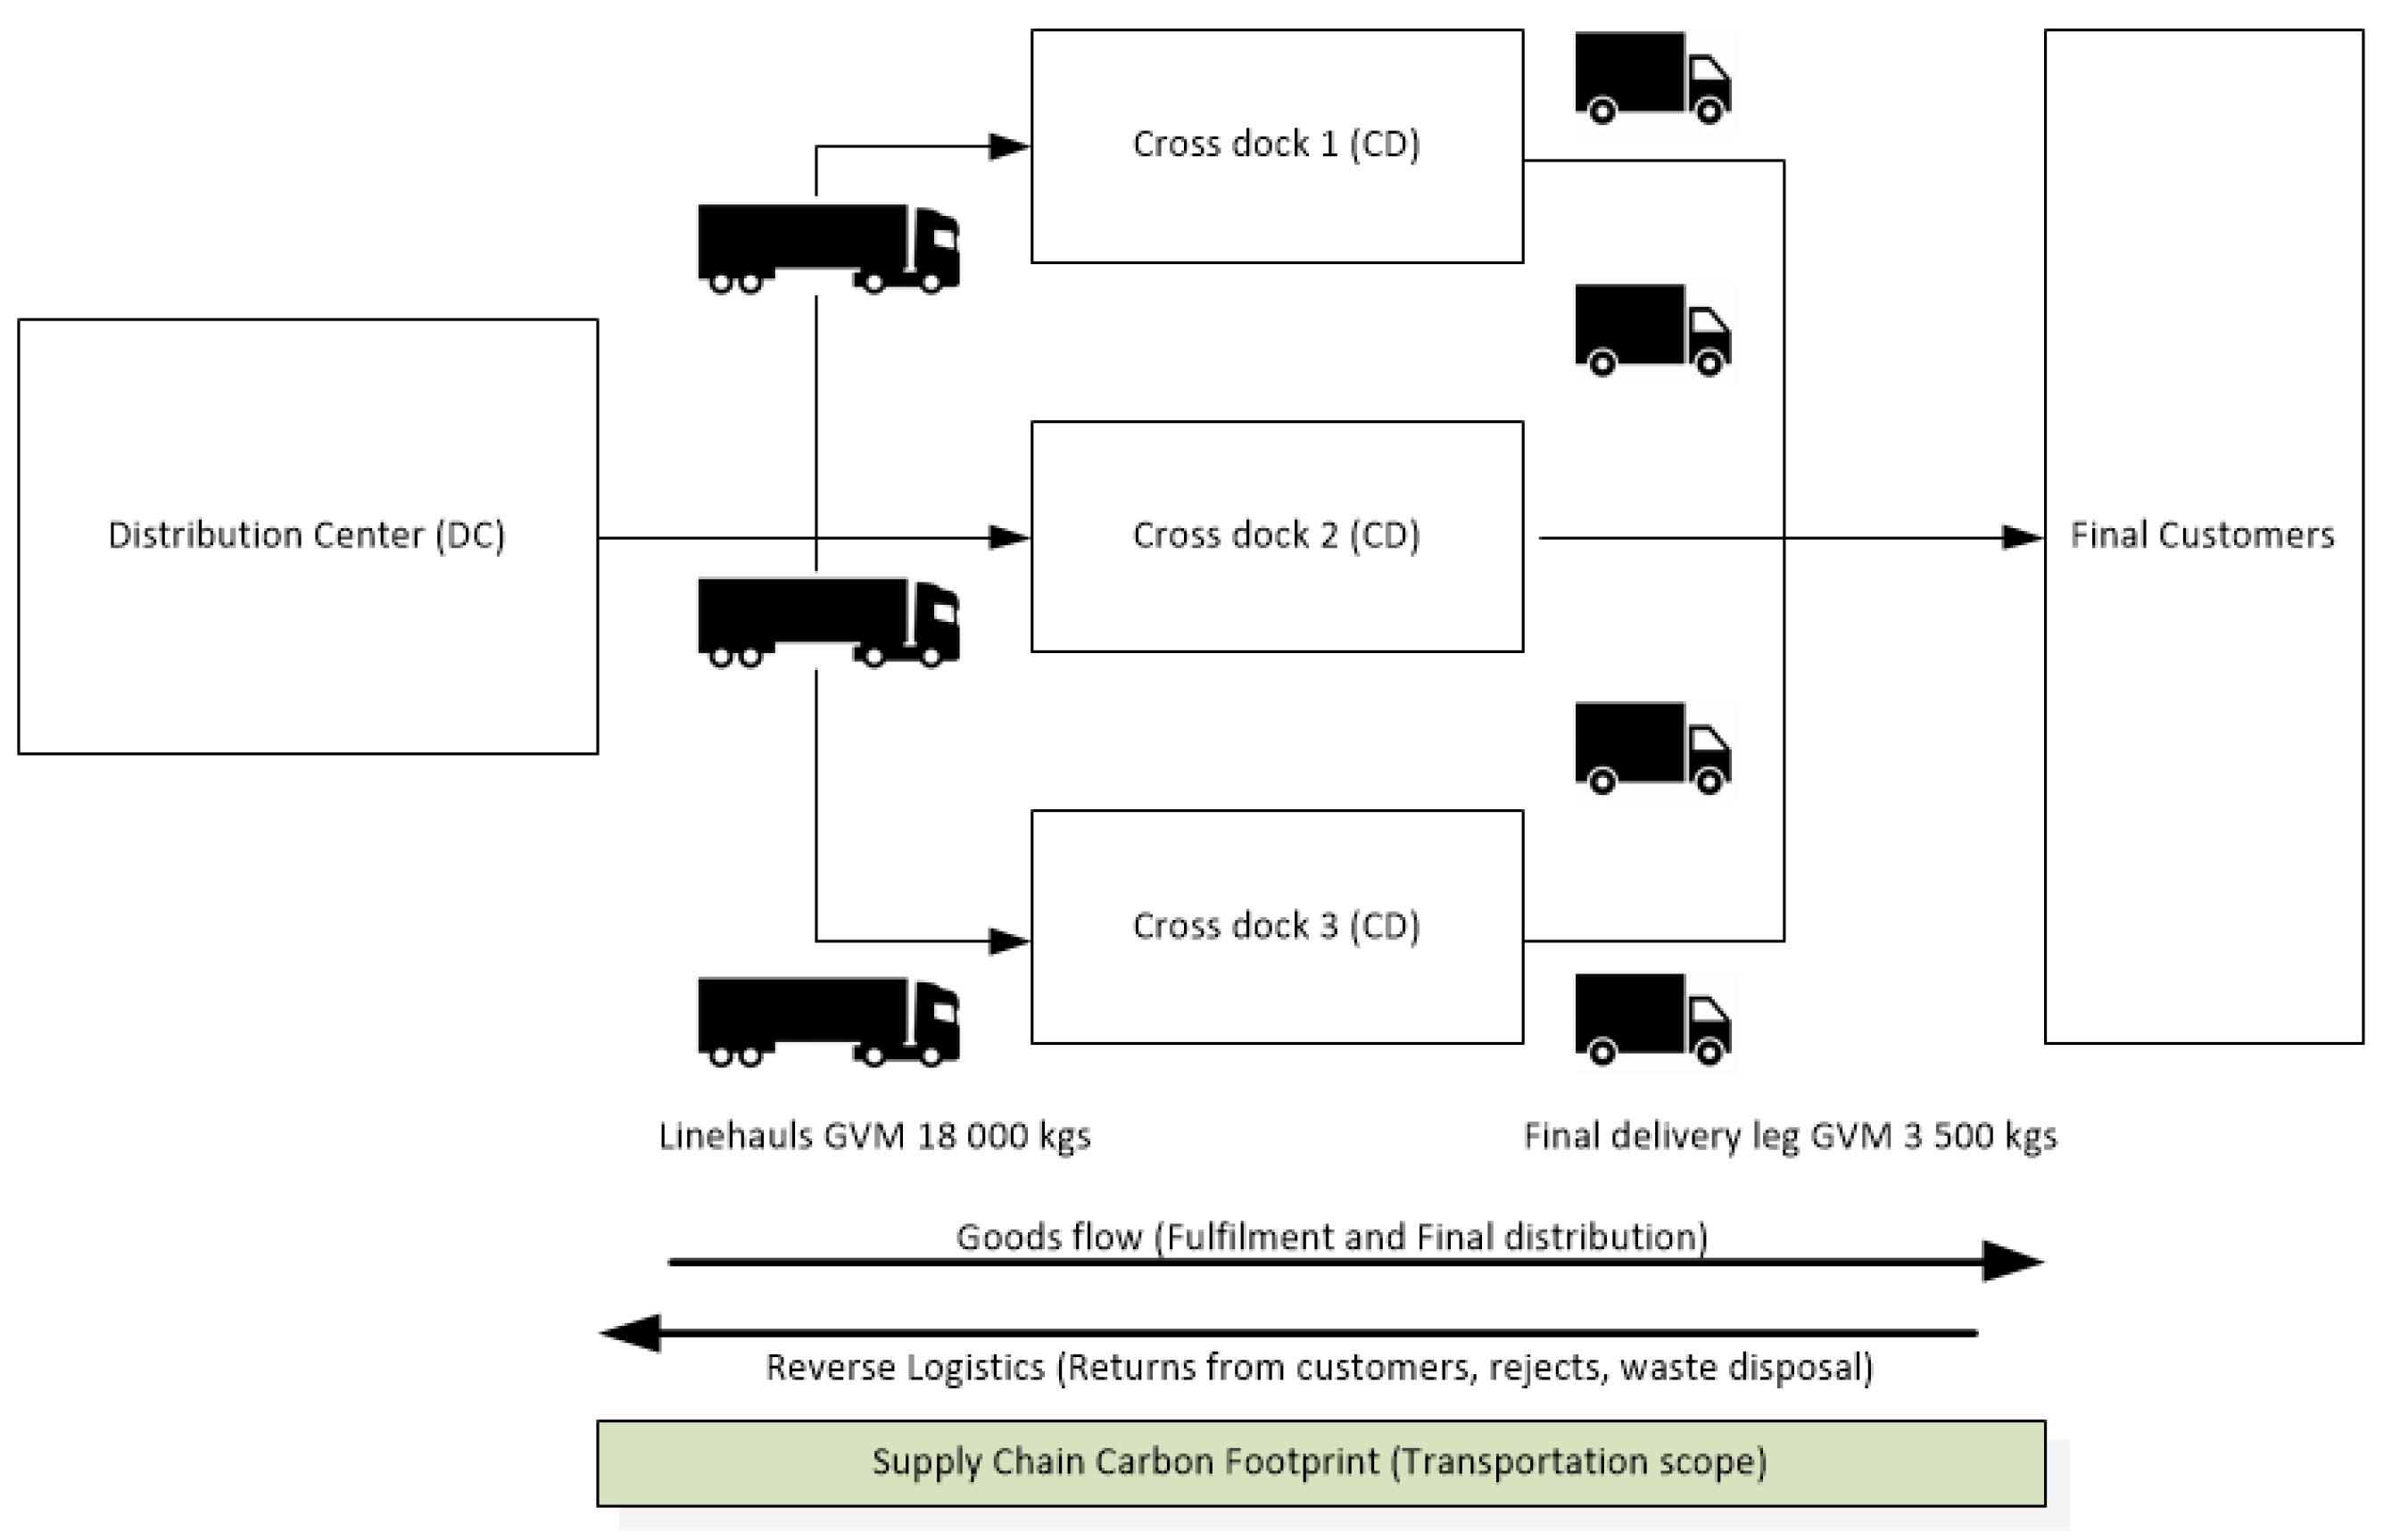
The purpose of this study is to provide a novel and actionable approach to the calculation of direct CO2 emissions from a heterogeneous fleet for the purpose of e-commerce deliveries in urban areas. The provided formula allows for the simplified calculation of CO2 without the need for performing resource-intensive LCA calculations. We investigated the answer to RQ1 through the literature review and empirical studies (focused survey) among freight managers, who specialized in e-commerce deliveries. We categorized the factors that influence direct CO2 emissions in urban deliveries for urban purposes into three categories: (1) Cargo, road, and traffic characteristics; (2) fuel characteristics; and (3) fleet characteristics. After the brainstorming session with fleet managers, we focused on the GVM, age of a vehicle, number of vehicles, and fuel consumption. We accounted for the distance traveled in the linehauls and last-mile deliveries. Using the data from the survey, we identified the increase in fuel consumption with age. Due to the research conducted among carriers, it was possible to determine the average annual increase in fuel consumption based on the age of a vehicle and vehicle GVM.
To answer RQ2, a calculation formula was proposed that is useful to determine direct CO2 emissions for a heterogeneous fleet that delivers goods in e-commerce. We performed numerical examples to test the proposed formula using real-life data and DEKRA emission factors.
The novelty of this research results from the new and easy-to-apply approach to calculate CO2 emissions from heterogeneous fleets in e-commerce deliveries, which takes into account the GVM, type of vehicle, and vehicle age. Therefore, the proposed method can be used to estimate the levels of greenhouse gas in the case of online sales and related deliveries (distribution). The fleet used for e-commerce deliveries is often older than that used for long-haul transportation [78]. Furthermore, the COVID-19 pandemic and current economic crisis can also result in a slower renewal of vehicle fleets, with older, more energy-consuming and polluting vehicles being used for longer periods (before replacement by newer models) [79]. Thus, this paper contributes to theory and practice, as it allows one to parametrize the influence of vehicle age on the increase in fuel consumption and related CO2 emissions.
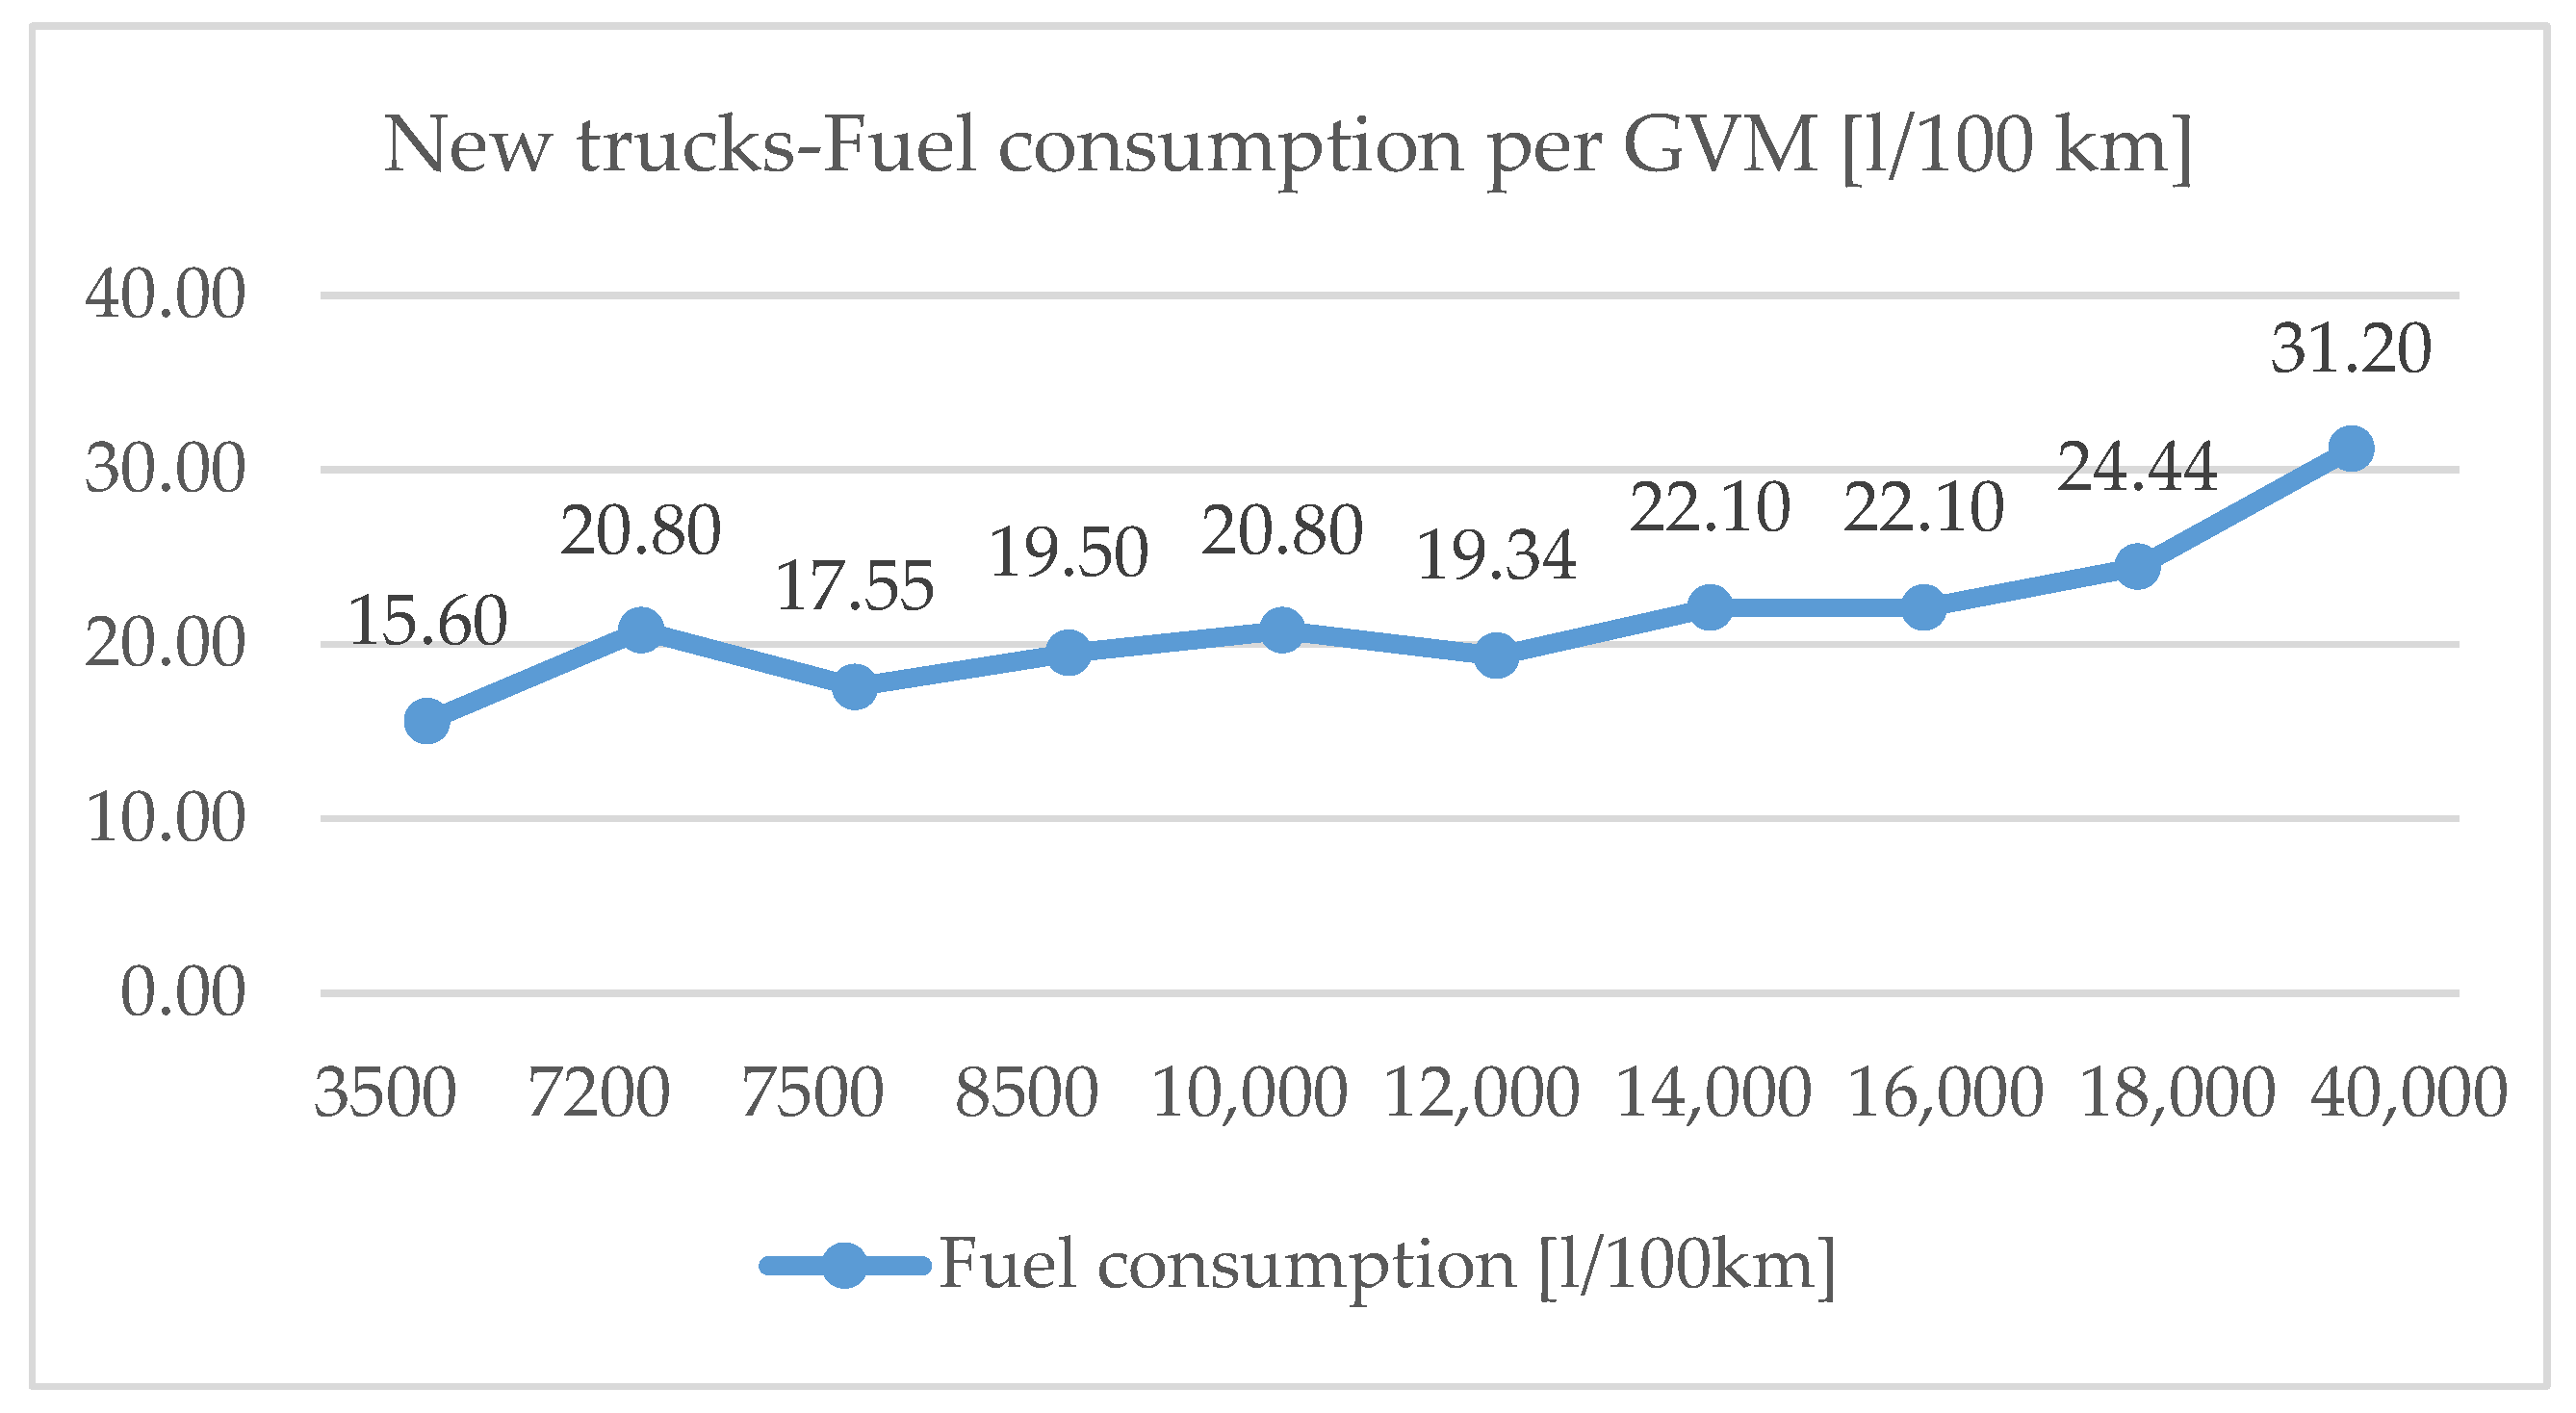
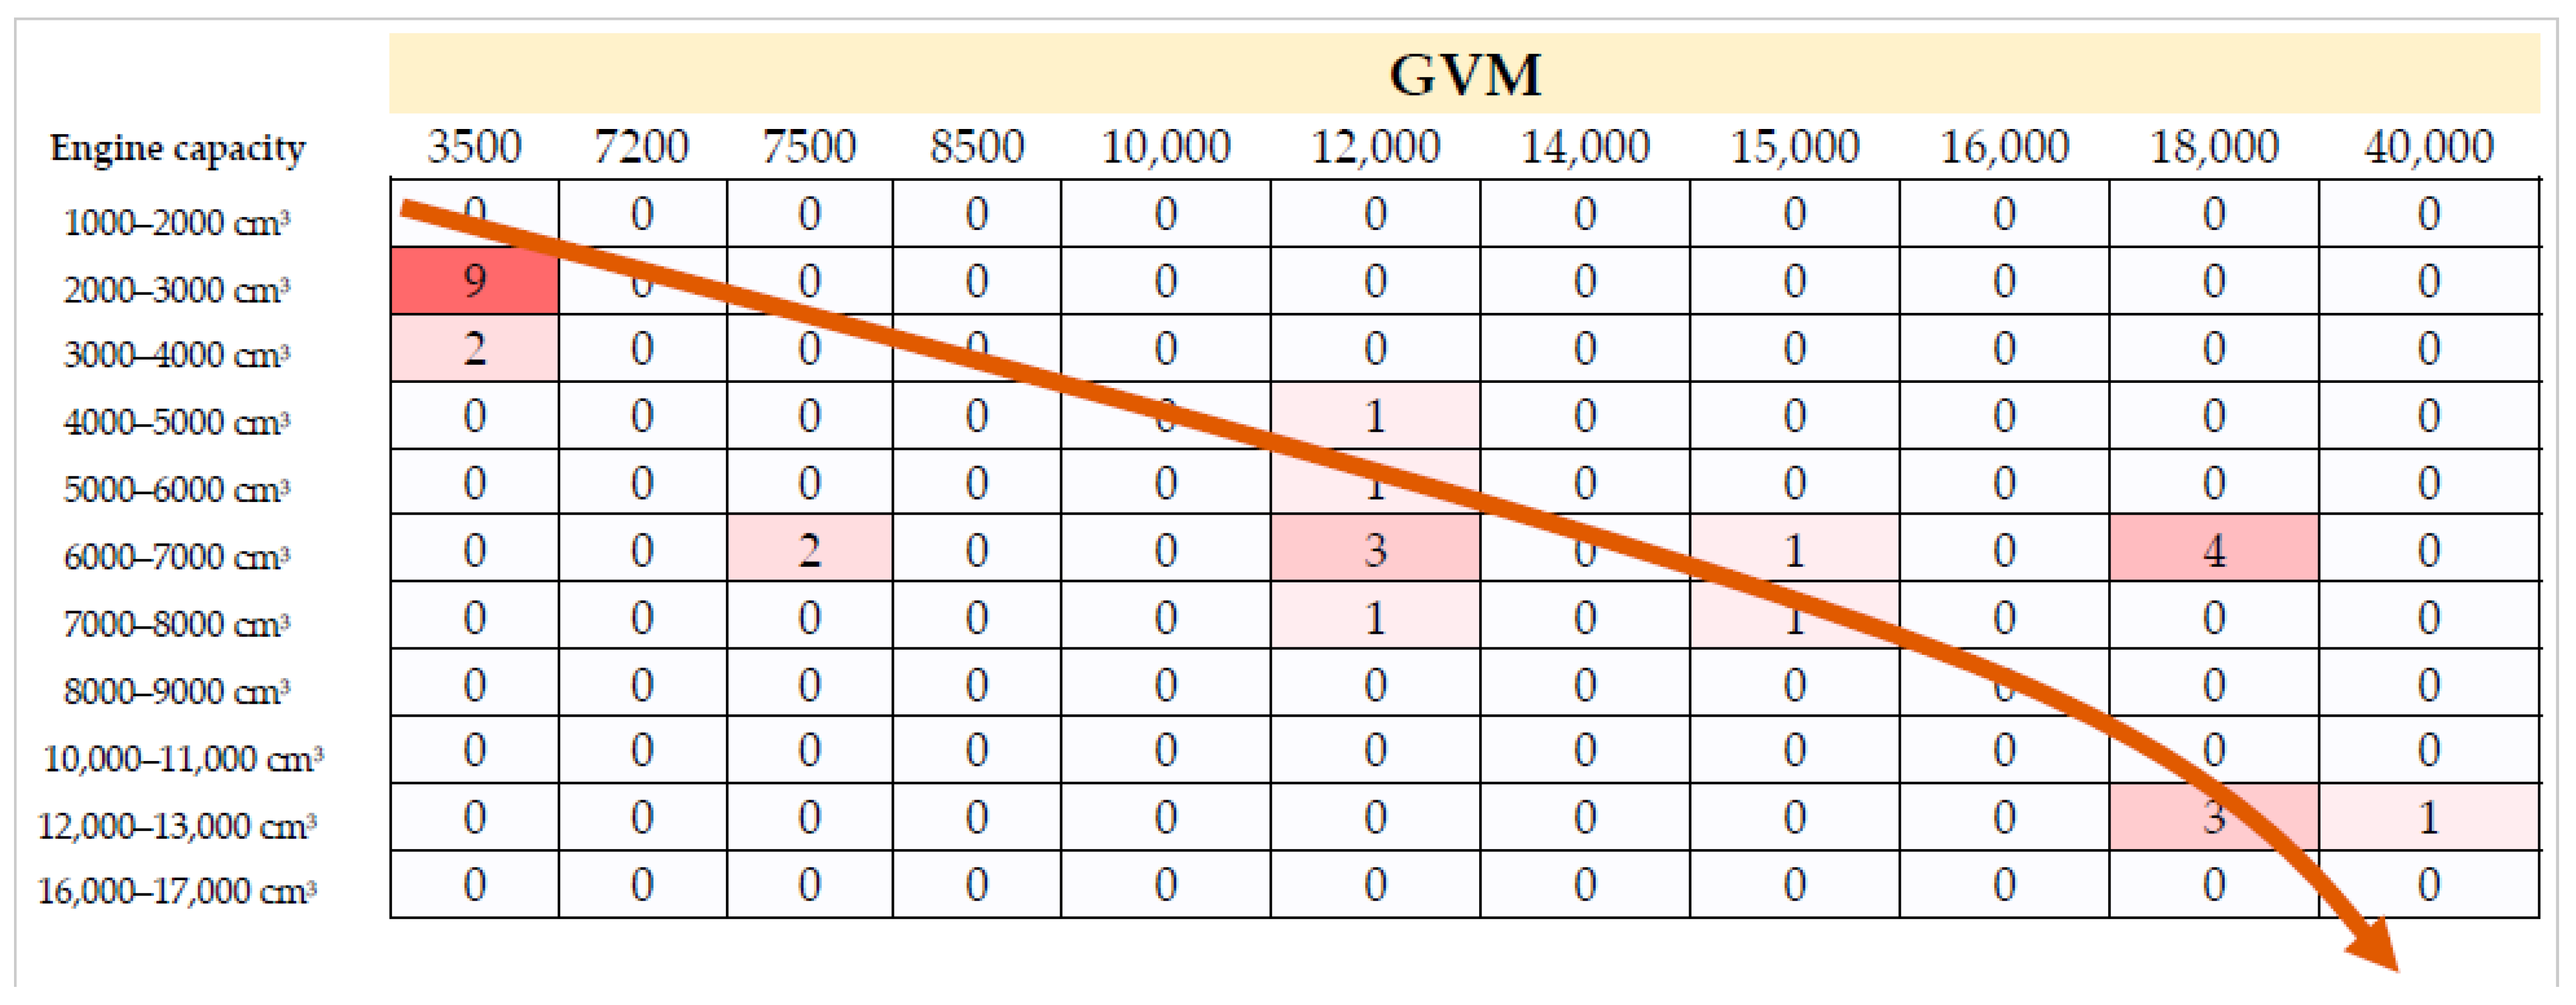
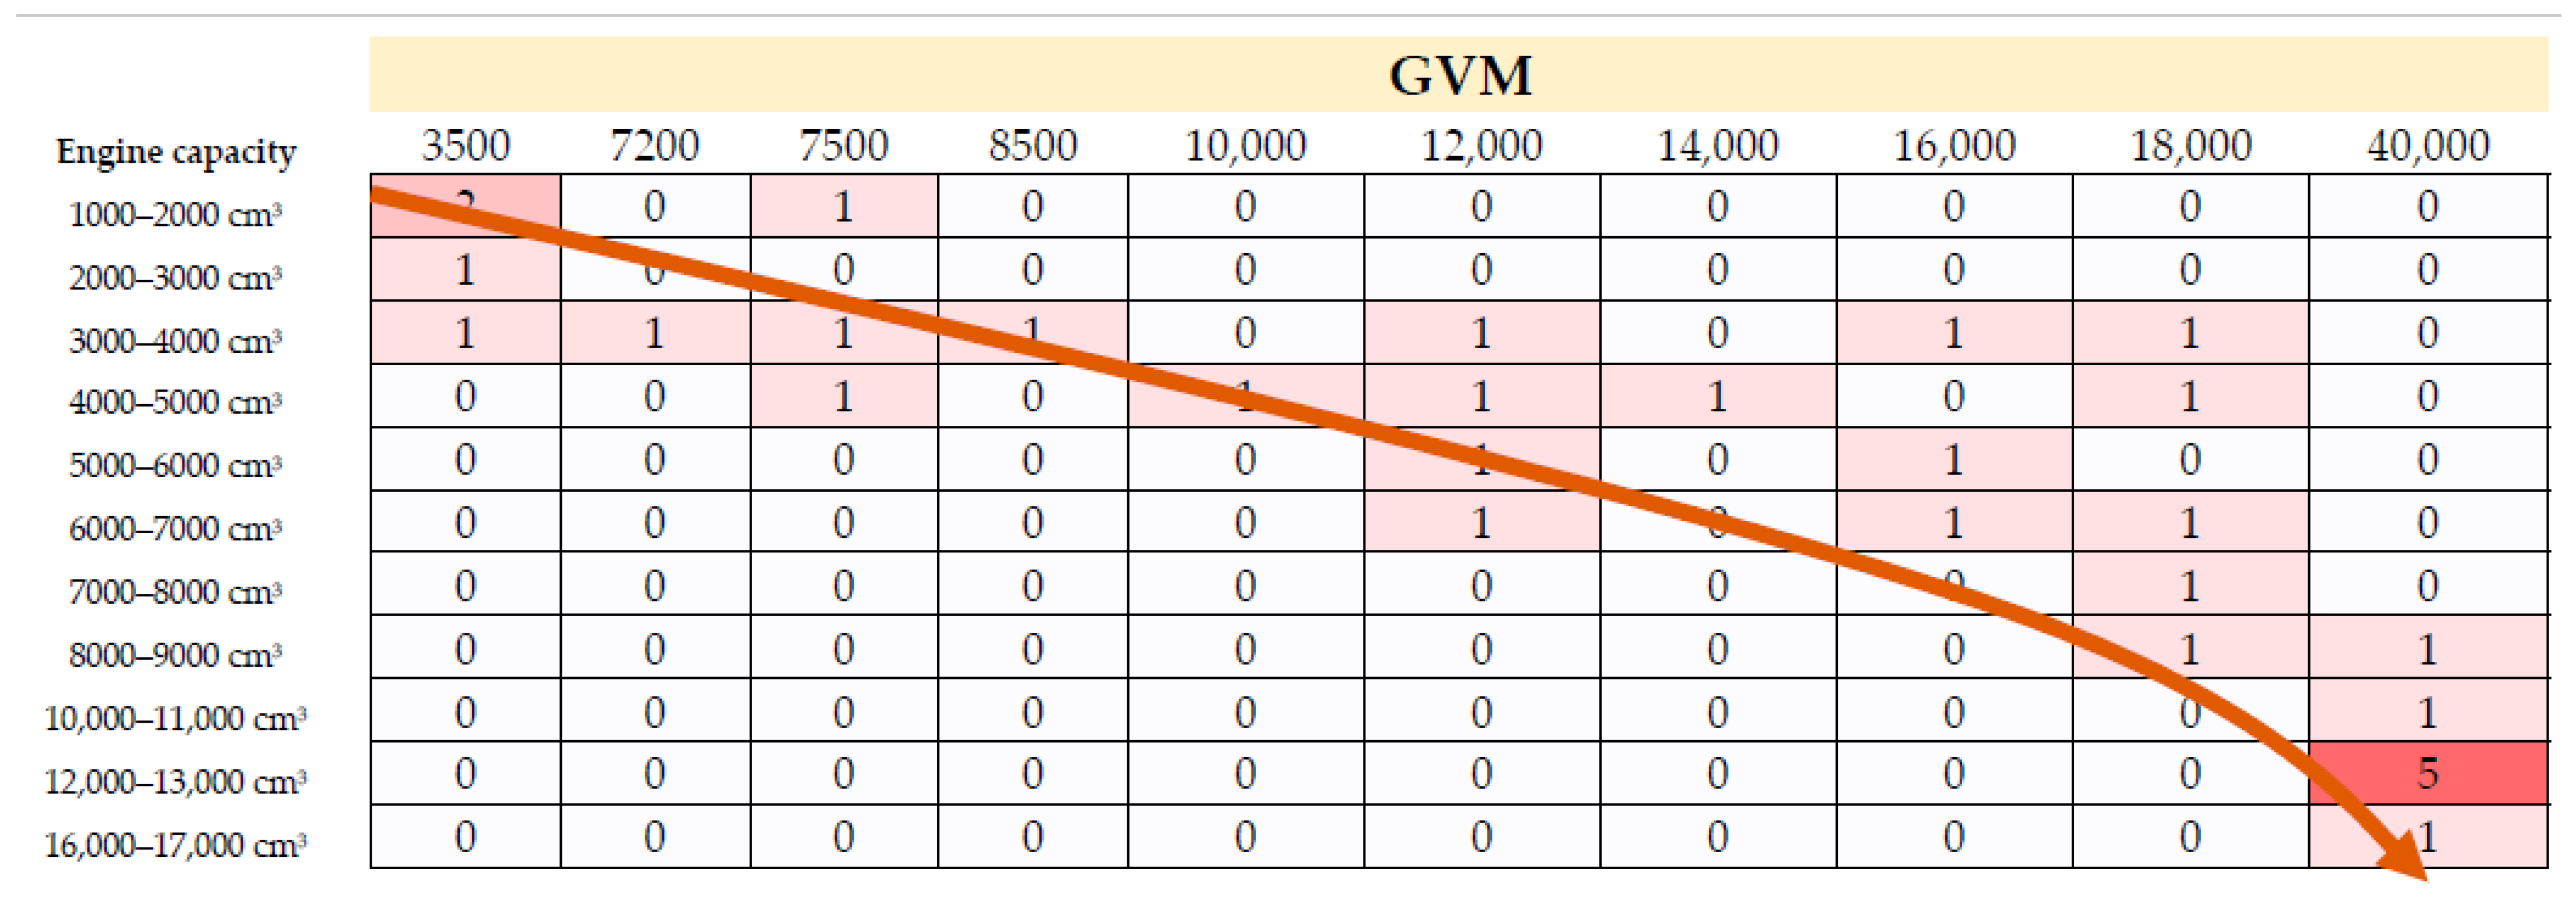
The limitations of this study result from the fact that, in data collection, we rely on expert knowledge (transport managers). Therefore, there may be some differences depending on the fleet structure used and the drivers’ qualifications (e.g., eco-driving training). In order to mitigate this limitation, we triangulated the empirical data with manufacturers′ data regarding the fuel consumption of new trucks/vans. Fuel consumption data sourced from truck/van manufacturers were collected and sorted by GVM class. Actual data sourced from various dealers and brands are presented in Appendix A. The proposed approach was also implemented in business practice and was positively assessed as actionable and feasible by the transport managers who participated in the case study.
Future research will be conducted to verify mutual interconnections between heterogeneous fleet characteristics such as GVM, engine capacity, mileage, and fuel consumption to identify other relevant factors that will extend the proposed calculation formula.

Author Contributions

Conceptualization, P.G.-D. and D.D.; methodology, P.G.-D. and D.D.; validation, D.D. and P.Z.; formal analysis, D.D.; investigation, P.G.-D. and D.D.; resources, D.D.; data curation, D.D. and P.Z.; writing—original draft preparation, P.G.-D. and D.D.; writing—review and editing, P.G.-D. and D.D.; supervision, P.G.-D. and P.Z.; funding acquisition, P.G.-D. and D.D. All authors have read and agreed to the published version of the manuscript.

Funding

The APC was funded by the internal research grant of the Poznan University of Technology 0812/SBAD/4202. Damian Dubisz would like to thank the Ministry of Education and Science (Poland) for funding this research within the framework of the Implementation Doctorate Program of the Ministry of Education and Science implemented in 2021–2025 (Contract No. DWD/5/0015/2021 dated 23 December 2021).

Institutional Review Board Statement

Not applicable.

Informed Consent Statement

Not applicable.

Data Availability Statement

Not applicable.

Conflicts of Interest

The authors declare no conflict of interest. The funders had no role in the design of the study; in the collection, analyses, or interpretation of data; in the writing of the manuscript; or in the decision to publish the results.

Appendix A

Table A1. New trucks’ fuel consumption levels.
Brand-CodeFuel TypeEngine CapacityAverage Fuel Consumption (L/100 km)GVMRange
ADiesel2287 cm316.935002000–3000 cm3
ADiesel3000 cm320.872003000–4000 cm3
ADiesel3000 cm322.112,0003000–4000 cm3
ADiesel3908 cm324.718,0003000–4000 cm3
ADiesel3908 cm323.416,0003000–4000 cm3
ADiesel8700 cm323.418,0008000–9000 cm3
ADiesel8700 cm331.240,0008000–9000 cm3
BDiesel12,700 cm33040,00012,000–13,000 cm3
CDiesel16,100 cm331.240,00016,000–17,000 cm3
DDiesel12,777 cm33040,00012,000–13,000 cm3
EDiesel1968 cm315.635001000–2000 cm3
FDiesel3000 cm314.335003000–4000 cm3
FDiesel3000 cm318.275003000–4000 cm3
FDiesel3000 cm319.585003000–4000 cm3
GDiesel5100 cm318.212,0005000–6000 cm3
GDiesel5100 cm320.816,0005000–6000 cm3
GDiesel7700 cm324.718,0007000–8000 cm3
GDiesel12,800 cm328.840,00012,000–13,000 cm3
HDiesel4700 cm318.275004000–5000 cm3
HDiesel4700 cm320.810,0004000–5000 cm3
HDiesel4700 cm319.512,0004000–5000 cm3
HDiesel4700 cm322.114,0004000–5000 cm3
HDiesel4700 cm32618,0004000–5000 cm3
HDiesel10,800 cm333.640,00010,000–11,000 cm3
HDiesel12,900 cm332.440,00012,000–13,000 cm3
IDiesel1968 cm315.635001000–2000 cm3
IDiesel1968 cm316.2575001000–2000 cm3
IDiesel6871 cm317.5512,0006000–7000 cm3
IDiesel6871 cm322.116,0006000–7000 cm3
IDiesel6871 cm323.418,0006000–7000 cm3
IDiesel12,500 cm332.440,00012,000–13,000 cm3

Appendix B

The structure of the fleet in the empirical study is presented in Figure A1 and the structure of the fleet offered by the manufacturers in Q4 of 2021 is presented in Figure A2.
Figure A1. Structure of fleet in the study. Correlation between truck GVM and engine capacity.
Sustainability 14 16085 g0a1
Figure A2. Structure of fleet offered by truck manufacturers in Q4 2021. Correlation between truck GVM and engine capacity.
Sustainability 14 16085 g0a2

References

  1. Bjørgen, A.; Bjerkan, K.Y.; Hjelkrem, O.A. E-Groceries: Sustainable Last Mile Distribution in City Planning. Res. Transp. Econ. 2021, 87, 100805. [Google Scholar] [CrossRef]
  2. Brzezinski, L.; Hadas, L.; Cyplik, P. The Transformation of the Business Model of SMEs Due to COVID-19 Pandemic. ERSJ 2021, XXIV, 915–924. [Google Scholar] [CrossRef] [PubMed]
  3. Grzybowska, K. Identification and Classification of Global Theoretical Trends and Supply Chain Development Directions. Energies 2021, 14, 4414. [Google Scholar] [CrossRef]
  4. Statista. Retail e-Commerce Sales Worldwide from 2014 to 2026. Available online: https://www.statista.com/statistics/379046/worldwide-retail-e-commerce-sales (accessed on 20 August 2022).
  5. Kawa, A.; Pierański, B. Green logistics in e-commerce. LogForum 2021, 17, 183–192. [Google Scholar] [CrossRef]
  6. Gawor, T.; Hoberg, K. Customers’ valuation of time and convenience in e-fulfillment. Int. J. Phys. Distrib. Logist. Manag. 2019, 49, 75–98. [Google Scholar] [CrossRef]
  7. Cheah, L.; Huang, Q. Comparative Carbon Footprint Assessment of Cross-Border E-Commerce Shipping Options. Transp. Res. Rec. 2022, 2676, 584–595. [Google Scholar] [CrossRef]
  8. Jaller, M.; Pahwa, A. Evaluating the Environmental Impacts of Online Shopping: A Behavioral and Transportation Approach. Transp. Res. Part D Transp. Environ. 2020, 80, 102223. [Google Scholar] [CrossRef]
  9. Hischier, R. Car vs. Packaging—A First, Simple (Environmental) Sustainability Assessment of Our Changing Shopping Behaviour. Sustainability 2018, 10, 3061. [Google Scholar] [CrossRef] [Green Version]
  10. Crippa, M.; Guizzardi, D.; Solazzo, E.; Muntean, M.; Schaaf, E.; Monforti-Ferrario, F.; Banja, M.; Olivier, J.; Grassi, G.; Rossi, S. GHG emissions of all world countries. In EUR 30831 EN; Publications Office of the European Union: Luxembourg, 2021; ISBN 978-92-76-41546-6. [Google Scholar] [CrossRef]
  11. Wątróbski, J.; Małecki, K.; Kijewska, K.; Iwan, S.; Karczmarczyk, A.; Thompson, R.G. Multi-Criteria Analysis of Electric Vans for City Logistics. Sustainability 2017, 9, 1453. [Google Scholar] [CrossRef]
  12. Bandeira, R.A.; D’Agosto, M.A.; Ribeiro, S.K.; Bandeira, A.P.; Goes, G.V. A fuzzy multi-criteria model for evaluating sustainable urban freight transportation operations. J. Clean. Prod. 2018, 184, 727–739. [Google Scholar] [CrossRef]
  13. Patella, S.M.; Grazieschi, G.; Gatta, V.; Marcucci, E.; Carrese, S. The Adoption of Green Vehicles in Last Mile Logistics: A Systematic Review. Sustainability 2021, 13, 6. [Google Scholar] [CrossRef]
  14. Radzki, G.; Nielsen, I.; Golińska-Dawson, P.; Bocewicz, G.; Banaszak, Z. Reactive UAV Fleet’s Mission Planning in Highly Dynamic and Unpredictable Environments. Sustainability 2021, 13, 5228. [Google Scholar] [CrossRef]
  15. Pörtner, H.-O.; Roberts, D.C.; Tignor, M.M.B.; Poloczanska, E.S.; Mintenbeck, K.; Alegría, A.; Craig, M.; Langsdorf, S.; Löschke, S.; Möller, V. (Eds.) Climate Change 2022: Impacts, Adaptation and Vulnerability. In Contribution of Working Group II to the Sixth Assessment Report of the Intergovernmental Panel on Climate Change; Cambridge University Press: Cambridge, UK; New York, NY, USA, 2022. [Google Scholar]
  16. Quak, H.; Nesterova, N.; Rooijen, T.; Dong, Y. Zero emission city logistics: Current practices in freight electromobility and feasibility in the near future. Transp. Res. Procedia 2016, 14, 1506–1515. [Google Scholar] [CrossRef] [Green Version]
  17. Zhao, Y.; Onat, N.C.; Kucukvar, M.; Tatari, O. Carbon and Energy Footprints of Electric Delivery Trucks: A Hybrid Multi-Regional Input-Output Life Cycle Assessment. Transp. Res. Part D Transp. Environ. 2016, 47, 195–207. [Google Scholar] [CrossRef]
  18. Das, C.; Jharkharia, S. Low Carbon Supply Chain: A State-of-the-Art Literature Review. J. Manuf. Technol. Manag. 2018, 29, 398–428. [Google Scholar] [CrossRef]
  19. Saenz, J.; Figliozzi, M.; Faulin, J. Assessment of the Carbon Footprint Reductions of Tricycle Logistics Services. Transp. Res. Rec. 2016, 2570, 48–56. [Google Scholar] [CrossRef] [Green Version]
  20. Chiang, W.-C.; Li, Y.; Shang, J.; Urban, T.L. Impact of Drone Delivery on Sustainability and Cost: Realizing the UAV Potential through Vehicle Routing Optimization. Appl. Energy 2019, 242, 1164–1175. [Google Scholar] [CrossRef]
  21. Sherafati, M.; Bashiri, M.; Tavakkoli-Moghaddam, R.; Pishvaee, M.S. Achieving sustainable development of supply chain by incorporating various carbon regulatory mechanisms. Transp. Res. Part D Transp. Environ. 2020, 81, 102253. [Google Scholar] [CrossRef]
  22. Ghosh, P.; Jha, A.; Sharma, R.R.K. Managing carbon footprint for a sustainable supply chain: A systematic literature review. Mod. Supply Chain. Res. Appl. 2020, 2, 123–141. [Google Scholar] [CrossRef]
  23. Oláh, J.; Kitukutha, N.; Haddad, H.; Pakurár, M.; Máté, D.; Popp, J. Achieving Sustainable E-Commerce in Environmental, Social and Economic Dimensions by Taking Possible Trade-Offs. Sustainability 2019, 11, 89. [Google Scholar] [CrossRef] [Green Version]
  24. Mangiaracina, R.; Marchet, G.; Perotti, S.; Tumino, A. A Review of the Environmental Implications of B2C E-Commerce: A Logistics Perspective. Int. J. Phys. Distrib. Logist. Manag. 2015, 45, 565–591. [Google Scholar] [CrossRef]
  25. Pålsson, H.; Pettersson, F.; Winslott Hiselius, L. Energy Consumption in E-Commerce versus Conventional Trade Channels-Insights into Packaging, the Last Mile, Unsold Products and Product Returns. J. Clean. Prod. 2017, 164, 765–778. [Google Scholar] [CrossRef]
  26. Escursell, S.; Llorach-Massana, P.; Roncero, M.B. Sustainability in E-Commerce Packaging: A Review. J. Clean. Prod. 2021, 280, 124314. [Google Scholar] [CrossRef]
  27. Hidayatno, A.; Destyanto, A.R.; Fadhil, M. Model Conceptualization on E-Commerce Growth Impact to Emissions Generated from Urban Logistics Transportation: A Case Study of Jakarta. Energy Procedia 2019, 156, 144–148. [Google Scholar] [CrossRef]
  28. Iwan, S. Adaptative approach to implementing good practices to support environmentally friendly urban freight transport management. Procedia-Soc. Behav. Sci. 2014, 151, 70–86. [Google Scholar] [CrossRef] [Green Version]
  29. Hu, W.; Dong, J.; Hwang, B.; Ren, R.; Chen, Z. A Scientometrics Review on City Logistics Literature: Research Trends, Advanced Theory and Practice. Sustainability 2019, 11, 2724. [Google Scholar] [CrossRef] [Green Version]
  30. Janjevic, M.; Winkenbach, M.; Merchán, D. Integrating collection-and-delivery points in the strategic design of urban last-mile e-commerce distribution networks. Transp. Res. Part E Logist. Transp. Rev. 2019, 131, 37–67. [Google Scholar] [CrossRef]
  31. Olsson, J.; Hellström, D.; Pålsson, H. Framework of Last Mile Logistics Research: A Systematic Review of the Literature. Sustainability 2019, 11, 7131. [Google Scholar] [CrossRef] [Green Version]
  32. Wiedmann, T.; Minx, J. A Definition of ‘Carbon Footprint’. In Ecological Economics Research Trends; Nova Science Publishers: New York, NY, USA, 2007; pp. 1–11. ISBN 978-1-60021-941-2. [Google Scholar]
  33. Acquaye, A.; Genovese, A.; Barrett, J.; Lenny Koh, S.C. Benchmarking Carbon Emissions Performance in Supply Chains. Supply Chain. Manag. Int. J. 2014, 19, 306–321. [Google Scholar] [CrossRef]
  34. Herold, D.M.; Lee, K.-H. Carbon Management in the Logistics and Transportation Sector: An Overview and New Research Directions. Carbon Manag. 2017, 8, 79–97. [Google Scholar] [CrossRef]
  35. Munasinghe, M.; Jayasinghe, P.; Ralapanawe, V.; Gajanayake, A. Supply/Value Chain Analysis of Carbon and Energy Footprint of Garment Manufacturing in Sri Lanka. Sustain. Prod. Consum. 2016, 5, 51–64. [Google Scholar] [CrossRef]
  36. Rugani, B.; Vázquez-Rowe, I.; Benedetto, G.; Benetto, E. A Comprehensive Review of Carbon Footprint Analysis as an Extended Environmental Indicator in the Wine Sector. J. Clean. Prod. 2013, 54, 61–77. [Google Scholar] [CrossRef]
  37. Wiedemann, S.; McGahan, E.; Murphy, C.; Yan, M.-J.; Henry, B.; Thoma, G.; Ledgard, S. Environmental Impacts and Resource Use of Australian Beef and Lamb Exported to the USA Determined Using Life Cycle Assessment. J. Clean. Prod. 2015, 94, 67–75. [Google Scholar] [CrossRef]
  38. Montoya-Torres, J.R.; Gutierrez-Franco, E.; Blanco, E.E. Conceptual framework for measuring carbon footprint in supply chains. Prod. Plan. Control 2015, 26, 265–279. [Google Scholar]
  39. Chen, J.-X.; Chen, J. Supply Chain Carbon Footprinting and Responsibility Allocation under Emission Regulations. J. Environ. Manag. 2017, 188, 255–267. [Google Scholar] [CrossRef] [PubMed]
  40. Pandey, D.; Agrawal, M.; Pandey, J.S. Carbon Footprint: Current Methods of Estimation. Environ. Monit. Assess. 2011, 178, 135–160. [Google Scholar] [CrossRef] [PubMed]
  41. Valderrama, C.V.; Santibanez-González, E.; Pimentel, B.; Candia-Véjar, A.; Canales-Bustos, L. Designing an Environmental Supply Chain Network in the Mining Industry to Reduce Carbon Emissions. J. Clean. Prod. 2020, 254, 119688. [Google Scholar] [CrossRef]
  42. Luo, X.; Dong, L.; Dou, Y.; Li, Y.; Liu, K.; Ren, J.; Liang, H.; Mai, X. Factor Decomposition Analysis and Causal Mechanism Investigation on Urban Transport CO2 Emissions: Comparative Study on Shanghai and Tokyo. Energy Policy 2017, 107, 658–668. [Google Scholar] [CrossRef]
  43. Lopes de Sousa Jabbour, A.B.; Chiappetta Jabbour, C.J.; Sarkis, J.; Latan, H.; Roubaud, D.; Godinho Filho, M.; Queiroz, M. Fostering Low-Carbon Production and Logistics Systems: Framework and Empirical Evidence. Int. J. Prod. Res. 2021, 59, 7106–7125. [Google Scholar] [CrossRef]
  44. Liang, C.; Liu, Z.; Geng, Z. Assessing e-commerce impacts on China’s CO2 emissions: Testing the CKC hypothesis. Environ. Sci. Pollut. Res. 2021, 28, 56966–56983. [Google Scholar] [CrossRef]
  45. Lin, N. CO2 Emissions Mitigation Potential of Buyer Consolidation and Rail-Based Intermodal Transport in the China-Europe Container Supply Chains. J. Clean. Prod. 2019, 240, 118121. [Google Scholar] [CrossRef]
  46. Mei, Q.; Li, J.; Ursavas, E.; Zhu, S.X.; Luo, X. Freight Transportation Planning in Platform Service Supply Chain Considering Carbon Emissions. Int. J. Prod. Econ. 2021, 240, 108241. [Google Scholar] [CrossRef]
  47. Rudi, A.; Fröhling, M.; Zimmer, K.; Schultmann, F. Freight Transportation Planning Considering Carbon Emissions and In-Transit Holding Costs: A Capacitated Multi-Commodity Network Flow Model. EURO J. Transp. Logist. 2016, 5, 123–160. [Google Scholar] [CrossRef]
  48. Siragusa, C.; Tumino, A.; Mangiaracina, R.; Perego, A. Electric Vehicles Performing Last-Mile Delivery in B2C e-Commerce: An Economic and Environmental Assessment. Int. J. Sustain. Transp. 2022, 16, 22–33. [Google Scholar] [CrossRef]
  49. Pérez-Martínez, P.J.; Ming, D.; Dell’Asin, G.; Monzón, A. Evaluation of the influence of toll systems on energy consumption and CO2 emissions: A case study of a Spanish highway. J. King Saud Univ.-Sci. 2011, 23, 301–310. [Google Scholar] [CrossRef] [Green Version]
  50. Moufad, I. A Methodology for Measuring the Ecological Footprint of Freight Transport in Urban Areas: A Case Study of a Moroccan City. In Proceedings of the International Conference on Industrial Engineering and Operations Management, Bandung, Indonesia, 6–8 March 2018. [Google Scholar]
  51. Zamboni, G.; André, M.; Roveda, A.; Capobianco, M. Experimental evaluation of Heavy Duty Vehicle speed patterns in urban and port areas and estimation of their fuel consumption and exhaust emissions. Transp. Res. Part D Transp. Environ. 2015, 35, 1–10. [Google Scholar] [CrossRef]
  52. Andrés, L.; Padilla, E. Driving factors of GHG emissions in the EU transport activity. Transp. Policy 2018, 61, 60–74. [Google Scholar] [CrossRef] [Green Version]
  53. Gao, J.; Chen, H.; Li, Y.; Chen, J.; Zhang, Y.; Dave, K.; Huang, Y. Fuel Consumption and Exhaust Emissions of Diesel Vehicles in Worldwide Harmonized Light Vehicles Test Cycles and Their Sensitivities to Eco-Driving Factors. Energy Convers. Manag. 2019, 196, 605–613. [Google Scholar] [CrossRef]
  54. Pålsson, H.; Kovács, G. Reducing Transportation Emissions: A Reaction to Stakeholder Pressure or a Strategy to Increase Competitive Advantage. Int. J. Phys. Distrib. Logist. Manag. 2014, 44, 283–304. [Google Scholar] [CrossRef]
  55. Methodology_Report_EcoTransIT World 2022. Available online: https://www.ecotransit.org/wordpress/wp-content/uploads/20200828_Methodology_Report_EcoTransIT_World.pdf (accessed on 26 September 2022).
  56. Bergmann, F.M.; Wagner, S.M.; Winkenbach, M. Integrating First-Mile Pickup and Last-Mile Delivery on Shared Vehicle Routes for Efficient Urban e-Commerce Distribution. Transp. Res. Part B Methodol. 2020, 131, 26–62. [Google Scholar] [CrossRef]
  57. Venkataraman, C.; Rao, G.U.M. Emission factors of carbon monoxide and size-resolved aerosols from biofuel combustion. Environ. Sci. Technol. 2001, 35, 2100–2107. [Google Scholar] [CrossRef] [PubMed]
  58. Ehrler, V.C.; Schöder, D.; Seidel, S. Challenges and Perspectives for the Use of Electric Vehicles for Last Mile Logistics of Grocery E-Commerce–Findings from Case Studies in Germany. Res. Transp. Econ. 2021, 87, 100757. [Google Scholar] [CrossRef]
  59. Assmann, T.; Lang, S.; Müller, F.; Schenk, M. Impact assessment model for the implementation of cargo bike transshipment points in urban districts. Sustainability 2020, 12, 4082. [Google Scholar] [CrossRef]
  60. Thibbotuwawa, A.; Nielsen, P.; Zbigniew, B.; Bocewicz, G. Factors affecting energy consumption of unmanned aerial vehicles: An analysis of how energy consumption changes in relation to UAV routing. In Proceedings of the International Conference on Information Systems Architecture and Technology, Cairo, Egypt, 24–26 March 2019; Springer: Cham, Switzerland, 2019; pp. 228–238. [Google Scholar] [CrossRef]
  61. Delfmann, W.; Albers, S.; Gehring, M. The Impact of Electronic Commerce on Logistics Service Providers. Int. J. Phys. Distrib. Logist. Manag. 2020, 32, 203–222. [Google Scholar] [CrossRef]
  62. Morganti, E.; Seidel, S.; Blanquart, C.; Dablanc, L.; Lenz, B. The Impact of E-Commerce on Final Deliveries: Alternative Parcel Delivery Services in France and Germany. Transp. Res. Procedia 2014, 4, 178–190. [Google Scholar] [CrossRef] [Green Version]
  63. Kopfer, H.W.; Schönberger, J.; Kopfer, H. Reducing Greenhouse Gas Emissions of a Heterogeneous Vehicle Fleet. Flex Serv. Manuf. J. 2014, 26, 221–248. [Google Scholar] [CrossRef]
  64. Schöder, D.; Ding, F.; Campos, J.K. The Impact of E-Commerce Development on Urban Logistics Sustainability. Open J. Soc. Sci. 2016, 4, 1–6. [Google Scholar] [CrossRef] [Green Version]
  65. Grythe, H.; Lopez-Aparicio, S.; Høyem, H.; Weydahl, T. Decoupling Emission Reductions and Trade-Offs of Policies in Norway Based on a Bottom-Up Traffic Emission Model. Atmosphere 2022, 13, 1284. [Google Scholar] [CrossRef]
  66. Wang, H.; Li, M.; Wang, Z.; Li, W.; Hou, T.; Yang, X.; Zhao, Z.; Wang, Z.; Sun, T. Heterogeneous Fleets for Green Vehicle Routing Problem with Traffic Restrictions. IEEE Trans. Intell. Transp. Syst. 2022, 1–10. [Google Scholar] [CrossRef]
  67. Dempster, A.P.; Laird, N.M.; Rubin, D.B. Maximum likelihood from incomplete data via the EM algorithm. J. R. Stat. Soc. Ser. B 1977, 39, 1–22. [Google Scholar]
  68. Yin, R.K. Case Study Research: Design and Methods; SAGE: Thousands Oak, CA, USA, 2009; ISBN 978-1-4129-6099-1. [Google Scholar]
  69. Meredith, J. Building Operations Management Theory through Case and Field Research. J. Oper. Manag. 1998, 16, 441–454. [Google Scholar] [CrossRef]
  70. Tao, Z.; Zheng, Q.; Kong, H. A Modified Gravity P-Median Model for Optimizing Facility Locations. J. Syst. Sci. Inf. 2018, 6, 421–434. [Google Scholar] [CrossRef]
  71. Dey, B.K.; Yilmaz, I.; Seok, H. A Sustainable Supply Chain Integrated with Autonomated Inspection, Flexible Eco-Production, and Smart Transportation. Processes 2022, 10, 1775. [Google Scholar] [CrossRef]
  72. Dey, B.K.; Park, J.; Seok, H. Carbon-emission and waste reduction of a manufacturing-remanufacturing system using green technology and autonomated inspection. RAIRO-Oper. Res. 2022, 56, 2801–2831. [Google Scholar] [CrossRef]
  73. Werner-Lewandowska, K.; Golinska-Dawson, P. Sustainable Logistics Management Maturity—The Theoretical Assessment Framework and Empirical Results from Poland. Sustainability 2021, 13, 5102. [Google Scholar] [CrossRef]
  74. Dubisz, D.; Golinska-Dawson, P. Carbon Footprint Management within a Supply Chain–A Case Study. Eur. Res. Stud. 2021, XXIV, 860–870. [Google Scholar] [CrossRef]
  75. Glock, C.H.; Kim, T. Coordinating a Supply Chain with a Heterogeneous Vehicle Fleet under Greenhouse Gas Emissions. Int. J. Logist. Manag. 2015, 26, 494–516. [Google Scholar] [CrossRef]
  76. Bask, A.; Rajahonka, M.; Laari, S.; Solakivi, T.; Töyli, J.; Ojala, L. Environmental Sustainability in Shipper-LSP Relationships. J. Clean. Prod. 2018, 172, 2986–2998. [Google Scholar] [CrossRef]
  77. Habib, M.S.; Omair, M.; Ramzan, M.B.; Chaudhary, T.N.; Farooq, M.; Sarkar, B. A robust possibilistic flexible programming approach toward a resilient and cost-efficient biodiesel supply chain network. J. Clean. Prod. 2022, 366, 132752. [Google Scholar] [CrossRef]
  78. Aljohani, K.; Thompson, R.G. A Stakeholder-Based Evaluation of the Most Suitable and Sustainable Delivery Fleet for Freight Consolidation Policies in the Inner-City Area. Sustainability 2019, 11, 124. [Google Scholar] [CrossRef]
  79. Falchetta, G.; Noussan, M. The Impact of COVID-19 on transport demand, modal choices, and sectoral energy consumption in Europe. IAEE Energy Forum 2020, 2020, 48–50. [Google Scholar]
Figure 1. Research methodology.
Sustainability 14 16085 g001
Figure 2. Factors determining carbon footprint within e-commerce distribution.
Sustainability 14 16085 g002
Figure 3. Fuel consumption in terms of vehicle age calculated according to the GVM class.
Sustainability 14 16085 g003
Figure 4. Average fuel consumption for a new truck/van per GVM class.
Sustainability 14 16085 g004
Figure 5. Modelled network for e-commerce deliveries.
Sustainability 14 16085 g005
Table 1. Factors influencing emissions in e-commerce.
Topic
Category
FactorStudy
RoadDistance travelled[16,47,48]
Topography of road network[50,53]
TrafficTraffic congestions, distribution of traffic over time[16,48]
Traffic restriction[16,48,49]
Traffic density[10,51,52,53]
Speed limitation[51,53]
CargoLoad factor[7,42,47,53]
Transshipment schedule[47,63,64]
Cargo volume and density[55,56]
FleetVehicle mass (size)[42,65,66]
Number of vehicles[57]
Vehicle type[65], [this study]
Vehicle age[This study]
FuelType of fuel[17,18,48,58,59,60]
Table 2. Expert’s profile.
Managing Supply TransportDistribution
Management
Supply Chain
Optimization
Decision-Making on Efficiency of Supply Chain
Director of the Transport DepartmentXXXX
Director of the Logistics and Modern TechnologiesXXXX
Logistics DirectorXXXX
Supply Chain Development DirectorXXXX
Managing DirectorX X
13 owners of small- and medium-size subcontracting companiesXX
Table 3. Notations.
Table 3. Notations.
SymbolNotation′s Description
i = 1 k I i Total fuel consumption.
I i Fuel consumption of each truck.
R i Total distance of the truck in kilometers.
k Number of trucks within the same GVM class and age.
F c f Fuel conversion factor—UK DEFRA conversion factor chart for liquid or gaseous fuel combustion.
a GVM class.
R α The total amount of kilometers traveled on the route by group of trucks with the same V α and α parameters.
F C ¯ α Average fuel consumption [liters/100 km] per GVM class.
I ¯ a Yearly average increase in fuel consumption indicator per each GVM class described as α type.
VαVehicle age (years in operation per each α type).
Table 4. Average fuel consumption per GVM in medium traffic.
Age1234567891011121314151617181920Average Fuel Consumption
GVM3500 kg16.016.216.516.716.917.217.417.617.918.118.318.618.819.019.319.5 17.8
12,000 kg22.522.622.722.923.023.123.123.123.323.423.523.724.424.424.424.424.424.524.524.523.6
18,000 kg24.925.225.525.726.026.326.526.827.127.427.627.928.228.528.729.0 27.0
Table 5. Average increase in fuel consumption per GVM class.
GVM
[kg]
Increase in Average Fuel Consumption Increase—Year to Year Factor
35001.31%
12,0000.46%
18,0001.01%
Table 6. Average fuel consumption—survey and comparison of market data.
Fuel Consumption [L/100 km] in 1st Year of Use
GVM
[kg]
New TruckStatistical Model Based on Surveys
350015.6016.0
720020.80
750017.55
850019.50
10,00020.80
12,00019.3424.2
14,00022.10
16,00022.10
18,00024.4424.9
40,00031.20
Table 7. Daily average round-trip distances used for calculations for trucks.
Roundtrip/Daily
[km]Distance to Cross dock 1Distance to Cross dock 2Distance to Cross dock 3
From DC428 km470 km396 km
Table 8. Daily average round-trip distances used for calculations for vans.
[km]Daily Distance
From Cross dock 1276 km
From Cross dock 2316 km
From Cross dock 3329 km
Table 9. Fleet characteristics.
Number of TrucksGVM [kg]Transportation Tasks
618,000Linehaul
83500Final delivery leg
Number of linehaul trucksVehicle′s age
22
34
112
Number of vansVehicle′s age
12
25
33
27
Table 10. Simplified transportation scheme of linehauls and last-mile routes.
Linehaul routes GVM 18,000 kgTo CD 1To CD 2To CD 3
Departures from DC213
Last mile delivery GVM 3500 kgFrom CD 1From CD 2From CD 3
Departures341
Table 11. Carbon dioxide equivalent emission in the e-commerce distribution network.
TypeGVM [kgs]Truck′s AgeMonthly
Distance
kgCO2e
Linehaul18,000289886063
Linehaul18,000498706790
Linehaul18,000483165721
Linehaul18,0001283166165
Final delivery leg3500289883893
Final delivery leg3500589884042
Final delivery leg3500598704439
Final delivery leg3500383163648
Final delivery leg3500783163832
Table 12. Average CO2 equivalent emission per vehicle depending on its age.
TypeGVM [kg]Age of a VehicleMonthly DistancekgCO2e/km
Linehaul18,000289880.6746
Linehaul18,000498700.6879
Linehaul18,000483160.6879
Linehaul18,0001283160.7414
Final delivery leg3500289880.4331
Final delivery leg3500589880.4497
Final delivery leg3500598700.4497
Final delivery leg3500383160.4386
Final delivery leg3500783160.4608
Publisher’s Note: MDPI stays neutral with regard to jurisdictional claims in published maps and institutional affiliations.

