Abstract
Our modern society is becoming increasingly reliant on transportation networks, as well as the interdependent infrastructures and technologies that interact with them. The increasing complexity and interconnectedness of infrastructure networks make them susceptible to impact not only directly from external shocks but also indirectly from the failure of dependent infrastructures. This research study was conducted in Padang city, one of the most disaster-prone areas in Indonesia. Based on the literature review, it is no doubt that research study on seismic risk assessment is insufficient and outdated. In fact, a study about the interdependency between Critical Infrastructures (CIs) is yet to be done in this region. In this study, there are two approaches used for data gathering which is by surveying existing CIs using Google Earth and by an online questionnaire survey via Google Form. Based on the qualitative survey, a functionality rating method is done to obtain the level of outage/loss functionality which is an indicator for the damage occurred to the structure and infrastructure. Following that, a seismic risk analysis was conducted to assess the interdependency between investigated CIs and facilities. Respondents’ judgement from the questionnaire were used to identify the base criticality of each critical infrastructure. Based on the qualitative survey, the level of loss in functionality for the substation and the telecommunication tower is rated as “High”, but the loss in functionality for the water supply system is rated as “Moderate”. Moreover, the findings used from the respondents’ judgements were used to establish the initial level of criticality for each vital infrastructure. According to the findings, hospitals, power substations, and communication towers all have a criticality level of “5-Vital”, while police stations and fire stations both have a “3-medium” criticality rating. Eventually, the results of this assessment of interdependence are displayed in a criticality map, which shows how the interdependency relationship affects the initial criticality of a certain upstream infrastructure. Understanding the potential consequences of infrastructure failure, especially in regard to dependent infrastructures, can help emergency response teams formulate more targeted strategies for managing risks. As a consequence of this, the resilience of the wider community is improved, which contributes toward the implementation of Sustainable Development Goal (SDG) 11: Sustainable cities and communities particularly in reducing disasters and people in vulnerable situation.
1. Historical Background of Earthquake Incidents in Padang City, Indonesia
Padang is the capital and largest city of West Sumatera, Indonesia with a population of approximately 900,000 people. The city is one of the disaster-prone areas in Indonesia due to its territory lies within one of the world’s most active fault lines namely the “Ring of Fire” [1]. One of the major earthquakes that affected Padang includes the Mw 7.6 earthquake which occurred off the island of Sumatera, near the city of Padang on 30 September 2009. The epicenter of the earthquake was located about 57 km west of the low-lying city of Padang and at a sea depth of 71 km.
According to the National Disaster Management Agency, the earthquake resulted in 1117 deaths, 2902 injuries, and 186 people missing. Houses, schools, and hospitals were among the infrastructures that were destroyed. Furthermore, the state hospital, as well as private hospitals, which should serve as a main hub for organizing Padang’s health disaster preparedness, have been seriously damaged. The area’s electricity was also out, disrupting essential facilities like healthcare and communication. In addition, transportation networks were disrupted because roadway blockage occurred because of settlements and cracks, and Padang airport was closed, leaving a large number of people stranded. The existing interdependencies between infrastructures complicate the issue further because a failure in one could have cascading effects on other infrastructures or sectors [2]. As a result, society’s welfare is severely harmed, making emergency responses more difficult and increasing the overall effect of the hazards.
The Padang earthquake that occurred in 2009 caused devastating damage to a wide variety of structures and infrastructures in the city. According to a field report by Earthquake Engineering Field Investigation Team (EEFIT), the critical infrastructure such as hospitals, lifelines, transportation networks and so on were all affected. Wilkinson et al. [3] stated that immediately after the event, the main trunk for the central Padang region was severed resulting in total loss of 500 L/s supply. The distribution network was also affected because of pipe damage as well as local power loss, thus leaving the central region without water. Consequently, the hospitals experienced insufficient water for the patients and for critical hospital procedures. Meanwhile, the earthquake caused minor damage to Padang’s transportation networks, with no vehicular bridges reported as unsafe for travel and only a few roads closed. However, in the Pariaman district, landslides and slope failure did cause interruption to roads and a pedestrian bridge, with several road networks becoming impassable. As a result, it complicated rescue efforts and facilitated transport.
As the frequency and severity of seismic events have grown in recent decades, so has the likelihood that disruption in Critical Infrastructure (CIs) would result in a prolonged loss of important services. Critical infrastructure’s complex interdependencies increase risks and vulnerabilities because disruptions can spread to other critical infrastructure systems. As a result, crisis managers must comprehend existing CIs interdependencies, analyze existing assessment tools, and identify current crisis management gaps by conducting Seismic Risk Assessment (SRA).
Numerous methods and procedures for SRA have been developed; however, the approach by Hughes et al. [4] established the most comprehensive seismic risk framework that highlighted vulnerability assessment and CIs interdependencies, which fit this study’s scope. On top of that, study about interdependency between CIs is yet to be done within Padang city while previous related studies done in Padang city focusing on SRA is insufficient and outdated.
Therefore, to address this gap in the literature, this research study assessed the interdependencies between road network and CIs. The output of the model is interdependency and criticality ratings, to assess risk and understand failure propagation within networks, as well as the wider consequences of failures and outages. This provides better understanding of the possible implications of infrastructure failure, particularly regarding dependent infrastructures. This knowledge, combined with an understanding of natural hazards and asset vulnerabilities, can support specific risk treatment responses, which in turn improves wider community resilience.
In this research, a proposed approach to assess the interdependencies will be adopted where it links to a broader assessment of criticality and risk. As a result, risk mitigation strategies can be established and prioritized by identifying the critical infrastructure elements at high risk, based on the proposed risk assessment framework. Hence, by building the critical infrastructure management plans, the critical facilities especially hospitals and other emergency operations center will not be severely affected and the allocation of supportive medical forces as rescue team can meet the demands in the most critical areas. Subsequently, the aim of this work is to evaluate the structure and infrastructures damage by conducting functionality rating method based on qualitative survey, and to assign the interdependences rates between the investigated CIs.
2. Criticality of Critical Infrastructure (CIs)
When it comes to emergency response and recovery, critical assets are those that “are extremely vital to societal wellbeing and that, as a result, demand preferential attention by utilities”. Council for New Zealand Lifelines [5]. On the other hand, critical infrastructure, abbreviated CI, refers to the facilities and services that are absolutely necessary to the functioning of a community [6]. These can be further classified into the following three groups: essential facilities, transportation networks, and utility service A transport route may be crucial because it carries a lot of traffic or because it is the only access to a hospital given the study’s emphasis on roads.
Multiple experts and specialists have recently stated a desire to investigate CIs that have been exposed to earthquakes. For instance, Mualchin [7] conducted seismic hazard analysis for CIs in California by implementing Deterministic Hazard Seismic Assessment (DSHA) method in order to assess effects from the largest single earthquake called Maximum Credible Earthquake (MCEs). Moreover, Mon et al. [8] investigated the structural vulnerability of hospital buildings and facilities, to assess the performance of urban lifeline systems in Yangon, Myanmar. This is because medical facilities should be structurally resilient and be functional for medical services by sustainable supply of urban lifeline systems (i.e., electric power, water, etc.). Furthermore, a study by Poljanšek [9] about seismic vulnerability was conducted to assess interdependent CIs which are European gas and electricity transmission networks from a topological point of view, whereby the electricity network depends on the gas network through gas-fired power plants.
Focusing on the transportation network particularly roadways, a case study that has been conducted in Canadian University Campus by Ventura et al. [10] where Seismic Risk Assessment (SRA) was used to evaluate damage of the CIs including buildings and lifeline systems such as water, roads, gas and electricity system. For instance, the electricity and road systems were assessed using the ATC-13 methodology and FEMA-224 and the results were mapped on a block-by-block basis using GIS software. Apart from that, Argyroudis et al. [11] proposed a resilience assessment framework and then applied it to critical highway assets such as bridges, tunnels, embankments, slopes or retaining walls, exposed to an earthquake event.
In addition, Hughes et al. [4] suggested a fundamental module that includes a critical and interdependency assessment strategy. Table 1 shows a regularly used criticality rating that provides enough resolution for the assessment. It also includes a proposed criticality rating with some sample descriptions for a national level evaluation.

Table 1.
Proposed criticality ratings, with descriptors for a national assessment.
On top of that, the proposed interdependency assessment approach by Hughes et al. [4] suggests two forms of criticality:
- -
- Base criticality: This is an input that refers to the number of persons, users, or properties served by an infrastructure component. Importantly, the base criticality should not include considerations of downstream infrastructure criticality to prevent double counting with the modified criticality indicated in the next point.
- -
- Modified criticality: This is an output that indicates the impact of interdependence on the base criticality of an upstream infrastructure or corridor. The technique to assess modified criticality will differ depending on the interdependence typologies.
3. Seismic Risk Assessment Frameworks
The probability that an earthquake may cause losses in terms of deaths, property damage, and social and economic disruption can all be referred to as seismic risk [12]. The seismic risk assessment can be expressed by three main qualitative and quantitative expressions, which are hazard, vulnerability and exposure [13,14].
A natural hazard, namely an earthquake, has the potential to cause damage and is defined by its severity or magnitude, location, frequency, and likelihood of occurrence. The terms “exposure” and “vulnerability” refer to the susceptibility of a community, assets, or systems to the effects of a hazard. “Exposure” denotes the number of people or assets that are exposed to hazards as shown in Figure 1. Therefore, Risk assessment, which is a component of the mitigation phase, assists in determining the likelihood of hazard and its impact on the exposed elements, including people, buildings, society, and the economy [1].
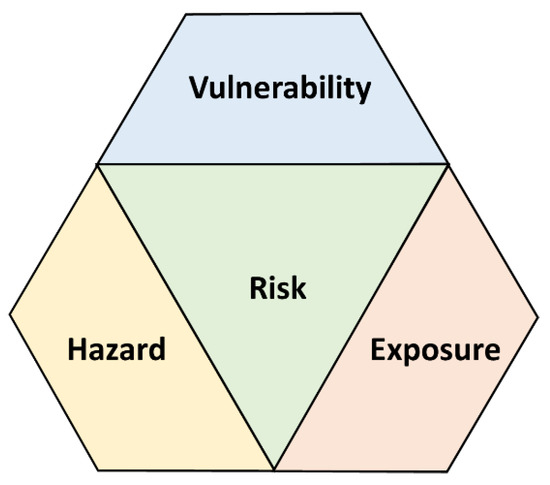
Figure 1.
General Seismic Risk Assessment Framework Parameters.
The Federal Emergency Management Agency (FEMA) is known for developing a Hazards risk assessment model in United States (HAZUS), which it developed to estimate seismic risk and potential loss based on extensive urban data of buildings, population, and economic activities; Risk Assessment Tools for Diagnosis of Urban Areas against Seismic Disasters (RADIUS), which allows users to perform an aggregated loss estimations with respect to assessed buildings and vulnerability of population [15]; the Earthquake Disaster Risk Index (EDRI) model to measure the seismic risk by considering the seismic hazards and vulnerability [16]. In addition to the present models, a number of researchers have developed methods for calculating seismic risk from various angles, including hazard variables and vulnerabilities (exposure, resilience, and coping ability) that could potentially affect seismic risk.
Kamranzad et al. [14] incorporated the commonly practiced framework of Earthquake Risk Assessment (ERA) in his study to address the quantification of the present-day earthquake risk in Tehran in order to provide an insight into the status of relative risk between different districts and the possibility of relative comparison between them. On the other hand, Rini [17] extended the existing ERA framework developed by Kythreoti [18] and Khan [19] by considering earthquake associated hazard particularly tsunami thus called Earthquake Tsunami Risk Assessment (ETRA) Framework. The extended framework is then adopted in multi-hazard risk assessment of buildings in Padang City, Indonesia. Moreover, Mili et al. [20] has developed a holistic model assessing earthquake risk based on hazard, vulnerability and response capacity. The proposed model is adopted in two districts of Tehran, having different physical and socio-economic characteristics, to evaluate the safety level for earthquakes. Furthermore, Sauti et al. [21] proposed a holistic model composing three essential indicators which are exposure, resilience and capacity to conduct a GIS-based seismic risk assessment at a local district situated in Pahang, Malaysia.
As the focus of this research work is on physical infrastructure particularly on roadway and Critical Infrastructures (CIs), there are few related studies that have been conducted by past researchers. Hughes et al. [4] proposed risk assessment framework component consisting of likelihood, vulnerability, and consequences to assess interdependencies of transportation network in New Zealand. Sun et al. [22] investigated a new approach that tackled seismic resilience of road networks effected by earthquake hazards, by leveraging post-shock rapid responses as the key to minimize the functionality losses of the network, especially in the immediate aftermath of earthquakes. Omar et al. [23] analyzed the physical seismic emergency response capacity in Dhaka, Bangladesh by developing five indicators and one of them is rescue and evacuation accessibility where the road network within the city is studied during seismic hazard.
There are many studies that have been carried out related to seismic risk assessment and various approaches/framework have been developed. However, the study by Hughes et al. [4] in New Zealand showed the simplest approaches and most comprehensive aspects of seismic risk framework that highlighted both vulnerability assessment as well as interdependencies between CIs, which aligned with scope of this research study. Moreover, the main gap of this research that needs to be considered in this study is to assess the CIs interdependencies which is the first one to be conducted in the Padang city.
3.1. Seismic Hazard
Seismic hazard can be defined as the probability of experiencing a certain level of earthquake intensity and its consequent hazards (including ground shaking, liquefaction, landslides and tsunami) in a particular region within a period of time [24]. The main outcome of seismic hazard assessment is a fragility function which indicates the probability of exceedance for selected ground motion parameters (i.e., peak ground acceleration (PGA) or spectral acceleration) at a site for a given period of time [25]. There are two approaches for assessing seismic hazard namely Deterministic seismic hazard assessment (DSHA) and Probabilistic seismic hazard analysis (PSHA).
Firstly, DSHA generally predicts ground motion at a location using earthquake magnitude and distance associated with the highest hazard from historical data for a given seismic source. This is often accomplished by employing a pre-determined seismic wave attenuation model, also referred to as a Ground Motion Prediction Equation (GMPE). Moreover, DSHA has limitations in which it does not properly account for uncertainties such as frequency of recurrence and ground motion [9], thus led to the creation of probabilistic seismic hazard assessment PSHA.
Secondly, PSHA assesses the probability of exceedance of selected ground motion levels at a specific location within a certain time window by quantifying uncertainties in earthquake recurrences, magnitudes, and consequent ground motions. PSHA results are frequently shown as hazard curves, which reflect the expected annual rate of exceedance for various ground motion levels.
Focusing on Padang city, the seismic hazard can be considered as high due to the complexity condition of its geographical and regional morphology that lies within the Pacific Ring of Fire, where some of mega magnitude earthquakes in the world have occurred [1]. There are few research studies on hazard seismicity analysis which Padang city was incorporated as one of the study areas. For example, Putra et al. [26] conducted a study on seismic hazard analysis in Indonesia focusing on Padang city and Banda Aceh since both cities have many experiences of massive earthquakes. PSHA was carried out to estimate the seismicity at the site. Based on the hazard curve at 10% probability of exceedance in 50 years, Banda Aceh has higher value of peak ground acceleration than Padang city with 0.73 g and 0.7 g respectively. Similar study had also been done by Permana et al. [27] entitled Probabilistic Seismic hazard Analysis in Northern Sumatra where the results show that the hazard for Padang city is 0.578 g. Slightly difference of results were obtained due to different approaches adopted (i.e., numbers of data collected, formula, etc.) by each researcher. Nevertheless, according to Indonesia National Progress Report on the Implementation of the Hyogo Framework for Action, both findings classify earthquake threat in Padang city as moderate level since it is within 0.26–0.7 g.
3.2. Seismic Exposure
Exposure is defined as the number of people or amounts of assets (e.g., physical, economic, social, environmental, etc.) exposed to a hazard. Seismic exposure is examined in the context of human and physical exposures in order to determine the population’s most susceptible groups [28,29].
There are few studies that have been conducted regarding seismic exposure in Padang city. Putra et al. [26] assess the exposure toward non engineered houses based on the damage data of the 2009 Padang earthquake. Moreover, Mulyani et al. [1] studied the exposure towards different building categories commonly found in Padang including unreinforced brick masonry (UBM), confined brick masonry (CBM), reinforced concrete frame with masonry infill (RCI) and steel structures. Apart from that, Rosyidi et al. [30] has studied the exposure of road infrastructure and geo-failures, (i.e., settlement of roads and bridges, slope failure and massive landslides) during the earthquake event. Meanwhile, Husrin et al. [31] conducted a study focusing on Critical Infrastructures (CIs) in the City of Padang by Tsunami Vulnerability assessment. These infrastructures include vertical evacuation buildings, banking centers, commercial centers, religious facilities, energy sources, communication and IT networks, transportation systems, government buildings/facilities, educational facilities, public health centers, food and drinking water facilities, military facilities, and emergency facilities (i.e., tsunami early warning system networks). After all, exposure is one of the most important criteria to be considered in SRA Framework in a way to analyze the impact of future earthquakes more precisely.
3.3. Seismic Risk and Vulnerability Assessment Case Studies in Padang City
The selected study area for this research study is located in Padang city, Indonesia. Therefore, past studies on SRA need to be reviewed in order to identify the research gap for this study area. Table 2 shows several studies that had been done by past researchers ffocusing on Padang city.
Table 2.
Seismic Risk Assessment conducted in Padang City.
There is no doubt that the research on seismic risk assessment is inadequate and out-of-date based on a study of prior related studies carried out in Padang city. In fact, research in this area on the interdependence of Critical Infrastructures (CIs) is still pending. To fill in this gap in the literature, this research study evaluated the relationships between the road network and CIs in order to give the government a quantitative tool to determine whether and how much corrective work is needed in a certain region by developing a new methodology that comprehends the questionnaire survey to add the judgmental characteristic int this model. The results are presented using a GIS mapping technique, enabling future assessments to be based on the project’s outcomes.
4. Research Methodology
Generally, the proposed methodology in this study comprises of two main phases: Data Collection phase and Seismic Risk Analysis phase. In the first phase, there are two approaches to gather the data which is by surveying existing Critical Infrastructures (CIs) and by a questionnaire survey. Following that, seismic risk analysis is performed according to the previously developed approaches by Hughes et al. [4] but in different study areas which in Padang city. Later, the main criticality mapping of roadway and respective CIs is mapped via GIS platform and the findings are discussed accordingly. The overall flowchart of this study is shown in Figure 2.
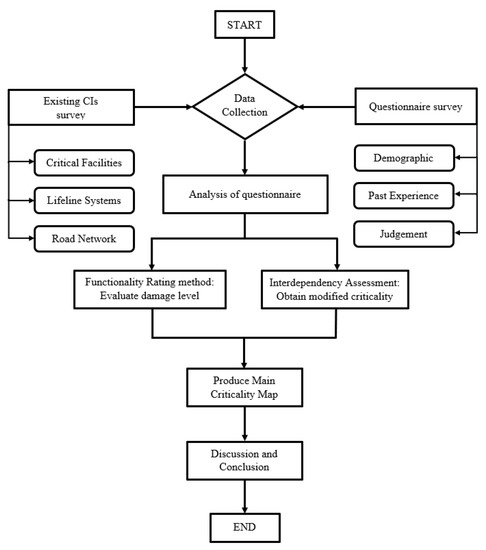
Figure 2.
Research flowchart methodology.
4.1. Site Selection
Given this research study is an urban-scaled project, the study area will not be covering the whole region of Padang city area. Instead, the most critical area is selected based on previous research about earthquake exposure by Mulyani et al. [1]. A building density map was produced that shows the building areas around the city as shown in Figure 3a. From the map, the highest building density area is selected as the most critical area since there will be more Critical Infrastructures (CIs) within the area. Figure 3b shows the location of study area focusing on a small region with a radius of 1 km.
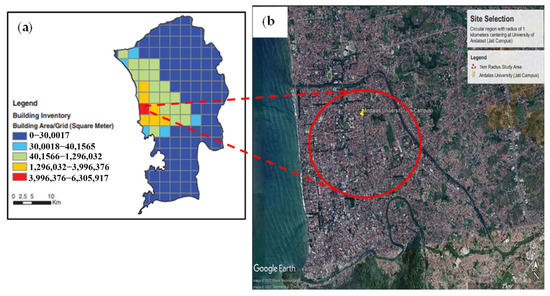
Figure 3.
(a) Building density map; and (b) Study area map.
4.2. Data Collection
4.2.1. Existing CIs Survey
Finding the current Critical Infrastructures (CIs) in Padang city is the initial step in the data gathering stage. Since this is a small-scale experiment, the study area will be centered on a restricted circular area with a 1 km radius. Within the chosen area, various CI types were discovered, including critical facilities, such as hospitals, police, fire, and ambulance stations, as well as emergency management and operations centers; lifeline systems, such as electric substations, water supplies, and telecommunications; and road networks, which serve as the primary access points to each CI’s building.
- (A):
- Target Critical Infrastructures of Survey
A total number of 19 critical facilities and lifeline systems were recognized within the selected study region. However, the lifeline systems particularly that buried underground (i.e., water supply pipeline, sewerage pipeline and telecommunication cable) were excluded from investigation as it is complicated to obtain the details of the location etc. Hence, the list and locations of the 19 infrastructures are shown in Table 3 and Figure 4 respectively.
Table 3.
List of Critical Infrastructures (CIs).
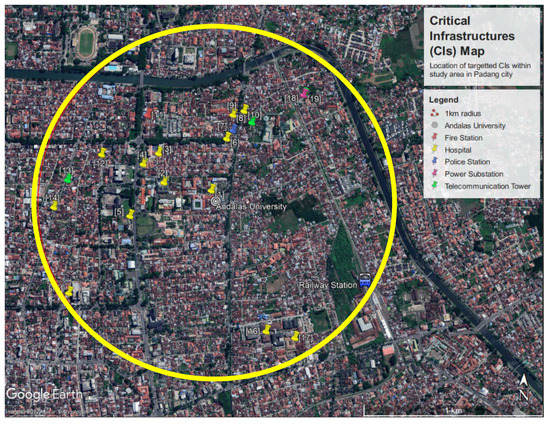
Figure 4.
Critical Infrastructures (CIs) Map.
- (B):
- Road Network of Survey
The selected study area comprises a few road networks that serve for the previously identified critical facilities and lifeline system. The road network is identified based on the road classification of Public Work Department, Indonesia which varies from State Road, Provincial Road, District Road, Urban Road, and Village Road. The higher the road hierarchy the higher the base criticality of the road. List and locations of the road network are shown in Table 4 and Figure 5, respectively.
Table 4.
List of Road Network in Padang City.
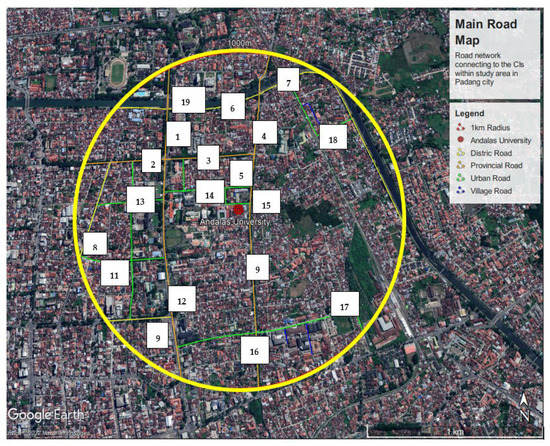
Figure 5.
Main Road Network Under Investigation.
4.2.2. Questionnaire Survey
The second part of data collection stage is by using a questionnaire survey. Due to the financial constraints and the location of the study area is far away from the researcher’s place, the screening work is done utilizing several online tools instead of traditional field survey. The original questionnaire survey was drafted in English, following the same basic format as the questionnaire surveys distributed in Indonesia in earlier research (see BPNB report [33]) and translated into Bahasa Indonesia. Following that, an online questionnaire survey is produced through Google Forms application, a free online tool that allows to collect information easily and efficiently.
Since this project is a collaboration work between Universiti Sains Malaysia, Pulau Pinang and Universitas Andalas, Padang, the online questionnaire survey is distributed to the lecturers and students, and they were asked to share or forward the survey link to their relatives and friends who stay in the same region. The questionnaire survey consisted of 27 questions that were divided into four sections: demographics, experience of earthquake event, knowledge & judgment about impact of earthquake event and community expectation on the disaster management, as summarized in Table 5. This research study expected 100 number of respondents considering this is a small-scale project where the study area only covers 1 km radius within the most densely infrastructure in Padang city.
Table 5.
List of questions asked in the online questionnaire survey.
4.3. Functionality Rating Method
The functionality rating method is used to assess the level of functionality of one structure or infrastructure and the findings can be used an indicator for level of damage. This method is a continuation from previous questionnaire survey as it is conducted on the basis of qualitative survey. Qualitative information such as the respondents’ experience and observation towards the system disruption for roadway, telecommunication tower, substation, buildings and others were used.
Consequently, a perturbation in one infrastructure may potentially affect the functionality of another infrastructure thus exacerbating the risks and vulnerabilities. Hence, it is important to evaluate the damage level and to study the pattern of cascading effect so that appropriate mitigation measure can be proposed in the propagation model.
4.4. Risk Analysis Model
In this model, the proposed seismic risk analysis approach is based on an existing framework developed by Hughes et al. [4] as highlighted in the literature before, due to incorporation of both vulnerability assessment as well as interdependencies between Critical Infrastructures (CIs), which aligned with scope of this research study. The framework consists of two modules namely Core interdependencies Module (consequences) and Additional Module (likelihood × vulnerability or combined likelihood).
4.4.1. Interdependency Assessment
The core module consists of two components and the first one is criticality assessment. According to Table 1, which shows the criticality rating that provides enough resolution for the assessment. It also includes a proposed criticality rating with some sample descriptions for a national level evaluation. These criticality descriptions might differ depending on whether the setting is local, regional, or national. The same table is used in the questionnaire survey for the respondent to judge and rate the criticality of different type of Critical Infrastructures (CIs) including hospital, fire station, police station, telecommunication tower, power substation and many more. Therefore, the “expert judgement” from the Padang city community who have experienced the earthquake event in their life is more accurate compared to self-judgement rating.
The second component of the core module, which is interdependency assessment, is divided into four interdependency typologies namely physical, digital, geographic, and organizational. However, this research focuses only on the physical CIs such as hospital, police station and any other buildings that can be seen physically in lieu of geographic CIs such as water pipeline, sewerage pipe, telecommunication cable, etc. that are buried in the ground. Hence, the physical interdependency assessment is proposed as the second component of the core module to assess the criticality and interdependency of each CIs and road network.
- (A):
- Identify interdependent relationships and develop road network chain
The first step is to identify the links and relationships among the infrastructures by expressing it using a causal chain as shown in Figure 6. The dependency dimensions (directionality and strength) are then added as attributes to each relationship, along with the base criticality. Directionality is either unidirectional or bidirectional. Meanwhile, to assess the strength of a dependency relationship, a three-level (low/moderate/high) rating is proposed, using classifications based on the New Zealand Lifelines Council (2017), as shown in Table 6.
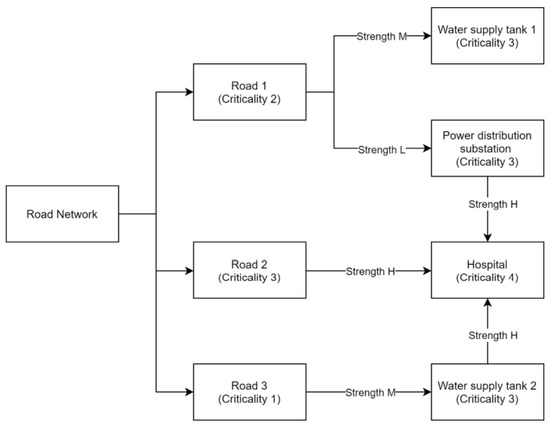
Figure 6.
Critical infrastructure dependency network.
Table 6.
Proposed strength rating.
- (B):
- Calculate dependency rating and modified criticality
This step is undertaken with interdependent pairs, working from the furthest downstream infrastructure in an upstream direction. Two sub-steps (I and II) are undertaken for each pair, prior to moving to the next upstream pair. Steps I and II are iterative, in that the dependency rating for the most-downstream infrastructure will result in a modified criticality for the next-upstream infrastructure.
- Step I:
- Calculate dependency rating
This involves developing a dependency rating based on the strength of the dependency relationship and downstream criticality, using Table 7 and Table 8.
Table 7.
Rating of dependency relationships with downstream criticality.
Table 8.
Dependency rating key.
- Step II:
- Evaluate modified criticality
Previous work by Hughes et al. [4] and Rebello et al. [34] explored an approach for assessing the criticality of roads based on the One Network Road Classification (ONRC) and the number and criticality of lifeline and essential services that are accessed by the road. Meanwhile, this research proposes a modified criticality score for a given infrastructure, based on the dependency rating (step II) and the total number of downstream dependencies as shown in Table 9.
Table 9.
Modified criticality rating based on dependency relationships with downstream infrastructures.
4.4.2. Main Criticality Mapping
The final part of the methodology is to produce main criticality maps based on the Interdependency and Criticality ratings result. The analyzed results were presented through GIS mapping via the availability GIS platform to visualize the interdependency relationship and criticality between each Critical Infrastructures (CIs). In this study, Google Map was chosen as part of methodology tool because it is a free but complete cloud-based GIS mapping software and were made public and accessible by everyone to provide a foundation for further studies whichever related.
5. Results and Discussion—Overview
In this section, there are two types of results to be presented and discussed based on the two objectives of this research study. Firstly, the results from the online questionnaire survey that has achieved the expected number of respondents which is 100 people. These results are presented in Section 5.1 comprising tables, graph, pie chart, etc. Following that, the damage level of structure and infrastructure based on functionality rating method is discussed further in Section 5.2. For the second objective, the final output of the physical interdependency assessment is tabulated and discussed in Section 5.3. Subsequently, a criticality map is produced to visualize the interdependency relationship and criticality between each infrastructure.
5.1. Questionnaire Survey Outcomes
The questionnaire comprises of four sections and a total of 27 questions; 5 are related to demographics; 14 to past earthquake experience; 6 to knowledge and judgment towards earthquake event and its impact; and 2 related to community expectation on disaster mitigation by the government.
5.1.1. Demographics
A summary of the respondents’ demographic characteristics is presented in Table 10, showing that the proportion of males and females was similar which is 49% and 51% respectively. Apart from that, most of the respondents are between 20–29 years old (53%), followed by the age group <19 years old (30%), 30–39 years old (8%), 40–49 years old (6%), and 50–59 years old (3%). This is due to the approach used in this study where the questionnaire was distributed to the communities located in Padang city.
Table 10.
Demographic characteristics surveying summary.
As a result, majority of the respondents’ occupation is actually students (61%) leaving a huge difference with other occupations sector such as school and office (11%) respectively, followed by government sector (6%), industry sector (2%) and finally other sector with only (1%) including hospital, entrepreneur, freelancer, laborer, Non-Government Organization, NGO, etc. Moreover, the main education level of respondents is tertiary education which is university level (87%) while the rest is from secondary education (13%). Educational level is a very important factor in this study as the respondents’ knowledge and judgement is vital in order to provide the most accurate answers for Likert scale questions or rating questions.
Finally, the respondents were asked their location during the earthquake event happened, or their place of residence in Padang city. Various districts were identified within Padang city based on the respondents’ location and were illustrated in a dot density map together with the study area region as shown in Figure 7. According to the map, 39% of the respondents were within the study area region. 13% of the respondents’ location were at the coastal area which was the most hazardous or exposed area to tsunami (post-event from earthquake). Besides, 72% of them stay in the Padang city region while the other 28% stay outside of Padang. This may be due to some students who migrate or travel from their hometown to Andalas University for studies and have not experienced earthquake yet. The numbers in the figures represents the respondents numbers in each investigated area.
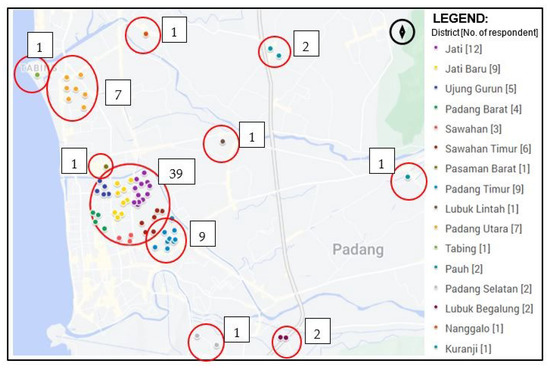
Figure 7.
Dot density map of respondents’ location.
5.1.2. Past Earthquake Experience
The majority of respondents (87%) confirmed that they experienced the Padang earthquake 2009 or any other event that struck their community while the remaining were not sure if it was an earthquake (6%) and have not experienced it at all (7%). This is because some of them may not be in the scene at that time, or their location is far away from Padang city (since the respondents are mainly students that comes in different background of places). First of all, respondents were asked if there was any warning by the authorities prior to the event. Unfortunately, half of them (50%) agreed that there is no warning, 25% received the warning while the other 25% were not sure about this matter. Not only that, almost half of the respondents (53.5%) stated that they did not receive any rescue during the event, while the remaining (46.5%) responded have received help but with an unsatisfactory time arrival. For instance, only 5% received a rescue within less than 10 min, while the other 45% experienced longer rescue team time arrival ranging from 10 to 30 min or more.
On top of that, 57.1% of the respondents did not evacuate to evacuation place during the earthquake incident, while only 42.9% of respondents evacuated. For the people who evacuated, about 35.2% people needed less than 10 min to reach evacuation area, while others took 10–15 min (25.3%), 15–30 min (18.7%) and more than 30 min (20.9%). This may be due to the challenges faced by the respondents during evacuation including congestion on road (22.9%), leading to nowhere to go (15.6%), no connection of network for communication (28.1%), looking for their relatives during the critical time (27.1%), do not know how to ask for a help (3%) and what to bring long during the critical time (6%).
Secondly, the respondents were asked about their observation of the Critical Infrastructures (CIs) during an earthquake event. Most of the respondents (83.7%) indicated that a shortage of phone signal and internet connection was the most observed damage that happened in the city. This was the result of the electricity outage (15.3%) and telecommunication towers damaged or collapsed (31.6%) during the hazard. Meanwhile, only a few of them (15.3%) witnessed water pipeline burst or water tank damage.
Apart from that, the respondents were also asked about the severity of building damage due to the seismic event. According to the answers, there was only minor damage whereas partial collapse occurred in the outer walls and/or a part of the roof, but the building still stood on the whole (34.3%) and the building is not affected and did not collapse (25.3%). However, there were some buildings collapsed in the outer walls, but the building still stood on the whole (16.2%), the building collapsed partially and lost part of its inner space (14.1%) and there were also cases where the building collapsed completely (10.1%).
For the 26% of respondents who were outdoor during the earthquake, and were using a motor vehicle, many of them did not feel the earthquake (25.9%) or uncertain either it was an earthquake from the ground shaking since they were in the motor vehicle (37.9%). Besides, some of them thought that there was a problem such as a flat tire (12.1%) or feel that it was difficult to keep driving (15.4%). In fact, only (5.2%) of the respondents were sure that an earthquake happened by feeling of ground shaking inside their vehicle.
Lastly, when they were asked about the road condition during the earthquake, many people (43%) observed that there was no damage occurred or only slight damage happened where motor vehicles still manage to proceed at normal speed (30%). As evidence, majority agreed that only minor cracks were formed (50%) and there is no deformation at all (39%) when they were asked about ground deformation due to the earthquake. Nevertheless, there was also medium damage that occurred leading to motor vehicles had to slow down often (17%) while the remaining (10%) was a major damage, where motor vehicles were not able to pass through and the road was closed entirely. This is proven where there were cracks as wide as a foot (7%) or a body (4%) formed in the ground.
5.1.3. Knowledge and Judgment
This section is the most important part as it consists of rating type question that requires respondents’ judgement in order to answer the question. The judgement from the experts (community who have experienced the earthquake) is very useful in the analysis stage, such as infrastructure criticality rating, probability of exceedance, damage level, etc. Therefore, the reliability and accuracy of the results is improved rather than self-judgement rating.
First of all, the respondents were asked to rate the probability of exceedance for an earthquake to strike the community of Padang city between rare (1) to very likely (5) as shown in Figure 8. The results indicated most answers are very likely (32%), likely (31%) and moderate (28%). Since there is no detailed description provided to the respondents, it is difficult for them to rate accordingly. This result to the top three answers having almost same percentage while the few respondents that answered unlikely (5%) and rare (4%) is due to their location out of an earthquake active region, based on the respondents’ population distribution map shown earlier.
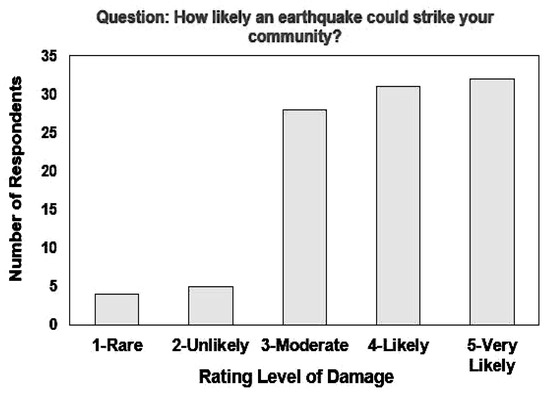
Figure 8.
Rating level of damage of Padang community due to past earthquakes based on judgements and knowledge of the respondents.
Unlike the first question, Figure 9 provided the respondents in the second question to rate the level of damage caused by Padang earthquake in 2009. Consequently, more reliable answers of majority of the respondents were obtained in which (41%) rated the damage score as ‘4-significant’. Meanwhile, the remaining rate of the damage as ‘5-extreme’ (29%), ‘3-major’ (25%), and the few that answered ‘2-moderate’ (3%) and ‘1-minor’ (2%) has probably stayed at least affected area during the earthquake event.
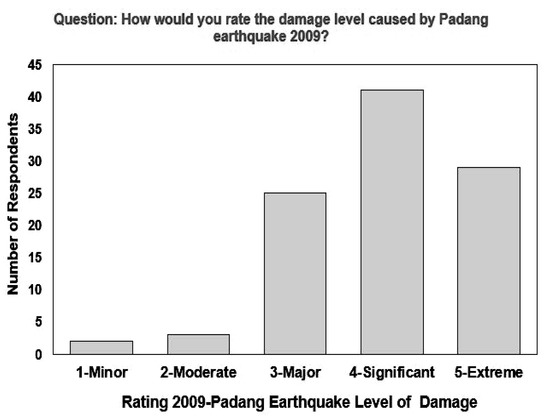
Figure 9.
Rating 2009-Padang earthquake level of damage on the community based on judgements and knowledge of the respondents.
The last question for the judgement part is to rate some of the critical facilities that shall be prioritized due to the earthquake event as shown in Figure 10. The rate is between ‘1-minimal’ to ‘5-vital’ with a detailed description table given to help the respondents in answering this question. Majority of respondents judged hospital (49%), Emergency operation center (39%), Power substation (34%), Water supply tank (39%), and telecommunication tower (38%) as ‘5-vital’ while police station (42%) and fire station (30%) was rated as ‘3-medium’ important of critical facilities.
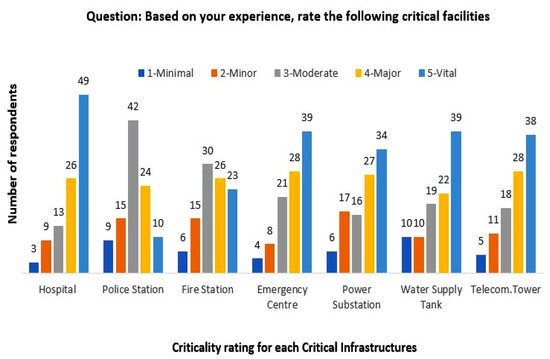
Figure 10.
Criticality rating for the investigated infrastructures.
The next part of this section is knowledge question which is about the preparation by the government to mitigate this issue. The majority of respondents (83%) indicated that there is a risk reduction plan to mitigate the impact of natural disaster by the government. Most of them agreed that they were informed about the possible earthquake event from the ‘Badan Meteorologi, Klimatologi dan Geofisika’ with 71% of respondents. Apart from that, the respondents also indicated there is a warning siren prior to the natural hazard event (64%) and those who did not hear the sign (36%) may be due to the electricity outage or they stay far away from the source of sound as shown in Figure 11.
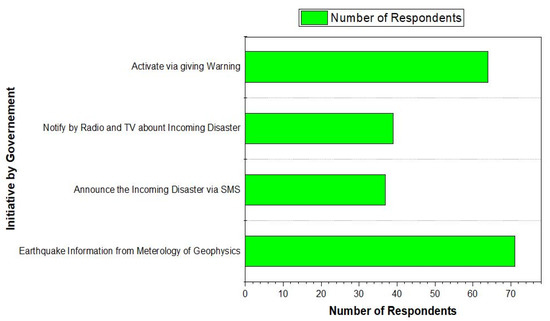
Figure 11.
Initiative by the government to warn the communities.
Besides, there is also a warning news through radio and television (39%) and warning via text message on a cell phone (37%). Based on these numbers, it can be said that these approaches were not done effectively as many people should receive this type of warning since almost everyone owns a smartphone or listens to radio while driving or watching the news on television. Moreover, police/security officers, print media, place of worship and community leaders shall be improved in the future as only (<30%) of respondents receive this source of disaster warning. Overall, the recent risk reduction plan shall be improved particularly in ensuring maximum number of people to receive an early warning for evacuation since the exposure is not at a satisfactory level yet.
5.1.4. Community Expectation
The final section of the questionnaire discusses the community’s expectation of disaster management by the government or respective agency DURING and AFTER the earthquake event. There are six expectation items that were asked to the respondents and need to be rated from very low to very high in a Likert scale type of question.
According to the results that are illustrated in Figure 12, most of the respondents were having very high expectations for all the items which are fast relocation of victims, fast expected time arrival of the rescue team, early warning system, better coordination during a disaster, better safety arrangement, and more financial support by the government. However, the number of expectations for financial support are increasing between during event (32%) and post-event (41%). This is due to the consequences faced by the community after the event being higher where they need additional support in order to survive back from the earthquake disruption.
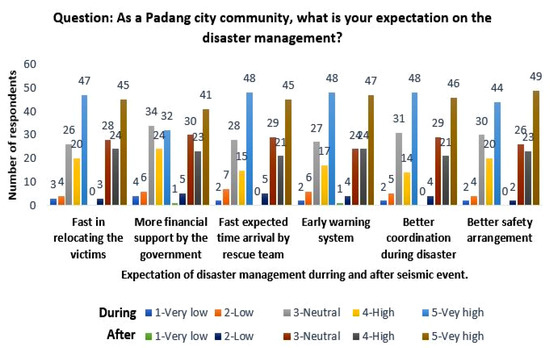
Figure 12.
Initiative by the government to warn the communities.
5.2. Damage Level of Investigated Structure and Infrastructure
This section presents the damage level of structure and infrastructure by using functionality rating method on the basis of a qualitative survey. First of all, the results for Critical Infrastructures (CIs) including electricity supply outage, water supply outage, phone signal and internet connection outage are shown in Figure 13.
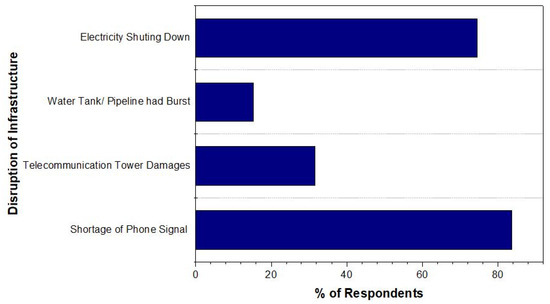
Figure 13.
Critical infrastructure damage based on the respondents’ observations.
For critical infrastructure, most of the respondents (83.7%) indicated that a shortage of phone signal and internet connection was the most observed damage happened in the city. Therefore, the level of loss functionality is ‘High’ since it is more than 50% but less than 100%. This was the result of telecommunication towers that have been damaged or collapsed based on the observation of (31.6%) of respondents. Moreover, the level of loss functionality for electricity supply is also ‘High’ since (74.5%) of respondents experienced an electricity outage during the earthquake event. On the other hand, water supply systems experience a ‘Moderate’ level of loss functionality due to the minor percentage (15.3%) of the respondent that witnessed water pipelines burst or water tank damage.
For roadway, the level of damage varies depending on the accessibility of road whether vehicles drive through or not. For instance, the percentage of respondents that answered for no damage (43%), slight damage (30%), medium damage (17%) and heavy damage (4%), but for all of these cases motor vehicles still can pass through the road. Meanwhile, the remaining (6%) indicates that serious damage has occurred causing motor vehicles cannot move and thus affecting the functionality of the roadway. Therefore, the level of loss functionality for roadway is considered as ‘Low’. Figure 14 shows the statistics of roadway damage based on the respondents.
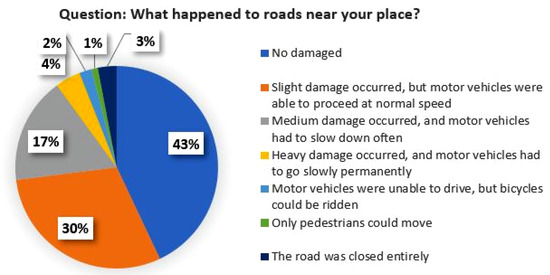
Figure 14.
Roadway damages survey outcomes.
Finally, building damage is evaluated depending on the building’s overall stability. According to the observation, minor damage happened to the outside walls and/or part of the roof, but the building still survived (34.3%) and the building is not affected and did not collapse (25.3%). However, there were some buildings that collapsed in the outer walls, but the building still stood on the whole (16.2%), the building collapsed partially and lost part of its inner space (14.1%) and there were also cases where the building collapsed completely (10.1%). The level of functionality loss for building structures is ‘Moderate’ since more than 20% of respondents reported substantial damage to buildings, compromising their functionality and serviceability. Figure 15 shows the statistics of structural damages of buildings based on the respondents.
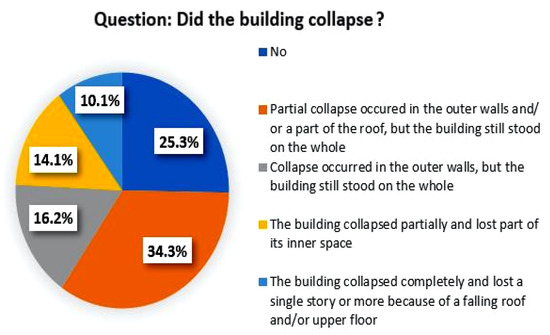
Figure 15.
Building damages surveyed outcomes.
After all, assessment of outage level allows an understanding of which infrastructures are operational, at what capacity, and for how long, given the loss of dependent infrastructure. From these findings, different types of risk mitigation options can be practiced in a way to provide temporary relief and to prevent an immediate shutdown of infrastructure due to loss of an upstream dependent infrastructure.
5.3. Seismic Risk Analysis Model
5.3.1. Infrastructure Dependents
The first step begins with assessing physical interdependencies, identifying the links and relationships among the infrastructures, expressed using a causal chain as shown in Figure 16. The dependency dimensions (directionality and strength) are then added as attributes to each relationship, along with the base criticality. To assess the strength of a dependency relationship, a three-level (low/moderate/high) rating is proposed, using classifications based on the New Zealand Lifelines Council (2017), refer Table 7.
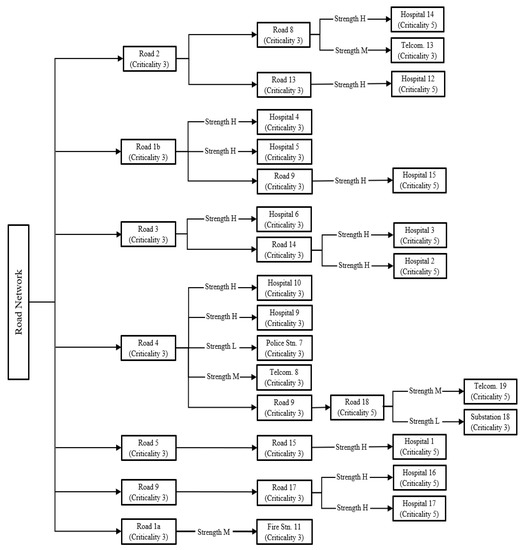
Figure 16.
Infrastructure dependency network as a causal chain for this study.
5.3.2. Dependency Rating and Evaluating Criticality
This step comprises two sub-steps (A: Calculating dependency rating and B: Evaluate modified criticality) that are undertaken for each pair, prior to moving to the next upstream pair as explained in Section 4.4.1. The results of the analysis are presented in Table 11.
Table 11.
Dependency rating and modified criticality output.
5.3.3. Main Criticality Mapping
The spatial data for each infrastructure type listed are characterized with criticality ratings from 1 (minor) to 5 (vital) and then mapped as shown in Figure 17. Based on the map, it reflects the base criticality for each critical infrastructure and the road networks within the study area. For critical infrastructure, the base criticality is characterized based on respondents’ judgement while the road networks are based on the road hierarchy as per Indonesian Public Work Department. Through applying the proposed approach for assessing physical interdependencies, the output modified criticality (refer Table 11) is presented as main criticality mapping shown in Figure 18.
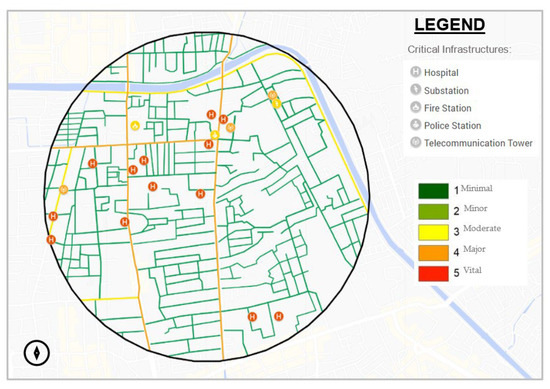
Figure 17.
Physical Interdependency Assessment with corresponding base criticality.
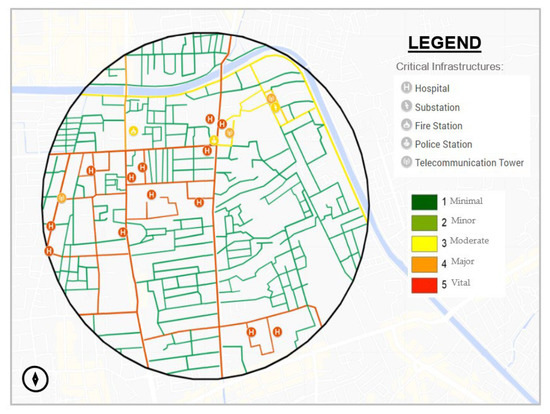
Figure 18.
Modified criticality rating.
In this analysis, there are seven road networks where the main route to each Critical infrastructure is identified including hospital, telecommunication tower, police station, fire station, and substation. The output of this interdependency assessment is the modified criticality where it reflects the influence of the interdependency relationship on the base criticality of an upstream infrastructure.
As presented in Table 11, in all cases the modified criticality of the upstream infrastructure (roadway) increases due to the higher criticality of the hospital and high strength of the dependencies. This, in turn, produces a greater modified criticality than the base criticality for each of the dependent infrastructures. For example, the high strength between Road 8 (C3) and Hospital 14 (C5) gives a dependency rating of 5 while, a medium strength relationship between Road 8 (C3) and Tower 13 (C4) results in dependency rating of 3. Since there are two dependencies for Road 8, a maximum dependency rating of 5 is related to the number of downstream infrastructures, which is 2, gives a modified criticality of 5 for upstream infrastructures, Road 8. On the other hand, for Road 1a (C4), which does not serve the hospital but Fire station 11 (C3) only, the dependency rating is only 2. This is due to a medium-strength relationship between both infrastructure and moderate criticality of the fire station. Nevertheless, the modified criticality for Road 1a is maintained with its base criticality which is ‘4-major’ since it is a highway road.
Following the calculation of each infrastructure’s modified criticality due to dependencies, the wider adjacent road network is then augmented (Refer Section 4.3). This is to ensure the criticality of any road segment along the shortest path, from the modified segment to the highest-criticality road, is equal to or greater than the modified segment. In the map, this occurs for the roads near the hospital, where all minor roads that provide access to the hospital were extended their base criticality. Apart from that, this also occurs for road that provide access to the communication tower 19, which is calculated to have a modified criticality of 3. Subsequently, the minor route that connects Road 4 and Road 18 is extended to the same modified criticality.
At the end, a criticality map is produced showing criticality of roadway and other investigated CIs based on the interdependency relationship between each of the infrastructures. There are five levels of criticality from ‘1-minimal’ to ‘5-vital’, where the most critical infrastructure shall be prioritized for full access and functionality during earthquake. For instance, a main route to a hospital requires a good resilience towards earthquake to ensure full functionality for the support the risk treatment responses by the emergency response teams. Therefore, few mitigations option can be introduced to the most critical infrastructure to improve the robustness of infrastructure such as improving asset designs or materials, construct a system that can fail safely, provide an alternative route or on-site backup and improve emergency management process.
6. Conclusions
This study used an online questionnaire in Padang, Indonesia, a disaster-prone location. The 27-question survey was divided into four sections: demographics, earthquake experience, knowledge & judgment regarding impact, and community disaster management expectations. The questionnaire’s framework helps evaluate structure and infrastructure damage and identify Critical Infrastructures (CIs) for examination.
According to a qualitative survey, 83.7% of respondents said a lack of phone signal and internet was the city’s worst problem. During the earthquake, 74.5% of respondents lost power and 15.3% observed water pipes burst or water tanks damaged. The level of outage/loss functionality is then rated to determine the damage. As a result, telecommunication tower and substation loss functionality are ‘High’ while water supply system loss functionality is ‘Moderate’.
Then, a seismic risk analysis was undertaken to analyze the interdependency of the hospital, police station, fire station, substation, tele-communication tower, and roads. Respondents’ judgments were utilized to determine each infrastructure’s base criticality. Hospitals, power substation, and telecommunication tower were rated ‘5-Vital,’ while police station and fire station were ‘3-medium’ The investigation found seven road networks that lead to important infrastructure. Overall, the modified criticality of the upstream infrastructure (roadway) increases due to the hospital’s criticality and dependencies.
This interdependency assessment produces a modified criticality map that shows how interdependencies affect an upstream infrastructure’s basic criticality. This improves understanding of infrastructure failure, especially for dependent infrastructures. This knowledge, together with an understanding of environmental hazards and asset vulnerabilities, can help emergency response teams treat risks. Improved community resilience promotes SDG 11: Sustainable cities and communities by reducing disasters and vulnerable people.
Author Contributions
Conceptualization and Methodology: M.M.K. and F.M.N.; investigation, M.M.K., A.M.E.-M. and M.M.; writing—original draft preparation, F.D.S. and M.M.K.; writing—review and editing, A.M.E.-M. and F.D.S.; visualization, S.R.R. and M.M.; supervision, F.M.N. All authors have read and agreed to the published version of the manuscript.
Funding
This research was supported by the Ministry of Higher Education Malaysia for Fundamental Research Grant Scheme with project code: FRGS/1/2020/TK02/USM/02/1.
Institutional Review Board Statement
Not applicable.
Informed Consent Statement
Not applicable.
Data Availability Statement
Not applicable.
Conflicts of Interest
The authors declare no conflict of interest.
References
- Mulyani, R.; Ahmadi, R.; Pilakoutas, K.; Hajirasouliha, I. A multi-hazard risk assessment of buildings in Padang city. Procedia Eng. 2015, 125, 1094–1100. [Google Scholar] [CrossRef][Green Version]
- Laugé, A.; Hernantes, J.; Sarriegi, J.M. The role of critical infrastructures’ interdependencies on the impacts caused by natural disasters. In International Workshop on Critical Information Infrastructures Security; Springer: Berlin/Heidelberg, Germany, 2013; pp. 50–61. [Google Scholar]
- Wilkinson, S.; Alarcon, J.; Mulyani, R.; Whittle, J.; Chian, S. The Padang Sumatra-Indonesia Earthquake of 30 September 2009. Nat. Hazards 2009, 63, 521–547. [Google Scholar] [CrossRef]
- Hughes, J.F.; Wild, A.J.; Muzyk, C. Developing a Method for Quantifying Transport Interdependencies; Waka Kotahi= NZ Transport Agency: Wellington, New Zealand, 2020. [Google Scholar]
- Council, N.Z.L. New Zealand Lifelines Infrastructure Vulnerability Assessment: Stage 1. 2017. Available online: https://www.civildefence.govt.nz/assets/Uploads/lifelines/National-Vulnerability-Assessment-Stage-1-September-2017.pdf (accessed on 19 November 2022).
- Brunsdon, D. Critical infrastructure and earthquakes: Understanding the essential elements of disaster management. Wellingt. N. Z. Natl. Lifelines Coord. 2003, 28, 1–7. [Google Scholar]
- Mualchin, L. Seismic hazard analysis for critical infrastructures in California. Eng. Geol. 2005, 79, 177–184. [Google Scholar] [CrossRef]
- Mon, K.A.; Kyaw, K.; San, Z.M.L.T.; Kiyono, J.; Koike, T.; Htet, A.; Aye, C.N.; Oo, Y.N. Seismic Risk Analysis for Critical Infrastructure: The Case Study of a Medical Center and its Supporting Systems in Yangon, Myanmar. In Proceedings of the Third International Conference on Civil Engineering Research (ICCER), Surabaya, Indonesia, 1–2 August 2017. [Google Scholar]
- Baker, J.W. Quantitative classification of near-fault ground motions using wavelet analysis. Bull. Seismol. Soc. Am. 2007, 97, 1486–1501. [Google Scholar] [CrossRef]
- Ventura, C.; Garcia, H.J.; Thibert, K.; Martí, J.; Hollman, J. Mapping of Interdependencies through Integrated Hazard 1080 Analysis: Study Case of a Canadian University Campus. In Proceedings of the 14th World Conference on Earthquake Engineering, Beijing, China, 12–17 October 2008; pp. 12–17. [Google Scholar]
- Argyroudis, S.A.; Mitoulis, S.A.; Hofer, L.; Zanini, M.A.; Tubaldi, E.; Frangopol, D.M. Resilience assessment framework for critical infrastructure in a multi-hazard environment: Case study on transport assets. Sci. Total Environ. 2020, 714, 136854. [Google Scholar] [CrossRef] [PubMed]
- Wang, Z. Seismic hazard vs. seismic risk. Seismol. Res. Lett. 2009, 80, 673–674. [Google Scholar] [CrossRef]
- Hosseinpour, V.; Saeidi, A.; Nollet, M.-J.; Nastev, M. Seismic loss estimation software: A comprehensive review of risk assessment steps, software development and limitations. Eng. Struct. 2021, 232, 111866. [Google Scholar] [CrossRef]
- Kamranzad, F.; Memarian, H.; Zare, M. Earthquake risk assessment for Tehran, Iran. ISPRS Int. J. Geo-Inf. 2020, 9, 430. [Google Scholar] [CrossRef]
- Okazaki, K.; Villacis, C.; Cardona, C.; Kaneko, F.; Shaw, R.; Sun, J.; Masure, P.; Mouroux, P.; Martin, C.; Davidson, R. RADIUS: Risk assessment tools for diagnosis of urban areas against seismic disasters. In RADIUS: Risk Assessment Tools for Diagnosis of Urban Areas against Seismic Disasters; United Nations University Press: Tokyo, Japan, 2000; p. 38. [Google Scholar]
- Davidson, R. EERI annual student paper award a multidisciplinary urban earthquake disaster risk index. Earthq. Spectra 1997, 13, 211–223. [Google Scholar] [CrossRef]
- Mulyani, R. Extended Framework for Earthquake and Tsunami Risk Assessment: Padang City a Case Study. Ph.D. Thesis, University of Sheffield, Sheffield, UK, 2013. [Google Scholar]
- Kythreoti, S. Earthquake Risk Assessment and Management: Case Study; Cyprus. Ph.D. Thesis, University of Sheffield, Sheffield, UK, 2002. [Google Scholar]
- Khan, S. An Earthquake Risk Assessment Framework for Developing Countries: Pakistan a Case Study. Ph.D. Thesis, University of Sheffield, Sheffield, UK, 2011. [Google Scholar]
- Mili, R.R.; Hosseini, K.A.; Izadkhah, Y.O. Developing a holistic model for earthquake risk assessment and disaster management interventions in urban fabrics. Int. J. Disaster Risk Reduct. 2018, 27, 355–365. [Google Scholar] [CrossRef]
- Sauti, N.S.; Daud, M.E.; Kaamin, M.; Sahat, S. GIS spatial modelling for seismic risk assessment based on exposure, resilience, and capacity indicators to seismic hazard: A case study of Pahang, Malaysia. Geomat. Nat. Hazards Risk 2021, 12, 1948–1972. [Google Scholar] [CrossRef]
- Sun, L.; D’Ayala, D.; Fayjaloun, R.; Gehl, P. Agent-based model on resilience-oriented rapid responses of road networks under seismic hazard. Reliab. Eng. Syst. Saf. 2021, 216, 108030. [Google Scholar] [CrossRef]
- Omar, M.A.I.; Matsuyuki, M.; Das, S.; Ubaura, M. An assessment of physical aspects for seismic response capacity in Dhaka, Bangladesh. Prog. Disaster Sci. 2021, 10, 100175. [Google Scholar] [CrossRef]
- Kijko, A. Introduction to Probabilistic Seismic Hazard Analysis/Encyclopedia of Solid Earth Geophysics; Springer: Berlin/Heidelberg, Germany, 2011. [Google Scholar]
- Bommer, J.J.; Abrahamson, N.A. Why do modern probabilistic seismic-hazard analyses often lead to increased hazard estimates? Bull. Seismol. Soc. Am. 2006, 96, 1967–1977. [Google Scholar] [CrossRef]
- Putra, A.N.; Nita, I.; Al Jauhary, M.R.; Nurhutami, S.R.; Ismail, M.H. Landslide Risk Analysis on Agriculture Area in Pacitan Regency in East Java Indonesia Using Geospatial Techniques: 10.32526/ennrj/19/2020167. Environ. Nat. Resour. J. 2021, 19, 141–152. [Google Scholar] [CrossRef]
- Permana, M.A. Probabilistic Seismic Hazard Analysis in Northern Sumatera. J. Neutrino J. Fis. Dan Apl. 2018, 11, 21–31. [Google Scholar]
- Cutter, S.L. The vulnerability of science and the science of vulnerability. Ann. Assoc. Am. Geogr. 2003, 93, 1–12. [Google Scholar] [CrossRef]
- Birkmann, J. Data, indicators and criteria for measuring vulnerability: Theoretical bases and requirements, 2nd ed. In Measuring Vulnerability to Natural Hazards—Towards Disaster Resilient Societies; United Nations University Press: Tokyo, Japan, 2013; pp. 80–106. [Google Scholar]
- Rosyidi, S.A.P.; Aldiamar, F.; Faizal, N.; Taha, M.R. Lesson Learned from Road Infrastructure Deterioration Caused by Earthquake 7.6 MW and 6.2 MW Padang, September 30, 2009. In Advances in Unsaturated Soil, Geo-Hazard, and Geo-Environmental Engineering; ASCE: Reston, VA, USA, 2011; pp. 180–187. [Google Scholar]
- Husrin, S.; Kongko, W.; Putera, A. Tsunami Vulnerability of Critical Infrastructures in the City of Padang, West Sumatera. In Proceedings of the Second International Conference on Sustainable Infrastructure and Built Environment, Bandung, Indonesia, 19–20 November 2013. [Google Scholar]
- Kusumastuti, R.D.; Husodo, Z.A.; Suardi, L.; Danarsari, D.N. Developing a resilience index towards natural disasters in Indonesia. Int. J. Disaster Risk Reduct. 2014, 10, 327–340. [Google Scholar] [CrossRef]
- BNPB. National Assessment Report on Disaster Risk Reduction 2013, Redefining Indonesian Disaster. 2013. Available online: https://www.bnpb.go.id/uploads/migration/pubs/573.pdf (accessed on 19 August 2022).
- Rebello, K.; Jaggi, K.; Costello, S.; Blake, D.; Oo, M.; Hughes, J.; Egbelakin, T. Testing a criticality framework for road networks in Auckland, New Zealand. Int. J. Disaster Resil. Built Environ. 2020, 10, 36–51. [Google Scholar] [CrossRef]


Publisher’s Note: MDPI stays neutral with regard to jurisdictional claims in published maps and institutional affiliations. |
© 2022 by the authors. Licensee MDPI, Basel, Switzerland. This article is an open access article distributed under the terms and conditions of the Creative Commons Attribution (CC BY) license (https://creativecommons.org/licenses/by/4.0/).