1. Introduction
The livestock industry is an important part of China’s socio-economic system and plays an important role in the development of the national food, medicine and textile industries, the improvement of the livelihood and living standards of households, the supply of important agricultural products and food security, etc. [
1]. As a large livestock-producing country, China has two major types of livestock breeding, namely agricultural livestock breeding with grain-consuming livestock species and pastoral livestock breeding with herbivorous livestock species, and has formed six major pastoral areas in Inner Mongolia, Xinjiang, Tibet, Qinghai, Gansu and Sichuan. Due to the diverse economic and cultural geographic regions in China, livestock breeds are also very rich, mainly including domestic poultry breeding such as cattle, horses, donkeys, pigs, sheep, chickens and wild economic animal domestication, such as deer and mink. In terms of regional characteristics of famous livestock breeds, there are mainly varieties of Altai big-tailed sheep, Hotan sheep, Ili horses, Tibetan yaks, Hequ horses and Nanyang Yellow cattle. For the development of animal husbandry, China’s Central Document No. 1 of each year has focused on it and introduced special policies. At the same time, each province and region has also formulated corresponding development plans and other regulatory documents and institutional measures according to their own regional realities. With the restructuring of the agricultural economy and the continuous improvement of the industrialization level of the livestock industry, the spatial division of productivity in China’s livestock industry has made great progress in terms of scale and specialization [
2], especially with the production of most livestock breeds showing obvious characteristics of spatial and temporal migration, and thus the production pattern of the livestock industry has also changed.
Several studies have been conducted in the academic community on the productivity layout of China’s livestock industry, focusing on areas such as geographical agglomeration, regional layout, production structure optimization and large-scale production. Studies on the production layout of individual livestock species or livestock products have involved meat sheep [
3], egg-laying hens [
4], pigs [
5,
6] and wool [
7], and the findings collectively reveal that socioeconomic factors have gradually become an important force influencing changes in the production layout of livestock products in China. With regard to livestock production, scholars have studied the factors influencing livestock production patterns. Some scholars have argued that climate change will have a greater impact on the development of livestock industry [
8,
9,
10]. Specifically, higher temperatures and increased precipitation can lead to an increase in grazing intensity, and higher temperatures can lead to a decrease in grazing income [
11], improving the adaptive capacity of households to effectively cope with weather extremes [
12,
13], and pastoralists usually choose to migrate to enhance resilience to risks [
14], which in turn leads to changes in livestock production patterns. Other scholars have studied the production pattern of livestock from the perspective of livestock productivity. Han measured the environmental total factor productivity of China’s livestock industry from 2001–2017 using data envelopment analysis. The study demonstrates that the environmental total factor productivity of livestock industry is influenced by the level of farmers’ income and the level of environmental management [
15]. Further, Han used a spatial Durbin model to conclude that livestock industry layout and specialization were mainly influenced by livestock area, income level and mechanization level, while policy effects did not play a role [
16]. However, Liu argued that grassland incentive policies, on the other hand, affect livestock numbers and contribute to the improvement of grassland conditions [
17]. At the same time, environmental protection policies related to animal husbandry also affect the dynamics of livestock location, and the relatively weak environmental controls in northern and less-developed areas of China [
18] and the high number of livestock production enterprises have also resulted in serious soil and water pollution [
19]. However, with the continuous practice of the new development concepts and high-quality development, the livestock production pattern pays more attention to structural, green and coordinated development issues [
20]. On the one hand, the current crude land approach is no longer able to meet the needs of green development, and its resulting degradation of grassland and changes in greenhouse gases constrain the sustainable development of animal husbandry [
21]. On the other hand, relevant studies on the productivity layout or production pattern evolution of China’s livestock industry have lagged behind in the academic community [
22], resulting in the inability to grasp the dynamics of the evolution of China’s livestock production pattern completely and effectively, which in turn has insufficient support for the adjustment and optimization of the productivity layout of China’s livestock industry.
Based on the productivity layout theory, this paper uses the center of gravity shift model, industry concentration index, location Gini coefficient and the construction of binary structure balance index to explore the spatial and temporal characteristics of the changing production pattern of China’s livestock industry from 1995 to 2020. At the same time, it clarifies the inner change pattern of production layout of various livestock products, grasps the changing characteristics of the livestock production pattern, and puts forward corresponding countermeasure suggestions in order to provide some theoretical reference for China’s livestock industry to deeply practice the new development concept, deepen the supply-side structural reform, strengthen the spatial division of labor and optimization and its policy formulation under the new era conditions.
The marginal contributions of this paper are mainly in two aspects: first, in terms of research methodology, the binary structure equilibrium index is constructed to reveal the degree of balanced development of productivity between herbivorous and grain-consuming animal husbandry from the intrinsic structure level. Second, in terms of research content, the spatial and temporal characteristics and evolutionary laws of the production pattern of China’s animal husbandry and various livestock products are revealed from the multi-dimensional levels of production center of gravity, geographic agglomeration, regional layout and production structure, and the optimization path of China’s animal husbandry production pattern is further proposed to provide theoretical basis and policy reference for the strategic adjustment of China’s animal husbandry productivity layout.
4. Spatial and Temporal Evolutionary Characteristics of China’s Livestock Production Pattern
4.1. Analysis of Production Center of Gravity
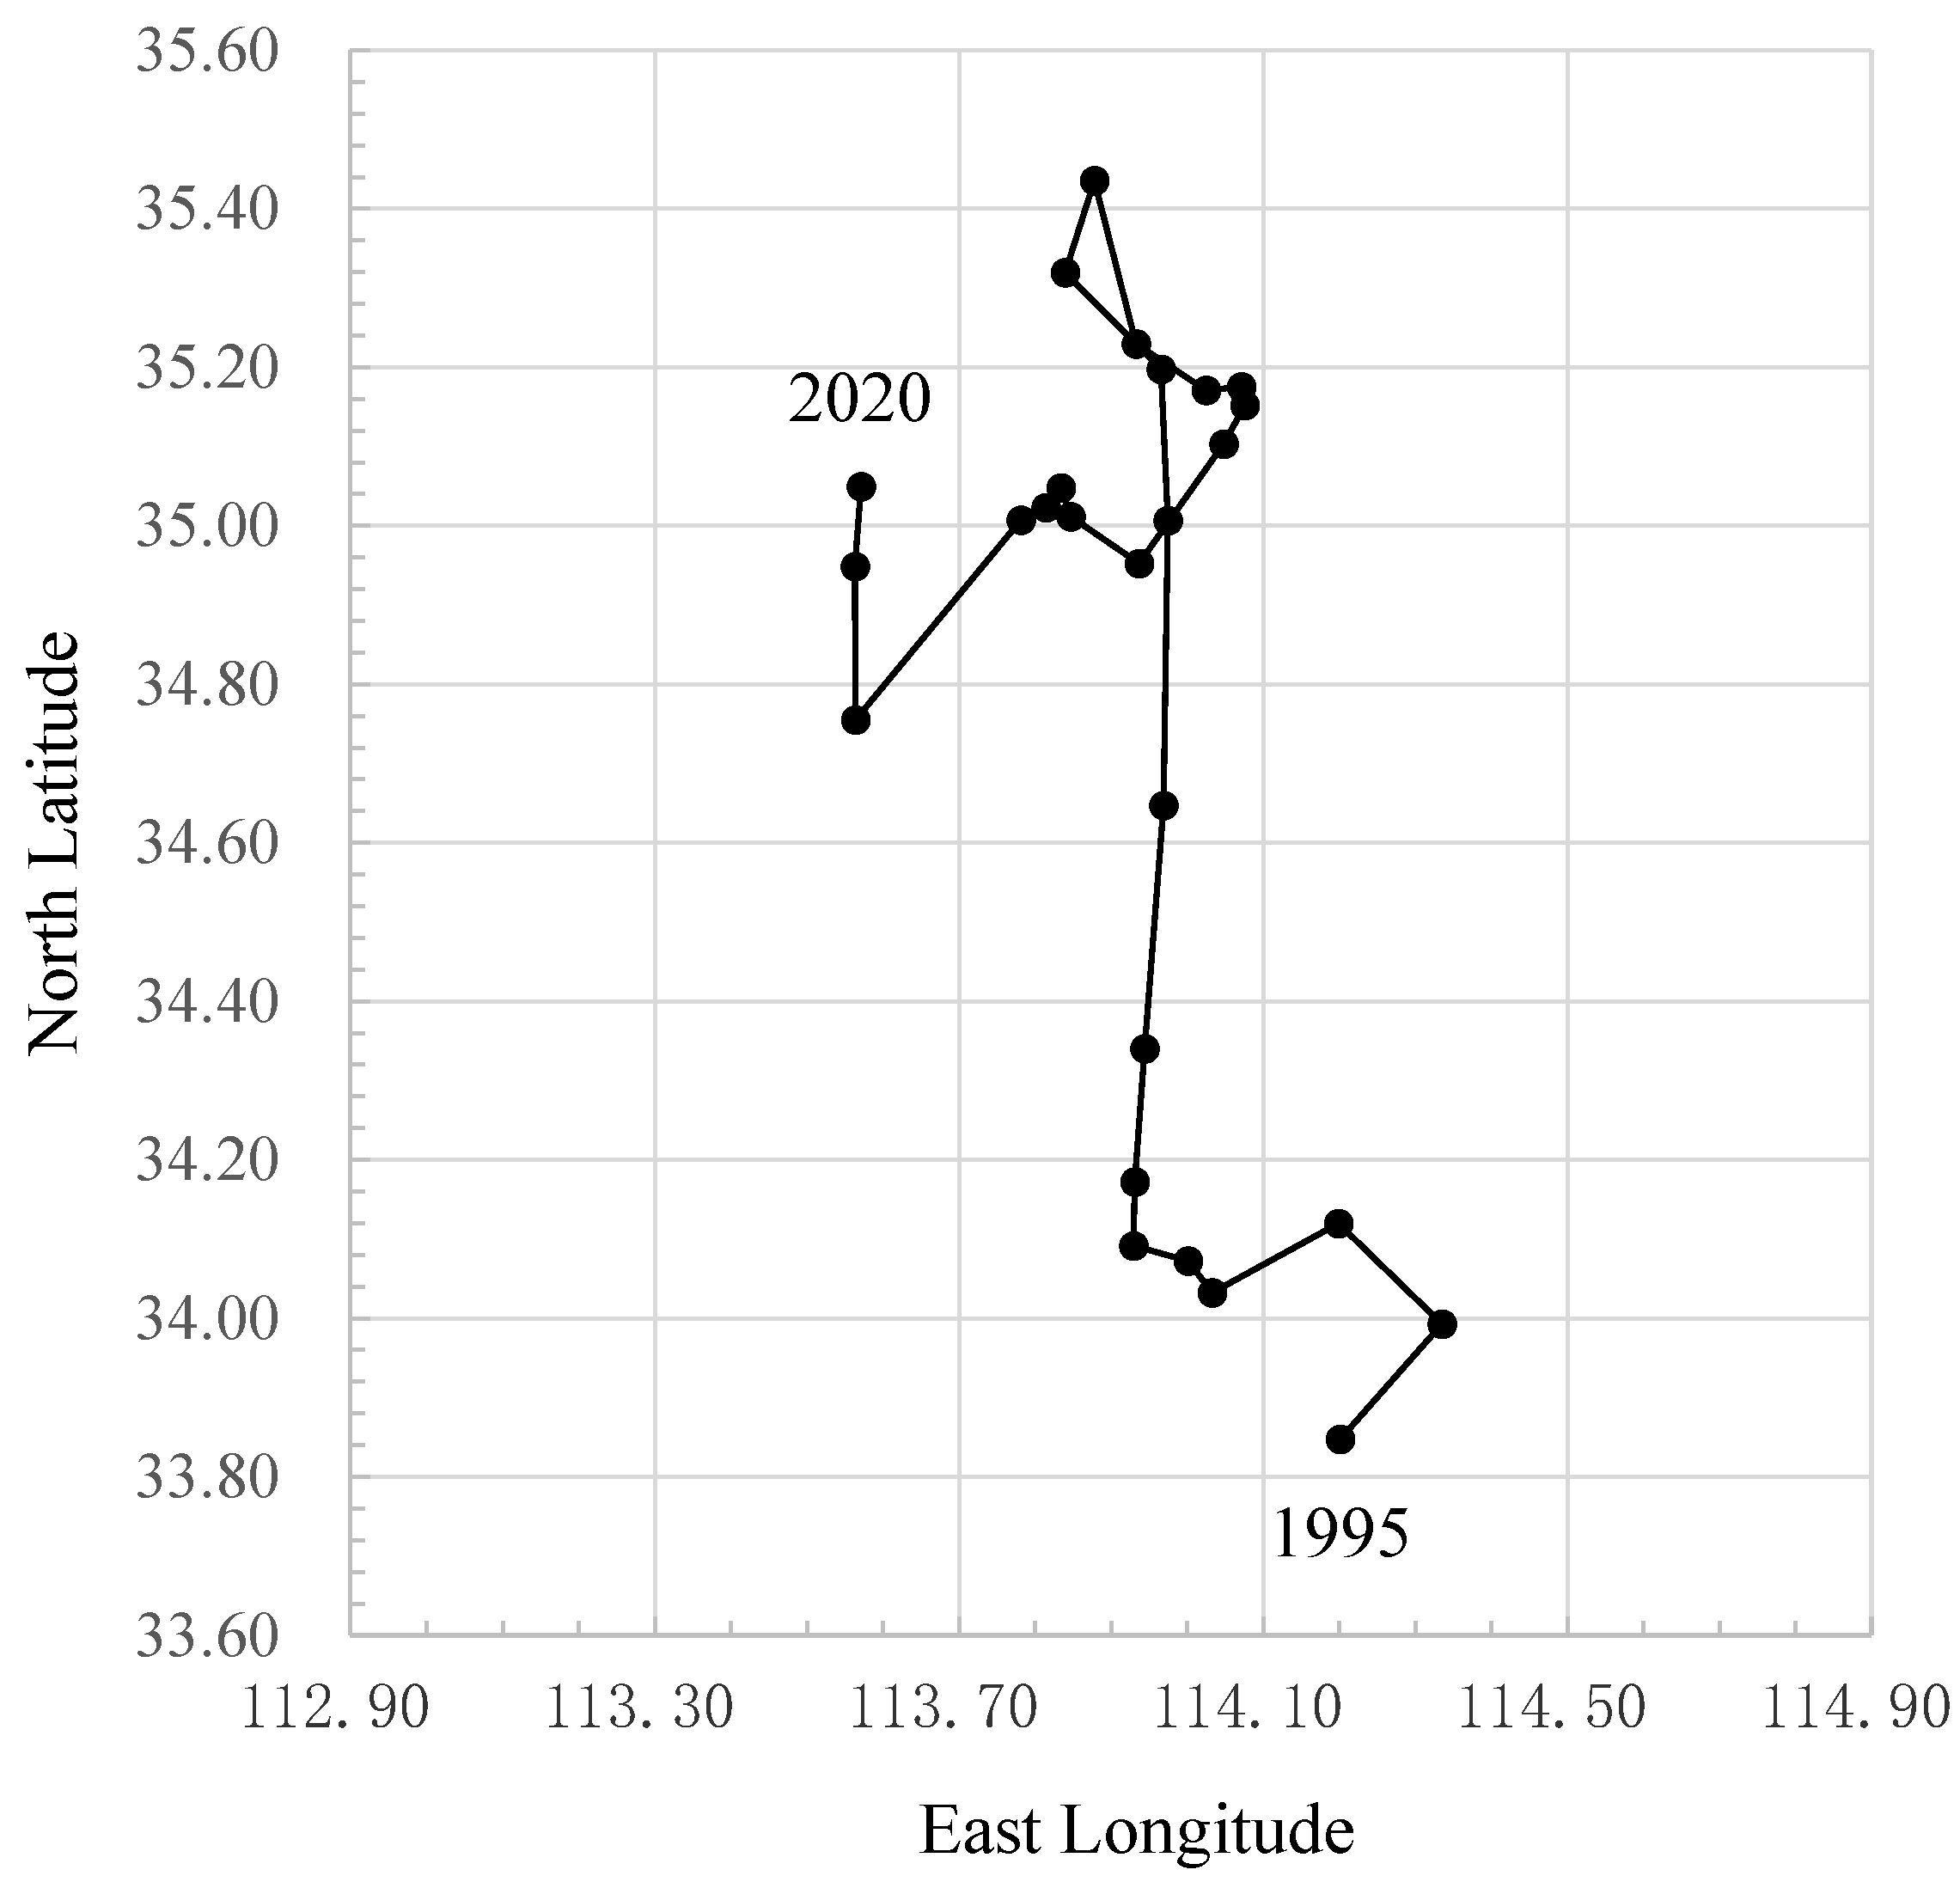
In terms of movement direction, the movement of the center of gravity of China’s livestock production from 1995 to 2020 showed a trend to the north and west (
Figure 1). Specifically, the center of gravity of China’s livestock production moved 150.76 km from (114.20° E, 33.85° N) in 1995 to (113.57° E, 35.05° N) in 2020, with an average annual movement of 6.03 km, and the movement was in the north-central region of Henan. Among them, the years with the smallest and largest movement are 2011 and 2004, moving 2.63 and 39.95 km to the southeast and northeast, respectively.
At the same time, the center of gravity of meat production moved from (113.53° E, 32.59° N) in 1995 to (112.79° E, 32.87° N) in 2020, with an overall movement of 87.36 km to the west-northwest, and the range of movement is in the Nanyang Basin (Southwest Henan). The production centers of gravity of pork, beef and mutton moved from Suixian County in Hubei, Anyang County in Henan Province and Yanchang County in Shaanxi Province in 1995 to Zaoyang City in Hubei Province, Daning County in Shanxi Province and Jingbian County in Shaanxi Province in 2020, with an overall movement of 63.07 km, 369.03 km and 184.69 km, respectively, all in the direction of west-northwest. The center of gravity of milk production in China moves from (114.21° E, 39.49° N) in 1995 to (113.39° E, 39.46° N) in 2020, with an overall movement of 91.30 km to the south of west, concentrated in the Datong Basin. The center of gravity of poultry egg production in China moves from Jining City, Shandong Province in 1995 to Heze City, Shandong Province in 2020, moving 91.84 km west-south as a whole, with an average annual movement of 3.67 km, and the moving range is in the southwestern part of Shandong (
Figure 2).
4.2. Analysis of Spatial Agglomeration
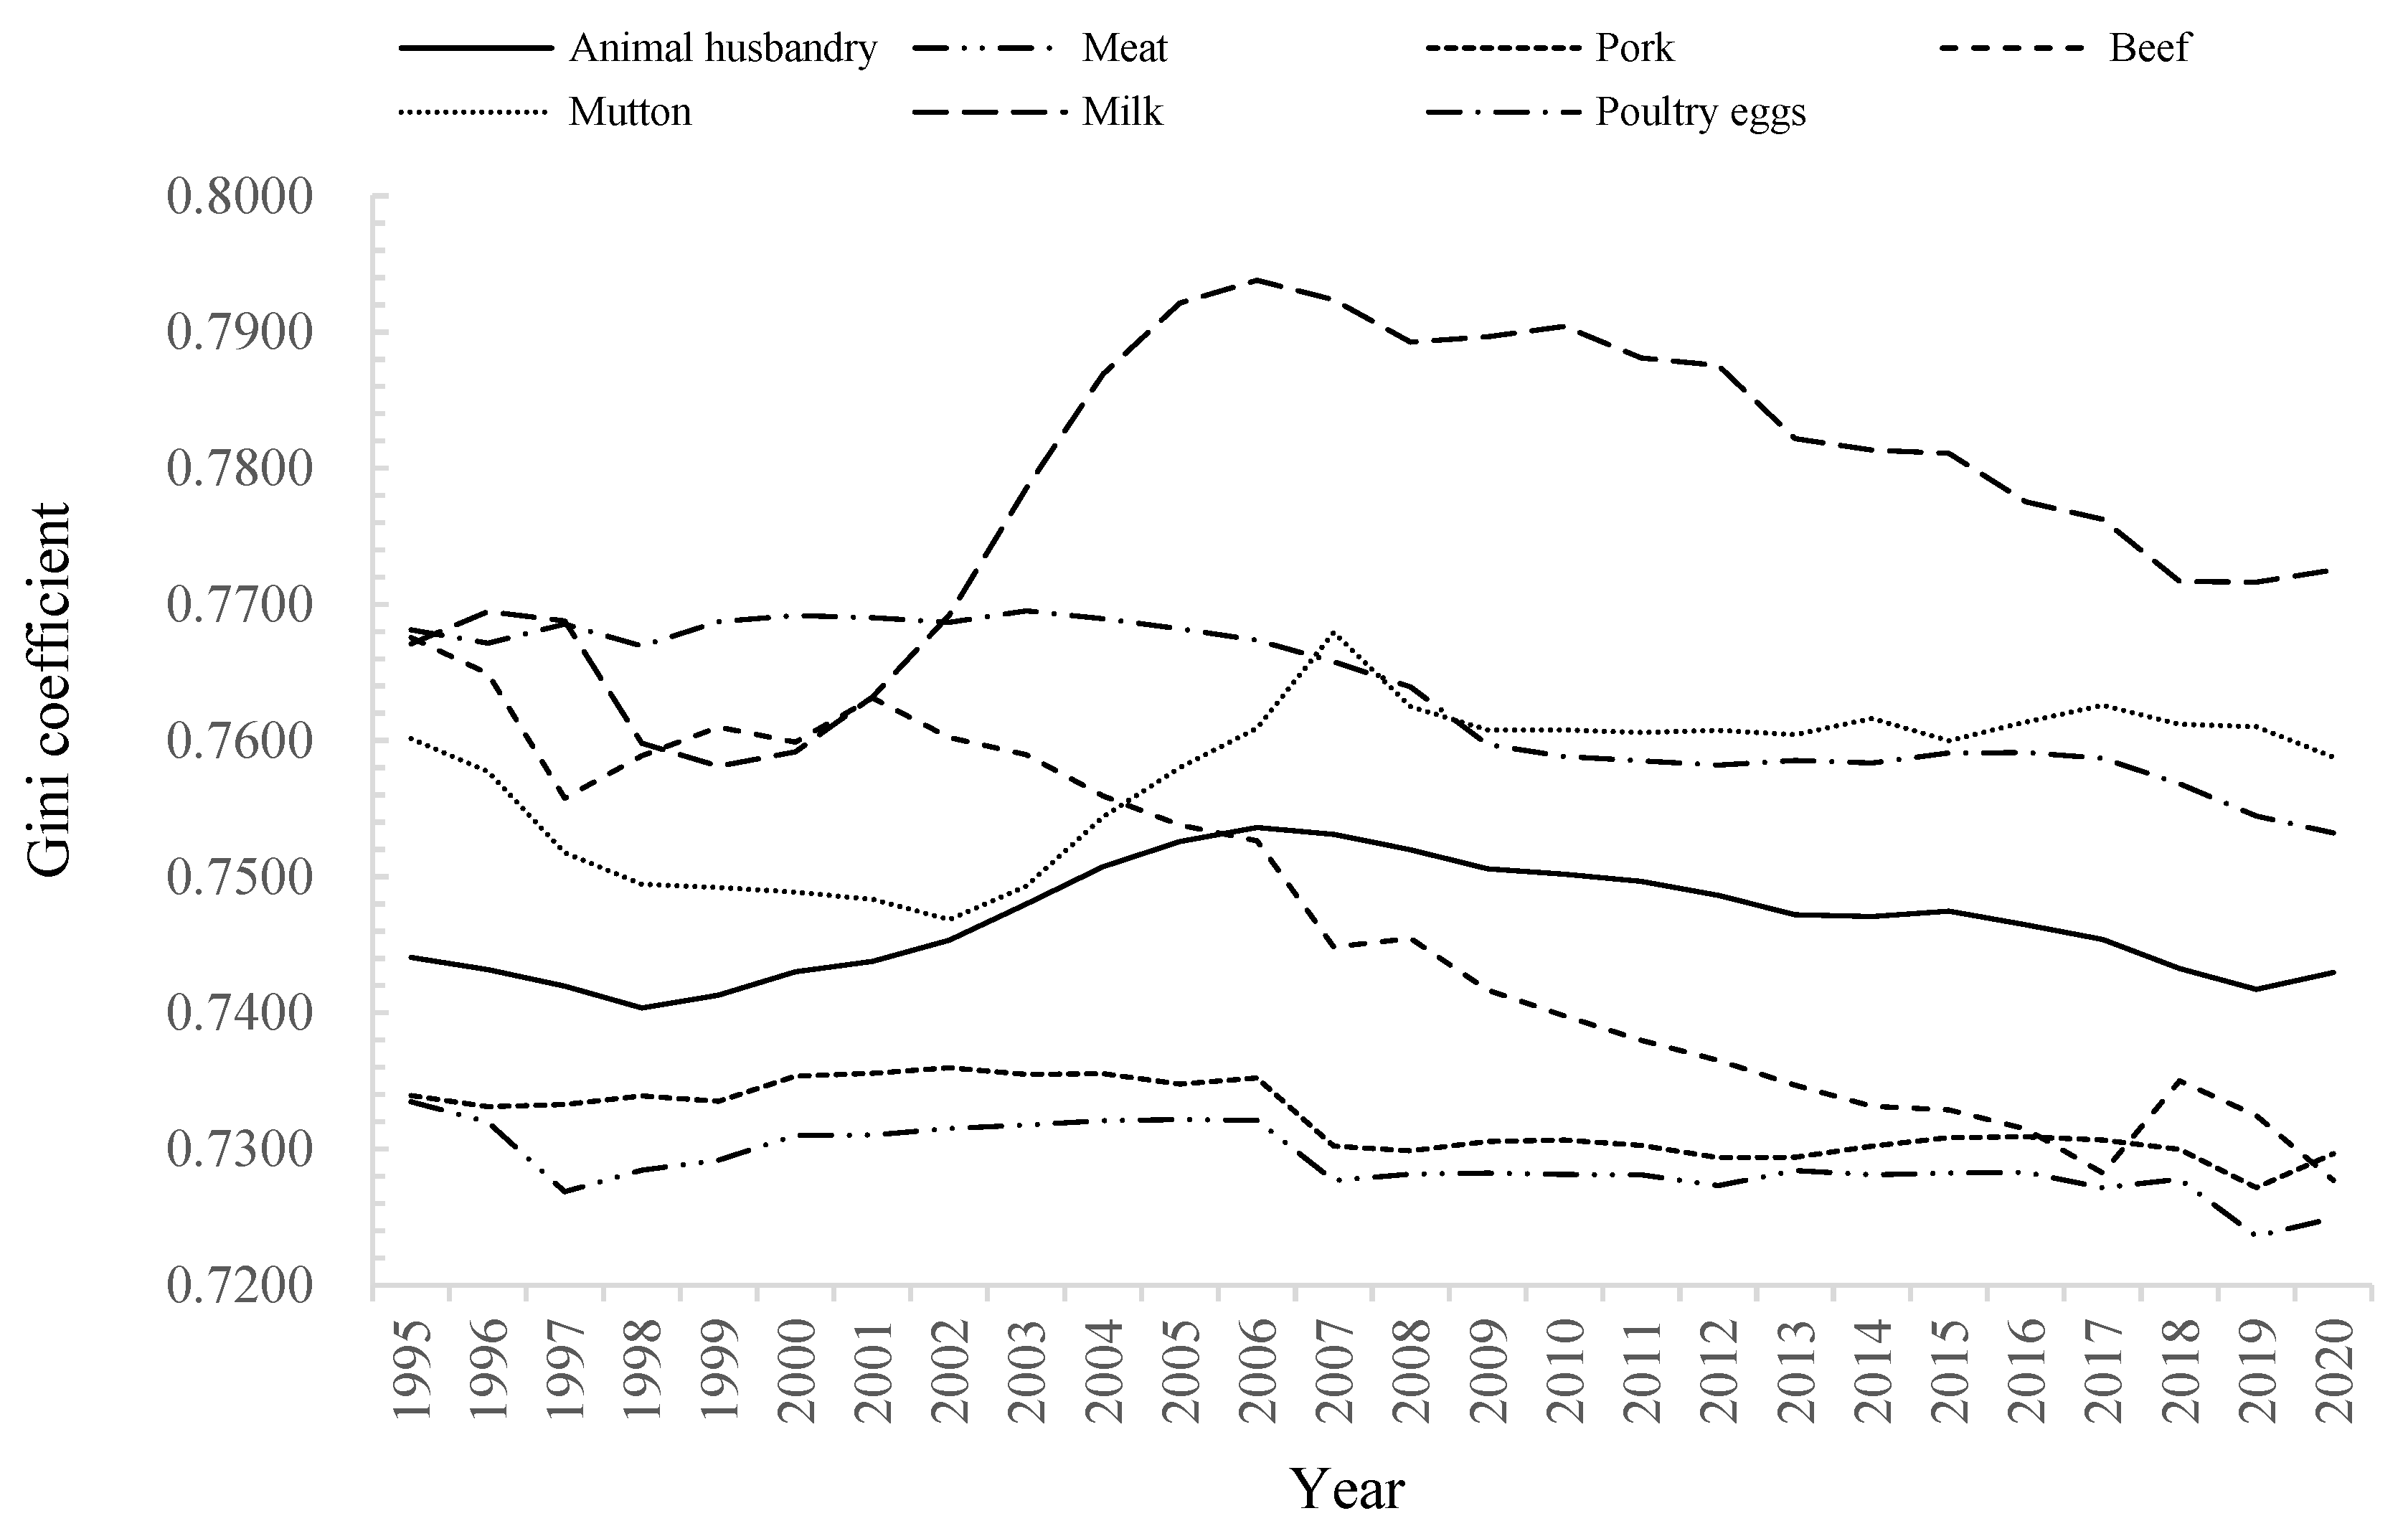
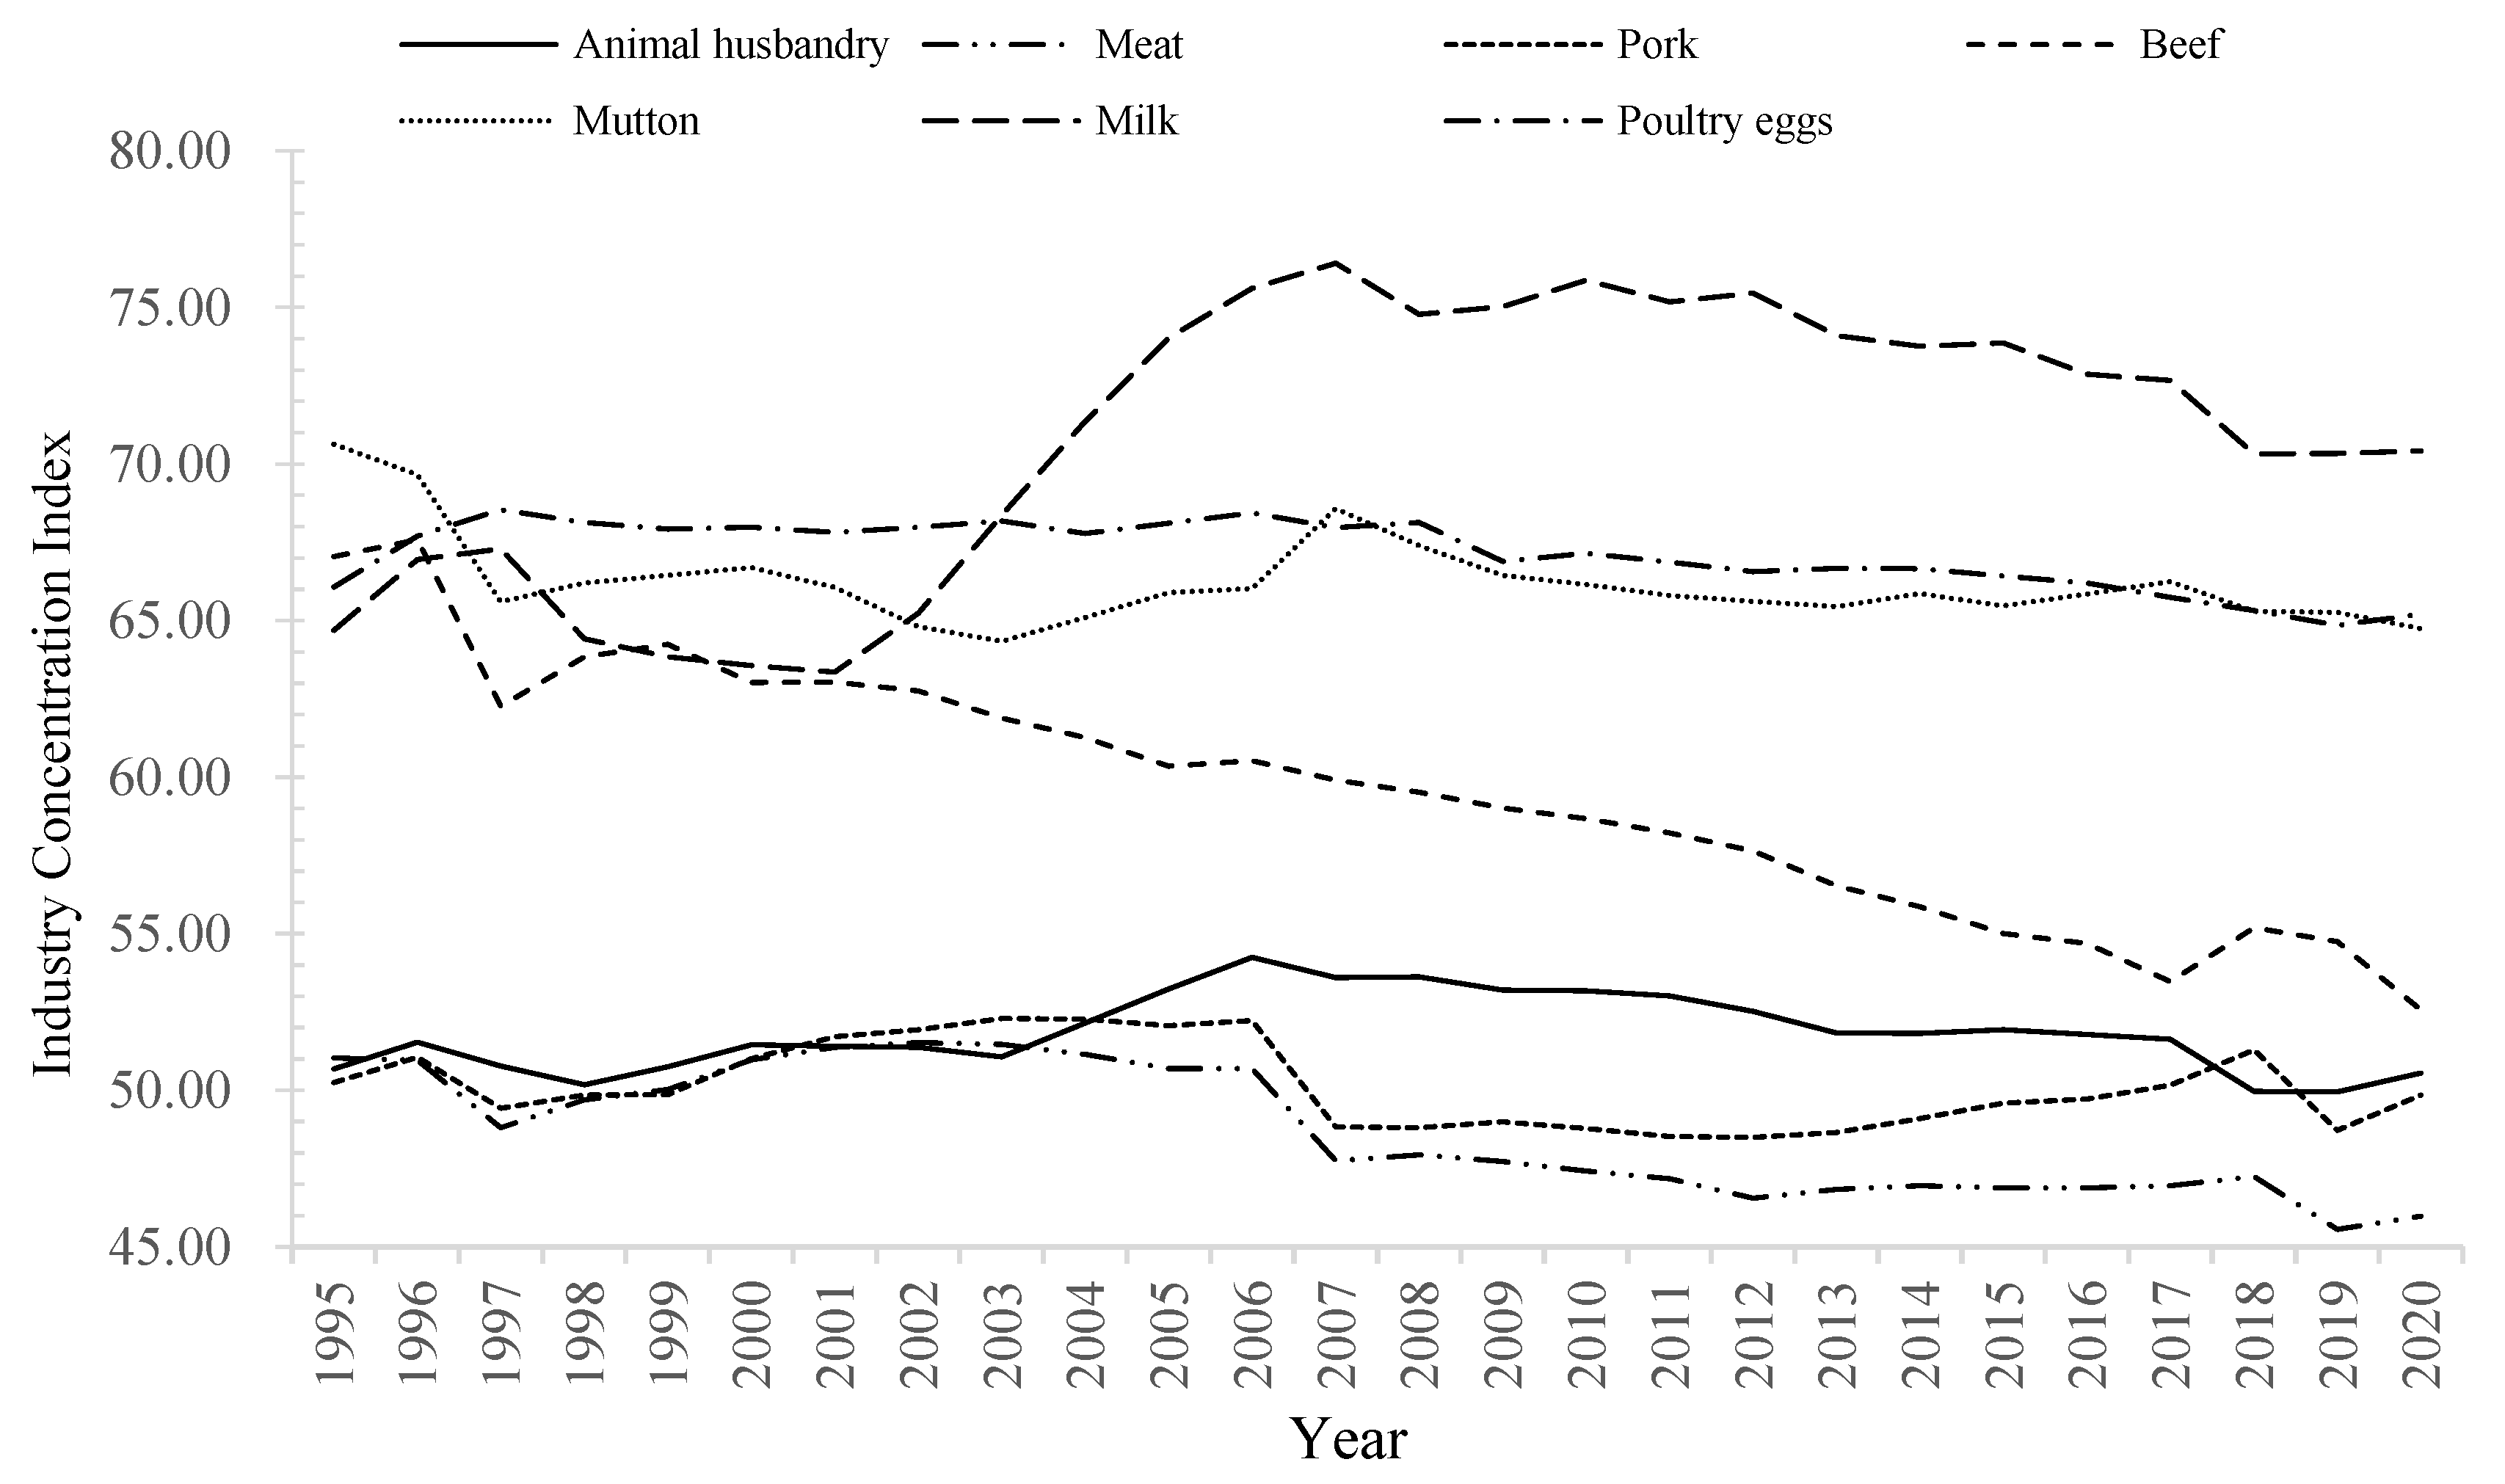
The location Gini coefficient (
Figure 3) and industry concentration index (
Figure 4) were used to jointly examine the degree of spatial agglomeration of China’s livestock production. The weighted average locational Gini coefficient of China’s livestock production shows a decreasing trend in fluctuation, from 0.7441 in 1995 to 0.7430 in 2020, a decrease of 0.0011, which is a small decrease, and reaches the maximum in 2006. Not coincidentally, the industry concentration index of livestock production also shows a slow decline in fluctuations, with ICR
7 decreasing by 0.13% in 2020 compared to 1995, and likewise reaching a maximum in 2006. This indicates that, on the one hand, 2006 is the peak inflection year of the concentration of China’s livestock production. On the other hand, the industry concentration of China’s livestock industry has weakened, but not significantly, which requires further testing. Among the livestock categories, both the locational Gini coefficient and ICR
7 of meat and eggs show a decreasing trend in fluctuation, with the locational Gini coefficient decreasing by 0.0085 and 0.0149, respectively, and the ICR
7 decreasing by 5.06 and 0.87 percentage points, respectively, which indicates that the production of meat and eggs is relatively more fragmented than before. The concentration of milk production has increased, with the locational Gini coefficient increasing from 0.7671 in 1995 to 0.7725 in 2020, an increase of 0.0054. At the same time, the ICR
7 of milk production increases from 64.69% in 1995 to 70.42% in 2020, an increase of 5.73 percentage points. This indicates that the production of milk has become more concentrated. Among the three major products of meat, the locational Gini coefficients of pork, beef and mutton decreased by 0.0043, 0.0399 and 0.0014, respectively, while ICR
7 all showed a decreasing trend, decreasing by 0.40%, 14.48% and 5.89%, respectively. From this preliminary judgment, the production of pork, beef and lamb became more dispersed in the country than 26 years ago. The reason for this is that pork is the most widely distributed livestock product in China, with the largest consumer audience, the largest consumption and lower market price than beef and lamb. The ICR
7 for beef, lamb, dairy and eggs is relatively high due to their regional nature and constraints, and their distribution is relatively concentrated in a few production areas, which makes their ICR
7 relatively high.
To verify the above analysis, Stata was used to regress the Gini coefficients of China’s livestock industry and the location of various livestock products on time T (
Table 1). The test results show that the geographic agglomeration of China’s livestock production shows an enhancing (but not significant) trend from 1995 to 2020. The degree of geographic agglomeration of meat, pork, beef and eggs shows a significant weakening trend. It is noteworthy that mutton and milk show an enhancing trend and show different significance levels. It should be further noted here that the degree of geographical agglomeration in China’s livestock industry from 1995 to 2020 shows a decreasing tendency in both the weighted average locational Gini coefficient and the industry concentration index, but by regressing the weighted average locational Gini coefficient of China’s livestock industry on time T, it is found that the regression coefficient is 0.0001 and insignificant. This indicates that the geographic agglomeration of China’s livestock industry shows a weak tendency to increase. However, the negative value of R
2 is rooted in the volatility and stability of China’s livestock production data from 1995 to 2020. Meanwhile, the degree of geographical agglomeration of lamb from 1995 to 2020 shows a decreasing tendency in terms of locational Gini coefficient and industry concentration index, but by regressing the locational Gini coefficient of lamb on time T, it is found that the coefficient is 0.0005 at a significant level of 1%, thus indicating that the geographical agglomeration of lamb in China still shows a significant enhancing trend. In addition, the geographical agglomerations of meat, pork, beef and eggs all show a significant weakening trend, which indicates that their production in the country has become more geographically dispersed.
4.3. Regional Layout Analysis
Focusing on the industry concentration indices of various livestock products in China at the beginning and end of the study period (
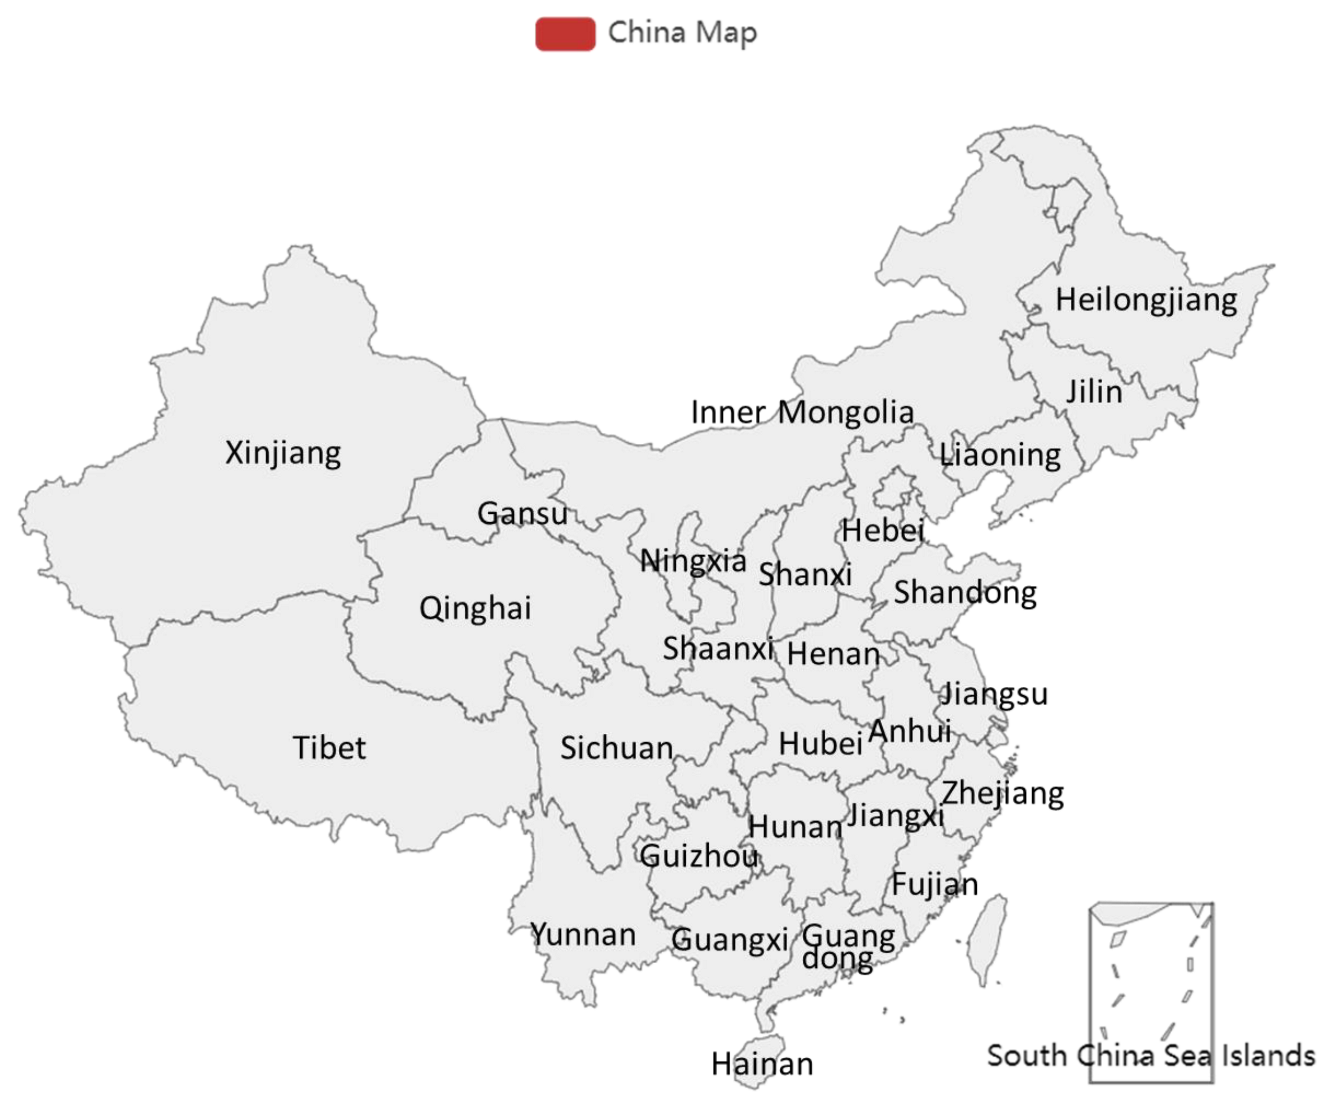
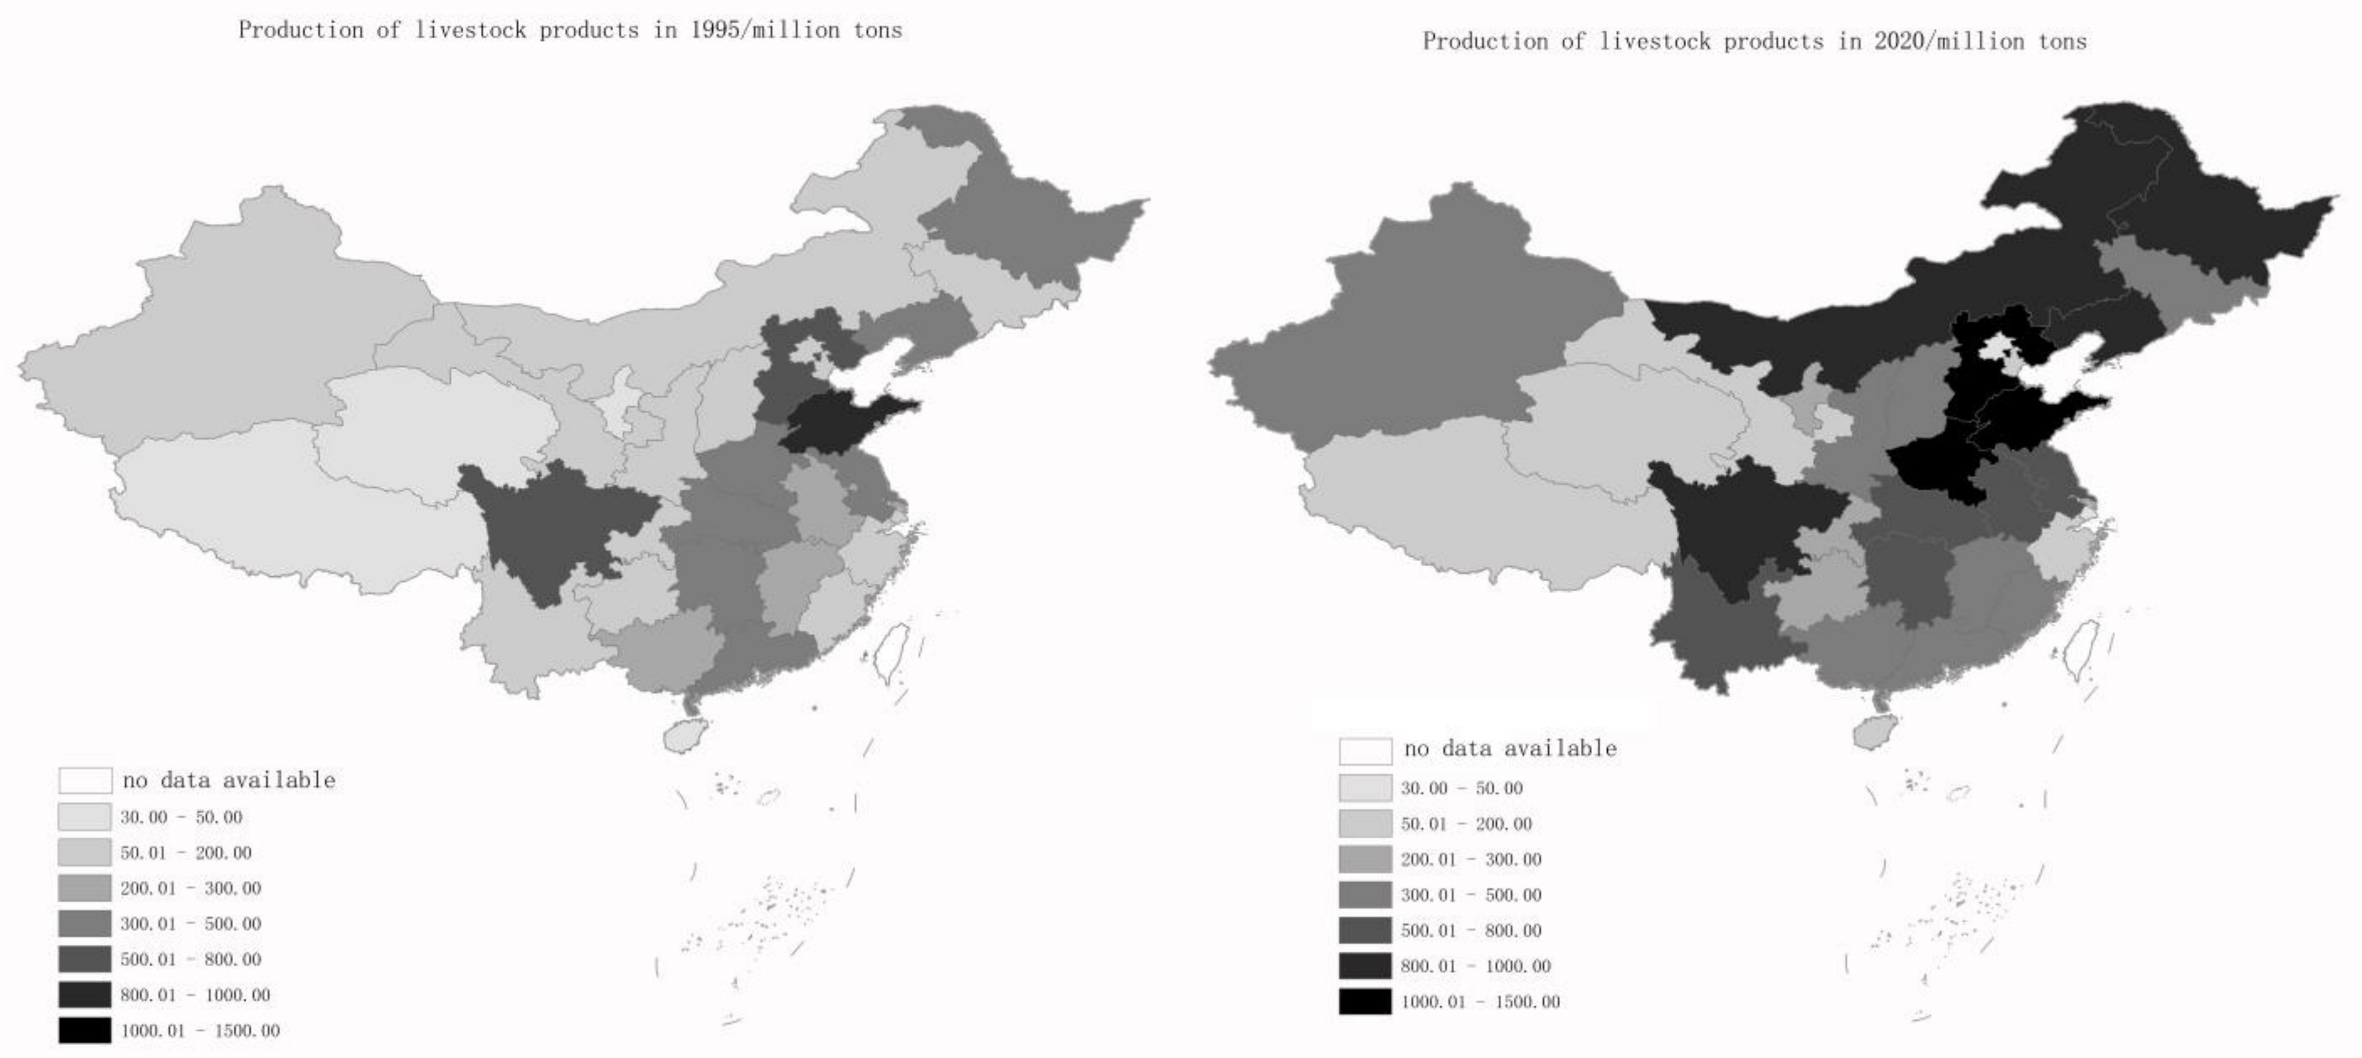
Table 2), we then analyze the regional layout of China’s livestock industry and the production of various livestock products. With regard to the top seven provinces in China’s livestock production in 2020 compared with 1995, Shandong, Sichuan, Hebei, Henan and Heilongjiang still ranked in the top seven. At the same time, Inner Mongolia and Liaoning replaced Jiangsu and Hunan in the top seven, which led to the main production areas of China’s livestock industry shifting northward (
Figure 5). Among them, Shandong, Hebei, Henan, Heilongjiang and Sichuan are still the main livestock production areas in China, and the livestock production of the five provinces accounts for nearly 40% of the national livestock production. However, Shandong, as the first major province of livestock production in China, has not declined in its animal husbandry status. But its national share has declined in the context of increasing production scale, i.e., from 12.75% in 1995 to 9.84% in 2020. It is noteworthy that Inner Mongolia and Liaoning become emerging major provinces in livestock products production, with a respective livestock production share of 6.42% and 5.75% of the country in 2020, which is 4.42 and 1.23 percentage points higher than 1995, respectively.
In the production of meat, the seven major production areas by 2020 were Shandong, Sichuan, Henan, Hunan, Hebei, Yunnan and Guangdong, with Jiangsu being replaced by Yunnan compared to 1995. Among them, there is also a change in the main production areas of pork; the seven major production areas before 2020 were Sichuan, Hunan, Henan, Yunnan, Shandong, Hebei and Hubei, and compared with 1995, Yunnan and Hebei replaced Jiangsu and Guangxi. Beef production in 2020 is concentrated in Inner Mongolia, Shandong, Hebei, Heilongjiang, Xinjiang, Yunnan and Jilin. Unlike 1995, the production area status of Heilongjiang has increased, while that of Shandong has decreased and that of Jilin has remained unchanged. Among them, Inner Mongolia, Xinjiang and Yunnan became the rising stars, replacing Henan, Liaoning and Anhui as the main beef producing areas, directly due to the increase in the scale of beef production in Inner Mongolia, Xinjiang and Yunnan from 9.40, 13.10 and 63.0 thousand tons in 1995 to 66.30, 44.00 and 40.9 thousand tons in 2020, respectively, with an increase in absolute scale of 56.90. The absolute size increased by 56.90, 30.90 and 34.60 million tons, respectively, the top three increases in the country. The deeper reason is that Inner Mongolia and Xinjiang (as China’s larger pastoral areas), as well as Yunnan, have given full play to their policy advantages and regional resource advantages over the past 26 years, vigorously developing grassland animal husbandry and greatly enhancing the status of beef production in the national beef production pattern.
The livestock sector was further analyzed by dividing it into herbivorous and food-consuming livestock sectors. The degree of production of herbivorous livestock products becomes more concentrated, and its ICR7 increases from 60.85% in 1995 to 65.95% in 2020, an increase of 5.10 percentage points in 26 years. Heilongjiang, Shandong, Hebei, Henan, Xinjiang and Inner Mongolia still occupy the position of main production areas due to their larger production scale of herbivorous livestock products. It is noteworthy that Inner Mongolia and Ningxia’s production status is rising, with Inner Mongolia’s beef and lamb meat and milk products accounting for nearly 17% of the country’s output, an increase of nearly 11 percentage points from 1995. Ningxia has become one of the seven major production areas of herbivorous livestock products as a direct result of the year-on-year rise in production scale, from 17.9 million tons in 1995 to 2.19 million tons in 2020, with an increase in production scale of more than 2 million tons. The rise of the herbivorous livestock industry in Inner Mongolia is due to the increasing demand for beef, lamb and dairy products from the Beijing-Tianjin-Hebei metropolitan area, the Harbin-Da urban agglomeration and other cities and urban agglomerations near Inner Mongolia, which directly stimulates the rapid development of the herbivorous livestock industry in Inner Mongolia with its high-quality livestock resource endowment. The main grain-consuming livestock production areas are mainly located in Henan, Shandong, Hebei, Sichuan, Liaoning, Hunan and Hubei in 2020. The ICR7 of grain-consuming livestock products increased from 53.66% in 1995 to 53.74% in 2020, and its production concentration increased in the past 26 years. Compared with 1995, Liaoning has replaced Jiangsu as one of the seven major production areas of grain-consuming livestock products.
4.4. Analysis of the Balanced Development of the Dual Structure of Animal Husbandry
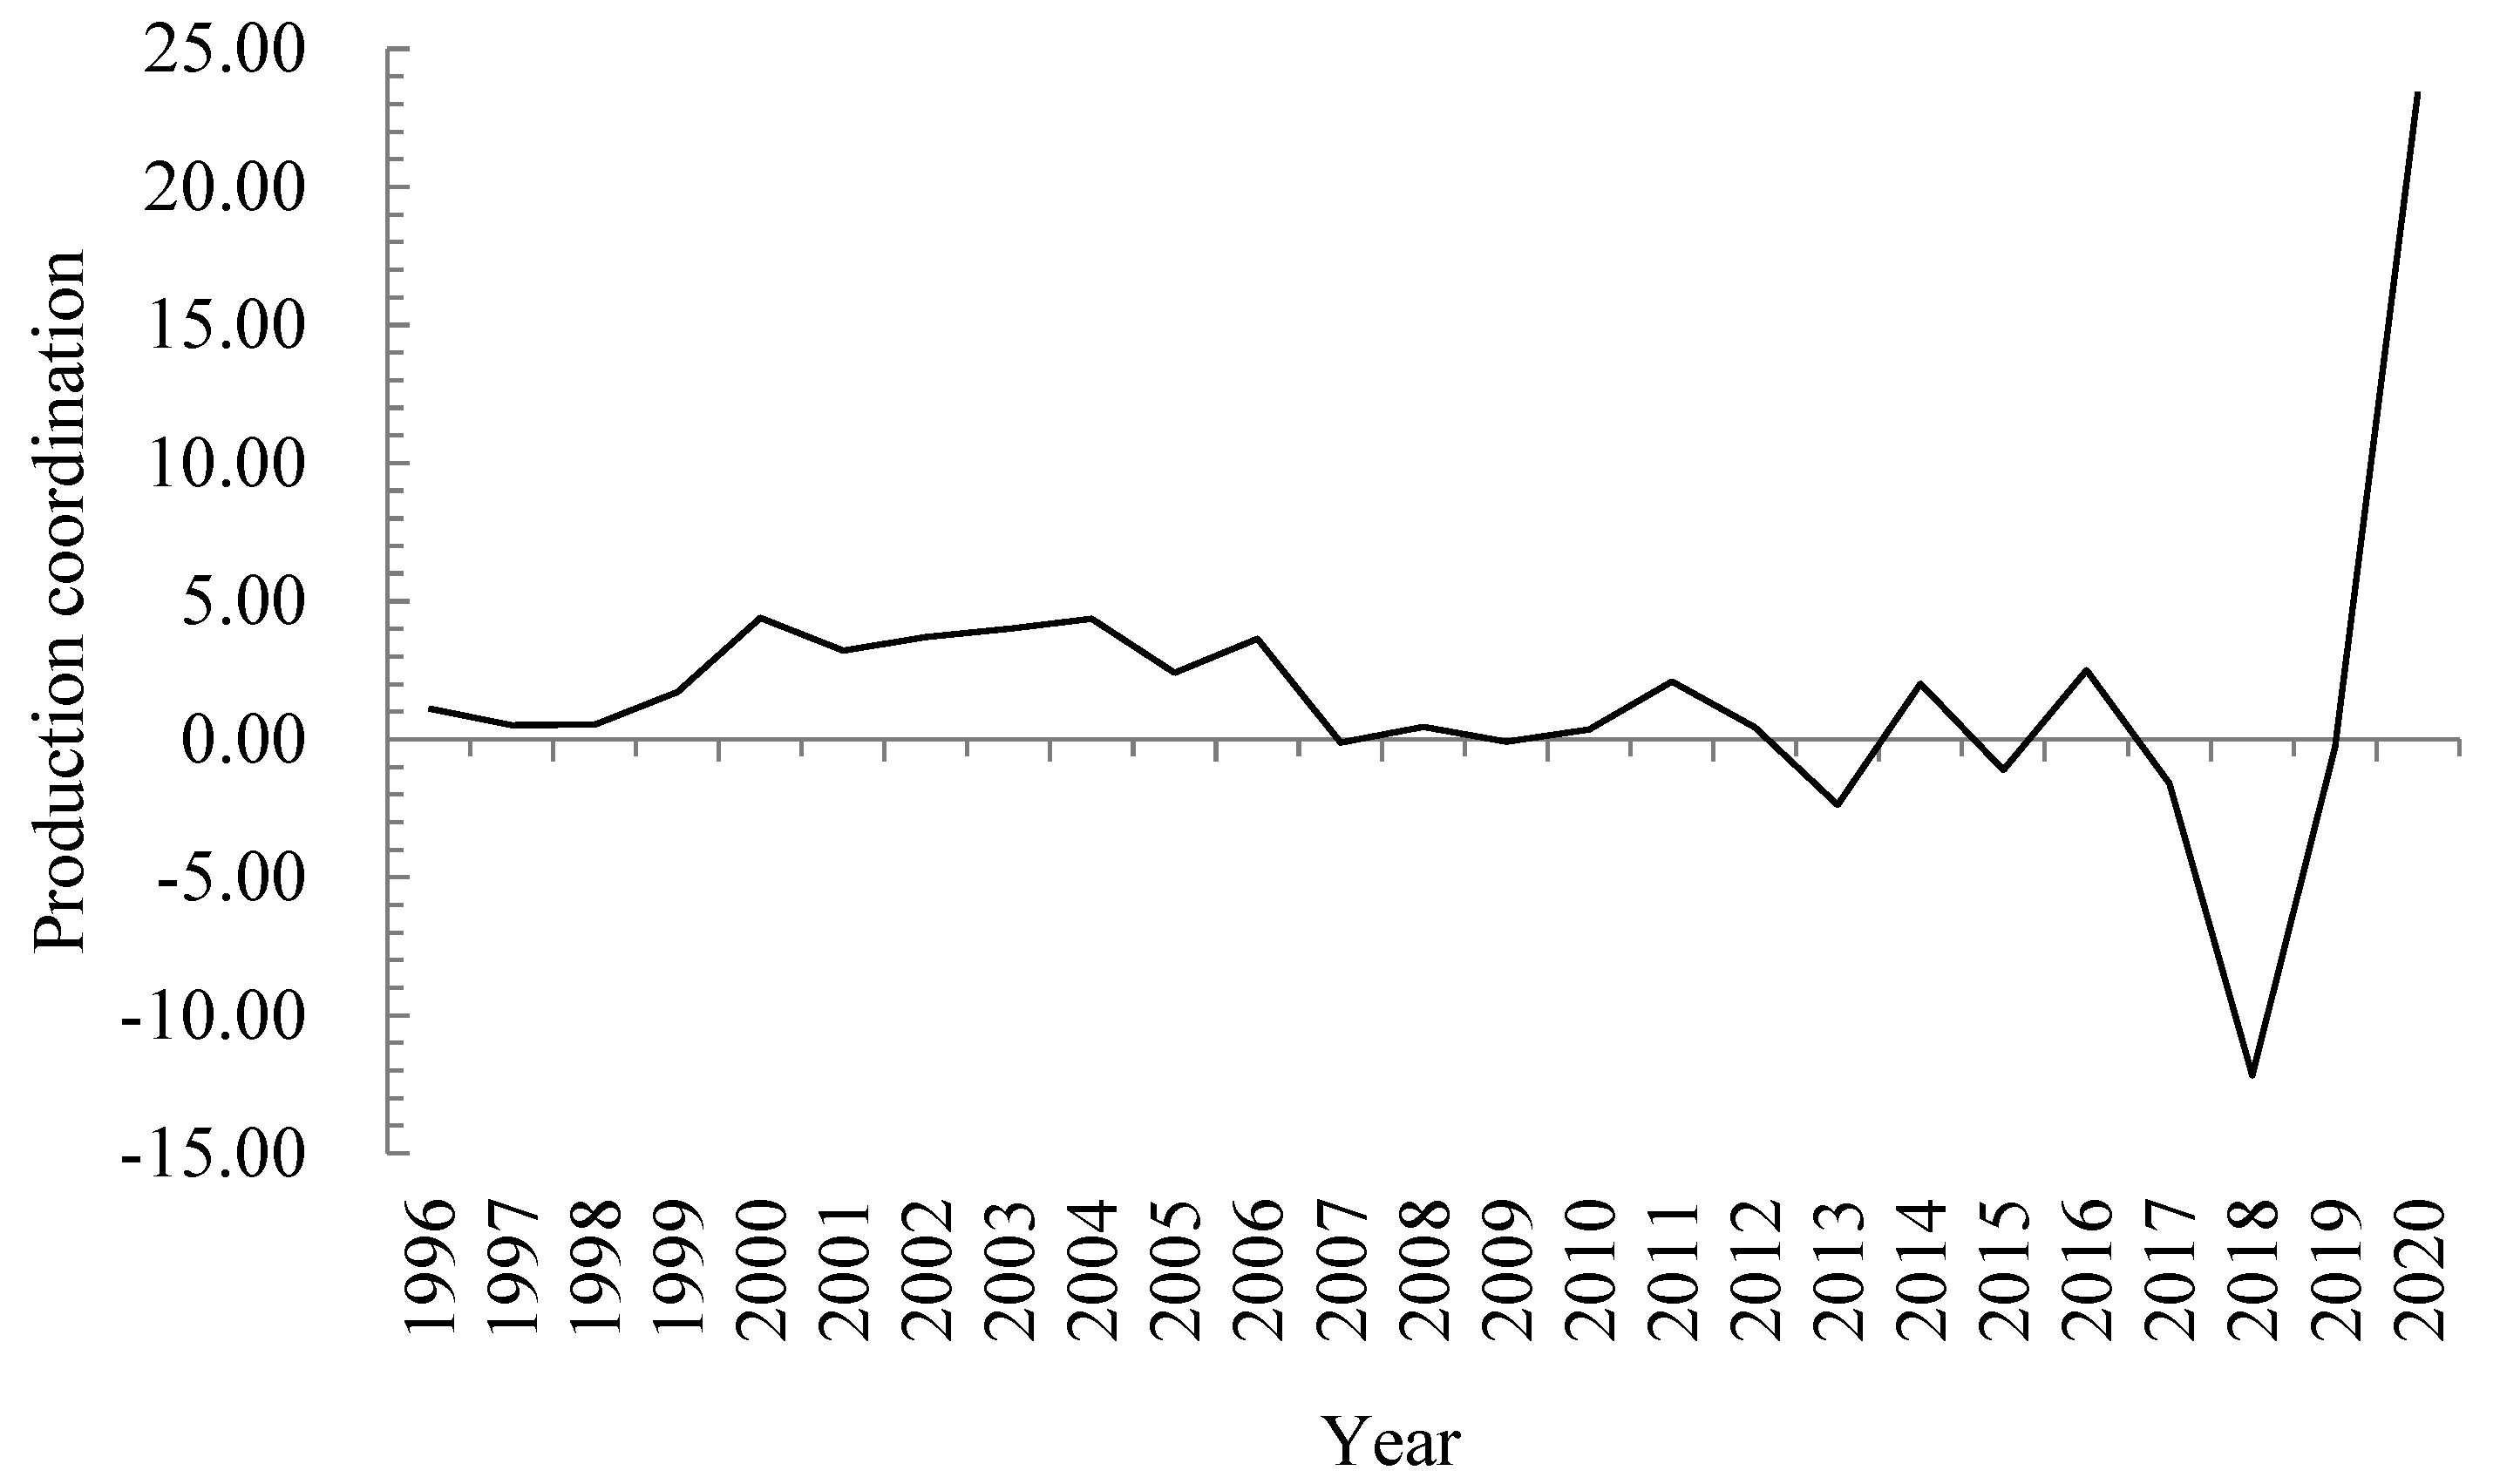
A binary structure model was used to examine the degree of balanced development of herbivorous and food-consuming livestock industries in China. As can be seen from
Figure 6, the years of unbalanced development of China’s herbivorous livestock industry and grain-consuming livestock industry involve seven years, including 2007, 2009, 2013, 2015, 2017, 2018 and 2019, among which 2007, 2015 and 2019 belong to the situation where the production capacity of herbivorous livestock products increases, and the production capacity of grain-consuming livestock products decreases. In contrast, 2009, 2013, 2017 and 2018 belong to the situation where the production capacity of herbivorous livestock products decreases, and the production capacity of grain-consuming livestock products increases. In contrast, 2009, 2013, 2019 and 2018 showed a decrease in the production capacity of herbivorous livestock products and an increase in the production capacity of grain-consuming livestock products, while most years showed a balanced development of herbivorous and grain-consuming livestock industries in China. It is worth noting that the degree of balanced development of production capacity of herbivorous and food-consuming livestock in China shows a two-stage characteristic, with 2006 being the turning point. The first stage was from 1995 to 2006, when the production capacity of both herbivorous and food-consuming livestock products in China showed continuous growth (except for 1997). The second stage was from 2007 to 2020, when the inherent structural imbalance between herbivorous and food-consuming livestock production in China was observed. In particular, it should be noted that the binary structure balance index of China’s livestock industry changes significantly from 2018 to 2020. In 2018, the dual structure balance index of China’s animal husbandry was −12.17, which showed that the production capacity of herbivorous animal products decreased significantly, and the production capacity of grain-consuming animal products increased. The direct reason is that beef and milk production in 2018 decreased more than that in 2017, by 820,200 tons and 4,784,200 tons, respectively. In 2020, the dual structure balance index of animal husbandry in China was as high as 23.44, indicating that the production capacity of herbivorous animal products was much higher than that of grain-consuming animal products. The direct reason for this is that milk production in 2020 increased by 2,322,000 tons compared to 2019, while pork production in 2020 decreased by 1,417,000 tons compared to 2019. From 2007 to 2020, the internal structure of China’s animal husbandry was in a stage of interlocking balanced and unbalanced development. The main contradiction is that the excess supply of middle- and low-end livestock products cannot meet the market demand of quality, health, diversification and personalization, and the deep-seated reason is the structural imbalance on the supply side of livestock products caused by information asymmetry.
5. Spatial and Temporal Evolution Pattern of China’s Livestock Production Pattern
5.1. The Spatial Divergence of the Center of Gravity of China’s Livestock Production Is Obvious
The spatial and temporal evolution characteristics of China’s livestock industry and the production layout of various livestock products from 1995 to 2020 are more obvious, and the common point is that their production centers of gravity all move westward in a latitudinal direction. The difference is that there are obvious geospatial differences in the distribution of production centers of various livestock products, and the divergent characteristics are more obvious.
First, the center of gravity of China’s livestock industry and various types of livestock products production differs in the direction and distance of the moving path. In terms of moving direction, the center of gravity of China’s livestock production shows the characteristic of moving in the northwest direction, and the center of gravity of production of pork, beef and mutton keeps moving in the northwest direction, while the center of gravity of production of milk and eggs keeps moving in the southwest direction. In terms of moving distance, the production centers of gravity of livestock, beef and mutton all move over 100 km, while those of meat, pork, dairy and poultry eggs all move less than 100 km.
Second, there are obvious regional characteristics in the movement of the center of gravity of livestock production and various livestock products in China. The center of gravity of livestock production is in central and northern Henan; the centers of gravity of meat, dairy and eggs production are in the Nanyang Basin (southwest Henan), Datong Basin and southwest Lu; the centers of gravity of pork, beef and mutton production are in the Nanyang Basin (north-central Hubei), Shangdang Highlands-Linfen Basin (southern Shanxi) and northern Shaanxi Plateau, among which the Datong Basin and the northern Shaanxi Plateau are in the interlocking zone of Chinese agriculture and animal husbandry.
Third, the Zhongtiao Mountains-Taihang Mountains become an important geographical division of spatial division of labor in China’s livestock industry, and the North China Plain and Loess Plateau on the left and right sides become the landing areas of the center of gravity for the production of grain-consuming and herbivorous livestock products, respectively. On the whole, the center of gravity of China’s livestock production moved from central Henan all the way to the northwest (to the south of northern Henan, close to the Taihang Mountains) from 1995 to 2020, among which the center of gravity of livestock production hovered around 35° N from 2004 to 2020. As for herbivorous livestock products, the center of gravity of mutton production has always hovered in northern Shaanxi, while the center of gravity of beef and milk production experienced a shift across the Taihang Mountains from the western edge of the North China Plain, the third terrain in China, to the eastern edge of the Loess Plateau, the second terrain, at the end of the 20th century; the center of gravity of pork and eggs production of grain-consuming livestock products has always moved locally in the southeast of the Zhongtiao Mountains-Taihang Mountains. Obviously, the Zhongtiao Mountains-Taihang Mountains (Zhongtiao Mountains is located in the southern edge of the southwest basin of Shanxi Province, between the Yellow River and Blossom River, northeast-southwest direction, living between Huashan and Taihang Mountains, spanning Linfen, Yuncheng and Jincheng; Taihang Mountains is located between Shanxi Province and the North China Plain, northeast-southwest direction, spanning Beijing, Hebei, Shanxi and Henan provinces, starting from Beijing West Mountains in the north to Wangwu Mountains, a branch of Zhongtiao Mountains at the border of Henan and Shanxi in the south.) have become an important geographic division of labor in China’s livestock industry, and the center of grazing livestock production is located on the Loess Plateau west of the Zhongtiao Mountains-Taihang Mountains, while the center of grazing livestock production is distributed on the North China Plain southeast of the Zhongtiao Mountains-Taihang Mountains. This feature is highly compatible with the geographical distribution characteristics, population distribution characteristics and regional farming traditions of China’s agriculture and animal husbandry.
5.2. The Differentiation and Stage Characteristics of the Geographical Agglomeration of China’s Livestock Industry Are Significant
Firstly, the degree of geographic agglomeration of animal husbandry and various livestock products showed a clear divergence. On the one hand, the degree of geographic agglomeration of China’s livestock industry shows a weak tendency to increase, while the degree of geographic agglomeration of mutton and milk shows a significant tendency to increase. On the other hand, the degree of geographic agglomeration of meat, pork, beef and eggs shows a significant tendency to weaken. This further indicates that, at the level of geographical distribution of production, the layout of livestock production in China still shows a clustering trend, while the production of mutton and dairy becomes more concentrated, and the production of meat, pork, beef and eggs shows a generalized characteristic and becomes more dispersed.
Secondly, the inflection point and stage characteristics of the geographical concentration of the livestock industry are significant. The weighted average locational Gini coefficient of China’s livestock industry reached a great value of 0.7536 in 2006 (
Figure 3), i.e., 2006 was the inflection point year of the geographical agglomeration of China’s livestock industry. In terms of spatial and temporal evolutionary stages, the change in the degree of geographic agglomeration of China’s livestock industry shows a “slow decline-slow rise-slow decline” in the periods of 1995–1998, 1998–2006 and 2006–2020, respectively. The location Gini coefficients of meat and beef both reached a great value in 1995, and then began to decline in fluctuation. Pork, mutton, dairy and eggs reached the maximum value in 2002, 2007, 2006 and 2003, respectively, which indicates that the geographical concentration of these livestock products has been fluctuating and decreasing since 1995, when it rose to the inflection point.
5.3. The Regional Layout of China’s Livestock Production Presents New Trends
First, the production of some livestock products is highly concentrated in a few provinces and shows a trend of regional monopoly. The production of China’s livestock industry and all kinds of livestock breeds show the characteristic of being highly concentrated in a few provinces, and the trend of regional monopoly is strengthened. As can be seen from ICR7, the industry concentration index of China’s livestock industry and production of various products is relatively high, with the top seven production areas occupying half of the similar livestock products and producing a number of main production areas with highly concentrated characteristics. Specifically, pork production is mainly highly concentrated in Sichuan and Hunan, beef production is mainly highly concentrated in Inner Mongolia, Shandong and Hebei, mutton production is mainly highly concentrated in Inner Mongolia and Xinjiang, milk production is mainly highly concentrated in Inner Mongolia, Heilongjiang and Hebei and poultry egg production is mainly highly concentrated in Shandong, Henan, Hebei and Liaoning. The output of livestock products in these provinces in 2020 accounted for more than 8% of the national output of livestock products. Moreover, the output in 2020 for lamb in Inner Mongolia and Xinjiang, milk in Inner Mongolia, Heilongjiang and Hebei, and poultry eggs in Shandong, Henan and Hebei accounted for more than 10% of the national output of similar livestock products. This further shows that the production of mutton, milk and poultry eggs in these provinces has a tendency to strengthen regional monopoly.
Secondly, a number of emerging major livestock product-producing provinces are generated. On the whole, the production pattern of China’s livestock industry and various types of livestock products changed significantly from 1995 to 2020. Among the seven major production areas of China’s livestock industry and various livestock products in 2020, Inner Mongolia and Liaoning become emerging major provinces of livestock production, Yunnan becomes an emerging major province of meat production, Yunnan and Hebei become emerging major provinces of pork production, Inner Mongolia, Xinjiang and Yunnan become emerging major provinces of beef production, Gansu becomes an emerging major province of mutton production, Ningxia and Henan become emerging major provinces of milk production, Anhui becomes an emerging province for egg production, Ningxia becomes an emerging province for herbivorous livestock products, and Liaoning becomes an emerging province for grain-consuming livestock products.
5.4. New Trends in the Balance of the Dichotomy between Herbivorous and Grain-Consuming Livestock Farming in China
Through the construction of a binary structure balance index, it is found that 2006 has become the inflection point of China’s livestock development from balance to imbalance since the end of the Eighth Five-Year Plan, and the herbivorous livestock production may have a rapid growth trend. In this regard, it is necessary to take a dialectical view of the balanced development level of the dual structure of China’s livestock production, and scientifically understand the “neutral” characteristics and “contemporary” connotation of “balance”. On the one hand, the period from 1995 to 2006 was the period of rapid economic development in China, and the increasing demand for livestock products of the people promoted the steady growth of the productivity of herbivorous and grain-consuming animal husbandry. On the other hand, since 2006, China’s economy and society have entered a period of reform in development. Scientific development and green transformation of the development mode have become the direction of the times, and the people’s demand for green, nutritious and healthy livestock products and processed products has become increasingly urgent, which has led to the adjustment and optimization of the supply structure of livestock products as the important direction of the current development of China’s livestock industry. In other words, the practice of scientific development concept and new development concept in the field of livestock production is bound to put forward the requirements of “connotative development” and “high-quality development” for the production structure of livestock products, which in turn will make the dual structure balance index between herbivorous livestock products and grain-consuming livestock products appear. This change is the result of livestock production structure adjustment in response to the transformation and upgrading of livestock products consumption.
6. Enhancement Path for the Evolution of China’s Livestock Production Pattern
In order to explore the deeper connotations and laws of the changes in China’s livestock production pattern, this study provides a detailed descriptive portrayal and profound exploratory analysis of the model data based on the productivity layout theory and conducts an in-depth analysis of the mechanisms of the changes in China’s livestock production pattern. The study profoundly reveals the evolutionary dynamics and inner laws of China’s livestock production pattern from the end of the 8th Five-Year Plan to the end of the 13th Five-Year Plan, which provides theoretical support and empirical evidence for the spatial division of labor and transformation development of modern livestock industry in the new development stage. As a result, during the new development stage, China’s animal husbandry industry should take the initiative to adapt to the new development pattern and adhere to the inherent requirements of the new development concept regarding the layout of productive forces. We should vigorously promote the supply-side structural reform to achieve a smoother flow of factors of production in animal husbandry and a more reasonable spatial layout.
6.1. The Promotion Path of Sustainable Development of Animal Husbandry in China
First, promote the sustainable development of animal husbandry and implement the strategy of ecological spatial distribution of animal husbandry resources. Firstly, develop circular agriculture to crack the problem of waste of resources and environmental pollution caused by the development of animal husbandry in a clean production model. Secondly, increase the zoning work of livestock production, make the livestock breeds with large emission coefficients away from ecologically fragile areas, accelerate the layout to the advantageous production areas, and create industrial clusters of excellent livestock breeds. Finally, explore and innovate grassland ecological compensation mechanism to prevent grassland overgrazing behavior and realize the reasonable layout of livestock production.
Second, increase the scientific and technological investment in animal husbandry and improve the productivity level of animal husbandry. Firstly, increase the scientific and technological investment in the reuse of crop straw, explore the new model of grass-livestock combination, and vigorously develop food-saving animal husbandry and herbivorous animal husbandry. Secondly, build high-quality forage production bases, increase the supply of high-quality forage, and lay a solid foundation for the optimization and stability of livestock production layout. Finally, pay attention to the breeding of livestock breeding, and cultivate high-quality livestock breeds.
Third, focus on improving the level of modernization of animal husbandry, accelerate the transformation and upgrading of animal husbandry. On the one hand, further regulate the production behavior of animal husbandry practitioners and shape the good production norms of farmers. Promote the reduction of the use of veterinary drugs in the process of breeding activities, enhance the nutritional and health value of livestock products, and realize the organic connection between small herders and the development of modern animal husbandry. On the other hand, strengthen the adjustment of the supply structure of livestock products. Promote the development of nutritional animal husbandry and functional animal husbandry, focusing on increasing the production and supply of highly nutritious livestock products and functional livestock products such as milk and poultry eggs. Continuously improve the dietary structure of consumers, realize the effective supply of green livestock products, and provide guarantee for food safety. In particular, in the context of food safety and the process of dietary structure transformation, in order to meet people’s demand for green livestock products rich in protein, such as milk and poultry eggs, we promote the green transformation development of grass-fed livestock industry and build a nutrition-oriented production model of livestock industry.
Fourth, to expand and strengthen the characteristic animal husbandry industry, and promote the transformation from a large livestock country to a strong livestock country. On the one hand, in the context of the new era of China’s changing livestock production pattern, traditional grassland pastoral areas should give full play to the advantages of livestock resource endowment and continuously improve the production capacity of herbivorous livestock products. Create special livestock production belts through special projects to enhance the production status of modern animal husbandry. On the other hand, in the process of shifting the center of gravity of livestock production and the change of dominant production areas, promote the transformation of livestock production belts to industrial belts locally or nearby through the implementation of livestock industrialization projects. Insist on promoting the synergistic development of livestock product industrial belts, enhancing the status of production areas and constructing the whole industrial chain of livestock industry. Strengthen industrial agglomeration at the level of the whole industry chain and realize the transformation from a large livestock production country to a powerful livestock industry country.
6.2. Further Discussion
Overall, the comprehensive production capacity of China’s animal husbandry has been continuously improved, the sustainable supply capacity of animal products has been enhanced, and the comprehensive level of animal husbandry has been significantly enhanced. However, compared with countries with developed animal husbandry, there is still great potential for the development of China’s livestock production system and sustainable development capacity. Take Japan, Brazil and Australia as an example. In terms of improved breeding, Japan began to attach importance to improved breeding in animal husbandry in the early 20th century and developed a high-quality beef cattle breed (Wagyu). Brazil introduced the Temporary Regulations for the Conservation of Biodiversity and Genetic Resources in 2001, with emphasis on breeding techniques for Nellore cattle. Australia provides R&D funding for livestock breeding through industry associations. In terms of support for production facilities, Japan has a well-developed system of support for facility costs, with the central government and prefectures subsidizing 50% and 25%, respectively. Brazil provides $43,000 in subsidies per livestock farmer. Australia offers a 40% tax break for first-time farmers buying farm machinery. In terms of product support, the Japanese government provides 50% of the subsidies for losses due to price fluctuations, and local finances bear 25% of the losses. Brazil has established a market information platform to help sell livestock products. Australia provides price subsidies for livestock products by taxing consumers or setting up industry funds.
Sustainable development is an important symbol of the modernization of animal husbandry. Currently, China is in a critical period of transformation of the green development of animal husbandry. Promoting sustainable development of animal husbandry is an important task and goal for the present and future period. In the coming period, the key directions for the sustainable development of animal husbandry are to establish and improve the laws and regulations that promote the sustainable development of animal husbandry, focus on strengthening the breeding of good breeds, improve the mechanization level of animal husbandry, optimize the subsidy system of animal husbandry industry, etc. We will accelerate the formation of a new pattern of livestock production in China that is led by a green and low-carbon transformation of the development mode, driven by green innovation and supported by industrialization.


