Article

Hospital Plate Waste Assessment after Modifications in Specific Dishes of Flexible and Inflexible Food Ordering Systems

1
Department of Nutrition, Food Science and Physiology, School of Pharmacy, University of Navarra, Irunlarrea 1, 31008 Pamplona, Spain
2
Center for Nutrition Research, University of Navarra, Irunlarrea 1, 31008 Pamplona, Spain
3
IdisNA, Navarra Institute for Health Research, 31008 Pamplona, Spain
4
Diets Area, University Clinic of Navarra, Irunlarrea 1, 31008 Pamplona, Spain
5
Department of Microbiology and Parasitology, School of Medicine, University of Navarra, Irunlarrea 1, 31008 Pamplona, Spain
*
Author to whom correspondence should be addressed.
Sustainability 2022, 14(23), 15616; https://doi.org/10.3390/su142315616
Submission received: 10 October 2022 / Revised: 18 November 2022 / Accepted: 22 November 2022 / Published: 24 November 2022
(This article belongs to the Section Sustainable Food)

Abstract

:
Previous studies on hospital food waste have focused on raising awareness among patients about this problem. The aim of the study was to quantify the food waste in a flexible and inflexible ordering system from a hospital located in the north of Spain in order to implement specific modifications to reduce the waste. The avoidable waste of 15 dishes was determined in the flexible (choice menu) and inflexible (basal diet) ordering system by weighing the avoidable waste from the same dish and diet by conglomerate. Milk, chicken and lunch fish generated more than 25% of plate waste and were classified as critical dishes, with the choice menu being the one that obtained the lowest percentages of waste. The implemented modifications in the case of milk (reducing the serving size) did not decrease the waste percentage. By contrast, the new chicken recipes and the increased fish variety in the inflexible ordering system decreased the plate waste in both dishes from 35.7% to 7.2% and from 29.5% to 12.8%, respectively. Identifying critical dishes, implementing actions to reduce the food waste and monitoring the progress are essential measures to decrease plate waste in hospitals.

1. Introduction

According to the United Nations, 17% of available food is wasted [1]. This translates to the unnecessary loss of all resources used for the production of these foods, with the aggravating circumstance that natural resources are deficient in many parts of the world. It is estimated that two-thirds of the fresh water available on our planet is used for crop irrigation and food wasted annually globally consumes 306 km3 of water in its production [2]. On the other hand, food waste also contributes to climate change as the food chain produces 34% of global greenhouse gases [3]. In addition, it is unethical that while one part of the population throws away food, the other is in need of it [4]. In 2020, after the coronavirus disease pandemic (COVID-19), the number of undernourished people was estimated to increase by 132 million to 820 million people (8.9% of the world’s population) [5].
A European food waste study stated that 50% of the avoidable and unavoidable food waste occurs at the consumption stage [6]. Most of the avoidable waste comes from households (11%) and food services (5%), with associated costs of EUR 98 billion and EUR 20 billion, respectively [7]. At the hospital level, Carino et al. [8] found that food waste represents around 20% to 30% of the overall hospital waste, although a range from 17% to 74% was reported. Food waste in hospitals means a lower food intake by patients, that contributes partly to deterioration in the patients’ nutritional status as reported by van Bokhorst et al. [9].
All of this opposes the 12th Sustainable Development Goal (SDG) [10]. This goal attempts to ensure responsible production and consumption patterns in general, but target 12.3 focuses exclusively on food waste, seeking to reduce global food waste per capita by a half at the production and consumer level by 2030 [1]. These facts have led researchers across Europe to develop studies addressing hospital food waste and other issues as part of a more sustainable food strategy [11]. One of the largest studies developed by Health Care Without Harm Europe (HCWH) is the Model of Circular Economy of French Hospitals (MECAHF) project [12]. After quantifying the waste, they implemented actions to reduce waste by focusing on raising awareness among patients about this problem through leaflets and posters. In re-evaluating the situation, they observed a 20% decrease in the generated waste.
In this context, the main aim of this study was to quantify the food waste from a hospital located in the north of Spain, in order to propose some measures to reduce it. Thus, the avoidable waste of the dishes in the basal diet (inflexible ordering system) and in the choice menu (flexible ordering system) was determined and compared in the first stage. According to the quantified waste, some modifications were applied in plates classified as “critical” in order to reduce food waste, and new quantifications were performed in the second stage.

2. Materials and Methods

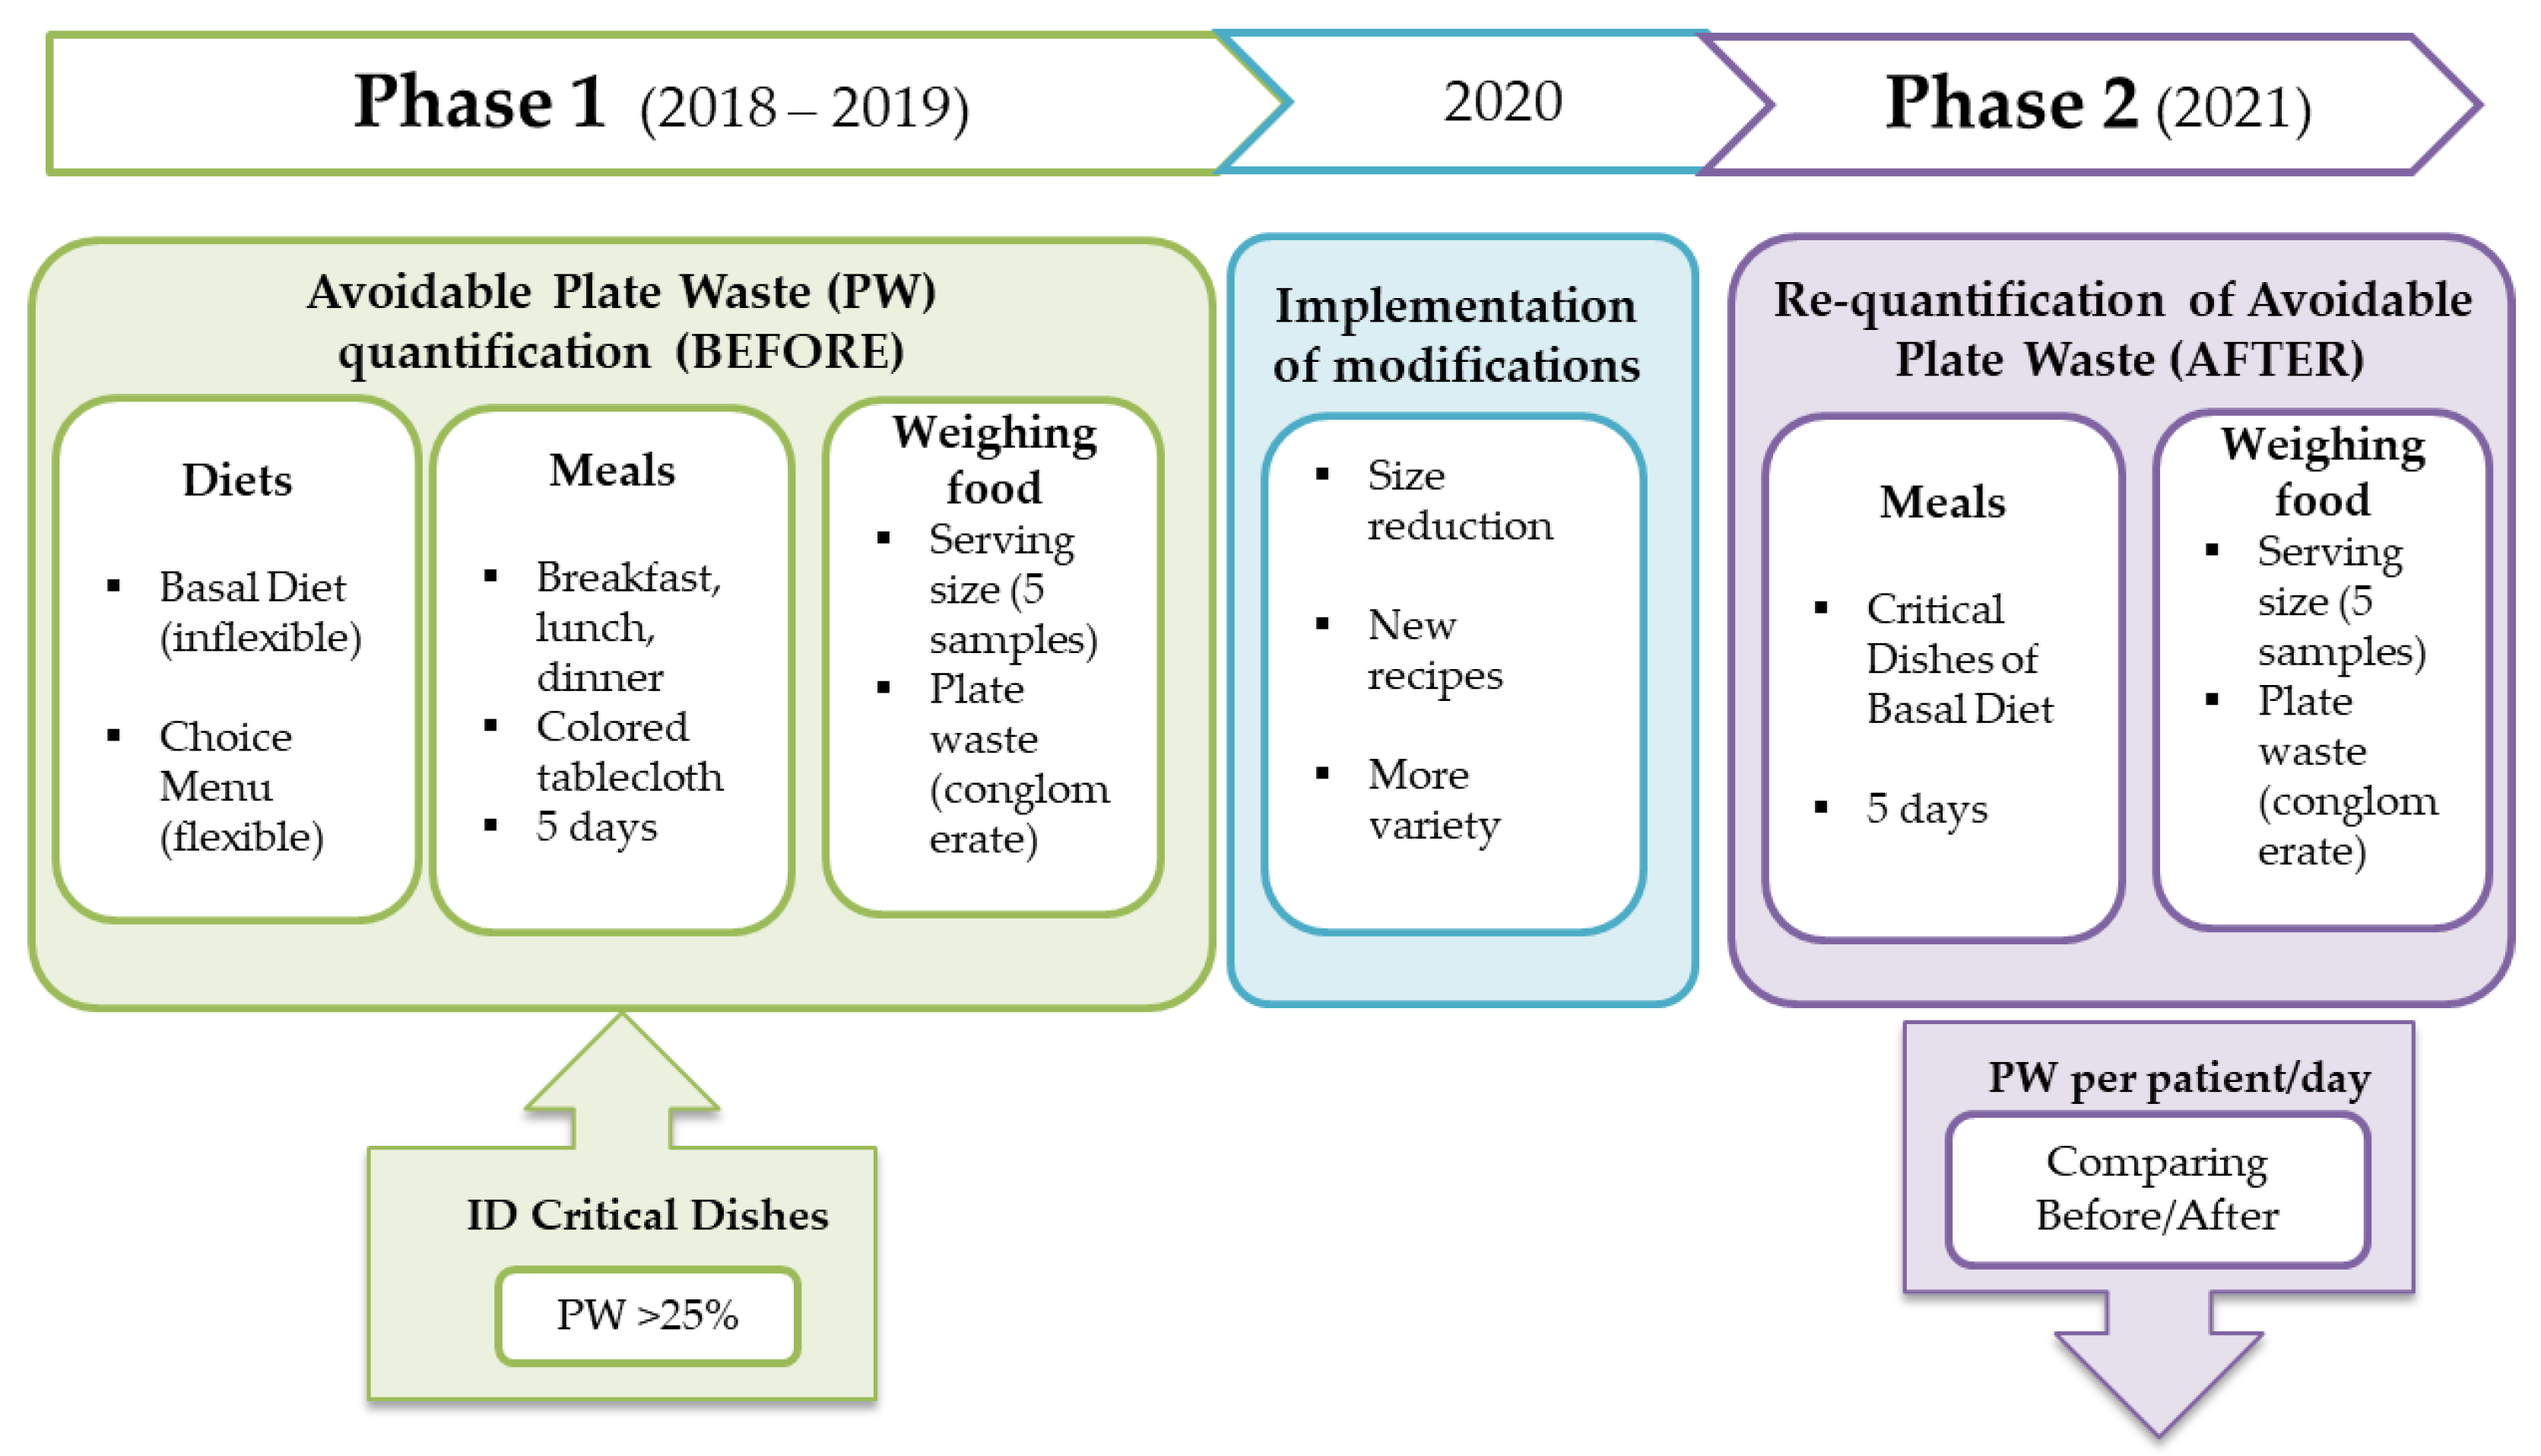
2.1. Case Study Description

The study was carried out in a private hospital located in the north of Spain, with 26 areas of specialization and an availability of 400 beds.
The catering food system offers 125 diet categories, according to the clinical and pathological situation of patients. The study was performed in the two most extensive ones among the standard adult diets: the basal diet and the choice menu (inflexible and flexible ordering systems, respectively). These two diets are designed for patients who do not need specific dietary changes and are prescribed according to the doctor’s opinion. The unique difference between both diets is the possibility of choosing between 6 options for each first course, main course, dessert and drink in the choice menu. The basal diet (with no possibility of choice) is usually prescribed when it is necessary to monitor the patient intake or depending on the time of admission.
A menu rotation is carried out every 4 weeks. All meals are cooked daily and served in individual trays, which are transported in trolleys at scheduled times (breakfast at 8:30 a.m., lunch at 1:10 p.m., dinner at 7:45 p.m.). The study was carried out on the three main meals (breakfast, lunch and dinner), including salted and unsalted preparations.
The case study was divided into 2 phases (Figure 1). The first one corresponds to the plate waste analysis performed between 2018 and 2019 on 4641 plates from both diets (basal and choice menu), before the dietary department implemented modifications on dishes (Table 1). Phase 2 corresponds to the re-evaluation of plate waste on the identified “critical plates” according to the determined waste (≥ 25% plate waste per person a day), one year after the implementation of modifications (Figure 2), covering a total of 695 plates from the basal diet.

2.2. Food Waste Quantification Method

Food waste of dishes from Table 1 was determined and referred to as plate waste (PW). PW was measured by weighing food as this methodology has been reported to provide more accurate and objective results, despite it requiring more resources and time [13]. According to Strotmann et al. [14], wastes were quantified on working days excluding weekends, vacation periods and public holidays. During the plating of each main meal, a colored tablecloth was placed on the trays from which the waste would be quantified. In phase 2, trays from COVID-19 patients were excluded to avoid cross-contamination.
The food served and wasted was weighed with a COBOS JCP-30 scale (accuracy 1 g). The average weight of 5 sample preparations of each of the dishes was considered the amount of food served to each person per day. The Spanish Food Composition Database [15] was used to identify the edible weight of each dish. After each service, the trays were received in the dishwashing area of the kitchen and the waste was sorted according to the dish and diet. Skin, bones and other non-edible parts of chicken and fish were discarded. Then, the avoidable waste from the same dish and diet was weighed by conglomerate. The quantification per dish was repeated for 5 randomly selected days.
The following formulas were used to calculate the plate waste per patient per day (PW per patient per day) in grams (g) and percentage (%) [16]:
PW   per   patient   per   day   ( g ) =   i = 1   n (   f o o d   w a s t e   i   P i ) / n   ,
where:
i: specific day i.
n: total number of measurement days.
P i : number of patients for day i.
food waste i: food waste for day i.
PW   per   patient   per   day   ( % ) = (   p l a t e   w a s t e   p e r   p a t i e n t   p e r   d a y   ( g ) f o o d   s e r v e d   p e r   p a t i e n t   p e r   d a y   ( g )   ) × 100 ,
where:
food served per patient per day: average weight of 5 sample dish preparations.

2.3. Statistical Analysis

The data were analyzed using the statistical software STATA Version 12. All results were described with mean and standard deviation. Student’s t-test was used to compare the plate waste between diets in phase 1 and to compare the waste before and after the implemented modifications in dishes in phase 2. A p-value < 0.05 was considered statistically significant.

3. Results

3.1. Phase 1: Plate Waste Analysis before Modifications

The results of the plate waste analysis performed during phase 1 (before modifications) are shown in Table 2. It must be noted that the number of quantifications on the choice menu is almost four times smaller for each dish than in the basal diet, since patients have other options to choose from in each meal. In the case of legumes and chicken, a statistical analysis could not be conducted because choice menu data were limited (1 day waste quantification).
Breakfast data were based on the basal diet, since the dishes and serving size were the same in both diets (patients with choice menu do not have the possibility to choose the breakfast). Milk was measured in both diets and was ranked as the dish with the highest waste (29.7% of plate waste per patient per day).
Lunch and dinner data were analyzed for each diet. In the basal diet, six dishes were measured at lunch (two first courses, three main courses and one side dish). The highest PW percentages come from chicken (35.7% patient/day) and fish (29.5% patient/day). At dinner, four dishes were taken into consideration (two first courses and two main courses). None of the dishes reached 25% of PW percentage patient/day, with fish and soup being the highest ones (22.1% and 20.5%, respectively).
No significant differences were found between PW percentages of dishes from both diets (Table 2). However, the choice menu presents in general a lower PW for each dish, with the highest observed reduction of PW in the fish at lunch (12.1% versus 29.5%).
From the highest PW percentages found in the basal diet, the dietary department selected three “critical dishes”: milk, chicken and fish (lunch).

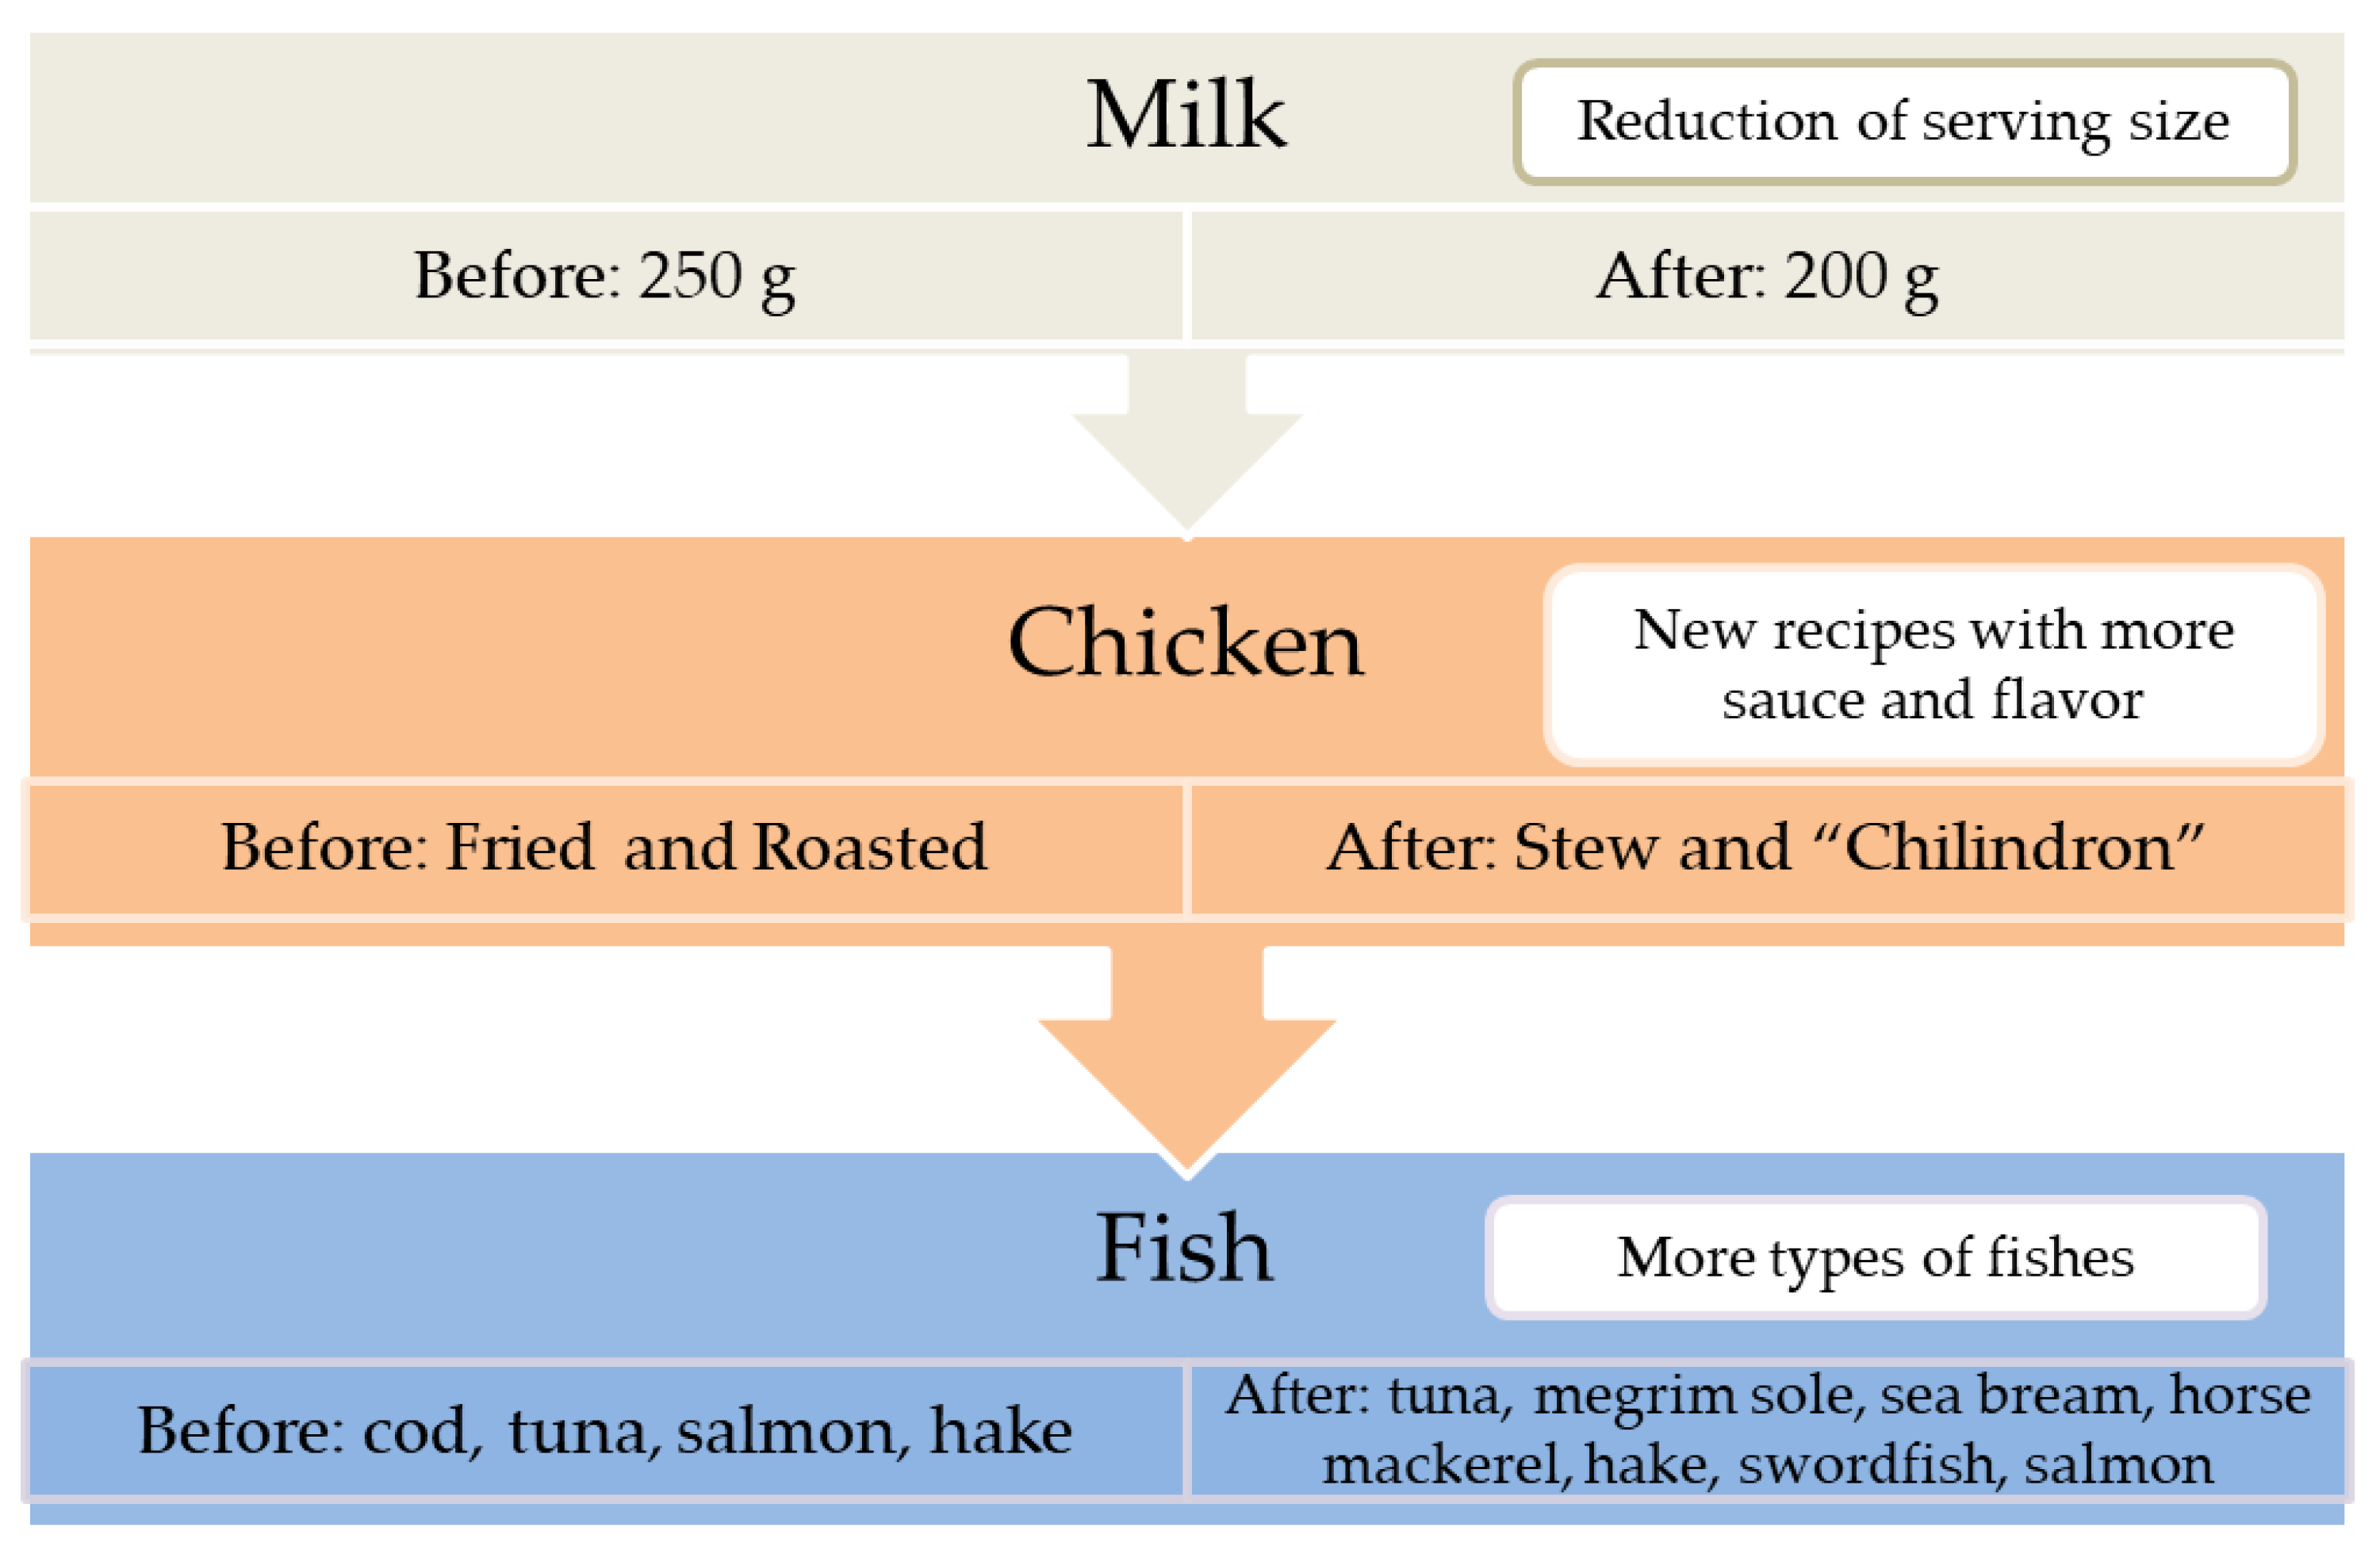
3.2. Phase 2: Plate Waste Analysis after Modifications

The food served and wasted per person per day before and after the implemented modifications is summarized in Table 3 for each “critical dish”.
The serving size of milk decreased 35 g after the modifications, but only 7.5 g was removed from the amount of waste generated per person a day. As a result, the PW per patient per day (%) did not decrease after modifying the individual serving size of milk.
Regarding chicken waste, the PW per patient per day (%) decreased in the basal diet (p = 0.06) after the new recipes were implemented, despite the 62.2 g increase in the serving size.
Finally, the fish PW per patient per day (%) at lunch was lower after increasing the variety of the types of fish served, with an average increase in the serving size due to the variety of fish presentations. Nonetheless, the Student’s t-test analysis did not present a significant PW decrease.

4. Discussion

The hospital food service designs the patient menus according to their pathology and particular needs. However, very often patients do not consume the entire menu, which has a negative impact on their health. In addition, food waste generated at hospitals has a high economic and environmental impact. In this context, the objective of this study was to identify which plates are the most wasted in the most extensive diets of a private Spanish hospital, in order to determine possible interventions to reduce it. It is possible that the total food waste generated in a private hospital is lower than that produced in a public one, due to a possibly higher budget for the development of the menus. However, we consider that the performed approach to recognize dishes with highest losses is valid for both public and private hospitals.
The quantified wastage on the inflexible ordering system (basal diet) ranged between 11.5% and 35.7% (egg and chicken, respectively). These results are in accordance with those reported in other hospital studies worldwide [17,18,19,20,21,22,23], with an average food waste between 24% and 56%. However, the difficulty of comparing data between publications due to variations in the characteristics of hospitals, waste quantification methodology or food classification must be taken into account. For instance, in the present study, the measurement of food waste was focused on specific dishes, and consequently, the determined PW per patient per day referred only to those dishes, which makes it difficult to compare the obtained results with other studies. These limitations were also noted in the Food Waste Index 2021 [7], proposed by the United Nations Environment Programme (UNEP) to unify the waste data for each country and monitor their progress. This proposal requires quantifying the waste of the total amount of food served in the meals.
Waste does not only vary according to the dish, it also differs according to the possibility of patient choice [20,24,25,26,27]. No differences were observed between the diets, although in the flexible ordering system (choice menu), the patients have the possibility to choose what they want to eat according to their appetite and preferences, so it is expected to find fewer leftovers on the plate. In fact, it has been demonstrated that offering optional menus is one of the most common and effective approaches to increase consumption and decrease food waste [13]. Accordingly, the smallest percentages of food waste in the present study were observed in the choice menu, with a more pronounced difference in the case of fish dishes (29.5% BD and 12.1% CM at lunch; 22.1% BD and 13.5% CM at dinner). Considering that fish is not an extensively accepted dish, patients who choose fish (flexible ordering system) prefer it to other options. Given that the critical items analyzed are a source of protein, the protein intake of the patients with prescribed CM may have increased, and consequently, their nutritional status would have improved. Similarly, McCray et al. [27] saw an increase in patients’ energy and protein intake, accompanied by a significant decrease in plate wastage when they had options to choose from. Other authors have also been able to observe directly in surveys [18] or indirectly in their studies [25] how important it is for patients to have several options to choose their menu. However, Dias-Ferreira et al. [24] concluded that including a flexible ordering system would not help to decrease production cost, CO2 emission and food waste as much as implementing a choice between different portion sizes or offering a bulk service system. Nevertheless, these implementations require a total modification of the current system in many hospitals and economic feasibility studies.
According to the established criteria of ≥25% PW patient/day, three critical dishes of BD (milk, chicken and fish at lunch) were selected for phase 2. Despite the highest PW percentage observed in the chicken of CM (63.1%), this dish was not included in the second phase due to a possible overestimated PW. The measured waste corresponded to only 1 day of quantification and the low number of plates analyzed may have affected the determined PW percentages. The modifications implemented in phase 2 were based on suggestions made by the patients and nursing staff, as well as those reported in the literature. A narrative review on hospital food waste summarized the reasons why patients do not finish their meals in four categories [28]: poor appetite due to their illness, service schedules, physical problems such as loss of mobility and the taste and quality of the food. Therefore, the modifications consisted of the reduction of milk serving size, new recipes for chicken and higher variety of fish dishes.
The implemented changes reduced the food waste of critical dishes, with the exception of milk (Table 3). The quantity of served milk was reduced from 240 g to 205 g when the individual jugs were replaced, while the size of the cups was preserved. A similar approach was taken on a hospital in Ireland [29], but contrary to our findings, they saw a 44% reduction in milk waste when reducing the amount of milk served in individual jugs. Given that it is the patients themselves who pour the desired amount of milk and that the cups have the same capacity, it can be considered that the problem lies in the size of the cups and not so much in the ration of milk offered in the jugs. For this reason, the Diet Service has considered replacing the cups with larger ones.
In the case of chicken, the implemented strategy was to offer new, more tasty and appealing preparations, allowing the decrease in PW values (Table 3). Whereas roasted chicken has continued to be served, chicken “chilindron” or chicken stew is now more frequently served. Williams and Walton [28] already sensed the effect that similar interventions could have by classifying them as easy and inexpensive measures to reduce food waste. In a similar way, Navarro et al. [21] observed a 19% plate waste reduction after modifying the plate presentation. However, Strotmann et al. [16] did not observe a reduction in waste when implementing service changes such as more descriptive menus, raising awareness of waste through posters or modifying rations according to population group. Given that food-focused actions [21] were more effective than service-oriented actions [16], it would be advisable to spend time developing new attractive dishes for patients, including changes in taste, texture and presentation of the dishes. According to this, the Diet Service increased the variety of fish and culinary elaborations (from two to seven types served at each meal), resulting in a significant PW reduction.
A periodic food waste evaluation should be implemented in each hospital in order to identify the specific critical dishes to keep improving the meals and reducing plate waste. The present study has some limitations such as the evaluation of only part of the diets served in the hospital, due to the the difficulty of quantifying all the wastes returned in the trays to the kitchen, even in a small private hospital as in this case. Future studies could combine food weighing with other novel methodologies, such as visual estimation of food waste through cameras [30].
In conclusion, a reduction of food waste was observed when implementing specific modifications to each critical dish, such as new chicken recipes and increasing the variety of fish served. Therefore, reduction of food waste in hospitals is possible but it is necessary to make a diagnosis of the current situation in each center. Identifying critical dishes, implementing actions to reduce food waste and monitoring progress after implementation is the ideal process to reduce waste and create a sustainable feeding system.

Author Contributions

Resources, L.G. and C.U.; methodology, investigation and data curation, C.H., D.S. and L.P.; formal analysis and writing—original draft preparation, L.P.; conceptualization, supervision and writing—review and editing, R.G. and A.I.V. All authors have read and agreed to the published version of the manuscript.

Funding

This research received no external funding.

Institutional Review Board Statement

Not applicable.

Informed Consent Statement

Not applicable.

Conflicts of Interest

The authors declare no conflict of interest.

References

  1. ONU. 17 SDG History; ONU: New York, NY, USA; Available online: https://sdgs.un.org/goals (accessed on 23 July 2021).
  2. Poore, J.; Nemecek, T. Reducing Food’s Environmental Impacts through Producers and Consumers. Science 2018, 360, 987–992. [Google Scholar] [CrossRef] [PubMed] [Green Version]
  3. Crippa, M.; Solazzo, E.; Guizzardi, D.; Monforti-Ferrario, F.; Tubiello, F.N.; Leip, A. Food Systems Are Responsible for a Third of Global Anthropogenic GHG Emissions. Nat. Food 2021, 2, 198–209. [Google Scholar] [CrossRef]
  4. Mestre Montserrat, M.; Martínez Sánchez, V. Desperdicio Alimentario, Análisis de Una Problemática Poliédrica. Pap. Relac. Ecosociales Cambio Glob. 2013, 139, 93–103. [Google Scholar] [CrossRef]
  5. FAO; IFAD; UNICEF; WFP; WHO. Brief to The State of Food Security and Nutrition in the World 2020; FAO: Rome, Italy; IFAD: Rome, Italy; WFP: Rome, Italy; UNICEF: New York, NY, USA, 2020. [Google Scholar] [CrossRef]
  6. Stenmarck, A.; Jensen, C.; Quested, T.; Moates, G.; Buksti, M.; Cseh, B.; Juul, S.; Parry, A.; Politano, A.; Redlingshofer, B.; et al. Estimates of European Food Waste Levels; FUSION EU: Oxfordshire, UK, 2016. [Google Scholar]
  7. UNEP. Food Waste Index Report 2021; UNEP: Nairobi, Kenya, 2021. [Google Scholar]
  8. Carino, S.; Porter, J.; Malekpour, S.; Collins, J. Environmental Sustainability of Hospital Foodservices across the Food Supply Chain: A Systematic Review. J. Acad. Nutr. Diet. 2020, 120, 825–873. [Google Scholar] [CrossRef] [PubMed]
  9. Van Bokhorst-De Van Der Schueren, M.A.E.; Roosemalen, M.M.; Weijs, P.J.M.; Langius, J.A.E. High Waste Contributes to Low Food Intake in Hospitalized Patients. Nutr. Clin. Pract. 2012, 27, 274–280. [Google Scholar] [CrossRef]
  10. ONU. Goal 12: Responsible Consumption and Production; ONU: Ada, OH, USA; Available online: https://www.un.org/sustainabledevelopment/sustainable-consumption-production (accessed on 23 July 2021).
  11. HCWH Europe. Fresh, Healthy, and Sustainable Food. Best Practices in European Healthcare; HCWH Europe: Brussels, Belgium; Berlin, Germany, 2016; Volume 57. [Google Scholar]
  12. HCWH Europe. El Proyecto MECAHF; HCWH Europe: Brussels, Belgium, 2020. [Google Scholar]
  13. Antasouras, G.; Vasios, G.K.; Kontogiorgis, C.; Ioannou, Z.; Poulios, E.; Deligiannidou, G.-E.; Troumbis, A.Y.; Giaginis, C. How to improve food waste management in hospitals through focussing on the four most common measures for reducing plate waste. Int. J. Health Plann. Mgmt. 2022, 1–21. [Google Scholar] [CrossRef] [PubMed]
  14. Strotmann, C.; Göbel, C.; Friedrich, S.; Kreyenschmidt, J.; Ritter, G.; Teitscheid, P. A Participatory Approach to Minimizing Food Waste in the Food Industry-A Manual for Managers. Sustainability 2017, 9, 66. [Google Scholar] [CrossRef] [Green Version]
  15. BEDCA. Base de Datos española de Composición de Alimentos. Available online: https://www.bedca.net/bdpub/index.php (accessed on 30 June 2021).
  16. Strotmann, C.; Friedrich, S.; Kreyenschmidt, J.; Teitscheid, P.; Ritter, G. Comparing Food Provided and Wasted before and after Implementing Measures against Food Waste in Three Healthcare Food Service Facilities. Sustainability 2017, 9, 1409. [Google Scholar] [CrossRef] [Green Version]
  17. Alharbi, N.S.; Qattan, M.Y.; Alhaji, J.H. Towards Sustainable Food Services in Hospitals: Expanding the Concept of “plate Waste” to “Tray Waste”. Sustainability 2020, 12, 6872. [Google Scholar] [CrossRef]
  18. Aminuddin, N.F.; Kumari Vijayakumaran, R.; Abdul Razak, S. Patient Satisfaction With Hospital Food Service and Its Impact on Plate Waste in Public Hospitals in East Malaysia. Hosp. Pract. Res. 2018, 3, 90–97. [Google Scholar] [CrossRef] [Green Version]
  19. Eriksson, M.; Malefors, C.; Bergström, P.; Eriksson, E.; Osowski, C.P. Quantities and Quantification Methodologies of Food Waste in Swedish Hospitals. Sustainability 2020, 12, 3116. [Google Scholar] [CrossRef] [Green Version]
  20. Gomes, A.; Saraiva, C.; Esteves, A.; Gonçalves, C. Evaluation of Hospital Food Waste-A Case Study in Portugal. Sustainability 2020, 12, 6157. [Google Scholar] [CrossRef]
  21. Navarro, D.A.; Boaz, M.; Krause, I.; Elis, A.; Chernov, K.; Giabra, M.; Levy, M.; Giboreau, A.; Kosak, S.; Mouhieddine, M.; et al. Improved Meal Presentation Increases Food Intake and Decreases Readmission Rate in Hospitalized Patients. Clin. Nutr. 2016, 35, 1153–1158. [Google Scholar] [CrossRef]
  22. Schiavone, S.; Pelullo, C.P.; Attena, F. Patient Evaluation of Food Waste in Three Hospitals in Southern Italy. Int. J. Environ. Res. Public Health 2019, 16, 4330. [Google Scholar] [CrossRef] [PubMed] [Green Version]
  23. Sonnino, R.; McWilliam, S. Food Waste, Catering Practices and Public Procurement: A Case Study of Hospital Food Systems in Wales. Food Policy. 2011, 36, 823–829. [Google Scholar] [CrossRef]
  24. Dias-Ferreira, C.; Santos, T.; Oliveira, V. Hospital Food Waste and Environmental and Economic Indicators—A Portuguese Case Study. Waste Manag. 2015, 46, 146–154. [Google Scholar] [CrossRef] [PubMed]
  25. Freil, M.; Nielsen, M.A.; Biltz, C.; Gut, R.; Mikkelsen, B.E.; Almdal, T. Reorganization of a Hospital Catering System Increases Food Intake in Patients with Inadequate Intake. Scand. J. Food Nutr. 2006, 50, 83–88. [Google Scholar] [CrossRef]
  26. Maunder, K.; Lazarus, C.; Walton, K.; Williams, P.; Ferguson, M.; Beck, E. Energy and Protein Intake Increases with an Electronic Bedside Spoken Meal Ordering System Compared to a Paper Menu in Hospital Patients. Clin. Nutr. ESPEN 2015, 10, e134–e139. [Google Scholar] [CrossRef] [Green Version]
  27. McCray, S.; Maunder, K.; Krikowa, R.; MacKenzie-Shalders, K. Room Service Improves Nutritional Intake and Increases Patient Satisfaction While Decreasing Food Waste and Cost. J. Acad. Nutr. Diet. 2018, 118, 284–293. [Google Scholar] [CrossRef]
  28. Williams, P.; Walton, K. Plate Waste in Hospitals and Strategies for Change. e-SPEN Eur. e-J. Clin. Nutr. Metab. 2011, 6, 235–241. [Google Scholar] [CrossRef] [Green Version]
  29. Green Healthcare EPA. Food Waste Reduction Programme Case Study St.Michael’s Hospital-Dun Laoighaire; Green Healthcare Programme; Green Healthcare EPA: Washington, DC, USA, 2013. [Google Scholar]
  30. Monteiro, D.M.S.; Brockbank, C.; Heron, G. Food Waste in Event Catering: A Case Study in Higher Education. J. Food Prod. Marke. 2020, 26, 262–278. [Google Scholar] [CrossRef]
Figure 1. Flow chart of the performed study.
Sustainability 14 15616 g001
Figure 2. Identified critical plates and applied modifications.
Sustainability 14 15616 g002
Table 1. Dishes taken into consideration for the plate waste analysis in phase 1 in the studied diets.
MealItemDishDish Characteristics
BreakfastDrinkMilkOnly milk
DessertPastryHomemade pastry
ComplementaryOlive oil, jam and sugarIndividual packet
LunchFirst courseVegetablesWithout sauce
LegumesWithout sauce
Main courseFishCod, tuna. Without bones, fat, skin or sauce
ChickenFried, roasted. Without bone, fat, skin or sauce
Red meatGrilled, baked. Without fat or sauce
Side dishWarm side dishVegetables (baked, grilled) or fried potatoes
DinnerFirst courseSoupWith pasta, vegetables or semolina
PuréeVegetable purée
Main courseEggOmelette with vegetables or potato
FishSalmon, hake. Without bones, fat, skin or sauce
Table 2. Average quantities of food serving size and plate waste per person per day in dishes from basal diet and choice menu before modifications.
DishDietnSS Patient/Day (g)
Mean (sd)
PW Patient/Day (g)
Mean (sd)
PW Patient/Day (%)
Mean (sd)
p Value 1
Breakfast
MilkBD and CM530240.3 (9.2)71.0 (9.88)29.5 (4.1)
Olive oilBD35510.0 (0.0)2.4 (0.5)24.3 (4.5)
JamBD33125.0 (0.0)3.4 (1.3)13.6 (5.1)
SugarBD39210.0 (0.0)2.3 (0.1)22.9 (1.2)
PastryBD32061.2 (2.9)7.9 (0.7)12.9 (1.3)
Lunch
VegetablesBD188228.1 (38.2)33.6 (7.6)14.7 (1.7)0.49
CM47267.1 (7.0)49.1 (31.1)18.4 (11.5)
LegumesBD195266.4 (54.3)48.0 (17.4)17.7 (2.8)nd
CM16271.6 (18.7)44.3 2 16.3 2
FishBD218151.9 (27.7)42.7 (14.9)29.5 (14.6)0.11
CM51130.2 (33.0)14.6 (13.1)12.1 (13.4)
ChickenBD199166.7 (28.3)61.0 (41.9)35.7 (20.3)nd
CM9132.8 (10.9)64.9 263.1 2
Read meatBD203102.3 (15.9)24.4 (17.8)24.0 (18.6)0.59
CM62113.4 (55.6)23.4 (21.7)19.4 (11.1)
Warm side dishBD18855.2 (23.6)13.8 (11.0)21.9 (11.5)0.90
CM51142.8 (42.9)20.6 (16.0)20.2 (24.8)
Dinner
SoupBD214258.3 (10.4)153.1 (16.7)20.5 (6.2)0.95
CM85235.7 (18.8)48.7 (21.0)20.8 (9.1)
PuréeBD313229.5 (22.0)34.3 (9.2)14.9 (3.5)0.56
CM37230.7 (24.7)41.1 (23.8)18.0 (10.8)
EggBD295148.5 (16.2)17.3 (9.8)11.5 (5.9)0.81
CM62170.2 (36.6)16.7 (12.2)10.5 (7.7)
FishBD211144.9 (10.1)31.5 (7.3)22.1 (6.7)0.41
CM69111.7 (54.1)9.4 (12.4)13.5 (18.6)
SS—serving size; PW—plate waste; BD—basal diet; CM—choice menu. n—number of dishes evaluated; sd—standard deviation; nd—not determined. 1 Student’s t-test. A p value < 0.05 was considered statistically significant. 2 Plate waste determined on only one day.
Table 3. Average quantities of food serving size and plate waste per person per day in dishes of basal diet before and after performed modifications.
Critical DishnSS Patient/Day (g)
Mean (sd)
PW Patient/Day (g)
Mean (sd)
PW Patient/Day (%)
Mean (sd)
p Value 1
BeforeAfterBeforeAfterBeforeAfterBeforeAfter
Milk530446240.3205.671.0 (9.9)63.5 (21.4)29.5 (4.1)30.9 (10.4)0.81
Chicken199114166.7 (28.3)228.9 (1.0)61.0 (41.9)16.4 (9.3)35.7 (20.3)7.2 (4.0)0.06
Fish (lunch)218135151.9 (27.7)126.0 (27.5)42.7 (14.9)17.3 (11.0)29.5 (14.6)12.8 (7.4)0.06
SS—serving size; PW—plate waste; n—number of dishes evaluated; sd—standard deviation. 1 Student’s t-test. A p value < 0.05 was considered statistically significant.
Publisher’s Note: MDPI stays neutral with regard to jurisdictional claims in published maps and institutional affiliations.

