

Economic Efficiency of the Implementation of Digital Technologies in Energy Power


Abstract
1. Introduction
Literature Review
2. Materials and Methods
- -
- An increase in material costs leads to an increase in sales revenue for NPP and HPP but a decrease in sales revenue for TPP;
- -
- An increase in depreciation deductions causes the sales revenue and EBIT to rise;
- -
- An increase in miscellaneous costs leads to a decrease in EBIT for NPP and HPP but a growth in sales revenue and EBIT for TPP.
- Economic efficiency of the implementation of digital tools due to the decrease in energy production costs , [rub] is present if , when , then . In this case, . In order to determine the economic efficiency of the implementation of digital tools due to the decrease in energy production costs, we need to solve the following optimization problem: ;
- Economic efficiency of the implementation of digital tools due to the increase in energy sales revenue , [rub] is present if , when , then . In this case, . In order to determine the economic efficiency of the implementation of digital tools due to the increase in energy sales revenue, we need to solve the following optimization problem: ;
- Aggregated economic efficiency due to the changes in energy production costs as well as energy sales revenue , [rub] is present if , when . That is, the energy sales profit growth rate after the implementation of digital technology is higher than the energy sales profit growth rate before the implementation of digital technology. In this case, .
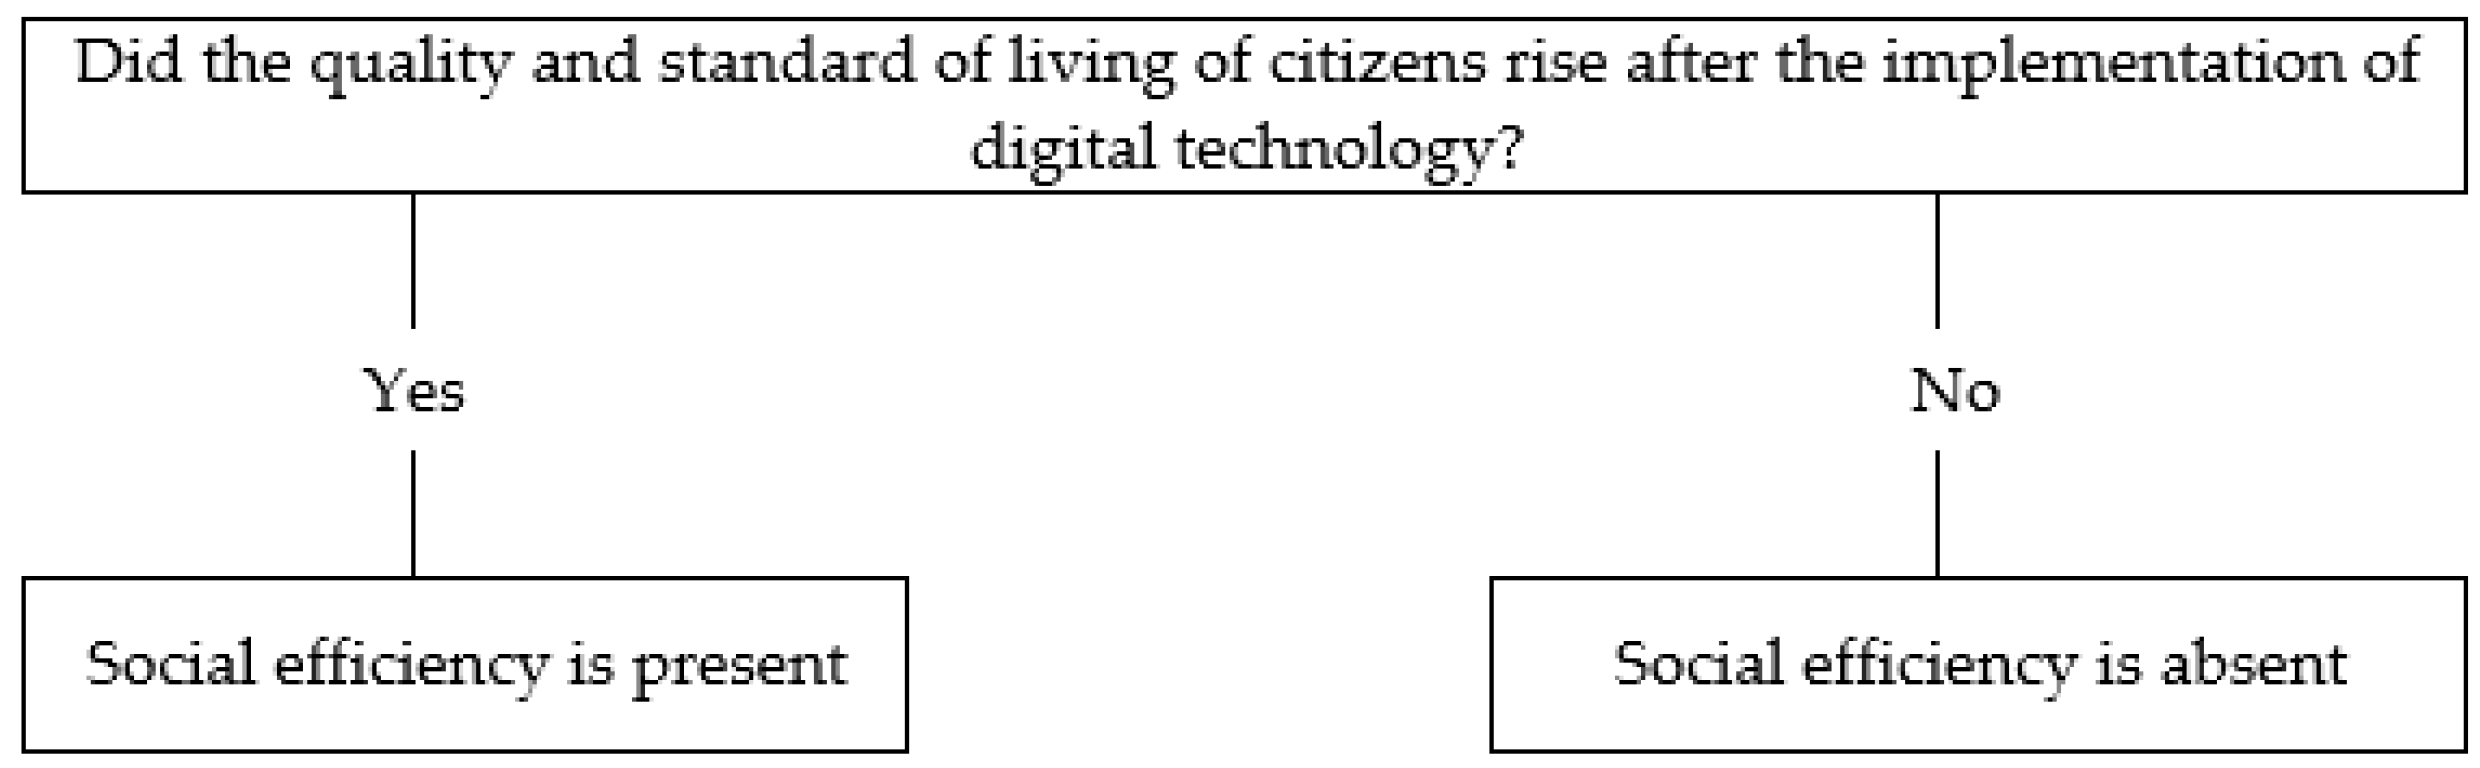
- Social efficiency ( of the implementation of digital tool due to the reduction in mortality, GHG emissions, the increase in energy availability, etc.
- Economic efficiency of the implementation of digital technology is absent (, , , and social efficiency is absent (). In this case, the implementation of digital technology is not feasible from both economic and social perspectives.
- Economic efficiency of the implementation of digital technology is absent (, , , and social efficiency is present (). In this case, it is necessary to assess the social effects and the possibility of its commercialization—for example, by receiving government grants, subsidies, tax benefits, etc.
- Economic efficiency of the implementation of digital technology is zero (, , ), and social efficiency is present (). In this case, the implementation of digital technology is feasible since it leads to the improvement of the quality and standard of living of citizens. The authors argue that if the social effect of the implementation of digital tools is due to a reduction in mortality and harm to human health, then the digital technology should undoubtedly be implemented for ethical reasons. This ethical principle has been implemented in Russian electric power companies.
2.1. Energy Cost Calculation Method before Implementation of Digital Technology
2.2. Digital Technology Cost Calculation Method
2.3. Energy Cost Calculation Method after Implementation of Digital Technology
2.4. Economic Efficiency of the Implementation of Digital Technology Due to the Decrease in Energy Production Cost
3. Results and Discussions
- Generate extra electric power;
- Avoid penalties imposed by the system operators at the electricity market;
- Reduce the cost of electricity due to savings in repairs;
- Reduce doses of irradiation for maintenance personnel (Table 7);
- Reduce greenhouse gas emissions due to nuclear generation without using fossil fuels, etc. (the results of research in this area will be presented in future articles of the authors).
- Prevention of unplanned shutdowns due to turbine generator failure;
- Transition from planned preventive maintenance to condition-based maintenance.
4. Conclusions
- The components of energy costs by type of energy generation;
- The components of digital technology costs;
- The volume of electricity production;
- Electricity tariffs.
- The development of an analytical notation to show that the digital technology cost depends on the speed and volume of its distribution, as well as the technology readiness level, the level of technological development of material and technical resources in the industry and in the country, and labor and capital availability. The cross-influence of industries is evident. Moreover, the authors have already obtained the analytical dependence of the cost of digital technology on the technology readiness level ), volume of distribution () and speed of distribution () of digital technology, and the effect of the technological scale ().
- Conducting comprehensive calculations for the evaluation of the economic efficiency of the implementation of the turbine in the electric power industry in Russia, taking into account the components of energy costs and the -cofficients.
- Estimation of the elasticity coefficients for the components of digital technology and energy cost. The obtained results will allow the planning of scientific and technological progress in the energy power industry, which would provide the state with a reasonable allocation of resources.
Author Contributions
Funding
Data Availability Statement
Conflicts of Interest
Appendix A. List of End-to-End Technologies and Sub-Technologies by Technological Readiness Level (TRL)

| Name of Technology | Sub-Technology | TRL World | TRL Russia |
|---|---|---|---|
| Wireless communication technologies | WAN (Wide Area Network) 5G/LTE | 8/9 | 3/4 |
| LPWAN (Low Power Wide Area Network) | 9 | 9 | |
| WLAN (Wireless Local Area Network) Li-Fi/Wi-Fi | 8/9 | 6/7 | |
| PAN (Personal Area Network) | 9 | 9 | |
| Satellite Communication Technologies Satellite Broadband/Satellite Internet of Things/Satellite Personal Communications | 9/2/6 | 5/2/5 | |
| Distributed registry systems | Data integrity and consistency technologies (consensus) | 8 | 8 |
| Technologies for creating and executing decentralized applications and smart contracts | 7 | 6 | |
| Data organization and synchronization technologies | 8 | 7 | |
| Robotics and sensorics components | Sensors and digital robotic kits’ components of for human–machine interaction | 7 | 7 |
| Sensor-motor coordination and spatial positioning technologies | 6 | 9 | |
| Sensors and sensory information processing | 6 | 9 | |
| New production technologies | Digital design, mathematical modeling, and product life cycle management (Smart Design) | 7–9 | 6–9 |
| Smart manufacturing technologies | 6–7 | 4–5 | |
| Manipulators and manipulation technologies | 6 | 9 | |
| Neurotechnology and artificial intelligence | Computer vision | 6 | 6 |
| Natural language processing | 6 | 6 | |
| Speech recognition and synthesis | 5 | 5 | |
| Recommendation systems and intelligent decision support systems | 7 | 5 | |
| Advanced AI methods and technologies | 2 | 2 | |
| Neuroprocessing | 5 | 5 | |
| Neurointerfaces, neurostimulation and neurosensing | 3 | 3 | |
| Quantum technologies | Quantum computing | 4–5 | 3–4 |
| Quantum communications | 9 | 8 | |
| Quantum sensors and metrology | 3–9 | 1–5 | |
| Virtual and augmented reality technologies | VR/AR content development tools and developer side user experience (UX) enhancement technologies | 9 | 8 |
| Platform solutions for users: editors of content creation and distribution | 7 | 6 | |
| Motion capture technologies in VR/AR and photogrammetry | 9 | 7 | |
| Feedback interfaces and sensors for VR/AR | 7 | 6 | |
| Graphical output technologies | 9 | 7 | |
| Data optimization technologies for VR/AR | 9 | 5 |
Appendix B. Components of Electricity Costs
References
- Federal State Statistics Service. Reporting Status of SDG Indicators. 2022. Available online: https://eng.rosstat.gov.ru/sdg/reporting-status (accessed on 20 April 2022).
- The Russian Government. Government Decisions. 2022. Available online: http://government.ru/docs/25221/ (accessed on 20 April 2022).
- Strategy-2050. The Russian Government. Government Decisions. 2022. Available online: http://static.government.ru/media/files/ADKkCzp3fWO32e2yA0BhtIpyzWfHaiUa.pdf (accessed on 20 April 2022).
- Roadmap “Neurotechnologies and Artificial Intelligence”. The Ministry of Digital Development, Communications and Mass Media of the Russian Federation. Roadmap for the Development of “End-to-End” Digital Technology “Neurotechnologies and Artificial Intelligence”. 2022. Available online: https://digital.gov.ru/ru/documents/6658/ (accessed on 15 March 2022).
- Roadmap “Components of Robotics And Sensors”. The Ministry of Digital Development, Communications and Mass Media of the Russian Federation. Roadmap for the Development of “End-to-End” Digital Technology “Components of Robotics and sensors”. 2022. Available online: https://digital.gov.ru/ru/documents/6666/ (accessed on 15 March 2022).
- Roadmap “New Production Technologies”. The Ministry of Digital Development, Communications and Mass Media of the Russian Federation. Roadmap for the Development of “End-to-End” Digital Technology “New Production Technologies”. 2022. Available online: https://digital.gov.ru/ru/documents/6662/ (accessed on 15 March 2022).
- Roadmap “Wireless Communication Technologies”. The Ministry of Digital Development, Communications and Mass Media of the Russian Federation. Roadmap for the Development of “End-to-End” Digital Technology “Wireless Communication Technologies”. 2022. Available online: https://digital.gov.ru/ru/documents/6674/ (accessed on 15 March 2022).
- Roadmap “Quantum Technologies”. The Ministry of Digital Development, Communications and Mass Media of the Russian Federation. Roadmap for the Development of “End-to-End” Digital Technology “Quantum Technologies”. 2022. Available online: https://digital.gov.ru/ru/documents/6650/ (accessed on 15 March 2022).
- Roadmap “Technologies of Virtual and Augmented Reality”. The Ministry of Digital Development, Communications and Mass Media of the Russian Federation. Roadmap for the development of “End-to-End” digital technology “Technologies of virtual and augmented reality”. 2022. Available online: https://digital.gov.ru/ru/documents/6654/ (accessed on 15 March 2022).
- Roadmap “Distributed Registry Systems “. The Ministry of Digital Development, Communications and Mass Media of the Russian Federation. Roadmap for the Development of “End-to-End” Digital Technology “Distributed Registry Systems”. 2022. Available online: https://digital.gov.ru/ru/documents/6670/ (accessed on 15 March 2022).
- Bakarov, A.A.; Devyatkin, D.A.; Ershova, T.V.; Tikhomirov, I.A.; Hohlov, Y.E. Russia’s scientific background in the area of cross-cutting technologies of digital economy. Inf. Soc. 2018, 4–5, 54–64. Available online: https://www.elibrary.ru/item.asp?id=37099835 (accessed on 20 May 2022).
- WNA; World Nuclear Association. Nuclear Energy and Climate Change. 2022. Available online: https://world-nuclear.org/ (accessed on 30 April 2022).
- Küfeoglu, S.; Liu, G.; Amaya, K.; Pollitt, M. Digitalisation and New Business Models in Energy Sector. No EPRG1920, Working Papers. Energy Policy Research Group, Cambridge Judge Business School, University of Cambridge, 2019. Available online: https://EconPapers.repec.org/RePEc:enp:wpaper:eprg1920 (accessed on 12 May 2022).
- Vlasov, A.I.; Shakhnov, V.A.; Filin, S.S.; Krivoshein, A.I. Sustainable energy systems in the digital economy: Concept of smart machines. Entrep. Sustain. Issues 2019, 6, 1975–1986. [Google Scholar] [CrossRef]
- Di Silvestre, M.L.; Gallo, P.; Guerrero, J.M.; Musca, R.; Sanseverino, E.R.; Sciumè, G.; Vasquez, J.C.; Zizzo, G. Blockchain for power systems: Current trends and future applications. Renew. Sustain. Energy Rev. 2020, 119, 109585. [Google Scholar] [CrossRef]
- Andoni, M.; Robu, V.; Flynn, D.; Abram, S.; Geach, D.; Jenkins, D.; McCallum, P.; Peacock, A. Blockchain technology in the energy sector: A systematic review of challenges and opportunities. Renew. Sustain. Energy Rev. 2019, 100, 143–174. [Google Scholar] [CrossRef]
- Ahl, A.; Yarime, M.; Goto, M.; Chopra, S.S.; Kumar, N.M.; Tanaka, K.; Sagawa, D. Exploring blockchain for the energy transition: Opportunities and challenges based on a case study in Japan. Renew. Sustain. Energy Rev. 2020, 117, 109488. [Google Scholar] [CrossRef]
- Motlagh, N.H.; Mohammadrezaei, M.; Hunt, J.; Zakeri, B. Internet of Things (IoT) and the Energy Sector. Energies 2020, 13, 494. [Google Scholar] [CrossRef]
- Weigel, P.; Fischedick, M. Review and Categorization of Digital Applications in the Energy Sector. Appl. Sci. 2019, 9, 5350. [Google Scholar] [CrossRef]
- Alekseev, A.N.; Lobova, S.V.; Bogoviz, A.V.; Ragulina, Y.V. Digitalization of the Russian Energy Sector: State-of-the-art and Potential for Future Research. Int. J. Energy Econ. Policy 2019, 9, 274–280. Available online: https://www.econjournals.com/index.php/ijeep/article/view/7673 (accessed on 12 May 2022). [CrossRef]
- Lund, H.; Andersen, A.N.; Østergaard, P.A.; Mathiesen, B.V.; Connolly, D. From electricity smart grids to smart energy systems—A market operation based approach and understanding. Energy 2012, 42, 96–102. [Google Scholar] [CrossRef]
- Irfan, M.; Iqbal, J.; Iqbal, A.; Iqbal, Z.; Riaz, R.A.; Mehmood, A. Opportunities and challenges in control of smart grids—Pakistani perspective. Renew. Sustain. Energy Rev. 2017, 71, 652–674. [Google Scholar] [CrossRef]
- Freier, A. Blockchain in the Energy Sector. An Analysis of the Brooklyn Case. 2022. Available online: https://ssrn.com/abstract=3998651 (accessed on 12 May 2022). [CrossRef]
- Livingston, D.; Varun Sivaram, F.; Madison, F.; Maximilian, F. Applying Blockchain Technology to Electric Power Systems; Council on Foreign Relations: New York, NY, USA, 2018; Available online: http://www.jstor.org/stable/resrep21340 (accessed on 25 May 2022).
- Markovic, D.S.; Zivkovic, D.; Branovic, I.; Popovic, R.; Cvetkovic, D. Smart power grid and cloud computing. Renew. Sustain. Energy Rev. 2013, 24, 566–577. [Google Scholar] [CrossRef]
- Sestino, A.; Prete, M.I.; Piper, L.; Guido, G. Internet of Things and Big Data as enablers for business digitalization strategies. Technovation 2020, 98, 102173. [Google Scholar] [CrossRef]
- Baidya, S.; Potdar, V.; Ray, P.P.; Nandi, C. Reviewing the opportunities, challenges, and future directions for the digitalization of energy. Energy Res. Soc. Sci. 2021, 81, 102243. [Google Scholar] [CrossRef]
- Lyu, W.; Liu, J. Artificial Intelligence and emerging digital technologies in the energy sector. Appl. Energy 2021, 303, 117615. [Google Scholar] [CrossRef]
- Goldbach, K.; Rotaru, A.M.; Reichert, S.; Stiff, G.; Gölz, S. Which digital energy services improve energy efficiency? A multi-criteria investigation with European experts. Energy Policy 2018, 115, 239–248. [Google Scholar] [CrossRef]
- Rosatom Annual Reports. State Atomic Energy Corporation Rosatom, 2020. Available online: https://www.report.rosatom.ru/655 (accessed on 15 March 2022).
- Allenykh Marina, A.; Osetskaya Mariya, M. Industry 4.0 in nuclear power: Economic efficiency of digitalization of the industry. Druk. Vestn. 2020, 6, 29–49. [Google Scholar] [CrossRef]
- Osetskaya, M.M.; Galkovskaya, V.Y. Production planning at TPPs, HPPs, NPPs of Russia. J. Econ. Entrep. 2017, 8, 1085–1090. Available online: https://www.elibrary.ru/item.asp?id=29912874 (accessed on 15 March 2022).
- Kodzokov, I.A.; Kodzokova, K.A. Social purpose and social value of the state and their relationship with the essence of the state. Eurasian Leg. J. 2021, 8, 98–99. Available online: https://www.elibrary.ru/item.asp?id=46697737 (accessed on 15 March 2022).
- Ministry of Science and Higher Education of the Russian Federation. Federal Target Program “Research and Development in Priority Areas of Development of the Scientific and Technological Complex of Russia for 2014–2021”. 2022. Available online: https://fcpir.ru/upload/medialibrary/955/gt_57_14vn_metodika-ugt-_002_.pdf (accessed on 15 March 2022).
- IAEA. Power Reactor Information System (PRIS). International Atomic Energy Agency, Vienna, 2022. Available online: https://pris.iaea.org/PRIS/CountryStatistics/ReactorDetails.aspx?current=898 (accessed on 20 May 2022).
- Yanchenko, Y.A.; Gurinovich, V.D. The Nuclear Power Plants’ Maintenance and Repair: The Life Cycle Management; First Model Printing House: Moscow, Russia, 2021. [Google Scholar]
- Rosenergoatom Annual Reports. Rosatom Power Engineering Division, 2020. Available online: https://www.report.rosatom.ru/rea (accessed on 15 March 2022).
- Osetskaya, M.; Allenykh, M. Development of the technique for fuel component of electricity cost produced by nuclear power plants. Vestnik IGEU 2017, 6, 67–76. [Google Scholar] [CrossRef]
- Galkovskaya, V. Evaluation of the effect of recycle numbers on the fuel component of the cost of different reactor types. Vestnik IGEU 2018, 2, 67–75. [Google Scholar] [CrossRef]
- Rogalev, N.D.; Zubkova, A.G.; Masterova, I.V.; Kuryukova, G.N.; Bologova, V.V.; Ponomareva, J.Y. Energy Economics; MPEI: Moscow, Russia, 2005. [Google Scholar]
- Volos, M. Improving the accuracy of analyzing nuclear power plants operation based on calculation technique of maintenance and repair cost. Vestnik IGEU 2021, 4, 25–37. [Google Scholar] [CrossRef]


| Notation. | Definition |
|---|---|
| and , [rub] | Energy production costs before and after implementation of digital technology |
| и , | Costs of energy sold before and after implementation of digital technology (The Russian electricity market can be conventionally divided into regulated (95%) and open (5%). The electricity price in the regulated market is set by the state (in 95% of cases, = ). Thus, economic efficiency of the implementation of digitals tool due to the increase in energy sales revenue is created by the volume of energy produced and then sold.) |
| ] | Energy production before and after implementation of digital technology |
| , [rub] , [rub] | Energy sales revenue before and after implementation of digital technology |
| [rub] , [rub] | Energy sales profit before and after implementation of digital technology |
| R&D | Intangible Assets | Tangible Assets | |
|---|---|---|---|
| In-house | |||
| External |
| Cost Attribution | R&D | Intangible Assets | Tangible Assets |
|---|---|---|---|
| In-house development | The costs are covered from R&D funds (% from revenue) and included in miscellaneous costs | The costs are attributed and recognized in the relevant costs | The costs are attributed and recognized in the relevant costs |
| Purchase | The costs are attributed and recognized in miscellaneous costs as service of third party | The costs are attributed and recognized in miscellaneous costs as service of third party and other costs as miscellaneous costs | The costs are attributed and recognized in miscellaneous costs as service of third party and other costs as miscellaneous costs |
| Directions | Phase/Level | Share of Government Funds |
|---|---|---|
| Fundamental research | 0 | 100% |
| 1 | 90–100% | |
| Applied research | 2 | 80–90% |
| 3 | 70–80% | |
| Experimental development | 4 | 60–70% |
| 5 | 40–60% | |
| 6 | 40–60% | |
| 7 | 30–40% | |
| Pilot production | 8 | 10–30% |
| Industrial production | 9 | 0–10% |
| Type of Outage | Major | Medium |
|---|---|---|
| Frequency, month number | 6, 42, 78, 114 | 24, 60, 96, 132 |
| Actual duration, days | 45 | 32 |
| Prospective duration, days | 40 | 30 |
| Period | Amount of Power Units and Turbine Generators Shutdowns, Units | Duration of Power Units and Turbine Generators Shutdowns, Days | ||
|---|---|---|---|---|
| Power Units | Turbine Generators | Power Units | Turbine Generators | |
| 2015 | 34 | 20 | 105.1 | 84.4 |
| 2016 | 29 | 21 | 189 | 63.2 |
| 2017 | 28 | 28 | 149.6 | 129.9 |
| 2018 | 27 | 19 | 186 | 101.8 |
| 2019 | 28 | 27 | 126.9 | 55.9 |
| 2020 | 19 | 17 | 52.9 | 32.4 |
| 2021 | 27 | 21 | 183.6 | 59 |
| Total | 192 | 153 | 993.1 | 526.6 |
| Medium | 27 | 22 | 141.9 | 75.2 |
| Period | Power Units, N | Type of Repair | Exposure Doses, mSv | Duration of Repair, Days |
|---|---|---|---|---|
| 2015 | 3/4/5 | MiR/MaR, M/MaR | 3.64 | 166.5 |
| 2016 | 3/4/5 | MiR/MiR/MiR | 1.86 | 98.5 |
| 2017 | 4/5/6/6 | MaR, SLE/MiR/RM/MiR, M | 0.34 | 129 |
| 2018 | 4/5/6 | MaR, SLE/MiR/MiR, M | 3.94 | 450.5 |
| 2019 | 4/5/6 | MiR/MaR/MaR | 0.6 | 179 |
| 2020 | 4/5/6/7 | MiR/MiR/MiR/MiR | 1.84 | 185 |
| Period | Power Unit No.6 | Power Unit No.7 | ||
|---|---|---|---|---|
| Energy Availability Factor | Load Factor | Energy Availability Factor | Load Factor | |
| 2017 | 62.4 | 60.9 | - | - |
| 2018 | 81.3 | 79.4 | - | - |
| 2019 | 76.7 | 74.6 | 85.5 | 83.5 |
| 2020 | 80.3 | 78.7 | 82.1 | 78.6 |
| 2021 | 78.8 | 78.1 | 79.6 | 76.2 |
| Medium | 76.3 | 74.8 | 79.6 | 77.9 |
| MiR | MaR | |
|---|---|---|
| Labor intensity, man-hour | 5934 | 7998 |
| Labor cost, mln rub. | 4.2 | 5.7 |
| Material cost, mln rub. | 0.1 | 0.1 |
| Fitting cost, mln rub. | 0 (We assume that fittings are available at the NPP) | 0 |
| Duration, days | 26 | 35 |
Publisher’s Note: MDPI stays neutral with regard to jurisdictional claims in published maps and institutional affiliations. |
© 2022 by the authors. Licensee MDPI, Basel, Switzerland. This article is an open access article distributed under the terms and conditions of the Creative Commons Attribution (CC BY) license (https://creativecommons.org/licenses/by/4.0/).
Share and Cite
Galkovskaya, V.; Volos, M. Economic Efficiency of the Implementation of Digital Technologies in Energy Power. Sustainability 2022, 14, 15382. https://doi.org/10.3390/su142215382
Galkovskaya V, Volos M. Economic Efficiency of the Implementation of Digital Technologies in Energy Power. Sustainability. 2022; 14(22):15382. https://doi.org/10.3390/su142215382
Chicago/Turabian StyleGalkovskaya, Victoria, and Mariia Volos. 2022. "Economic Efficiency of the Implementation of Digital Technologies in Energy Power" Sustainability 14, no. 22: 15382. https://doi.org/10.3390/su142215382
APA StyleGalkovskaya, V., & Volos, M. (2022). Economic Efficiency of the Implementation of Digital Technologies in Energy Power. Sustainability, 14(22), 15382. https://doi.org/10.3390/su142215382