Article

Application of Machine Learning Algorithms for Sustainable Business Management Based on Macro-Economic Data: Supervised Learning Techniques Approach

by
Muhammad Anees Khan
1,*,
Kumail Abbas
2,
Mazliham Mohd Su’ud
3,
Anas A. Salameh
4,
Muhammad Mansoor Alam
5,6,
Nida Aman
2,
Mehreen Mehreen
7,
Amin Jan
8,*,
Nik Alif Amri Bin Nik Hashim
8 and
Roslizawati Che Aziz
8
1
Management Studies Department, Bahria Business School, Bahria University, Islamabad 04414, Pakistan
2
Bahria Business School, Bahria University, Islamabad 04414, Pakistan
3
Faculty of Computer and Information, Multimedia University, Cyberjaya 50088, Malaysia
4
Department of Management Information Systems, College of Business Administration, Prince Sattam Bin Abdul-Aziz University, Al-Kharj 11942, Saudi Arabia
5
Malaysian Institute of Information Technology, Universiti Kuala Lumpur, Kuala Lumpur 50088, Malaysia
6
Faculty of Computing, Riphah International University, Islamabad 04414, Pakistan
7
Department of Management and Humanities, Universiti Teknologi PETRONAS, Seri Iskandar 32610, Malaysia
8
Faculty of Hospitality, Tourism and Wellness, Universiti Malaysia Kelantan, City Campus, Kota Bharu 16100, Malaysia
*
Authors to whom correspondence should be addressed.
Sustainability 2022, 14(16), 9964; https://doi.org/10.3390/su14169964
Submission received: 14 June 2022 / Revised: 20 July 2022 / Accepted: 28 July 2022 / Published: 12 August 2022
(This article belongs to the Special Issue Circular Economy and Artificial Intelligence)

Abstract

:
Macroeconomic indicators are the key to success in the development of any country and are very much important for the overall economy of any country in the world. In the past, researchers used the traditional methods of regression for estimating macroeconomic variables. However, the advent of efficient machine learning (ML) methods has led to the improvement of intelligent mechanisms for solving time series forecasting problems of various economies around the globe. This study focuses on forecasting the data of the inflation rate and the exchange rate of Pakistan from January 1989 to December 2020. In this study, we used different ML algorithms like k-nearest neighbor (KNN), polynomial regression, artificial neural networks (ANNs), and support vector machine (SVM). The data set was split into two sets: the training set consisted of data from January 1989 to December 2018 for the training of machine algorithms, and the remaining data from January 2019 to December 2020 were used as a test set for ML testing. To find the accuracy of the algorithms used in the study, we used root mean square error (RMSE) and mean absolute error (MAE). The experimental results showed that ANNs archives the least RMSE and MAE compared to all the other algorithms used in the study. While using the ML method for analyzing and forecasting inflation rates based on error prediction, the test set showed that the polynomial regression (degree 1) and ANN methods outperformed SVM and KNN. However, on the other hand, forecasting the exchange rate, SVM RBF outperformed KNN, polynomial regression, and ANNs.

1. Introduction

Forecasting plays a vital role in macroeconomic planning. It is a critical analysis tool for countries’ financial and monetary strategies. Predicting key variables such as gross domestic product (GDP), inflation, interest rates, exchange rates, and taxes are essential for making economic decisions for fiscal authorities and state banks. Policymakers usually make decisions in real time based on incomplete knowledge about the current situation of an economy [1]. The ability to predict macroeconomic factors is essential for designing and implementing timely policy responses. Exchange rate forecasting is important for financial institutions and companies with foreign currency exposure. Companies with such risk must hedge their foreign currency cash flows to predict their benefits from changes in exchange rates. Financial forecasting, especially exchange rate forecasting, is becoming a crucial topic in the field of economics. The literature shows that the macroeconomic model is one of the earliest forecasting models used to predict exchange rates. However, the low performance of traditional econometric models is forcing the research community to investigate efficient methods to identify exchange rate fluctuations. Although artificial intelligence has been a subject for decades, it is now finally beginning to have an impact on business operations as well as the daily lives of individuals and different studies have been conducted on the application of artificial intelligence in the financial sector [2]. In the past few years, ML techniques have attracted increasing interest in forecasting different variables. Many traditional methods were proposed for predicting macroeconomic variables, but there are still some challenges. Machine learning methods have received extensive attention from the research community due to their high predictive accuracy. These methods include many powerful models that have made significant achievements in finance and other fields. These soft computing machine learning models often prove very successful in financial and monetary forecasts, which involve forecasting GDP, interest rate inflation, unemployment rate stock indices, currencies, creditworthiness, or bankruptcy prediction. They are not only restricted to financial and money forecasting. However, these methods of ML are applied by a research institute to resolve different kinds of real-world problems such as pattern classification, statistic forecasting, optimizations, use in medical treatment, and signal processing.
Nevertheless, the concept of artificial intelligence is not fully applicable in under-developed countries, especially in Pakistan where the progression of AI not only has been slow but is applied in just a few sectors [3]. Over the last few decades, the technology’s capacity to crunch data and then derive useful knowledge from billions of inputs in milliseconds has improved exponentially, but this is not adopted in non-financial sectors of Pakistan. Likewise, in Pakistan, the risk was predicted by the researcher with the use of traditional techniques such as VaR, CVaR, standard deviation, and beta, but no work has been conducted on the financial and non-financial sectors using artificial intelligence techniques. This study analyzed the influence of various AI techniques based on ML algorithms and their impact on the automation of risk. Moreover, it determined accurate risk prediction by using supervised artificial intelligence techniques and presented the best-fit AI technique with the highest accuracy offering the lowest error values for non-financial firms in Pakistan. Within the economic community, the interest in the forecast of exchange rates is based on predicting future trends and better achieving financial advantages or certain hedge risks [4]. For instance, large multinational companies that view the foreign exchange rate as an essential aspect of their business can benefit significantly from accurate forecasts [5]. However, this interest in the foreign exchange market is not limited to large multinational companies. Exchange rate forecasting is now important for all types of companies, regardless of their size, geographic distribution, or business. This is because, regardless of whether or not a company is concerned with international business through export, imports, and FDI, it can require foreign currency to pay for imported goods or services. As a result, the costs of imported or exported products and services may vary with the exchange rate, which creates a particular exchange rate risk.
The economy of Pakistan is mainly based on the import of commodities. Exchange rate fluctuations are affected by the dynamics of commodity prices, and the randomness in the exchange rates makes it difficult to predict. Therefore, nonlinear parametric and non-parametric models perform poorly on exchange rate forecasting. The second complication associated with the forecasting of exchange rates is the noise and the chaotic and unsteady nature of the data [6]. Statistical methods assume that the data are linear and correlated, but in practice, the time-series data, mainly the exchange rates, do not conform to this type of assumption; therefore, the forecast of the exchange rate by the various statistical methods is not satisfactory [7]. This paper aims to propose a forecasting model that is ready to forecast inflation rate and exchange rate movements accurately, especially in the context of Pakistan. Special focus is on the machine learning forecasting techniques such as k-nearest neighbor (KNN), polynomial regression (PR), artificial neural networks (ANNs), and support vector machine (SVM). This paper focuses on the answering following questions:
  • How to determine the best ML technique (KNN, PR, ANN, and SVM) to forecast the macroeconomic indicators (exchange rate and inflation rate)?
  • What is the best ML technique (KNN, PR, ANN, and SVM) with the minimum error for predicting the macroeconomic indicators (exchange rate and inflation rate)?
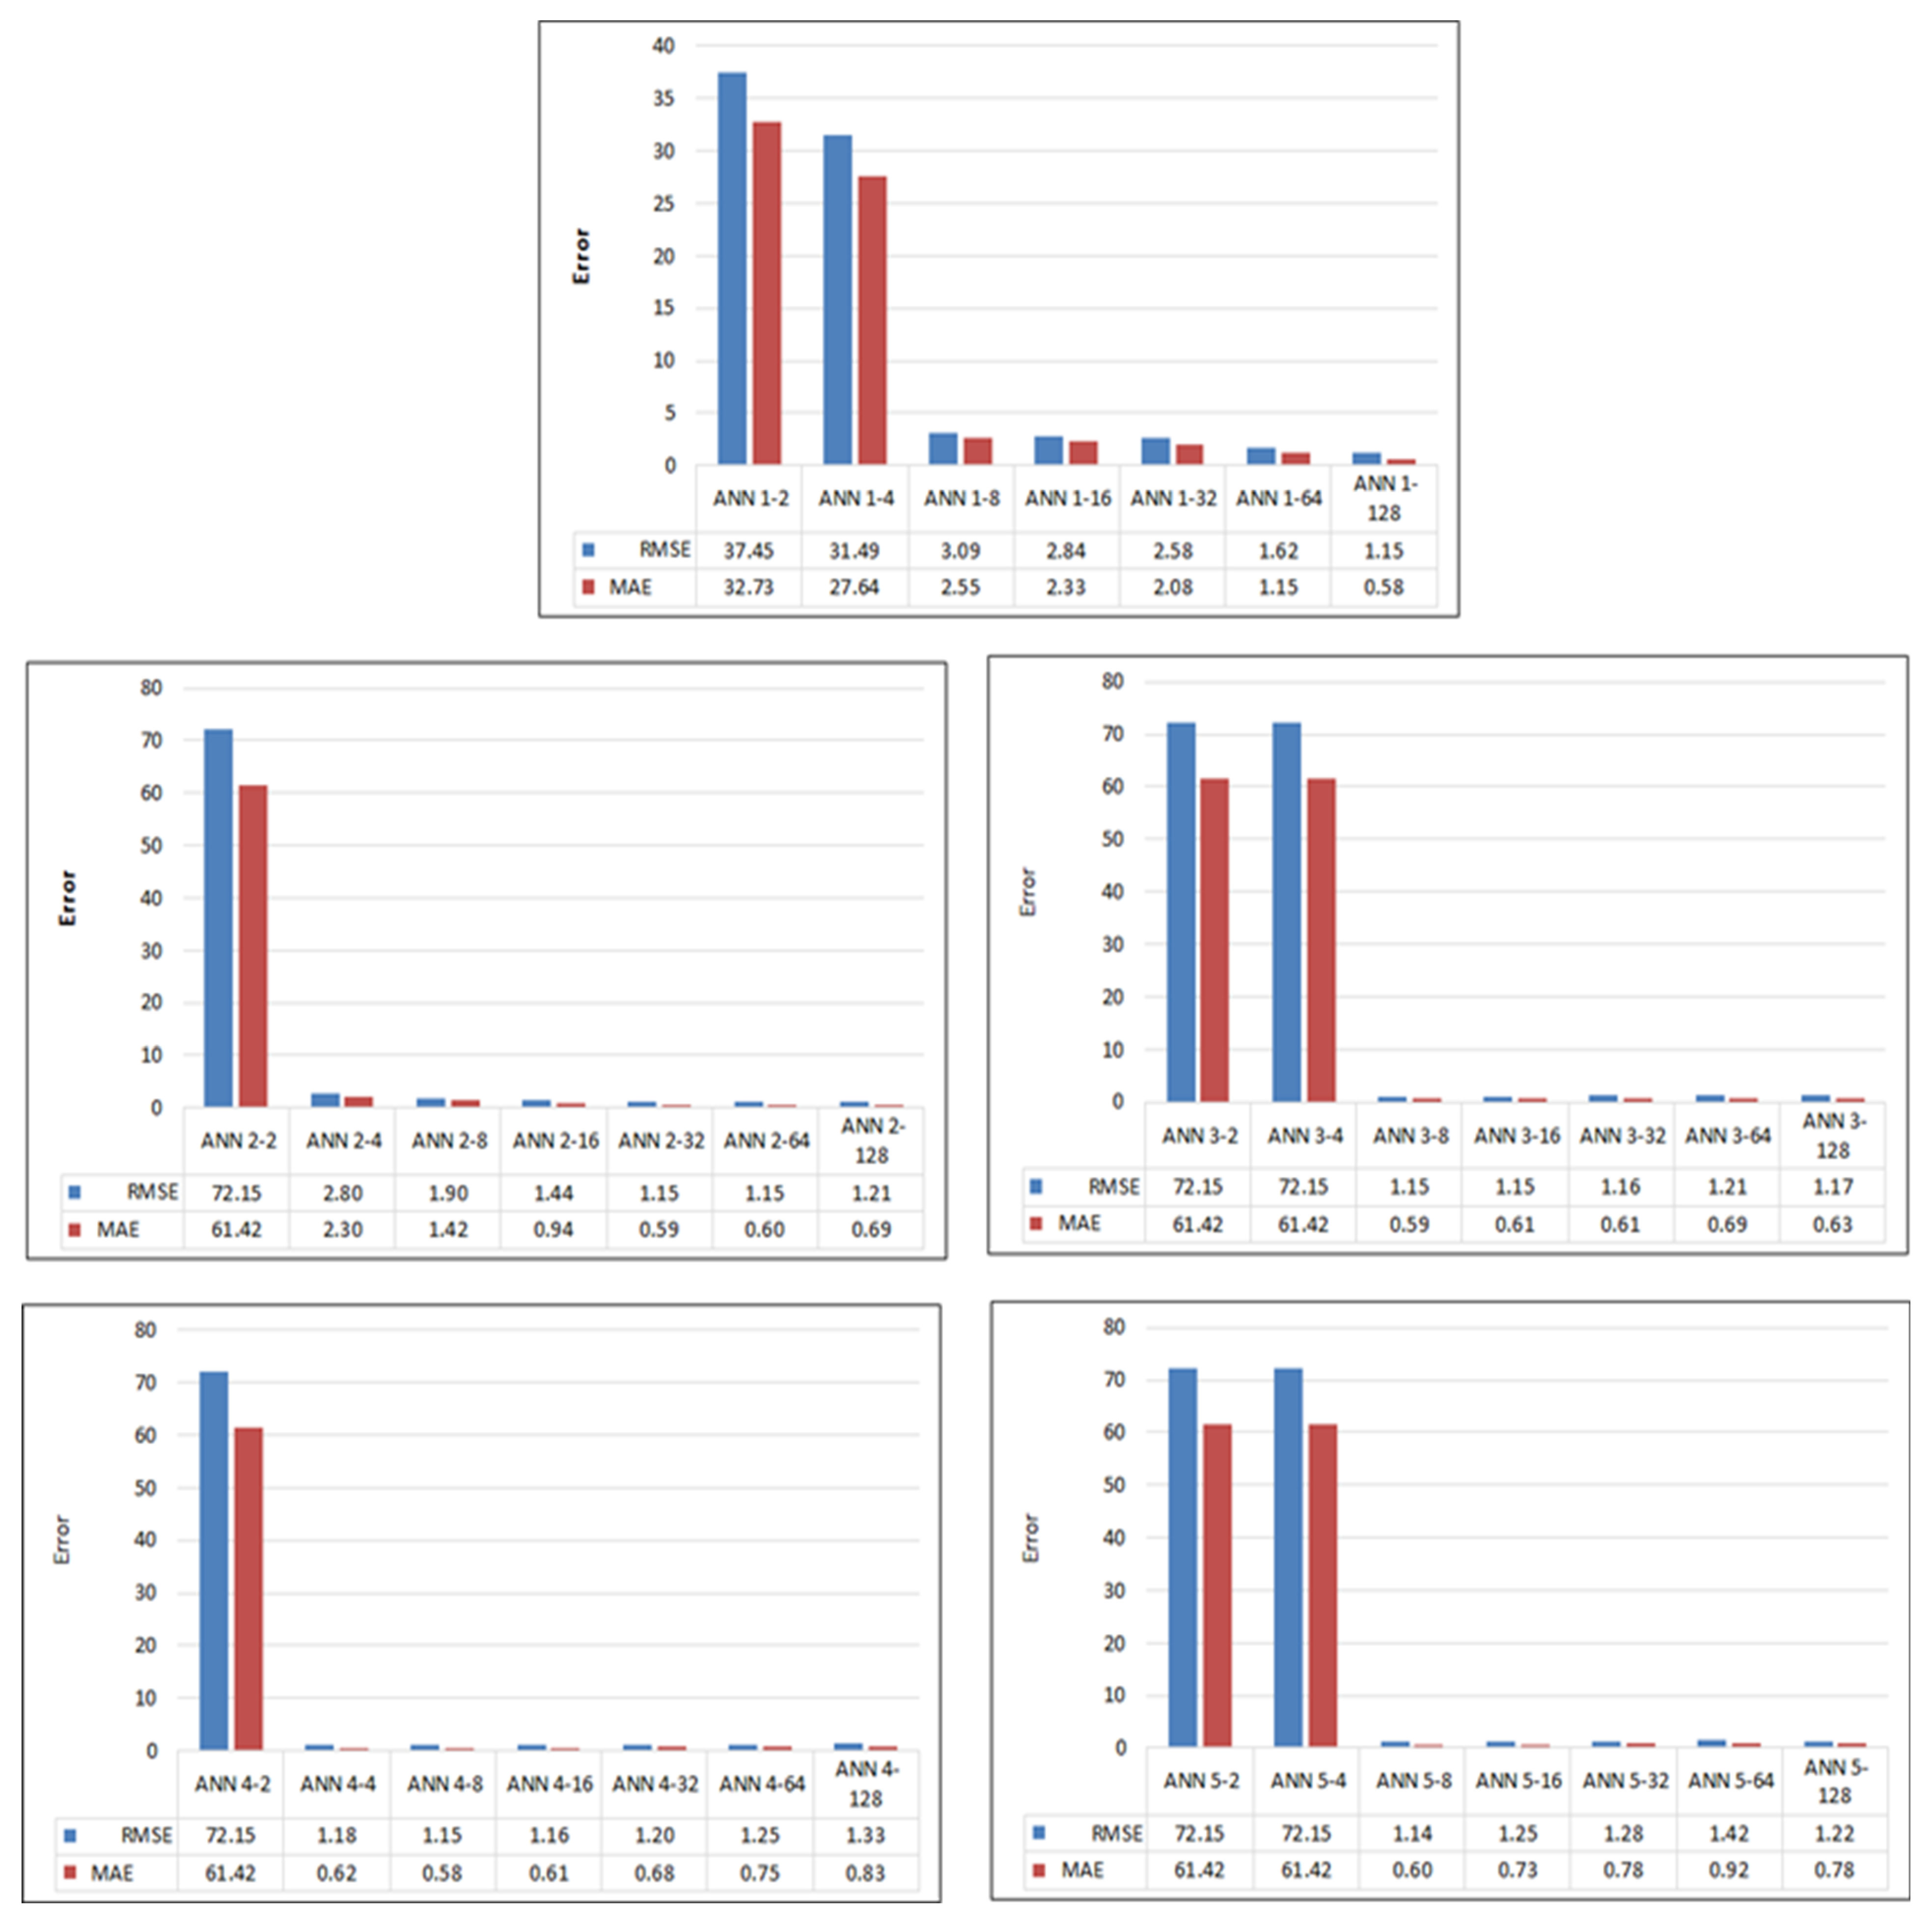
  • What are the impacts of the hidden layers and the number of neurons per layer of the ANN technique on the errorless prediction of exchange rates?
  • Do the hidden layers and the number of neurons per layer of the ANN technique have any impact on the error-less prediction of inflation rates?
Keeping the above questions in mind, the study was conducted based on the following objectives that provided the ultimate solution to the question raised, and thus, problems were solved. The research question is based on the following objective:
  • To examine the best ML technique (KNN, PR, ANN, and SVM) to forecast the macroeconomic indicators (exchange rate and inflation rate);
  • To determine the best ML technique (KNN, PR, ANN, and SVM) with the minimum error for predicting the macroeconomic indicators (exchange rate and inflation rate);
  • To find out the impacts of the hidden layers and the number of neurons per layer of the ANN technique on errorless prediction of exchange rates;
  • Observing the hidden layers and the number of neurons per layer of the ANN technique have any impact on error-less prediction of inflation rates.
The remainder of the paper is organized as follows: Section 2 presents an overview of the literature. Section 3 presents the material and methods. Section 4 presents experimental results. Finally, the conclusion is presented in Section 5.

2. Literature Review

Predicting macroeconomic data such as GDP, inflation, and unemployment exchange rate is a challenging task. In order to make predictions, considerable data are required, and the relationships between different independent variables and dependent variables need to be established. The traditional economic predicting models require suitable predefined predictor variables and are usually based on theory-driven approaches, whereas ML algorithms aim to improve forecasting capabilities, especially when the actual model is unknown and complex and past experiences in the form of data are available.
In recent years, ML has achieved remarkable progress, especially in a recognition task, not only spinning from visualization to speech, but also in predicting problem and the ability to effectively process large amounts of data, as well as processing algorithms in a reasonable time frame, and the cost is relatively low [8]. Data management, workflow automation, predictive decision automation, and smart visualizations are only a few of AI building blocks that can be used to digitalize a company’s risk features. Commercial implementations of Al technologies are increasingly accessible on online platforms from accounting firms, management compliance and risk management consultants, governance and organization management consultants, and others, relying on process automation to assist risk management more appropriately as compared to risk governance. Advanced analytics allowed by AI explain the evolution of digitalized risk of technology into cognitive insight, allowing for appropriate and precise analytics than before. As a result, decisions are being automated, aided by smart visualizations and the application of augmented reality in the risk role of an organization, which are still emerging technologies [9]. ML algorithms are recently used to predict GDP from data [10], as ML algorithms are more flexible than traditional predicting models and can make predictions without assumptions or predefined judgments but based on previous experiences [11]. Forecasting inflation and exchange rates is significant for financial planning. Various studies used different forecasting techniques to examine inflation and exchange rate forecasting. A comparative analysis of ML algorithms and factor models to predict Japan’s macroeconomic time series has been presented [12]. Moreover, Ülke et al. [13] compared ML techniques for inflation forecasting in the USA from 1984 to 2014. Moreover, it is also reported [11] that the random forest model and gradient boosting model are more accurate than the autoregressive benchmark for macroeconomic forecasting. In a study reported [14], ML approaches are found better than dynamic factor models and autoregressive techniques for forecasting Pakistan’s GDP. It is shown that predicting gains through nonlinear methods is associated with high macroeconomic uncertainty, financial pressure, and housing bubble bursts [15]. According to Gogas et al. [16], the SVM method has been widely used to forecast the real GDP in different parts of the world for making quick decisions regarding the economy. The results of the study showed very accurate forecasting. AI is being used to constructively track and prevent misrepresentation, fraudulent tax evasion, incompetence, and the detection of potential risks. Companies, for example, use individual data and attitudes to identify patterns and detect suspicious transactions. Master cards have been working to integrate AI technology in the “identification” of individual frauds as part of their monetary service networks. Similar methods have been used to determine trade misconduct [2]. Therefore, AI techniques and machine learning algorithms that make up AI’s foundation are revolutionizing and will continue to revolutionize how we handle financial risk. The progress of artificial intelligence-based outcomes helps to detect the amount banks can lend to a customer and determines the ways that can provide alarming signs to the traders of the financial market regarding role danger, assists in detecting insider and customer fraud and provides means to improve enforcement and reduce the model risk [17].
According to Heaton et al. (2017), neural networks and deep learning algorithms are considered to be at the cutting edge of techniques of machine learning, and they are mostly classified and chosen separately from the other ML techniques. Deep learning, depending on the reason for which it is used, can be both supervised and unsupervised. Moreover, it is also reported by Medeiros et al. [18] whether we can use random forest and LASSO for forecasting. Moreover, the focus of this research is inflation and exchange rate prediction. The inflation rate plays an essential role in financial economics. Inflation is a global problem that has received much attention. The inflation rate not only is an economic variable, but is also related to people’s lives and social stability. Inflation rate prediction helps in policymaking. High inflation can cause an economic recession in a country. Hence, inflation needs to be controlled. One of the government’s measures to control inflation is to use the consumer price index (CPI) to calculate and forecast inflation every month. The CPI is one of the most usually used indicators to calculate the inflation rate. It affects the decisions of the government, families, policymakers, and investors. A high inflation rate will worsen an economy’s economic growth, reduce wages and increase the cost of production. Similarly, a low-inflation environment is seen as a negative economic indicator related to the decline in economic demand. Therefore, it is crucial to predict the inflation rate in different time frames.
In both business and science, big data has now become a hot subject. Technological innovation in finance has dramatically changed over the last 10 years, in a large part due to some big increase and progress arising from advances in information technology and financial practice, in the shape of big data, artificial intelligence (AI), machine learning, and blockchain technologies. In this regard, the rapid development of technologies such as big data, cloud computing, blockchain, and artificial intelligence and financial technology is now spreading worldwide. Likewise, in today’s world, artificial intelligence (AI) and big data (BD) have risen very rapidly, which is playing an important role in the latest era techniques of financial institutions. In addition, this new era of digital technologies brought the evolving concept of financial technology (FinTech). Simply Fintech can be defined as “a systematic technology that will enable financial innovation for bringing the latest business models, the application of these models with a built-in sense of the process that will affect that performance of the financial institution. Thus, FinTech will provide a very helpful base to the prevailed situation in the financial markets for establishing a link between financial service and performance. FinTech innovations, which are emerging in many aspects of finance, such as retail finance, wholesale payments, investment management, insurance, credit provision, and equity capital raising, are not only competing with traditional financial services, but also promoting their innovations and transformation. Despite the emergence of financial innovations in the financial industry, the effects of FinTech on the financial system are less understood. The methods are used to mine the correlation of various variables among huge and massive data, such as interbank liquidity and global capital flow including the relation between financial markets and web contracts [19]. Big data analyses’ key goal is to combine disparate financial data and gain more insight to perceive and distinguish systemic risk [20]. As a result, big data analysis is similar to other application fields that include heterogeneous data knowledge fusion and traditional data mining algorithms such as classification methods [21].
Similarly, the researcher researched to study the impact of artificial intelligence in minimizing systematic risk [22]. According to this study, the use of AI engines in the financial sector will help risk managers in forecasting and minimizing risk by increasing efficiency and by cost-saving [23]. In the literature, it is also concluded that the use of AI and machine learning in financial and macroeconomic indicators will predict the minimization of risk [24]. In this study, they also discussed the challenges and future of AI in risk management. The availability of appropriate data is the most significant of these challenges. While Python and R machine learning packages can read data of all types from Excel to SQL, as well as performing natural language processing and image processing, the rate at which machine learning applications have been proposed has not kept up with companies’ ability to organize the internal data they have appropriate access to. Data are often held in various silos around departments, on different systems, and often with internal political constraints.
Considering the above literature, we conducted research in which we studied the role of artificial intelligence in the automation of financial, operational, strategic, and reputational risk. We also identified which technique of AI is the best fit for risk prediction by examining which offers the highest accuracy rate. The GDP growth, inflation, exchange rate, and interest rate are the most critical indicators of macroeconomic factors. However, predicting macroeconomic variables requires complicated calculations, and sometimes official data are frequently available after at least one quarter [11]. Because of this delay, sometimes policymakers apply policies without considering the actual conditions of an economy. Macroeconomic variables are difficult to predict, because many other variables may affect them. In the past, forecasting based on statistical modelling has been used. The most common statistical model used to predict time series is the autoregressive (AR) model, which assumes that future observations are mainly based on current observations (Hall 2018). However, AR models are regarded as a benchmark for predicting macroeconomic variables in many studies. Although different econometric methods are widely used, they have some obvious disadvantages. First, they assume serial correlation, and second, such techniques are not applicable when we have a large number of different kinds of data to be considered with an aim to generate forecasts in actual time. The ineffectiveness of traditional methods and the noisy and random nature of the data encourage researchers to use machine learning methods. With the advancement of computing power, the use of machine learning methods as an alternative to time series regression models are getting attention day by day. ML allows computer systems to mimic human intelligence. The development and deployment of ML in macroeconomic forecasting have increased dramatically. ML can manage complex economic systems efficiently with large amounts of data [25]. When it comes to macroeconomic forecasting, machine learning algorithms have recently received much attention in economic analysis. In line with the above, this paper contributes in two different ways. Firstly, it compares the performances of machine learning models for forecasting inflation which have not yet been thoroughly analyzed and covered before. This paper pays special attention to ANNs, KNN, polynomial regression, and SVM, because these models have received extensive attention in many prediction problems due to their excellent performance. Second, it introduces a machine learning-based approach to achieve more accurate forecasting of exchange rates and inflation in Pakistan than the forecasting made by different econometric methods. To the best of our knowledge, there have been no studies that compare these methods.

Theoretical Support of the Research
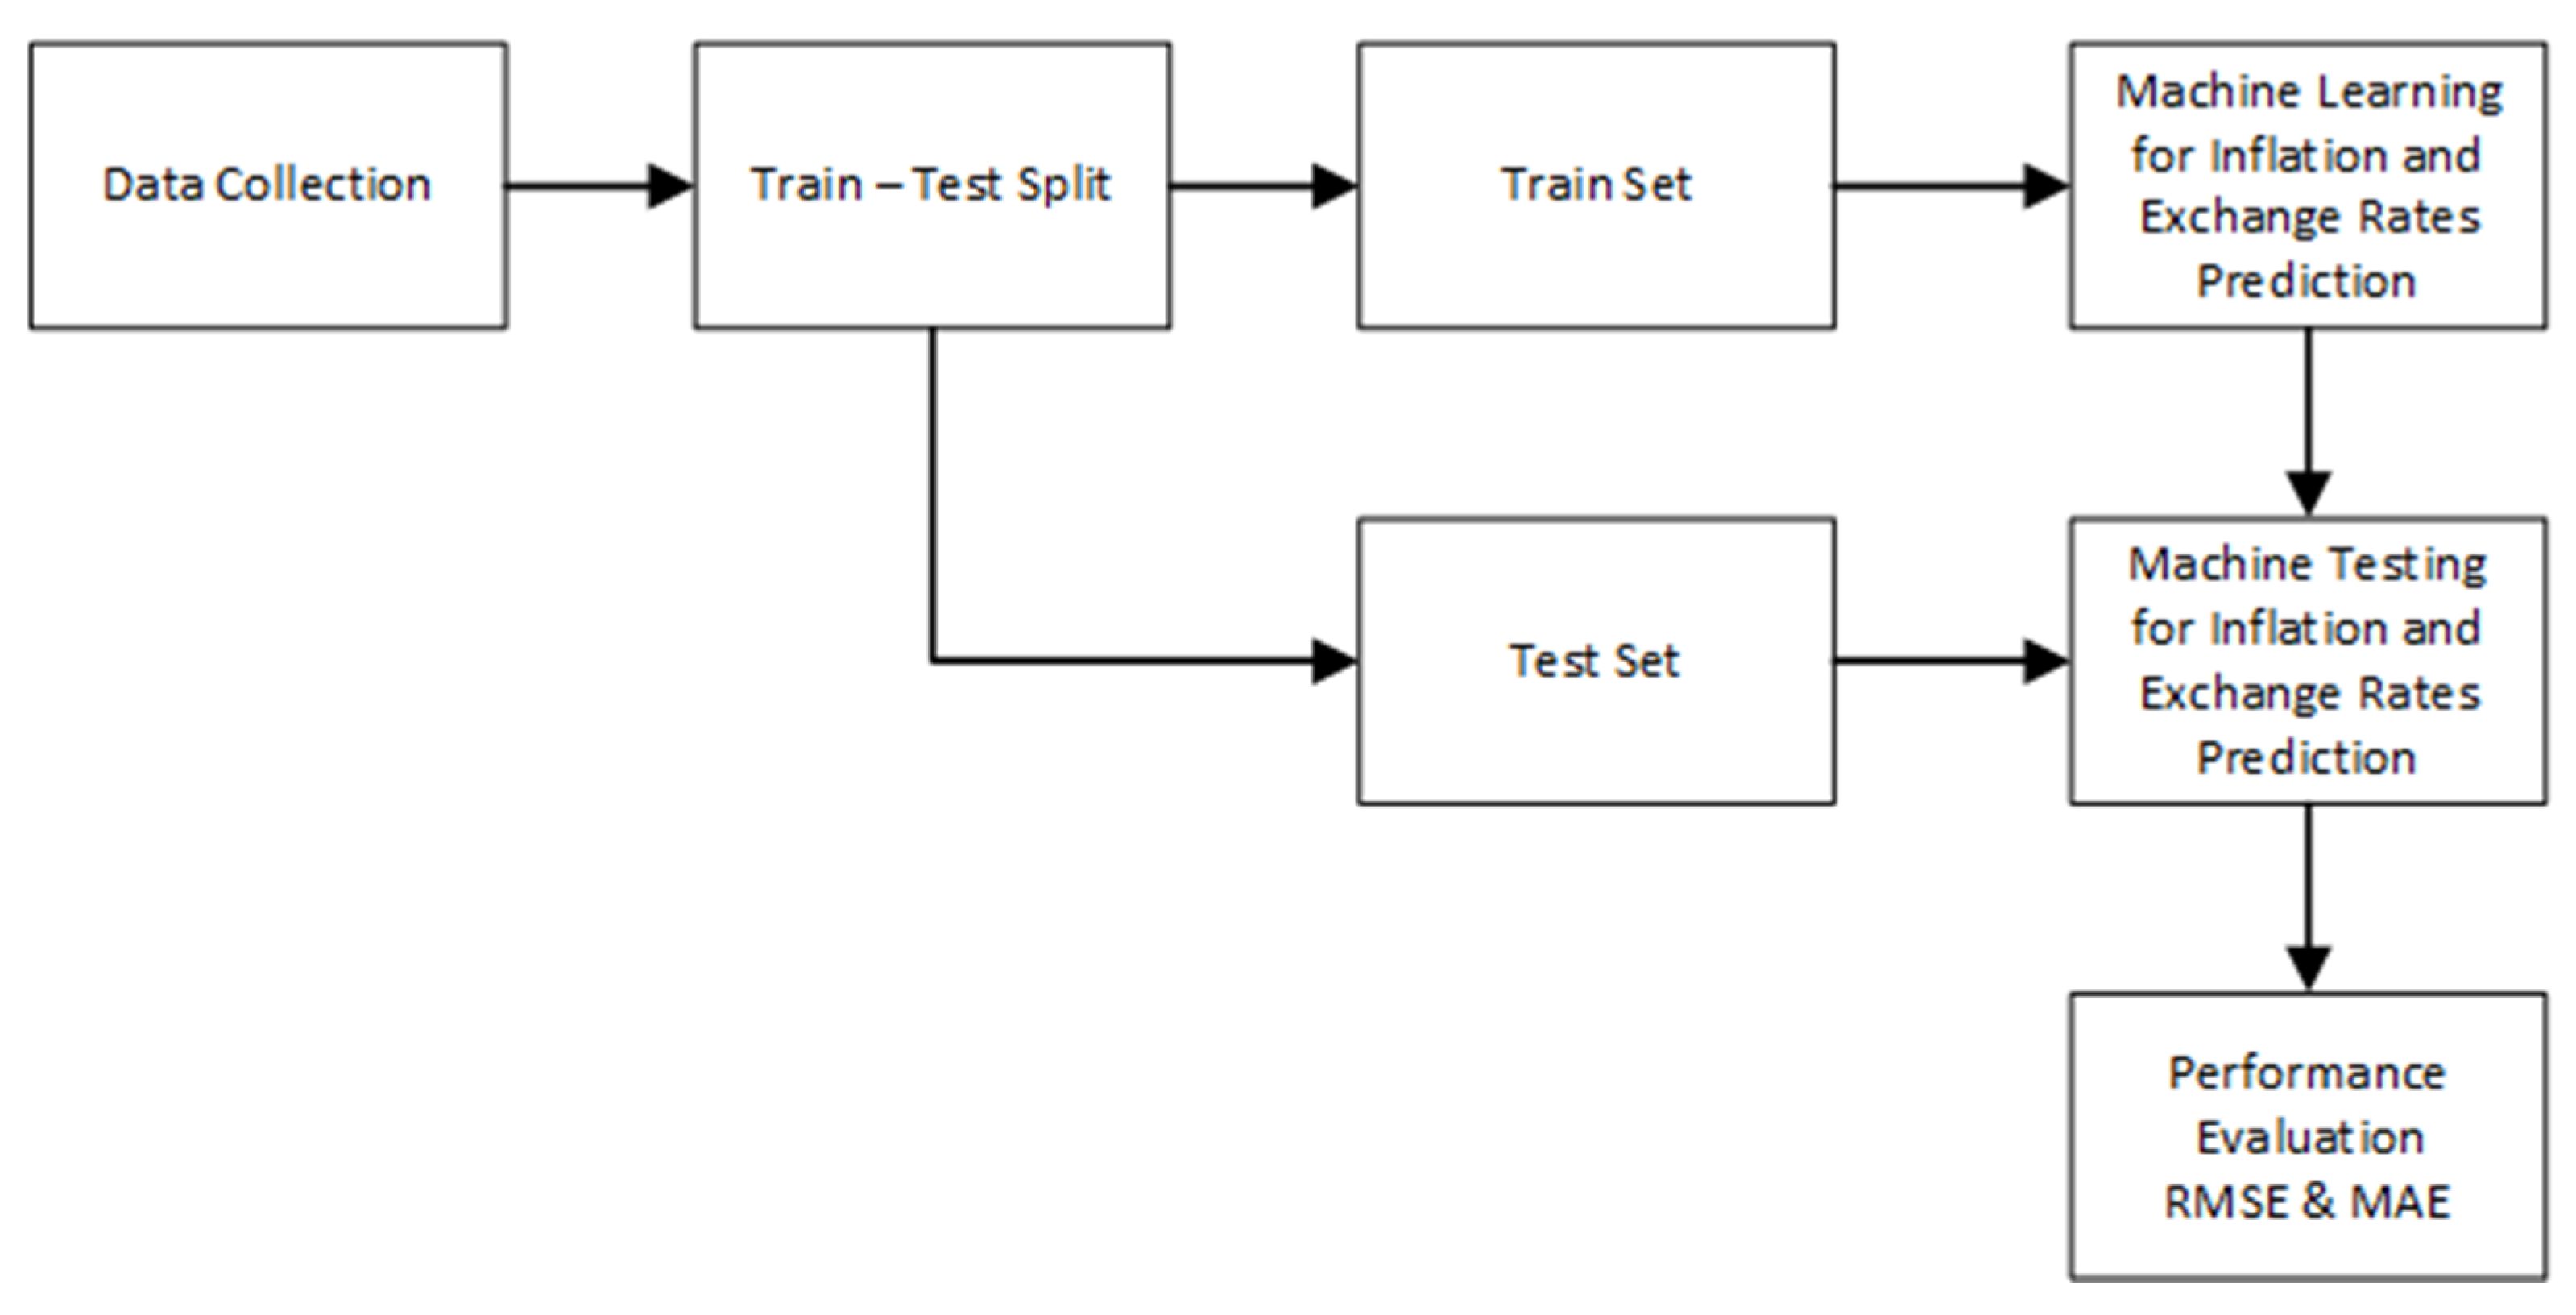
As theory is an integral part of the research, we used computational learning theory as an underpinning theory for this research. Computational learning theory refers to a formal mathematical framework that aims to quantify learning tasks and algorithms. It is also called “statistical learning theory”. The basic purpose of computational learning theory is to learn the machine learning algorithm and determine what is understandable. It will help us to know the required data sufficient for the training of a specific algorithm. This theory is related to the design and analysis of machine learning algorithms (association with computational learning). It is a branch of theoretical computing that discusses the main designs of a computer program and its ability to identify computing limitations. This theory helps to raise questions on the performance of learning algorithms. In particular, such algorithms aim to make accurate predictions or representations based on observations. The availability of a large amount of data has enhanced the role of this theory for the accurate prediction of the stock market.

3. Methodology

Figure 1 shows the block diagram to predict inflation and exchange rates using ML. Each block of the diagram is briefly described below.

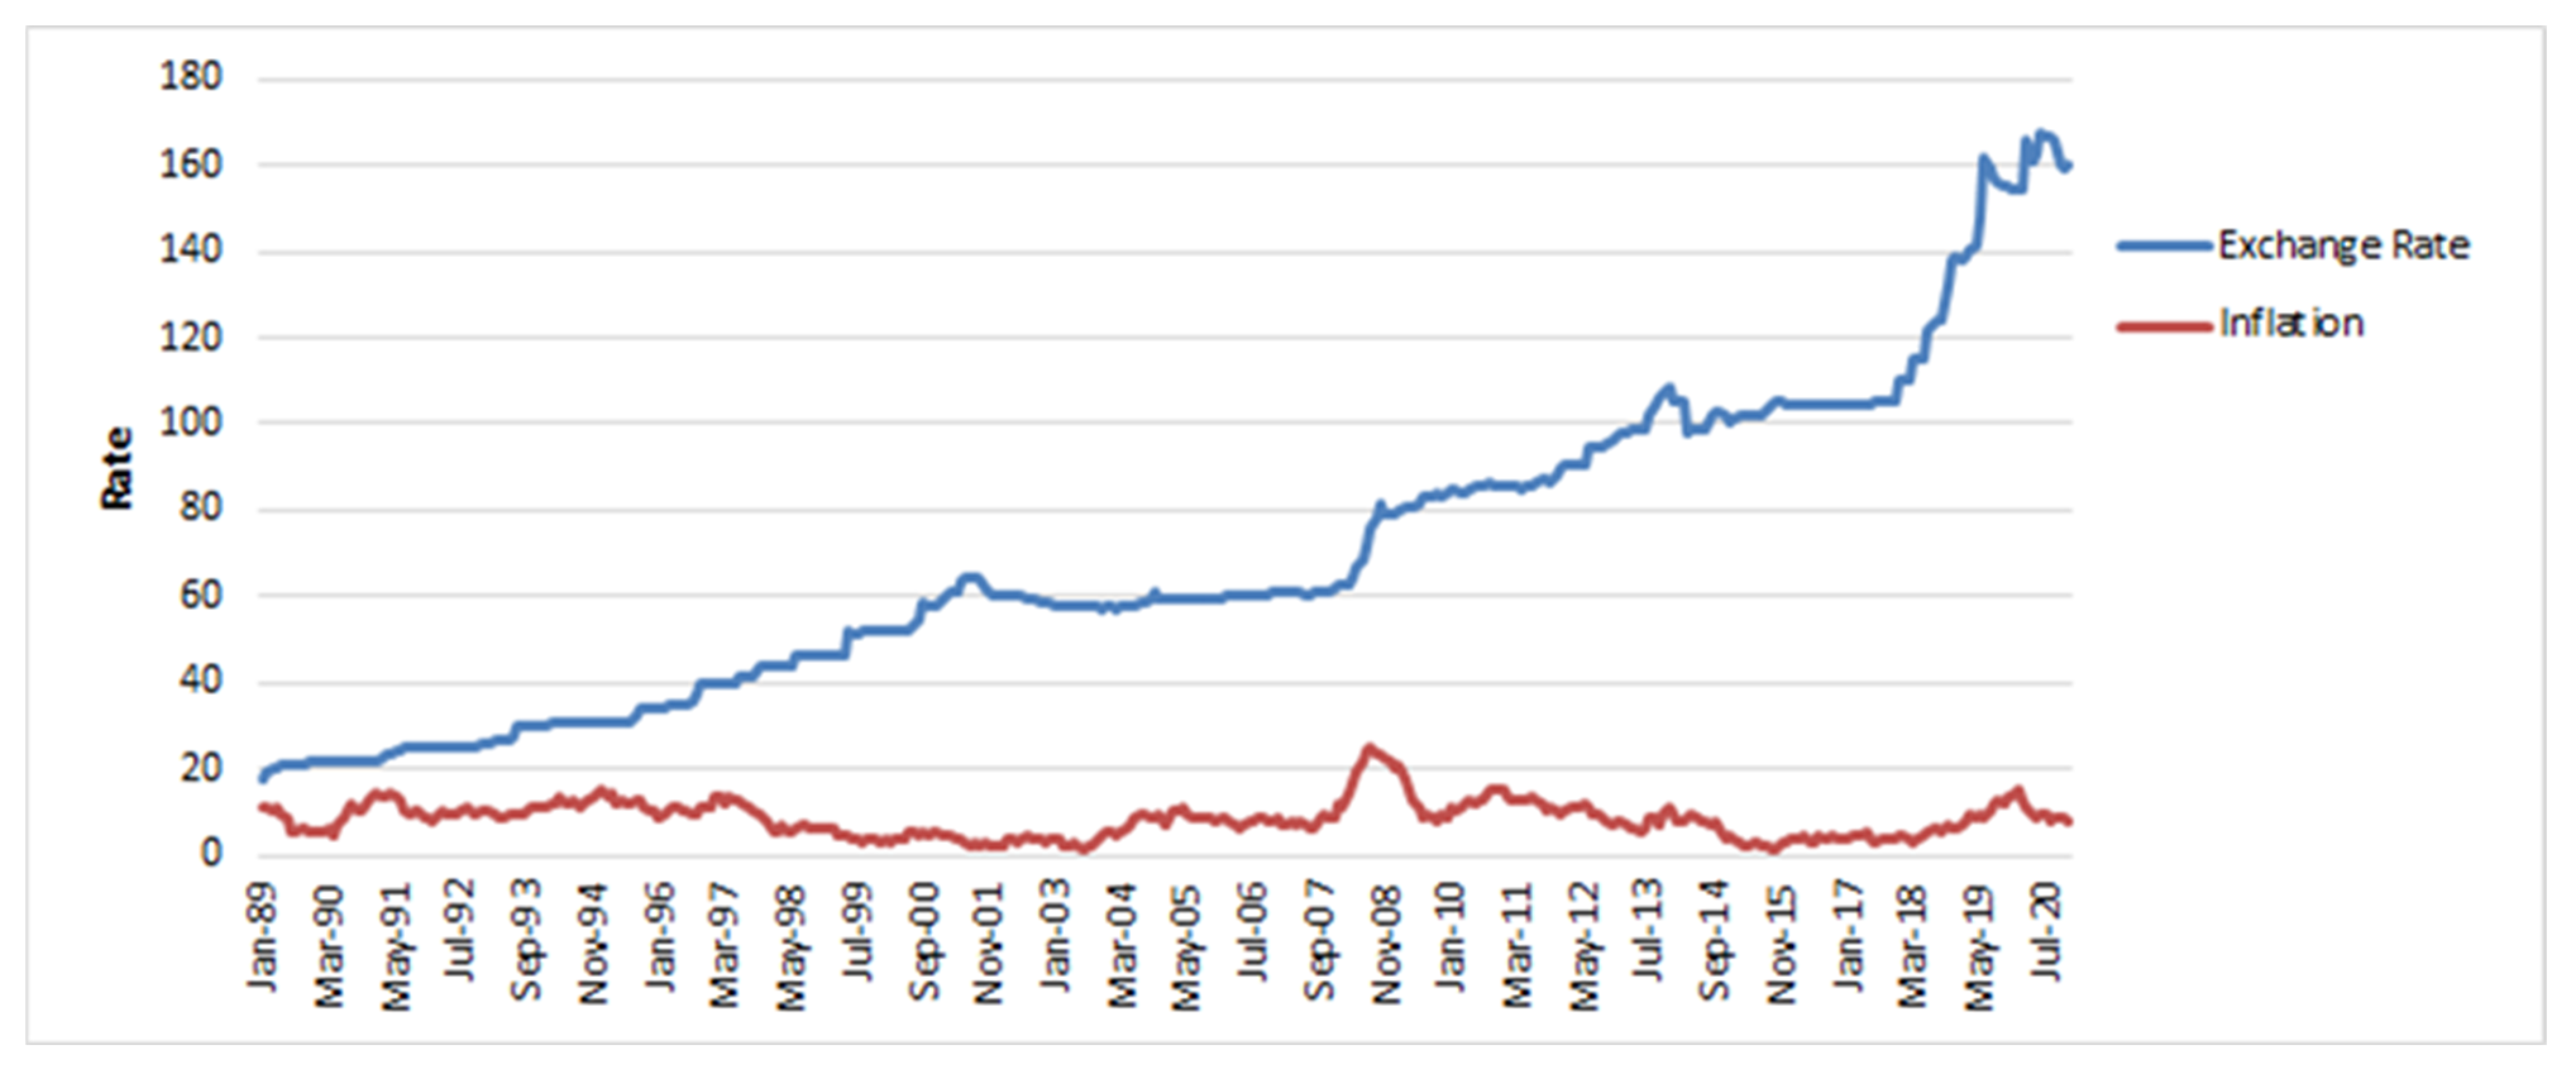
3.1. Data Collection

For the accurate prediction of various types of macroeconomic indicators in the country’s economy through artificial intelligence techniques, based on machine learning algorithms, we downloaded the secondary data and used the quantitative data technique for gathering the data for this research study. The data used in this study contained two macroeconomic indicators of Pakistan. The dataset covered the financial and monetary sectors of Pakistan’s economy. The frequency of the inflation dataset was monthly, and the exchange rate (PKR/USD) frequency was also monthly. The sample period was from January 1989 to December 2020. The data set was split into two sets: the training set from January 1989 to December 2018 and the remaining as a test set for ML testing. The dataset was taken from the Thomson Reuters data stream and the Pakistan Bureau of Statistics refer to Figure 2.

3.2. Machine Learning Algorithms

The ML algorithms used in this paper were KNN, polynomial regression, SVM, and ANNs. Each algorithm is briefly desired in the following sub-sections.

3.3. K-Nearest Neighbor (KNN)

KNN is a classical supervised machine learning algorithm. KNN is used for classification as well as regression tasks. In this paper, the KNN algorithm was used as a regressor. KNN is parameterized by parameter K which represents the number of nearest neighbors for the regression. We used K = 1 in this paper. Given the test sample and the train set, the nearest neighbor of the sample was searched in the train set for prediction and forecasting.

3.4. Polynomial Regression

Polynomial regression is a supervised machine learning technique for regression. In polynomial regression, the value of the dependent variable (i.e., prediction or forecasting) is obtained by fitting the nth-degree polynomial on independent variables. The parameters of the nth-degree polynomial are estimated by using the train set. Then, the estimated parameters are used to predict the output or forecasting based on the input or independent variables. In the paper, polynomials of degrees 1, 2, 3, 4, and 5 were used. On the other hand, researchers also used linear regression for forecasting macroeconomic activities. Linear regressions (LRs) are divided into simple and multiple regressions, depending on the involved number of independent variables. Moreover, multiple regression denotes a model-based forecast by the analysis of the correlation among a minimum of two independent variables and dependent variables [15].

3.5. Support Vector Machine (SVM)

SVM is a supervised learning technique (Hearst et al. 1998). It is used for both regression and classification. SVM is a parametric method that tries to find hyperplanes to enclose the maximum points inside the hyperplanes for regression. SVM is used as a regressor in this paper, and Kernel functions used are linear and radial basis functions (RBF). Support vector machines (SVMs) were introduced by Vapnik, and a linear model is employed for the implementation of nonlinear class boundaries by mapping input vectors nonlinearly into a high-dimensional feature space and employing the project data of numerous categories in a hyperplane for regression or classification. [22,23]. SVMs are mainly employed for the classification of data; they include classifying a plane that divides a data set into two subsets, whereas SVR implicates processing constant data to pinpoint a mapping function that may be employed to forecast data accurately. The principle of SVR is to transform raw data into a high-dimensional eigenspace to perform LR in that eigenspace after applying a nonlinear mapping function ( φ ) [16]. Therefore, being a supervised learning algorithm, SVM needs labelled data to be trained; therefore, data used are classified and separated into different groups. After multiple training processes, the algorithm tries to separate data. SVM is widely used to recognize fraudulent credit cards, and it may learn to recognize the handwriting or image classifications. SVM has widely been used for prediction purposes. Figure 3 explains the illustration of the SVM model.

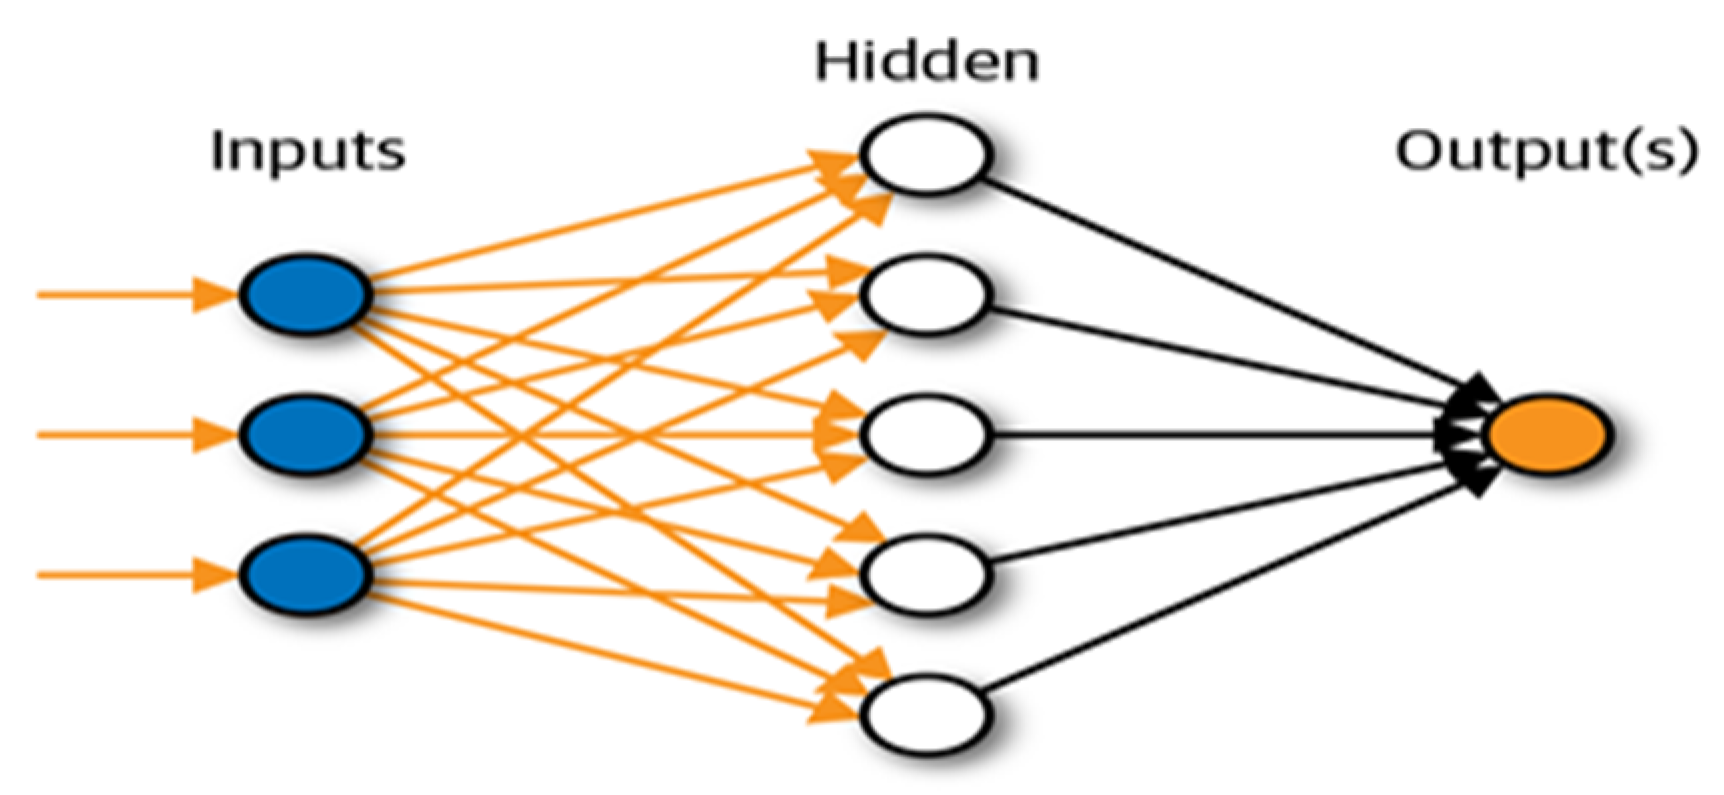
3.6. Artificial Neural Network (ANN)

In recent years (Abiodun et al. 2018), ANNs have attracted the attention of many researchers, as they possesses the ability to fit nonlinear data for prediction and forecasting. The ANN is a mathematical model which was introduced to mimic the structures of neural networks and functions in the brains of humans; it comprises multiple interrelated neurons/nodes. Information is generated over external stimulation or at the nodes and processed over activation; the signals of the process are transferred to other nodes or outputs [1]. The ANN contains the following three basic kinds of layers input, hidden, and output layers. Various kinds of the ANN have been familiarized, and several have a structure of multilayer perceptron [8]. The values that are output from the hidden neurons are then input to the subsequent layer with the output of neurons. ANN model accuracy possibly is improved by optimizing the critical parameters of an ANN including the number of hidden layers, the number of nodes in the hidden layer, the used activation function, and weights [14]. Moreover, the activation function is predominantly critical, as it is a nonlinear function and possibly maps the value from a linear function in an alternative space to enhance the overall performance of the model and data ability in order to capture the real/actual situations [13]. In this paper, an ANN was employed as a regressor. The ANN was a collection of connected hidden layers (L) in a cascade. Each L consisted of multiple neurons (N). We used L = ([26], 54, 54, 54, 5) and N = ([27], 32, 64, 12,816, 32, 64, 12,816, 32, 64, 12,816, 32, 64, 128) to implement the ANN. The activation function used for each neuron was ReLu. The ANN worked in a more systematic way where the input layer received information from the outside world, which was transferred to other units to extract meaningful information. The interconnection between the layers specified the quality of the information extracted. ANNs are also being used in different fields for prediction purposes (Gurjar, Naik, Mujumdar, Vaidya, & Technology, 2018; Qeethara & Review, 2011). The Illustration of the ANN model is explained in Figure 4.

3.7. Performance Evaluation

Two well-known performance evaluation metrics were used, which were root mean square error (RMSE) and mean absolute error (MAE).

3.8. Root Mean Square Error

RMSE is used for measuring the error rate of the regression models. It is an effective metric to compare the forecasting errors as follows: See Equation (1).
R M S E = i = 1 n ( y ^ y i ) 2 n
where n is the number of test samples, Yi is the true target value of the ith sample, and yi_cap is the forecasted value by the regressor.

3.9. Mean Absolute Error

MAE is a performance metric used to evaluate the performance of a regressor. It is calculated as follows: see Equation (2).
M A E = i = 1 n | y i x i | n
where n is the number of test samples, Yi is the true target value of the ith sample, xi is the forecasted value by the regressor, and |.| represents the absolute value.

3.10. Experimental Results and Discussion

This section presents the experimental results. The section is divided into two parts. In the first part, the results for exchange rate prediction are presented. In the second part, the results for inflation rates are presented.

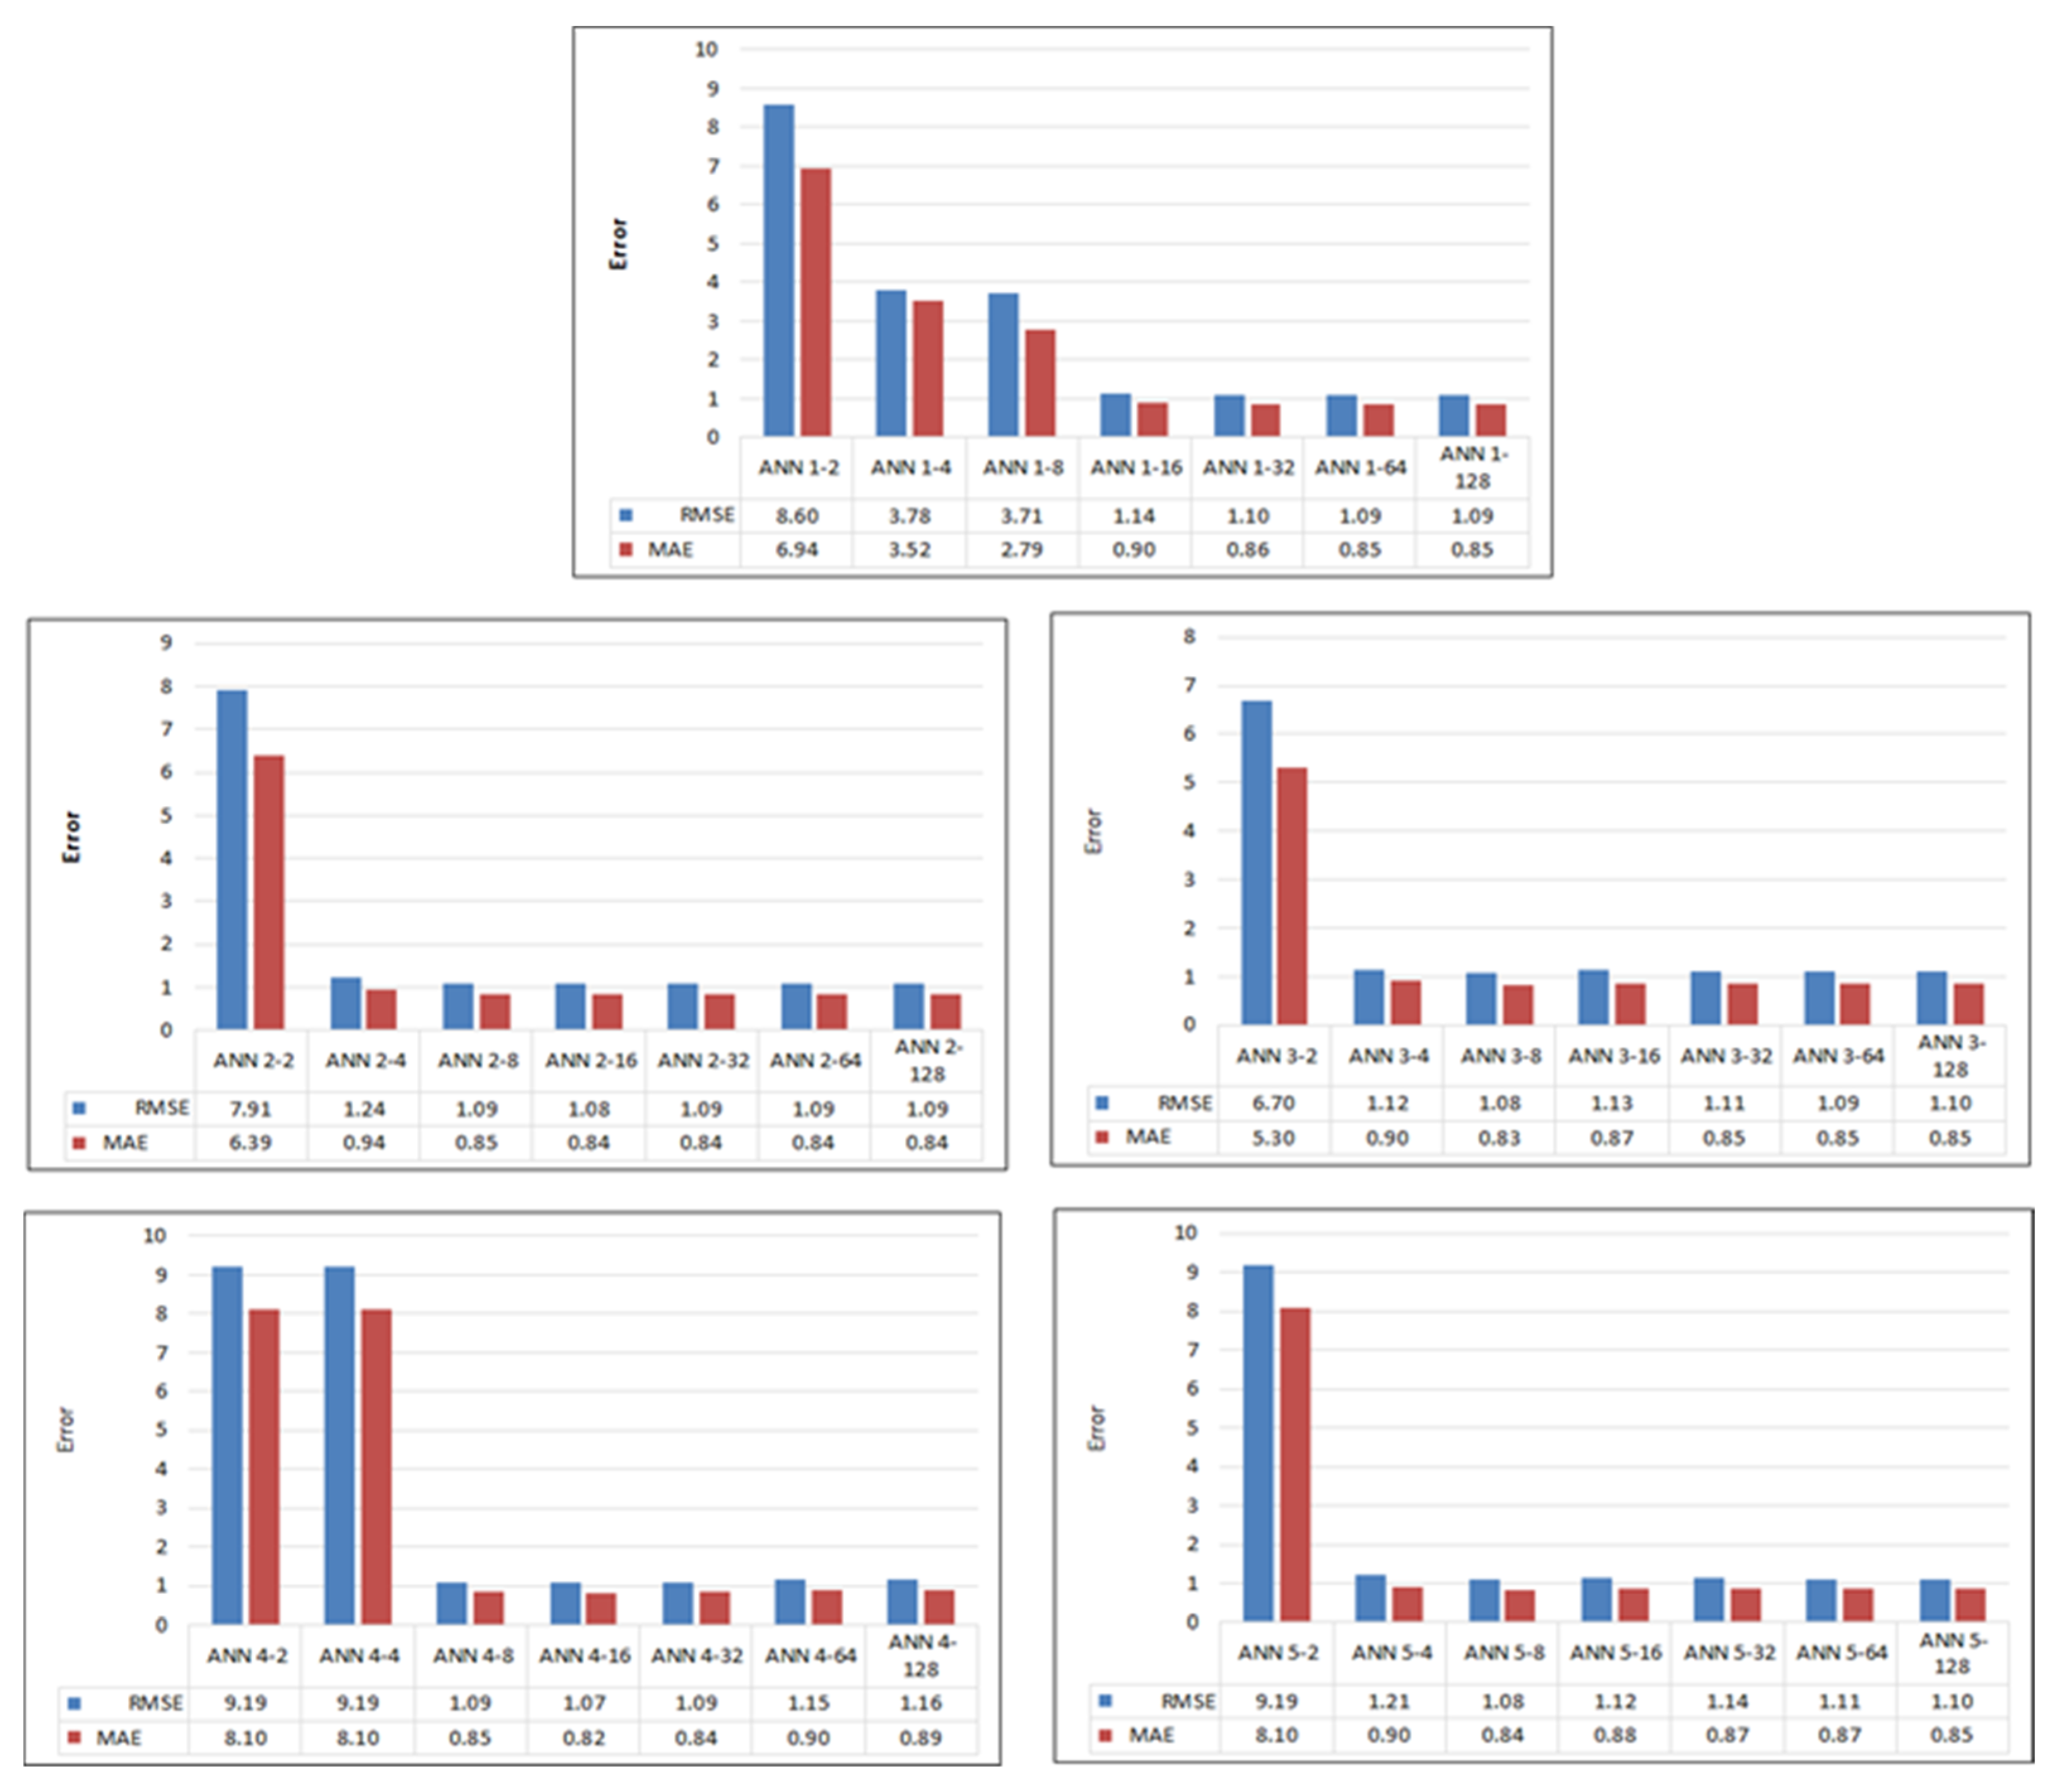
3.11. Forecasting of Exchange Rates

Table 1 shows the results of exchange rate prediction using KNN and SVM. The results showed that SVM RBF performed very well as compared to SVM linear function and KNN. The RMSE and the MAE for SVM RBF were low compared to those of SVM linear function and KNN. The RMSE and MAE values for SVM RBF were 0.972 and 0.543, respectively.
Table 2 shows the results achieved by polynomial regression up to five degrees for the prediction of exchange rates. It can be seen that the polynomial of degree 5 achieved the lowest RMSE and MAE compared to other polynomial degrees.
Figure 5 below compares different architectures of the ANN for exchange rate prediction using the RMSE and the MAE. To explain the result, ANN L-N notation was used, where L means several hidden layers and N means the number of neurons per layer. For instance, ANN 1-64 demonstrated the RMSE and the MAE of 1.62 and 1.15, respectively. It can be seen that ANN 5-8 achieved the lowest RMSE and MAE of 1.143 and 0.598, respectively, and outperformed all the other ANN architectures for exchange rate prediction.

3.12. Overall Results for Exchange Rate Prediction

Table 3 summarizes the results for exchange rate prediction. It can be seen that SVM RBF outperformed all other methods. The RMSE and the MAE of SVM RBF for exchange rate prediction were the lowest, i.e., 0.972 and 0.543, respectively, followed by those of the ANNs which achieved 1.143 and 0.598, respectively.

3.13. Forecasting of Inflation Rates

In this section, the experimental results achieved by each machine algorithm are presented and discussed. Table 4 shows the RMSE and MAE results achieved by SVM and KNN for inflation rate prediction. The results showed that SVM linear function performed better than SVM RBF, which is an indication of less non-linearity in the data for the prediction task. However, SVM RBF performed better than KNN. The RMSE and the MAE of SVM linear function were 1.095 and 0.838, respectively.
Table 5 shows the RMSEs and the MAEs achieved by the polynomial regression of different degrees. It can be seen that polynomial (degree 1) demonstrated the lowest RMSE and MAE, followed by polynomial (degree 2). The RMSE and the MAE of polynomial (degree 1) were 1.087 and 0.831, respectively.
Figure 6 evaluates different ANN architectures for the prediction of inflation rates. RMSE and MAE were used as performance metrics. Each architecture had a different number of hidden layers and a different number of neurons per layer. It can be seen that ANN 4-16 attained the lowest RMSE and MAE of 1.07 and 0.82, respectively, and outperformed all other architectures, where 4 and 16 represent the numbers of layers and neurons per layer, respectively.

3.14. Overall Results for Inflation Rate Forecasting

Table 6 shows the overall performance evaluation of ML methods for the prediction of inflation rates using RMSE and MAE. The results showed that the ANN outperformed all the other algorithms by demonstrating the lowest RMSE and MAE.

4. Conclusions

In this paper, different ML algorithms were evaluated for the forecasting of the exchange rate (PKR/USD) and inflation in Pakistan. The ML algorithms evaluated were ANNs, SVM, KNN, and polynomial regressors. In the case of exchange rate prediction, the experimental results showed that SVM (with an RBF kernel) outperformed all other methods whereas in the case of inflation prediction ANNs outperformed all other algorithms. The results showed that the parameter settings of all ML algorithms were important. For instance, SVM RBF gave better results than SVM linear function if data were nonlinear, whereas in the case of less non-linearity SVM linear outperformed SVM RBF. Similarly, for polynomial regressors, in case of less non-linearity, a low degree of polynomial gave better results. KNN statins had the lowest performance in the comparison. In the case of ANNs, less non-linearity can be tackled with a low number of hidden layers and neurons and vice versa.

5. Contribution of This Study

This study contributes to the literature in three different ways. Firstly, it compares the performances of machine learning models for forecasting inflation, which have not yet been thoroughly analyzed and covered before. This paper pays special attention to ANNs, KNN, polynomial regression, and SVM, because these models have received extensive attention in many prediction problems due to their excellent performance. Second, it introduces a machine learning-based approach to achieve more accurate forecasting of exchange rates and inflation in Pakistan than the forecasting made by different econometric methods. Lastly, this study also contributes to the literature by analyzing the accuracies of different methods. For example, we also calculated the prediction error of ANNs for every hidden layer with their neuron. This work has never been performed in the past research, where you can find which hidden layer has a low forecasting error and which hidden layer has a high prediction error. The application of ML can help the government to analyze forecasting data and take various measures to prevent an increase in inflation and companies forecast exchange rates using these methods to hedge their risk while fluctuation in the exchange rate.

6. Future Direction

The current study needs to be expanded and enriched with a more detailed analysis to work on the hypothesis that SVM and ANNs are better than KNN and polynomial regression techniques for different macroeconomic indicators. This study has been conducted only on macroeconomic indicators for Pakistan. Future research will be carried out in different Asian countries. The comparisons of ML algorithms with different econometric forecasting models will be carried out in future. Different evaluation techniques will be used for model evaluations, for example mean square error and R square/adjusted R square. Another future direction for better results is using hybrid models for forecasting, for example a combination of ML techniques with econometric models.

Author Contributions

Conceptualization, M.A.K. and A.J.; methodology, M.M.; software, A.A.S.; validation, M.M.S., M.M.A. and R.C.A.; formal analysis, N.A.; investigation, N.A.A.B.N.H.; resources, A.J.; data curation, N.A.A.B.N.H.; writing—original draft preparation, K.A.; writing—review and editing, R.C.A.; visualization, M.A.K.; supervision, M.M.S. and M.M.A.; project administration, A.J.; funding acquisition M.M.S. and A.A.S. All authors have read and agreed to the published version of the manuscript.

Funding

This research received no external funding.

Conflicts of Interest

The authors declare no conflict of interest.

References

  1. Richardson, A.; Mulder, T. Nowcasting New Zealand GDP using machine learning algorithms. In Proceedings of the Use of Big Data Analytics and Artificial Intelligence in Central Banking, Bali, Indonesia, 23–26 July 2018. [Google Scholar]
  2. Goudarzi, S.; Hickok, E.; Sinha, A. AI in Banking and Finance. The Center for Internet and Society. 2018. Available online: https://journals.sagepub.com/doi/10.1177/09722629221087371 (accessed on 13 June 2022).
  3. Awan, T. (Producer). How Artificial Intelligence Helps Pakistan to Fight Its Battle. Technology Times. Available online: https://www.technologytimes.pk/2020/08/04/how-artificial-intelligence-helps-pakistan-to-fight-its-battle (accessed on 4 August 2020).
  4. Liu, L.; Wang, W. Exchange rates forecasting with least squares support vector machine. In Proceedings of the the 2008 International Conference on Computer Science and Software Engineering, Washington, DC, USA, 12–14 December 2008. [Google Scholar]
  5. Collinson, S.; Rugman, A.M. The regional character of Asian multinational enterprises. Asia Pac. J. Manag. 2007, 24, 429–446. [Google Scholar] [CrossRef]
  6. Ramakrishnan, S.; Butt, S.; Chohan, M.A.; Ahmad, H. Forecasting Malaysian exchange rate using machine learning techniques based on commodities prices. In Proceedings of the 2017 International Conference on Research and Innovation in Information Systems (ICRIIS), Langkawi, Malaysia, 16–17 July 2017. [Google Scholar]
  7. Jena, P.R.; Majhi, R.; Majhi, B. Development and performance evaluation of a novel knowledge guided artificial neural network (KGANN) model for exchange rate prediction. J. King Saud Univ. Comput. Inf. Sci. 2015, 27, 450–457. [Google Scholar] [CrossRef]
  8. Shah, D.; Campbell, W.; Zulkernine, F.H. A comparative study of LSTM and DNN for stock market forecasting. In Proceedings of the 2018 IEEE International Conference on Big Data (big data), Seattle, WA, USA, 10–13 December 2018. [Google Scholar]
  9. Raj, D.A. Spotlight on the Remarkable Potential of AI in KYC. Available online: https://medium.com/all-technology-feeds/spotlight-on-the-remarkable-potential-of-ai-in-kyc-7441bf7eec38 (accessed on 3 April 2018).
  10. Navyasri, S.; Hafsa, N.; Nayana, S.; Bilimale, N. Predicting the GDP of India using Machine Learning. Int. J. Progress. Res. Sci. Eng. 2020, 1, 78–81. [Google Scholar]
  11. Yoon, J. Forecasting of real GDP growth using machine learning models: Gradient boosting and random forest approach. Comput. Econ. 2021, 57, 247–265. [Google Scholar] [CrossRef]
  12. Maehashi, K.; Shintani, M. Macroeconomic forecasting using factor models and machine learning: An application to Japan. J. Jpn. Int. Econ. 2020, 58, 101104. [Google Scholar] [CrossRef]
  13. Ülke, V.; Sahin, A.; Subasi, A. A comparison of time series and machine learning models for inflation forecasting: Empirical evidence from the USA. Neural Comput. Appl. 2018, 30, 1519–1527. [Google Scholar] [CrossRef]
  14. Syed, A.A.S.; Lee, K.H. Macroeconomic forecasting for Pakistan in a data-rich environment. Appl. Econ. 2021, 53, 1077–1091. [Google Scholar] [CrossRef]
  15. Coulombe, P.G.; Leroux, M.; Stevanovic, D.; Surprenant, S. How is machine learning useful for macroeconomic forecasting? arXiv 2020, arXiv:2008.12477. [Google Scholar] [CrossRef]
  16. Gogas, P.; Papadimitriou, T.; Takli, E. Comparison of simple sum and Divisia monetary aggregates in GDP forecasting: A support vector machines approach. Econ. Bull. 2013, 33, 1101–1115. [Google Scholar]
  17. Aziz, S.; Dowling, M. Machine learning and AI for risk management. In Disrupting Finance; Lynn, T., Mooney, J.G., Rosati, P., Cummins, M., Eds.; Palgrave Pivot Cham: New York, NY, USA, 2019; pp. 30–50. [Google Scholar]
  18. Medeiros, M.C.; Vasconcelos, G.F.; Veiga, Á.; Zilberman, E. Forecasting inflation in a data-rich environment: The benefits of machine learning methods. J. Bus. Econ. Stat. 2021, 39, 98–119. [Google Scholar] [CrossRef]
  19. Kou, G.; Chao, X.; Peng, Y.; Alsaadi, F.E.; Herrera-Viedma, E. Machine Learning Methods for Systemic Risk Analysis in Financial Sectors. Technol. Econ. Dev. Econ. 2019, 25, 716–742. [Google Scholar] [CrossRef]
  20. Huang, Y.; Kou, G.; Peng, Y. Nonlinear manifold learning for early warnings in financial markets. Eur. J. Oper. Res. 2017, 2, 692–702. [Google Scholar] [CrossRef]
  21. Chao, X.; Peng, Y. A cost-sensitive multi-criteria quadratic programming model for imbalanced data. J. Oper. Res. Soc. 2017, 69, 500–516. [Google Scholar] [CrossRef]
  22. Gensler, G.; Bailey, L. Deep Learning and Financial Stability. 2020. Available online: https://www.semanticscholar.org/paper/Deep-Learning-and-Financial-Stability-Gensler-Bailey/daeb93c0419ee9af5d6c785ebe1e75c9fb3ea73f (accessed on 13 June 2022).
  23. Danielsson, J.; Macrae, R.; Uthemann, A. Artificial intelligence and systemic risk. J. Bank. Financ. Forthcom. 2021, 140, 106290. [Google Scholar] [CrossRef]
  24. Boukherouaa, E.B.; Shabsigh, G.; AlAjmi, K.; Deodoro, J.; Farias, A.; Iskender, E.S.; Mirestean, A.T.; Ravikumar, R. Powering the Digital Economy: Opportunities and Risks of Artificial Intelligence in Finance; International Monetary Fund: Washington, DC, USA, 2021. [Google Scholar]
  25. Cicceri, G.; de Vita, F.; Bruneo, D.; Merlino, G.; Puliafito, A. A deep learning approach for pressure ulcer prevention using wearable computing. Hum.-Cent. Comput. Inf. Sci. 2020, 10, 5. [Google Scholar] [CrossRef]
  26. AlShorman, O.; Alkahatni, F.; Masadeh, M.; Irfan, M.; Glowacz, A.; Althobiani, F.; Kozik, J.; Glowacz, W. Sounds and acoustic emission-based early fault diagnosis of induction motor: A review study. Adv. Mech. Eng. 2021, 13, 1–19. [Google Scholar] [CrossRef]
  27. Ahmed, E.; Hamdan, A. The impact of corporate governance on firm performance: Evidence from Bahrain Bourse. Marietta 2015, 11, 21–37. [Google Scholar]
Figure 1. Flow diagram of the model selection process.
Sustainability 14 09964 g001
Figure 2. Time series data in this study.
Sustainability 14 09964 g002
Figure 3. Illustration of the SVM model.
Sustainability 14 09964 g003
Figure 4. Illustration of the ANN model.
Sustainability 14 09964 g004
Figure 5. Different architectures of the ANN.
Sustainability 14 09964 g005
Figure 6. ANN architectures for prediction.
Sustainability 14 09964 g006
Table 1. Exchange rate prediction with KNN and SVM.
MethodsRMSEMAE
KNN (K = 1)1.6270.793
SVM linear function1.1310.589
SVM RBF0.9720.543
Table 2. Exchange rate prediction with polynomial regression of different degrees.
MethodsRMSEMAE
Polynomial (degree 1)1.2650.718
Polynomial (degree 2)1.3220.738
Polynomial (degree 3)1.2730.741
Polynomial (degree 4)1.2330.779
Polynomial (degree 5)1.1820.699
Table 3. Exchange rate prediction.
MethodsRMSEMAE
KNN (K = 1)1.6270.793
SVM RBF0.9720.543
Polynomial (degree 5)1.1820.699
ANN 5-81.1430.598
Table 4. RMSE and MAE-based results for inflation rate prediction.
MethodsRMSEMAE
KNN1.5921.178
SVM linear function1.0950.838
SVM RBF1.2190.892
Table 5. Inflation rate error measurement on polynomial regression.
MethodRMSEMAE
Polynomial (degree 1)1.0870.831
Polynomial (degree 2)1.1020.831
Polynomial (degree 3)1.1110.836
Polynomial (degree 4)1.1330.845
Polynomial (degree 5)1.1280.851
Table 6. Summarized performance evaluation.
MethodRMSEMAE
KNN1.5921.178
SVM linear function1.0950.838
Polynomial (degree 1)1.0870.831
ANN 4-161.0700.820
Publisher’s Note: MDPI stays neutral with regard to jurisdictional claims in published maps and institutional affiliations.

