Article

A CLUMondo Model-Based Multi-Scenario Land-Use Change Simulation in the Yangtze River Delta Urban Agglomeration, China

1
Chinese Research Academy of Environmental Sciences, Beijing 100012, China
2
Key Laboratory of Regional Eco-Process and Function Assessment and State Environment Protection, Beijing 100012, China
*
Author to whom correspondence should be addressed.
Sustainability 2022, 14(22), 15336; https://doi.org/10.3390/su142215336
Submission received: 5 September 2022 / Revised: 27 September 2022 / Accepted: 26 October 2022 / Published: 18 November 2022
(This article belongs to the Special Issue Urban Ecological Security and Sustainability)

Abstract

:
Land-use changes have profound effects on both socio-economic development and the environment. As a result, to optimize land-use planning and management, models are often employed to identify land-use patterns and their associated driving forces. In this work, physical and socioeconomic factors within the Yangtze River Delta Urban Agglomeration (YRDUA) from 2000 to 2015 were identified, integrated, and used as the foundation for a CLUMondo model. Subsequently, the Markov model and the CLUMondo model were combined to predict land-use changes in 2035. Natural growth (NG), economic development (ED), ecological protection (EP), and coordinated social and economic development (CSE) scenarios were set according to the land-use date in the assessment. Results showed that: (1) From 2000 to 2015, urban land increased by 8139.5 km2 (3.93%), and the paddy field decreased by 7315.8 km2 (8.78%). The Kappa coefficient of the CLUMondo model was 0.86, indicating that this model can be used to predict the land-use changes of the YRDUA. (2) When this trend was used to simulate landscape patterns in 2035, the land-use structure and landscape patterns varied among the four simulated urban development scenarios. Specifically, urban land increased by 47.6% (NG), 39.6% (ED), 32.9% (EP), and 23.2% (CSE). The paddy field was still the primary landscape, with 35.85% NG, 36.95% ED, 37.01% EP, and 36.96% CSE. Furthermore, under all four scenarios, the landscape pattern tended to simplify and fragment, while connectivity and equilibrium diminished. The results provided herein are intended to elucidate the law of urban agglomeration development and aid in promoting urban sustainable development.

1. Introduction

Each biological community of interacting organisms and their corresponding physical environment play unique and irreplaceable roles in the integrated Earth ecosystem. For example, forestland participates in water conservation, provides a habitat for animals, and combats climate change [1] while wetlands regulate climate, reduce flood peaks, and maintain biodiversity [2]. Consequently, urban sprawl, which is characterized by a large concentration of unnatural, impervious surfaces and high buildings, sometimes diminishes the ecosystem services, and in turn affects residents’ quality of life [3]. Specifically, urbanization and associated land-use changes can significantly impact the urban environment by generating urban heat islands, affecting regional and local climate, and facilitating biodiversity loss, air pollution, massive carbon emissions, and oxygen consumption [4,5,6,7,8]. As a result, unplanned and uncontrolled expansion of urban areas will further diminish ecosystem services and aggravate ecological risks [7,9]. Therefore, exploring the interaction between urban development and ecological processes with respect to territorial spatial planning is essential, as this relationship has profound significance for urban sustainable development.
Significant conflicts between urban development and ecological protection produce ongoing challenges in rapidly developing megacities, especially in developing countries. To that end, the Yangtze River Delta Urban Agglomeration (YRDUA) serves as an ideal case study for evaluating these conflicts. The YRDUA is the most developed industrial region in China. In addition to being comprised of important nodes—“one belt and one road”—, it is also the leading economic belt within the Yangtze River region. Though the YRDUA is the sixth-largest urban agglomeration in the world, it is undergoing rapid urbanization [10], which has negatively impacted the Yangtze River Delta’s ecosystem value. Specifically, from 2000 to 2020, farmland area declined from 56% to 49% due to urban land expansion [11]. Moreover, the urban land-use intensity is still increasing in response to population growth and industrial agglomeration.
Numerous studies demonstrate the driving mechanisms behind land-use change using qualitative and quantitative methods [12,13,14]. In general, the explanatory variables associated with land-use change are socioeconomic (i.e., population density and gross domestic product) and geographical (i.e., elevation, slope, and distance to roads). For example, in the Pearl-River-Delta region, socioeconomic factors were the most significant contributor to urban land expansion, while the physical factors restricted the direction and size [15]. In contrast, in China’s Jing Jin Ji Metropolitan Region, climate variables and soil properties were responsible for wetland distribution [12]. However, it is equally important to note that inherent land-use landscape pattern properties indirectly affect land-use dynamics [16] and that the interaction between land-use dynamics and driving forces vary with time. Therefore, a comprehensive understanding of land-use change driving mechanisms is pivotal for accurately simulating land-use change. Previous research fully considered traffic accessibility (i.e., distance to road), but few studies considered the airport and port. Thus, we took these factors into consideration.
Simulation scenarios aid in urban development analysis and land-use planning. To date, the most widely adopted spatially explicit land-use models are Cellular Automata (CA) [17] and Conversion of Land-use and its Effects at Small regional extent (CLUE-S) [18,19]. CA generates complex systems output based on simple interactions. While CA is inherently flexible, its outputs are less accurate, and it is incapable of efficiently conducting simulations involving multiple land-use changes. Moreover, improved CA-based models (e.g., the CA-Markov model, system dynamics-CA, and Logistic-CA-Markov model) rarely consider the interactions between land-use and driving forces [20,21]. To circumvent these issues, the Future Land Use Simulation (FLUS) model was developed based on CA and incorporates an integrated self-adaptive inertia and competition mechanism to consider interactions among different land-use types [17]. The CLUE-S model is excellent for simulating and predicting multiple land-use changes simultaneously at the regional and local scale [22,23,24,25], and the CLUMondo model is the latest CLUE-S development [22]. Compared with the CA-based models, the CLUMondo model integrates the natural and anthropogenic factor, spatial and non-spatial driving forces by combining a top-down with a bottom-up method, which makes CLUMondo more comprehensive, open, and extensive. However, while the CLUMondo model relies on systems theory to determine whether the competition among various land-use types is stronger or weaker, the land-use demand values—i.e., the area of land required for each use type—requires external input. The Markov model can depict the direction and intensity of future land-use change with high accuracy assuming the driving force is stable. The Markov model is reliable and is widely used in the field of land use. Because the Markov model is suitable for predicting the area of land-use change, combining the CLUMondo model and Markov models improves simulation results. Scenarios, such as historical development, economic development, ecological protection, are well studied, but few studies explore the coordinated social and economic development (CSE) scenario and its effect on regional landscape at urban agglomeration.
The Yangtze River Delta urban agglomeration is the region with the highest level of urbanization, and it is also one of the important engines of economic growth in China [26]. It occupies an important position in China’s economic development. At the same time, the Yangtze River Delta urban agglomeration is also one of the most prominent areas of ecological security, and the contradiction between population growth and land resources is one of the most important problems limiting regional development. How to coordinate the relationship between rapid urbanization and ecological security is the key to establish and maintain regional sustainable development. Thus, in this work, the CLUMondo and Markov models were jointly used to simulate and predict land-use change under different urban development scenarios in the YRDUA. The goals of this study were to: (1) quantify the land-use change in the YRDUA from 2000 to 2015; (2) use the 2000 to 2015 land-use trends to simulate future land-use pattern dynamics under different urban development scenarios; and (3) evaluate the YRDUA’s landscape pattern in 2035 under the various simulation scenarios. The results presented herein can serve as a strategical reference for rapidly developing cities struggling with ecological and sustainable urban development, provide support for regional ecological space optimization, and play an exemplary and guiding role in the development of other regions.

2. Methods

A detailed workflow was established for this study (Figure 1). First, we produced two land-use maps in 2000 and 2015 by using Landsat 5 TM and Landsat 8 OLI imagery. Then, future land-use changes in 2035 under four different urban development scenarios were simulated by the integration of the Markov model and the CLUMondo model. Finally, we evaluated the landscape patterns of the future land use.

2.1. Study Area

The YRDUA (119°08′–121°15′ E, 36°46′–32°04′ N) (Figure 2) is located in the eastern coastal area of China and covers an area of 206,835 km2, which accounts for 2.2% of China’s mainland territory. While Shanghai is the region’s primary hub, 26 other major cities are distributed throughout the Jiangsu (nine cities), Zhejiang (eight cities), and Anhui (nine cities) Provinces. The YRDUA has a subtropical monsoon climate with an annual average temperature ranging from 15.6 to 18.1 °C and annual precipitation ranging from 704 to 1734 mm. The YRDUA depicts a wide variety of geomorphological features, including plains, hills, and mountains. Taihu Lake occupies the low elevation center and is surrounded by higher topographic areas. The Yangtze River Delta has the highest river network density in China (4.8–6.7 km/km2). By 2018, there were 21.5 million people, i.e., 8.0% of the Chinese population, living in the YRDUA. The average urbanization rate increased from 63.93% in 2010 to 75.01% in 2020. In 2018, the average total GDP reached 17 800 billion yuan with a growth rate of 7.2%. With the growth of population and development of the economy, there was inevitably an intense conflict between urban development and ecological protection. Farmland, forestland, wetland, and other land-use types obviously decreased in recent years. The Chinese Government implements some control to protect the natural land and farmland.

2.2. Data Collection and Processing

Cloudless remote sensing images (including Landsat 8 OLI and Landsat 5 TM) spanning from April to October were obtained from the Geospatial Data Cloud (http://www.gscloud.cn/ (accessed on 1 September 2022)) for the years 2000 and 2015, respectively. Next, after performing radiation calibration, image enhancement, and geometric calibration (1:100,000 topographic map), the images from 2000 and those from 2015 were, respectively, combined to form two mosaics. Subsequently, both land-use maps were interpreted via the supervised classification and visual interpretation approaches using the following land-use classification scheme: dry farmland, paddy field, forestland, grassland, water area, urban land, and unused land. High-resolution Google Earth historical imagery and field investigations were employed to evaluate the interpretation accuracy. The land-use maps showed a >85% accuracy, which satisfied the requirements of this study. The 2019 administrative division data for the YRDUA Provinces and cities were obtained from the Resource and Environment Science Data Center of the Chinese Academy of Sciences (http://www.resdc.cn/ (accessed on 1 January 2018)).

2.3. Study Methods

2.3.1. Markov Chain Model

Demand areas for future land use in 2030 and 2045 were predicted based on the actual land-use maps in 2000 and 2015 using the Markov Chain model. Then, the demand area of future land use in 2035 was obtained through the method of linear interpolation. The Markov Chain model describes land-use dynamics and occurrence probability based on historical land-use change [27]. It is reasonable to predict that land use will be converted because land-use structure is only stable for a short time on a regional scale. The following expression was used to perform the aforementioned calculations:
P i j =   P 11 .     .     . P 1 n   .   .   . .   .   . .   .   .   P m 1 .     .     . P m n   0 P i j 1 , j = 1 n P i j = 1
where P i j is the transition probability of land type (i) to land type (j), and n is the number of land-use types.

2.3.2. CLUMondo Model

The study selected the CLUMondo model to predict the future land-use changes in different scenarios. The CLUMondo model is specifically designed to consider competition between multiple land-use types and location suitability and, thus, can explicitly simulate the land-use dynamics at various scales [22]. The CLUMondo contains both a spatial and non-spatial module. The spatial allocation profiles included the land-use pattern, spatial restrictions, explanatory variables, conversion matrix, and elasticity (ELAS). Spatial restrictions consisted of natural reserves, parks, and areas of high elevation that are not suitable for planting. The conversion rules were established based on actual land-use change from 2000 to 2015. The ELAS value, which can range from 0 to 1, represents the degree of difficulty required to convert one land-use type to another. Zero implies little difficulty, while one indicates maximum challenges.
Land-use change driving factors steer the evolution of land-use pattern and purpose [16,28,29]. The corresponding land-use change driving factors include terrain, neighborhood, natural, and social economic factors, among others. City centers, infrastructure, and topography are the main factors contributing to land-use changes in China [30,31]. In this study, the driving factors include: the Gross Domestic Product (GDP), population density, distance factors (railway, express railway, main roads, rivers, village, airport, port), Digital Elevation Model (DEM), and slope (Table 1). The distance factors were calculated using the Euclidean distance, while other driving factors were downloaded from RESDC (http://www.resdc.cn (accessed on 1 January 2018)). The land-use map and all the driving factors were resampled to 500 m × 500 m in ARCGIS.
During the simulation process, relationships between each land-use type and its corresponding driving forces were established using logistic regression. Subsequently, the occurrence probabilities were calculated. The logistic regression equation is expressed as:
Log P i 1 P i = β 0 + β 1 X 1 , i + β 2 X 2 , i   + ,   ,   +   β nXn , i
where P i is the occurrence probability of a grid cell; i is the occurrence of the considered land-use type; Xn represents the explanatory variables; and coefficients (β) are estimated through logistic regression using the actual land-use pattern as a dependent variable.

2.3.3. Simulation Scenarios

Because of the complexity and uncertainty associated with social-ecological systems, analyzing various potential scenarios aids in determining the optimal pathway for policy making. Since the YRDUA-integrated regional development and new world development pattern still promotes further urban expansion, land-use simulation under different socio-economic development scenarios is both critical and urgent for land-use planning. Four land-use patterns representing the YRDUA in 2035 were simulated under the following scenarios: natural growth, economic development, ecological protection, and coordinated social and economic development.
(1)
Natural growth (NG) scenarios
The natural growth scenario assumes that the driving forces and their impact on the land-use type are stable. The demand, i.e., the required area, for different land-use types in 2035 was calculated by adopting the Markov chain model based on the 2000–2015 transition probability matrix. The ELAS parameters for the following land-use types were set to: dry farmland = 0.7, paddy field = 0.7, forestland = 0.8, grassland = 0.7, water area = 0.9, and urban land = 0.7.
(2)
Economic development (ED) scenarios
In the ED scenario, the region tends to prioritize economic development and, thus, requires an adequate supply of urban land. Based on the 14th Five-Year Plan for Economic and Social Development in Shanghai, Zhejiang, and Anhui (2021–2025), the YRDUA-integrated development plan (2021–2025), and urban development planning for major cities in 2035, such as Shanghai, Nanjing, and Hangzhou, urban land in 2035 is expected to account for 15% of the land-use area.
(3)
Ecological protection (EP) scenarios
According to China’s “emission peak, carbon neutrality” strategy, green and low-carbon development must be prioritized. To achieve this goal, urban land size must be carefully controlled, and the allotted urban land area must maintain maximum efficiency. Thus, the EP scenario tends to focus on ecological security by effectively protecting cultivated land, forestland, grassland, and wetlands while simultaneously limiting the city to a manageable size. Thus, the required area for different land-use types in 2035 depends on the results of the NG and ED scenarios.
(4)
Coordinated social and economic development (CSE) scenarios
This scenario focuses on coordinated rapid development and ecological protection. Th goal is to maintain economic growth while protecting the environment—ultimately achieving sustainable development. Thus, socioeconomic and ecological protection factors are both considered; and the urban land area demand is calculated by averaging the ED and EP scenarios. Forestland, water area, and basic farmland were prohibited from being converted to other land-use types. Thus, the ELAS for forestland and water area were set as 1.0 and 1.0, respectively.

2.3.4. Model Validation

The Kappa coefficient was adopted to evaluate the simulation accuracy. In essence, the 2015 simulation land-use map, which was based on the actual 2000 land-use map, was compared with actual 2015 land-use map using the following expression:
K a p p a = P o P c P p P c
where P o , P p , and P c are the observed, absolute, and expected correct proportion, respectively. The higher the Kappa value, the stronger the agreement. Thus, Kappa values > 0.8 imply strong agreement.

2.3.5. Landscape Pattern Analysis

Landscape patterns are the composite distribution of landscape units in space, which are closely related to ecological processes [32]. Landscape patterns can be quantified using the landscape pattern index, which is an effective way to reveal spatial characteristics of future land use under different simulation scenarios. Based on similar related studies [11,15,33,34], six landscape-level metrics were applied to evaluate the landscape patterns in 2035 under the four urban development scenarios (Table 2). Metrics included the number of patches (NP), landscape shape index (LSI), Simpson’s diversity index (SIDI), Shannon’s evenness index (SHEI), contagion (CONTAG), and aggregation index (AI). In particular, NP was used to measure the total number of all patches in the landscape. A larger NP means more landscape patches and greater fragmentation. The LSI describes the shape of the landscape; a larger LSI value means the landscape tends to be more fragmentated. SIDI reflects the heterogeneity of the landscape, and a higher value indicates that the patches tend to be evenly distributed in the landscape. A higher SHEI means the landscape tends to be more stable. CONTAG is the connectivity of the dominant landscape, and the larger the CONTAG value, the higher the integrity of the landscape. AI represents the extent of aggregation, and a smaller AI value refers to the landscape fragmentation degree. All of these were calculated using FRAGSTATS.

3. Results

3.1. Changes in Land-Use Patterns

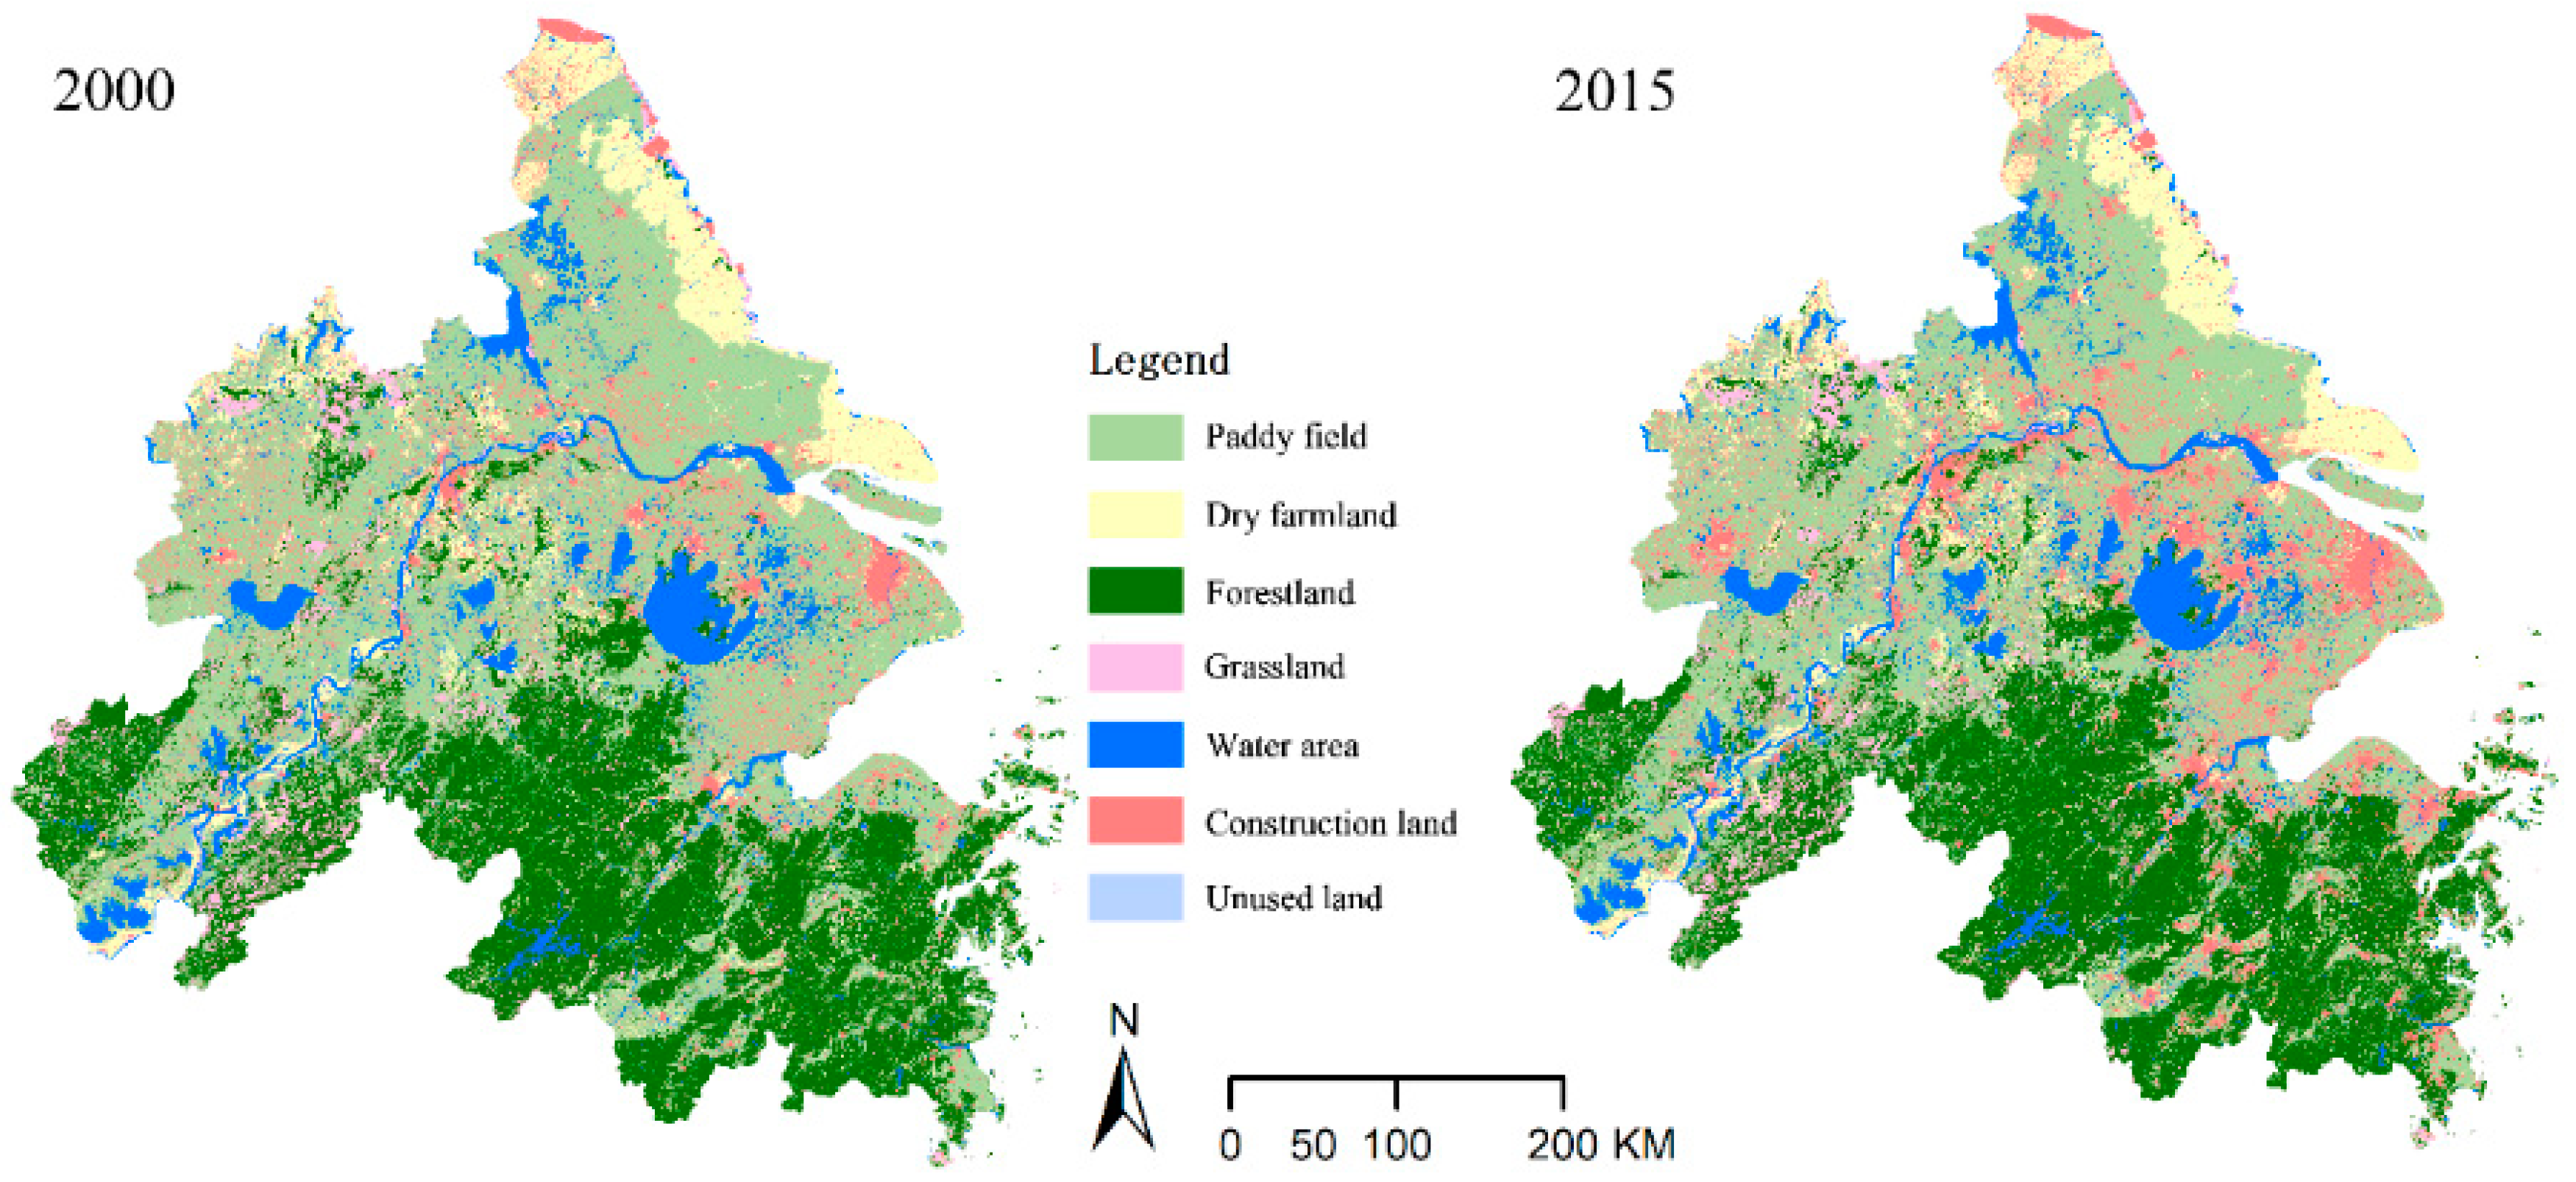
From 2000 to 2015, the YRDUA underwent significant land-use structure changes (Figure 2 and Table 3). Paddy fields were predominantly distributed in the central and northern parts of the region, while forestland was mainly distributed in the high-altitude areas of the northern Zhejiang and southern Anhui Provinces (Figure 2). In terms of the overall area, paddy field was the dominant landscape, accounting for 43.81% in 2000 and 40.27% in 2015. From 2000 to 2015, there was a dramatic expansion of urban land and a remarkable shrinkage of paddy fields (Figure 3 and Table 3). Specifically, the urban land increased from 16,149.0 km2 (2000) to 24,288.5 km2 (2015)—i.e., from 7.81% to 11.74%. Simultaneously, the paddy field coverage decreased by 7315.8 km2 from 2000 (90,616.5 km2) to 2015 (83,300.7 km2), accounting for 85.07% of the total increased urban land area. Dry farmland (8.72%) and forestland (6.19%) contributed to the remainder of the area that was urbanized. The water area increased by 0.22%, from 15,584.8 km2 (2000) to 16,026.5 km2 (2015). Cultivated land loss occurred continuously due to urban sprawl, although it must be noted that policies such as “returning farmland to forests” also promoted cultivated land loss to some extent.
From 2000 to 2015, paddy fields were mainly converted to construction land, with an area of 6978.73 km2, followed by 818.99 km2 to wetlands, 104.76 km2 to dry land, 375.22 km2 to woodland, and 47.62 km2 to grassland. Dry land was mainly converted into construction land with an area of 911.78 km2 followed by paddy land with an area of 84.96 km2. Forest land was mainly converted into construction land, forest land, grassland, and dry land, respectively, 453.37 km2, 368.04 km2, 153.42 km2, and 104.93 km2. The change in the grassland area was not great but was mainly converted into forest land, construction land, and dry land, with an area of 115.54 km2, 55.8 km2, and 45.18 km2, respectively. The wetland was mainly converted into construction land, paddy fields, and grassland, with the conversion area of 199.78 km2, 194.17 km2, and 73.47 km2, respectively. About 335.71 km2 of construction land was converted to paddy lands, 80.44 km2 to dry land, and 19.91 km2 to forest land. The area of other converted construction land and forest land is relatively large, which is 2.09 km2 and 1.11 km2, respectively (Table 4).
Construction land, wetland, grassland, and other land-use types showed an increasing trend, with the net increasing areas of 8134.5 km2, 451.52 km2, 26.76 km2, and 16.15 km2, respectively. The land-use types of paddy fields, dry land, and forest land showed a decreasing trend. The net decreased area was 7324.38 km2, 747.73 km2, and 501.29 km2, respectively.

3.2. Land-Use Pattern Change Trend Simulations under Different Scenarios

The Kappa coefficient for the urban development forecasting was 0.82, which indicates good agreement (Figure 4). Thus, the CLUMondo model can be applied to forecast future land-use changes in the YRDUA. Using the four preset scenarios described above in combination with the actual land-use changes, the 2035 land-use demand in the Yangtze River Delta region was simulated. The resulting land-use pattern under these different scenarios is shown in Figure 4.
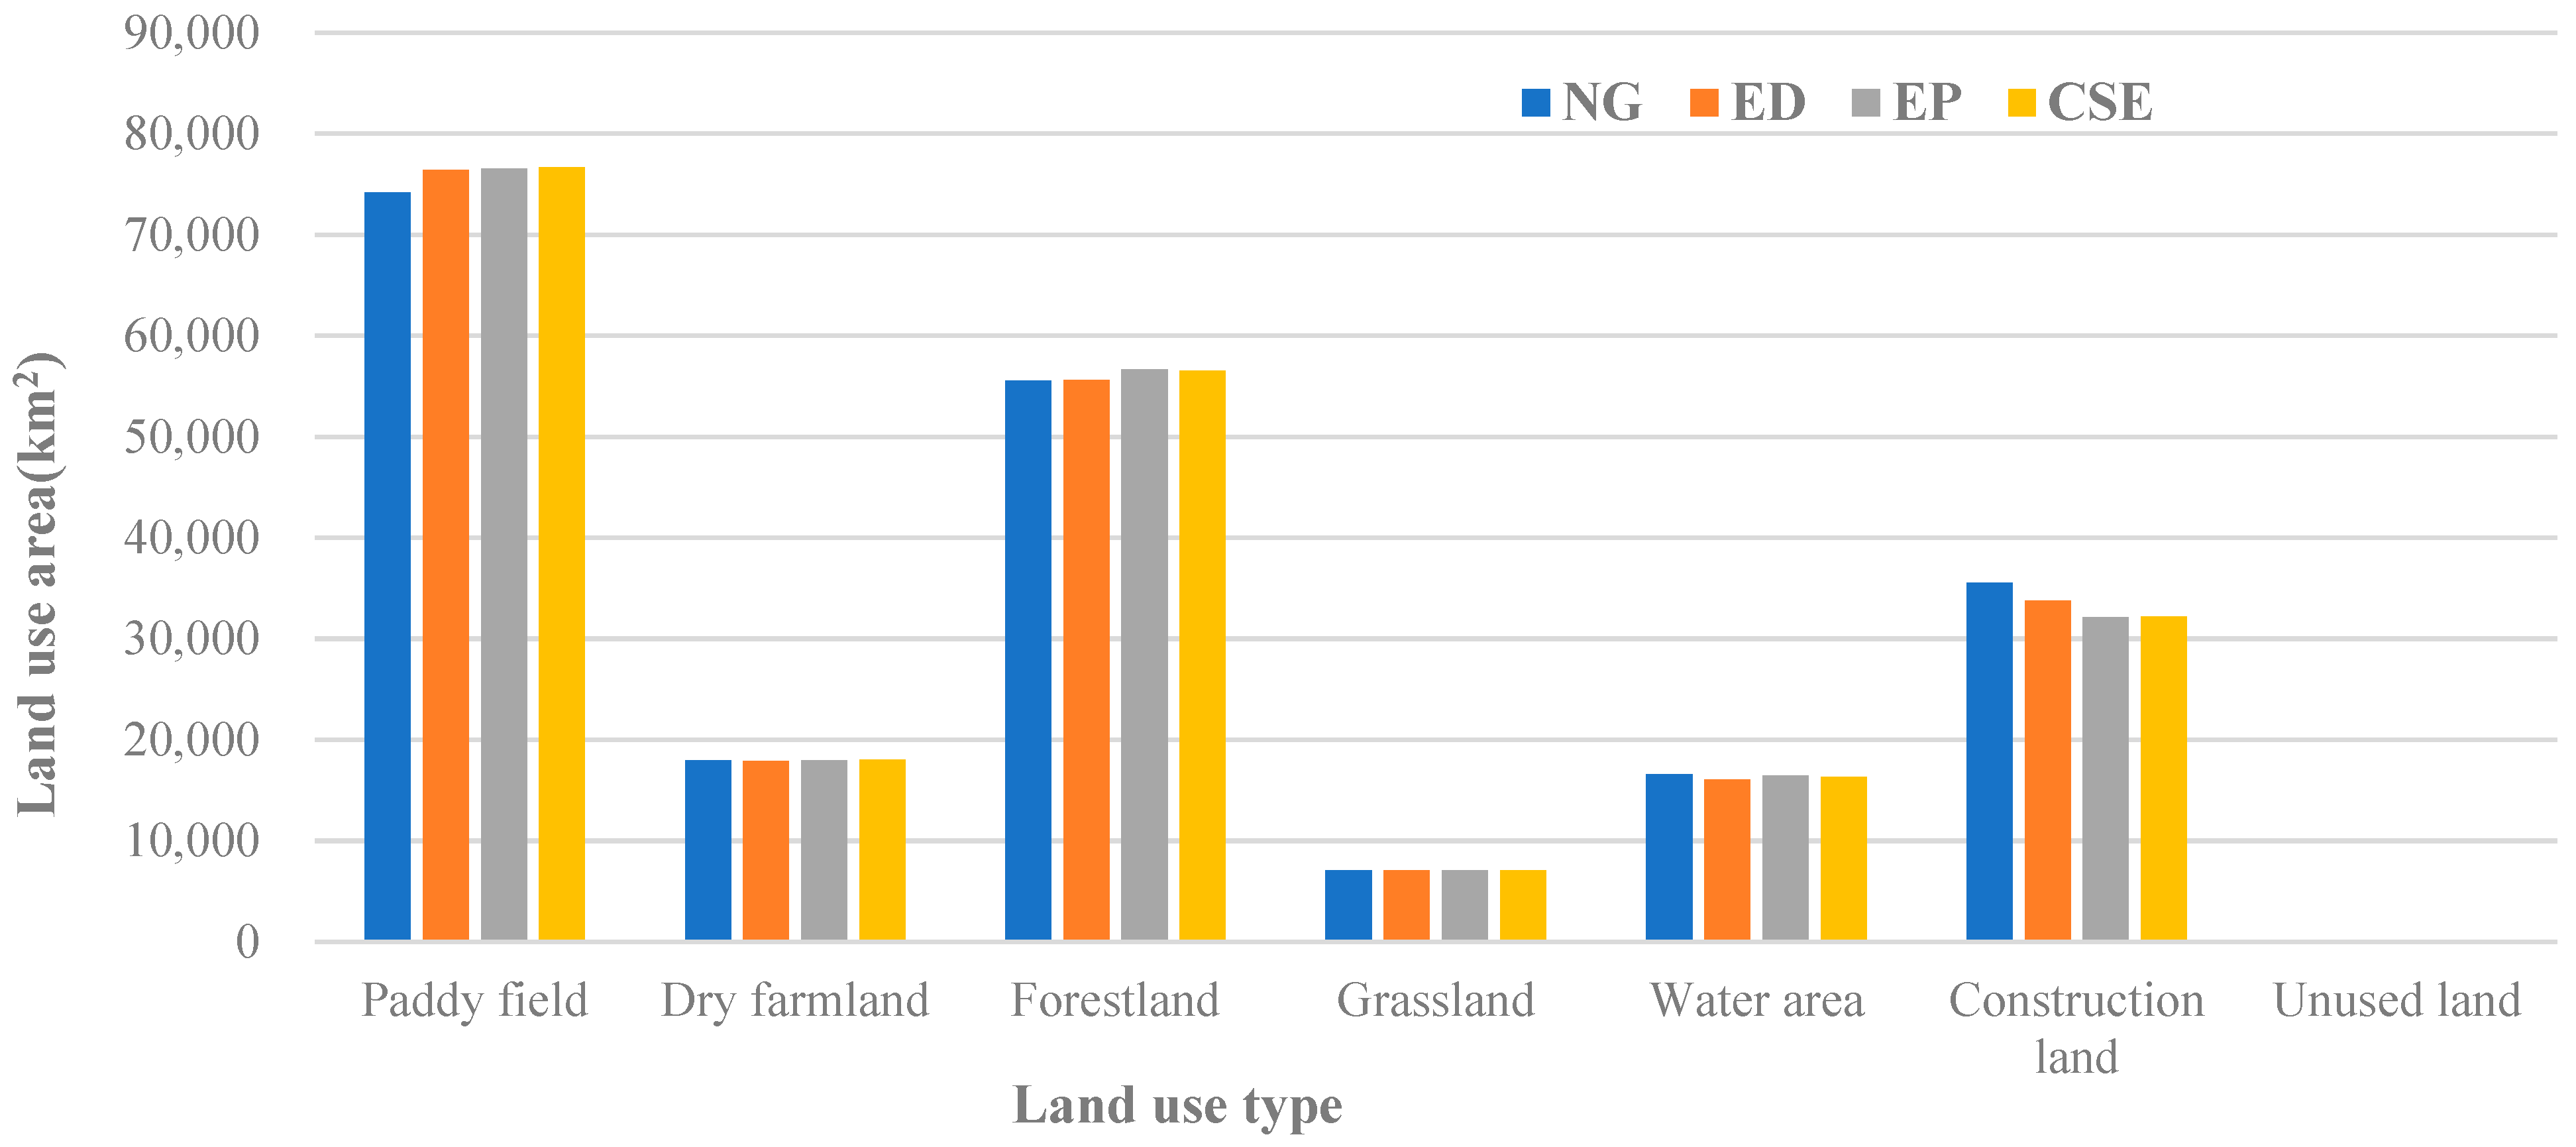
As shown in the 2035 simulation land-use map (Figure 5 and Figure 6), the original urban area that marks the city center and additional urban land is anticipated to expand outward from that point to the surrounding areas. The cities along the Yangtze River will develop rapidly because the cities along the Yangtze River have excellent ports and a strong industrial foundation, while those in the southern part will develop slowly. Of particular note, Shanghai is expected to undergo obvious expansion, which indicates that the city faces rapid and disordered expansion without restrictions. The increase in urban land area by 2035 compared to 2015 under the NG, ED, EP, and CSE development scenarios is expected to be 11,257.37 km2, 9444.58 km2, 7830.06 km2, and 7919.66 km2, respectively. Urban sprawl will most drastically reduce paddy field coverage.
Reflecting the change trend from 2000 to 2015, land-use change is not considered in the NG scenario, and land-use demand is determined exclusively based on natural evolution. The 2015 status chart served as the land-use base period data, while the other model parameters were identical to those of 2000. Under this scenario, the paddy field, dry land, forest land and grassland area will decrease by 2035, but arable land will remain the primary landscape in the Yangtze River Delta region, with paddy fields and dry land accounting for 35.85% and 8.67%, respectively. It suggests that arable land will continue to decrease, but the role of the dominant landscape will not change as the city expands. In addition, the woodland area accounts for 26.86% and is mainly distributed in the southwest mountainous area of the Yangtze River Delta region. Grassland constitutes 3.41%, 0.09 percentage points lower than the 3.5% in 2015. It indicates that small parks in cities can not only delay the loss rate of forestland and grassland but also provide entertainment and leisure services. Urban land expands significantly, accounting for 17.19%—5.45% more than the urban area in 2015. Although the water area shows an increase, the increase rate is very small, accounting for 8% in total.
In the ED scenario, rapid urbanization resulting from the labor force transfer prompted by economic development leads to continuous expansion of urban space and an increasingly dense traffic network. In response, the environmental problems will become increasingly serious. In order to ensure regional economic development of the Yangtze River Delta urban agglomeration under these conditions, the land-use structure should be rationally optimized. Cultivated land, forest land, grassland, and wetland should be steadily decreased, and the land-use efficiency should be improved, enabling a reasonable increase in the urban land area. Compared with the baseline scenario (historical development scenario), the main landscape in the Yangtze River Delta urban agglomeration under this development scenario is still farmland (with the paddy field accounting for 36.95%, dry land 8.65%). However, the paddy field area decrease rate is lower than that of the historical development scenario, which is 2260.67 km2 more than that of the historical development scenario, and the dry land area decreases. The urban land area accounts for 16.31%—1812.79 km2 less than that of the historical development scenario. The possible reason is the Chinese government policies about urban development: strictly controlling the size of large cities, rationally developing medium-sized cities, and actively developing small towns. The wetland area reduces by 490.63 km2 compared with the baseline scenario and accounts for 7.76%. Forest area accounts for 26.89%, a 1229.89 km2 decrease compared with current conditions, but increasing 61.71 km2 compared with the baseline scenario. Grassland accounts for 3.42%, a 14.92 km2 increase compared with the baseline scenario. It is closely related to the policy of returning farmland to forest and grassland. Meanwhile, it should be noted that wetland is vital, and more effort is needed to be paid to protect the wetland. The rest of the unused land remains unchanged.
The Yangtze River Delta urban agglomeration has excellent geographical conditions and natural endowments. Most areas are mainly cultivated land and forest land, and wetlands account for a large proportion of the area. Ecological environment protection is particularly important. In consideration of the above factors, the ecological protection scenario (EP) was set up. In 2015, the area of forestland, grassland, and wetland in the Yangtze River Delta urban agglomeration will cover 38.74% of the total area, and the area of forestland, grassland, and wetland will remain stable in 2035. Under the ecological protection scenario, the arable land area was still the main landscape, accounting for 45.7% of the total area. Compared with the baseline scenario, the paddy field increased by 2394.21 km2, and the dry land increased by 44.26 km2. The area of forest land accounted for 27.39%, which was 1090.51 km2 more than that of baseline scenario. Under the ecological protection scenario, the urban construction land area accounts for 15.53% of land use, which is 3427.3 km2 less than the baseline scenario, and urban expansion is effectively controlled. It reveals that rationally controlling city size can avoid loss of forest land. In this scenario, the wetland area accounted for 3.41%, which was slightly reduced by 110.52 km2 compared with the baseline scenario. The unused land area remains the same.
In the CSE scenario, social and economic development, ecological environment protection, and other factors were examined comprehensively. In this scenario, the arable land area was still the main landscape, accounting for 45.65% of the total area. Compared with the baseline scenario, paddy fields increased by 2294.21 km2, and dry land increased by 34.26 km2. The area of forest land accounted for 27.39%, which was 800.51 km2 more than that of the baseline scenario. Under ecological protection, the urban construction land area accounts for 15.81% of land use, which is 2858.55 km2 less than the baseline scenario, and urban expansion is effectively controlled. In this scenario, grassland area accounted for 3.41%, which increased slightly compared with the baseline scenario. Compared with the baseline scenario, the wetland area decreased slightly, which was 286.00 km2. The unused land area remains the same. The land-use change trend in the CSE scenario is similar to that in the EP scenario, but slightly different in the extent. The probable reason is the difference in ELSA.

3.3. Comparative Analysis of Ecosystem Pattern Changes under Different Scenarios

The patch number (NP), landscape shape index (LSI), Simpson’s diversity index (SIDI), Shannon’s evenness index (SHEI), contagion (CONTAG), and aggregation index (AI) were selected to evaluate land-use landscape patterns comprehensively under different scenarios. Compared with the baseline scenario, the NP, SHDI, and SHEI were significantly higher than those of other scenarios, while the LSI, CONTAG, and AI degree were lower. These results indicate that, in this scenario, there is a high degree of patch fragmentation, heterogeneity, and anthropogenic interference, a low degree of connectivity and aggregation, and a high degree of diversity. In comparison, the integrated scenario showed a low degree of fragmentation and anthropogenic interference, and a high degree of connectivity and aggregation. In the ecological protection scenario, the NP and LSI were higher than those in both the development and comprehensive development scenarios, but mainly resulted from the restoration of the forest and wetland area.
With respect to landscape patterns, the following results characterize all four urban scenarios: (1) The NP showed an increasing trend. The natural growth scenarios depicted the largest increase and the ecological protection scenarios the smallest increase (Table 5). (2) The LSI depicted positive changes, indicating that the landscape shape tended to simplify. (3) The SHDI and SHEI showed an increasing trend. The natural growth scenarios depicted the largest increase. (4) The CONTAG depicted decreasing trends, while AI showed increasing trends. These results indicate that connectivity and equilibrium diminish as the year 2035 is approached. The EP scenario depicted the simplest landscape with the smallest degree of fragmentation, and the largest degree of connectivity and equilibrium.

4. Discussion

From 2000 to 2015, the urban area in the YRDUA increased by 8139.5 km2. This value is higher than that of other places, such as Boswash, the Great Lakes Megalopolis, Californian Megaregion, Northeast Megalopolis, Beijing-Tianjin-Hebei urban agglomeration, and Pearl River Delta urban agglomeration [11,15,35,36,37]. Moreover, the YRDUA exhibited the largest growth rate in China (50.4%) when compared with other urban agglomerations [11,15,35] Urban development tends to occur more rapidly in areas adjacent to ports, as building materials are supplied more efficiently due to the government’s proposed development policy [38,39]. As such, these areas require extra attention.
Under the four simulated urban development scenarios, all the landscape patterns showed further fragmentation as the cities developed, a finding that is consistent with other previous studies [11]. Furthermore, the landscape shape gradually simplified due to human activities. Simulation results confirm that urban land still expands outward concentrically from the original urban center, which is also in good agreement with other land-use model simulation studies [26,40,41,42,43]. Qiao et al. combined a system dynamics model and future land-use simulation model to develop three economic growth scenarios under different growth rates. These scenarios were subsequently used to predict the effect of land-use change on carbon storage in the YRDUA. Under their high-speed economic growth scenario, by the year 2035, the area of urban land is expected to increase by 19,876 km2—a significantly higher value than that observed in the economic development or natural growth scenarios. Urban land-use changes from 2000 to 2015 are not nearly as dramatic, as this period of time exhibited medium- and low-speed economic growth. Thus, the simulation identified key areas that are particularly susceptible to land-use change.
There are still some limitations. Land-use policies and restrictions were still deficient due to data availability, and newest urban planning achievements (i.e., ecological red line, urban development boundary) should be considered in the future. Simulating the land-use change based on zoning might achieve more accurate results for the administrative policies in different provinces. Furthermore, the CLUMondo model allowed simulating land system changes instead of land cover conversions. It might be more beneficial to reveal future urban sprawl and urban intensification as two separate processes.

5. Conclusions

In this study, an integration of the Markov model and the CLUMondo model were applied to simulate and analyze land-use change trends under four urban development scenarios in the YRDUA, China. Results showed that land-use change from 2000 to 2015 was primarily characterized by significant urban sprawl and paddy field coverage loss. Specifically, urban land increased by 3.93%, and the paddy field coverage decreased by 3.54%. The cities along the Yangtze River were developing rapidly, while hill cities in the southern part were increasing slowly. When these trends were used to simulate landscape patterns in 2035, results showed that urban land increased by 11,244.75 km2, 9452.75 km2, 7856.75 km2, and 5532.25 km2 in NG, ED, EP, and CSE, respectively. The paddy field was still the primary landscape, with 35.85% NG, 36.95% ED, 37.01% EP, and 36.96% CSE. The urban expansion will continue in the future along the Yangtze River and inevitably occupy the farmland and wetlands. Controlling the size of megacities and large cities and increasing the green space in cities can decrease the loss of farmland and forestland. Protecting the wetland was also important since its loss is difficult to recover. Furthermore, under all four scenarios, the landscape pattern tended to simplify and fragment, while connectivity and equilibrium diminished. The driving forces that influence urban sprawl in urban agglomerations were insufficient due to data availability, and additional factors should be further explored. Other ecological process associated with land-use change should be considered, such as carbon storage, ecological security, urban heat conditions, etc.

Author Contributions

Y.Z. was responsible for experiments design, methodology selecting, data processing, writing original draft and review & editing, and proofreading. D.S. was responsible for the review and funding acquisition. Y.B., W.Y. and Y.S. provided editorial advice. All authors have read and agreed to the published version of the manuscript.

Funding

This research was supported by the National Key R&D Program of China (grant numbers. 2016YFC0502702).

Institutional Review Board Statement

Not applicable.

Informed Consent Statement

Informed consent was obtained from all subjects involved in the study.

Data Availability Statement

Not applicable.

Conflicts of Interest

The authors declare no conflict of interest.

References

  1. Mooney, H.A.; Duraiappah, A.; Larigauderie, A. Evolution of natural and social science interactions in global change research programs. Proc. Natl. Acad. Sci. USA 2013, 110, 3665–3672. [Google Scholar] [CrossRef] [Green Version]
  2. Shi, S.; Chang, Y.; Wang, G.; Li, Z.; Hu, Y.; Liu, M.; Li, Y.; Li, B.; Zong, M.; Huang, W. Planning for the wetland restoration potential based on the viability of the seed bank and the land -use change trajectory in the Sanjiang Plain of China. Sci. Total Environ. 2020, 733, 1–13. [Google Scholar] [CrossRef]
  3. Pereira, P.; Baro, F. Greening the city: Thriving for biodiversity and sustainability. Sci. Total Environ. 2022, 817, 153032. [Google Scholar] [CrossRef]
  4. Foley, J.A.; DeFries, R.; Asner, G.P.; Barford, C.; Bonan, G.; Carpenter, S.R.; Chapin, F.S.; Coe, M.T.; Daily, G.C.; Gibbs, H.K.; et al. Global consequences of land use. Science 2005, 309, 570–574. [Google Scholar] [CrossRef] [Green Version]
  5. Turner, B.L., II; Lambin, E.F.; Reenberg, A. The emergence of land change science for global environmental change and sustainability. Proc. Natl. Acad. Sci. USA 2007, 104, 20666–20671. [Google Scholar] [CrossRef] [Green Version]
  6. Seto, K.C.; Sanchez-Rodriguez, R.; Fragkias, M. The New Geography of Contemporary Urbanization and the Environment. Annu. Rev. Environ. Resour. 2010, 35, 167–194. [Google Scholar] [CrossRef] [Green Version]
  7. Kulmala, M.; Kokkonen, T.V.; Pekkanen, J.; Paatero, S.; Petaja, T.; Kerminen, V.-M.; Ding, A. Opinion: Gigacity–A source of problems or the new way to sustainable development. Atmos. Chem. Phys. 2021, 21, 8313–8322. [Google Scholar] [CrossRef]
  8. Wei, Y.; Wu, J.; Huang, J.; Liu, X.; Han, D.; An, L.; Yu, H.; Huang, J. Declining Oxygen Level as an Emerging Concern to Global Cities. Environ. Sci. Technol. 2021, 55, 7808–7817. [Google Scholar] [CrossRef]
  9. Yan, J.; Xu, Z.; Li, F.; Li, Y.; Chen, M.; Zhu, X.; Cui, X. Heavy metals in soil, water sediment, and ambient PM2.5 across the Yangtze River economic belt: Integrated environment risk identification and countermeasures. J. Water Clim. Change 2021, 12, 2920–2932. [Google Scholar] [CrossRef]
  10. Tian, G.; Ma, B.; Xu, X.; Liu, X.; Xu, L.; Liu, X.; Xiao, L.; Kong, L. Simulation of urban expansion and encroachment using cellular automata and multi-agent system model-A case study of Tianjin metropolitan region, China. Ecol. Indic. 2016, 70, 439–450. [Google Scholar] [CrossRef]
  11. Zhou, Z.C.; Wang, J. Evolution of landscape dynamics in the Yangtze River Delta from 2000 to 2020. Water Clim. Chang. 2022, 13, 1241–1256. [Google Scholar] [CrossRef]
  12. Li, B.; Hu, Y.; Chang, Y.; Liu, M.; Wang, W.; Bu, R.; Shi, S.; Qi, L. Analysis of the factors affecting the long-term distribution changes of wetlands in the Jing-Jin-Ji region, China. Ecol. Indic. 2021, 124, 107413. [Google Scholar] [CrossRef]
  13. Sturck, J.; Schulp, C.J.E.; Verburg, P.H. Spatio-temporal dynamics of regulating ecosystem services in Europe—The role of past and future land use change. Appl. Geogr. 2015, 63, 121–135. [Google Scholar] [CrossRef]
  14. Qiao, W.; Huang, X. Patterns of Urban Land Expansion and Its Driving Forces in Yangtze River Delta Urban Agglomeration. Econ. Geogr. 2021, 41, 162–173. [Google Scholar]
  15. Yan, Y.; Ju, H.; Zhang, S.; Jiang, W. Spatiotemporal Patterns and Driving Forces of Urban Expansion in Coastal Areas: A Study on Urban Agglomeration in the Pearl River Delta, China. Sustainability 2020, 12, 191. [Google Scholar] [CrossRef] [Green Version]
  16. Jia, Z.; Ma, B.; Zhang, J.; Zeng, W. Simulating Spatial-Temporal Changes of Land-Use Based on Ecological Redline Restrictions and Landscape Driving Factors: A Case Study in Beijing. Sustainability 2018, 10, 1299. [Google Scholar] [CrossRef] [Green Version]
  17. Liu, X.; Liang, X.; Li, X.; Xu, X.; Ou, J.; Chen, Y.; Li, S.; Wang, S.; Pei, F. A future land use simulation model (FLUS) for simulating multiple land use scenarios by coupling human and natural effects. Landsc. Urban Plan. 2017, 168, 94–116. [Google Scholar] [CrossRef]
  18. Liu, M.; Hu, Y.M.; Chang, Y.; He, X.Y.; Zhang, W. Land Use and Land Cover Change Analysis and Prediction in the Upper Reaches of the Minjiang River, China. Environ. Manag. 2009, 43, 899–907. [Google Scholar] [CrossRef]
  19. Verburg, P.H.; Soepboer, W.; Veldkamp, A.; Limpiada, R.; Espaldon, V.; Mastura, S.S.A. Modeling the spatial dynamics of regional land use: The CLUE-S model. Environ. Manag. 2002, 30, 391–405. [Google Scholar] [CrossRef]
  20. Fan, X.; Ma, Z.; Yang, Q.; Han, Y.; Mahmood, R. Land use/land cover changes and regional climate over the Loess Plateau during 2001–2009. Part II: Interrelationship from observations. Clim. Chang. 2015, 129, 441–455. [Google Scholar] [CrossRef] [Green Version]
  21. Xu, X.; Du, Z.; Zhang, H. Integrating the system dynamic and cellular automata models to predict land use and land cover change. Int. J. Appl. Earth Obs. Geoinf. 2016, 52, 568–579. [Google Scholar] [CrossRef]
  22. Van Asselen, S.; Verburg, P.H. Land cover change or land-use intensification: Simulating land system change with a global-scale land change model. Glob. Chang. Biol. 2013, 19, 3648–3667. [Google Scholar] [CrossRef]
  23. Liu, Z.F.; Verburg, P.H.; Wu, J.G.; He, C.Y. Understanding Land System Change Through Scenario-Based Simulations: A Case Study from the Drylands in Northern China. Environ. Manag. 2017, 59, 440–454. [Google Scholar] [CrossRef]
  24. Domingo, D.; Palka, G.; Hersperger, A.M. Effect of zoning plans on urban land-use change: A multi-scenario simulation for supporting sustainable urban growth. Sustain. Cities Soc. 2021, 69, 102833. [Google Scholar] [CrossRef]
  25. Wang, Y.; van Vliet, J.; Debonne, N.; Pu, L.; Verburg, P.H. Settlement changes after peak population: Land system projections for China until 2050. Landsc. Urban Plan. 2021, 209, 104045. [Google Scholar] [CrossRef]
  26. Wang, X.; Che, L.; Zhou, L.; Xu, J. Spatio-temporal Dynamic Simulation of Land use and Ecological Risk in the Yangtze River Delta Urban Agglomeration, China. Chin. Geogr. Sci. 2021, 31, 829–847. [Google Scholar] [CrossRef]
  27. Chen, Z.; Huang, M.; Zhu, D.; Altan, O. Integrating Remote Sensing and a Markov-FLUS Model to Simulate Future Land Use Changes in Hokkaido, Japan. Remote Sens. 2021, 13, 2621. [Google Scholar] [CrossRef]
  28. Tian, G.; Jiang, J.; Yang, Z.; Zhang, Y. The urban growth, size distribution and spatio-temporal dynamic pattern of the Yangtze River Delta megalopolitan region, China. Ecol. Model. 2011, 222, 865–878. [Google Scholar] [CrossRef]
  29. Yu, M.; Yang, Y.; Chen, F.; Zhu, F.; Qu, J.; Zhang, S. Response of agricultural multifunctionality to farmland loss under rapidly urbanizing processes in Yangtze River Delta, China. Sci. Total Environ. 2019, 666, 1–11. [Google Scholar] [CrossRef]
  30. Cao, M.; Tang Ga Shen, Q.; Wang, Y. A new discovery of transition rules for cellular automata by using cuckoo search algorithm. Int. J. Geogr. Inf. Sci. 2015, 29, 806–824. [Google Scholar] [CrossRef]
  31. Bai, X.; Shi, P.; Liu, Y. Realizing China’s urban dream. Nature 2014, 509, 158–160. [Google Scholar] [CrossRef] [PubMed]
  32. Turner, M.G. Spatial and Temporal Analysis of Landscape Patterns. Landsc. Ecol. 1990, 4, 21–30. [Google Scholar] [CrossRef]
  33. Li, Z.; Liu, M.; Hu, Y.; Xue, Z.; Sui, J. The spatiotemporal changes of marshland and the driving forces in the Sanjiang Plain, Northeast China from 1980 to 2016. Ecol. Process. 2020, 9. [Google Scholar] [CrossRef]
  34. Li, X.Z.; He, H.S.; Bu, R.C.; Wen, Q.C.; Chang, Y.; Hu, Y.M.; Li, Y.H. The adequacy of different landscape metrics for various landscape patterns. Pattern Recognit. 2005, 38, 2626–2638. [Google Scholar] [CrossRef]
  35. He, Q.; Zeng, C.; Xie, P.; Tan, S.; Wu, J. Comparison of urban growth patterns and changes between three urban agglomerations in China and three metropolises in the USA from 1995 to 2015. Sustain. Cities Soc. 2019, 50, 101649. [Google Scholar] [CrossRef]
  36. Yu, Z.; Chen, L.; Li, L.; Zhang, T.; Yuan, L.; Liu, R.; Wang, Z.; Zang, J.; Shi, S. Spatiotemporal Characterization of the Urban Expansion Patterns in the Yangtze River Delta Region. Remote Sens. 2021, 13, 4484. [Google Scholar] [CrossRef]
  37. Shen, Z.; Xu, X.; Xu, S.; Sun, D. A comparative study of land development patterns and regional thermal environments (RTEs) in typical urban agglomerations of China and America: A case study of Beijing-Tianjin-Hebei (BTH) and Boswash. Sci. Total Environ. 2022, 803, 149735. [Google Scholar] [CrossRef]
  38. Sun, N.; Zhu, W.; Cheng, Q. GF-1 and Landsat observed a 40-year wetland spatiotemporal variation and its coupled environmental factors in Yangtze River estuary. Estuar. Coast. Shelf Sci. 2018, 207, 30–39. [Google Scholar] [CrossRef]
  39. Wu, M.; Li, C.; Du, J.; He, P.; Zhong, S.; Wu, P.; Lu, H.; Fang, S. Quantifying the dynamics and driving forces of the coastal wetland landscape of the Yangtze River Estuary since the 1960s. Reg. Stud. Mar. Sci. 2019, 32, 100854. [Google Scholar] [CrossRef]
  40. Feng, Y.; Liu, Y.; Tong, X. Comparison of metaheuristic cellular automata models: A case study of dynamic land use simulation in the Yangtze River Delta. Comput. Environ. Urban Syst. 2018, 70, 138–150. [Google Scholar] [CrossRef]
  41. Lin, G.; Jiang, D.; Fu, J.; Cao, C.; Zhang, D. Spatial Conflict of Production-Living-Ecological Space and Sustainable-Development Scenario Simulation in Yangtze River Delta Agglomerations. Sustainability 2020, 12, 2175. [Google Scholar] [CrossRef]
  42. Zhang, S.; Shao, H.; Li, X.; Xian, W.; Shao, Q.; Yin, Z.; Lai, F.; Qi, J. Spatiotemporal Dynamics of Ecological Security Pattern of Urban Agglomerations in Yangtze River Delta Based on LUCC Simulation. Remote Sens. 2022, 14, 296. [Google Scholar] [CrossRef]
  43. Qiao, W.; Guan, W.; Huang, X. Assessing the Potential Impact of Land Use on Carbon Storage Driven by Economic Growth: A Case Study in Yangtze River Delta Urban Agglomeration. Int. J. Environ. Res. Public Health 2021, 18, 11924. [Google Scholar] [CrossRef] [PubMed]
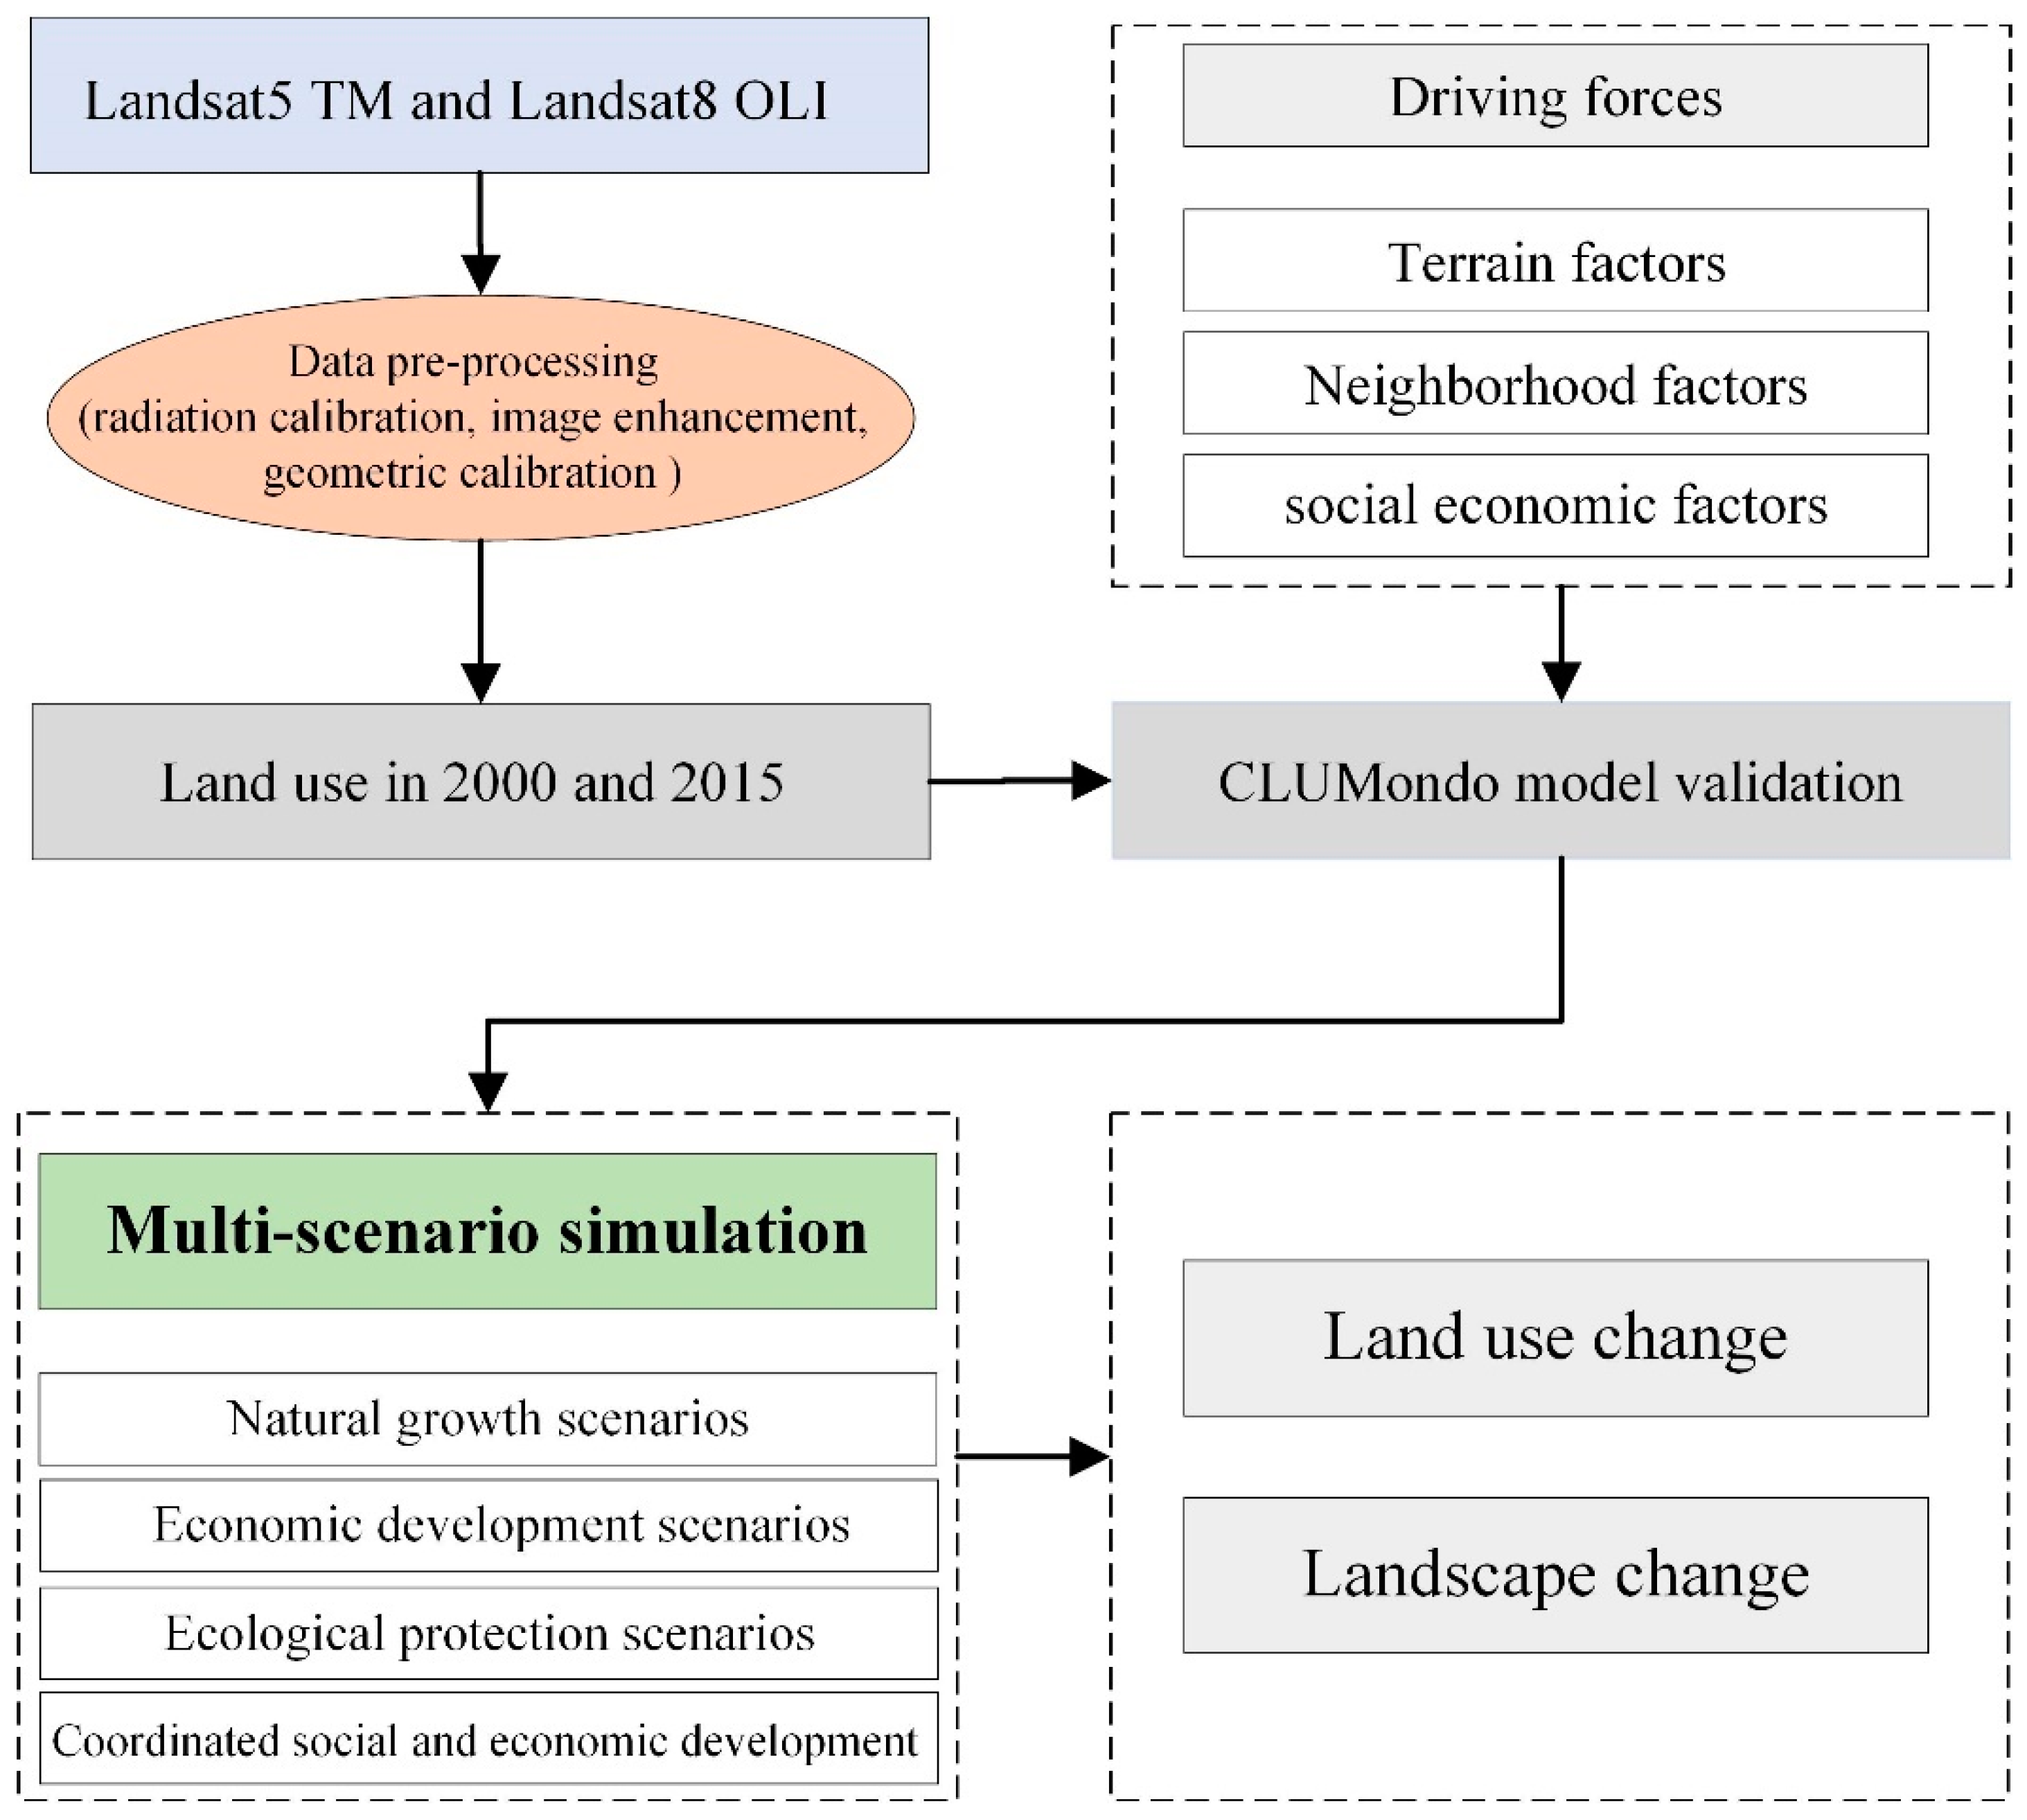
Figure 1. Workflow.
Figure 1. Workflow.
Sustainability 14 15336 g001
Figure 2. Geographic Location of the Yangtze River Delta, China.
Sustainability 14 15336 g002
Figure 3. Land-use pattern of the study area from 2000 to 2015.
Sustainability 14 15336 g003
Figure 4. Results of model validation in YRDUA.
Sustainability 14 15336 g004
Figure 5. Simulated land-use area under different scenarios in the YRDUA, 2035.
Sustainability 14 15336 g005
Figure 6. Simulated land-use map under different scenarios in the YRDUA, 2035.
Sustainability 14 15336 g006
Table 1. Explanatory variables used to build the CLUMondo model.
ExplanatoryData Source
Euclidean distance to the:
Urban area
Map of land use
VillageMap of land use
Main roadMap of road networks
RailwayMap of road networks
Express railwayMap of road networks
RiverMap of land use
AirportBaidu Map
PortBaidu Map
DEMRESDC
SlopeRESDC
Gross domestic productRESDC
Population densityRESDC
Table 2. Landscape metrics.
Indices/UnitsDescription
NP (None)Number of patches.
LSI (None)The deviation between the patch and same area of the circle.
SIDI (None)Reflects the heterogeneity of the landscape.
SHEI (None)Reflects the maximum possible diversity of the landscape under a certain landscape abundance.
CONTAG (%)Reflects the connectivity; the larger the value, the stronger the integrity.
AI (%)Reflects the degree of aggregation; a large AI value implies a landscape composed of large patches or a high degree of connection between patches.
Table 3. Comparison of land-use type coverage from 2000 to 2015.
2000 2015
Area (km2)Proportion (%)Area (km2)Proportion (%)
Paddy field90,616.543.8183,300.740.27
Dry farmland19,829.69.5919,079.59.22
Forestland57,382.827.7456,849.727.49
Grassland7239.83.507241.43.50
Water area15,584.87.5316,026.57.75
Construction land16,149.07.8124,288.511.74
Unused land33.10.0249.30.02
Table 4. Transfer matrix of land-use types from 2000 to 2015 in the YRDUA (km2).
2015Paddy FieldDry FarmlandForestlandGrasslandWater AreaConstruction LandUnused Land
2000
Paddy field82,171.53 84.96 368.04 28.57 194.17 335.71 0.12
Dry farmland104.76 18,650.50 104.93 45.18 66.43 80.44 0.06
Forestland375.22 84.76 56,148.45 115.54 22.93 19.91 1.11
Grassland47.62 10.02 153.42 6938.61 73.47 7.42 0.07
Water area818.99 60.55 43.48 40.50 15,004.80 33.98 0.67
Construction land6978.73 911.78 453.37 55.80 199.78 15,652.09 2.09
Unused land10.63 1.13 4.89 1.99 1.07 0.57 28.88
Table 5. Landscape change under different scenarios in the YRDUA, 2035.
NPLSISIDISHEICONTAGAI
201553,392135.730.7300.77337.1970.50
NG54,450130.480.7550.79936.1271.67
ED53,557129.280.7500.79436.5771.94
EP53,478128.800.7490.79336.6472.04
CSE53,893129.370.7480.79236.6171.92
Publisher’s Note: MDPI stays neutral with regard to jurisdictional claims in published maps and institutional affiliations.