Article

Maintenance and Optimization of Ecological Space in Natural Resource-Advantaged Cities: A Case Study in Zhangzhou, Fujian Province

1
Faculty of Architecture, Tan Kah Kee College, Xiamen University, Zhangzhou 363105, China
2
College of Civil Engineering and Architecture, Zhejiang University, Hangzhou 310058, China
*
Author to whom correspondence should be addressed.
Sustainability 2022, 14(19), 11952; https://doi.org/10.3390/su141911952
Submission received: 22 July 2022 / Revised: 28 August 2022 / Accepted: 18 September 2022 / Published: 22 September 2022
(This article belongs to the Special Issue Urban Ecological Security and Sustainability)

Abstract

:
Natural resources are the material basis of urban construction, as well as a crucial factor that determines the livability and employment opportunities of a given city. Under the traditional development model, cities rely on their natural resources to develop their regional economy. However, this is always accompanied by environmental impacts. Maintaining and optimizing the ecological environment of such cities during economic development is not only related to the sustainable development and transformation of resource-based cities, but also affects the overall status of sustainable urbanization and construction. This study takes Zhangzhou City, Fujian Province, as a typical case to analyze the characteristics and status of urban ecological space. We explored a positioning and optimization strategy based on the proper management of urban ecological space systems in the future. The morphological spatial pattern analysis method (MSPA) and the minimum cumulative resistance (MCR) model were used to identify the urban ecological sources and extract the potential ecological corridors between the ecological sources. Ecological corridors were constructed by quantitatively analyzing their importance with a gravity model. Our findings indicated that the ecological area and the construction land area in Zhangzhou present a significant opposition. We identified 18 important core areas and 21 important corridors, which are concentrated in the west and north of Zhangzhou. Based on these findings, our suggestion is to maintain the status quo of urban ecology, set up ecological rest spaces around important roads, and increase the number of green facilities in the city.

1. Introduction

In recent years, rapid urbanization has caused inefficient utilization and a shortage of natural resources. This process has also caused environmental pollution and ecological imbalance, and seriously threatens the livability of the city and the sustainability of economic and social development [1]. The government clearly established in the work report of the 14th Five-Year Plan: “Urban construction should adhere to the concept that green rivers and green mountains are gold and silver mountains, should strengthen the management of mountains, rivers, forests, fields, lakes, and grass systems, and accelerate the green transformation of urban development”. (The outline of the 14th Five-Year Plan for National Economic and Social Development of the People’s Republic of China and the Long-term Goals for 2035). Cities dominated by natural resource endowment have many potential problems in the long-term development of local ecosystems, such as over-exploitation and utilization of land and massive occupation of ecological environment patches [2]. Under the new trend of high-quality urban development and high-level protection of the ecological environment, it is of great significance to repair and build a stable and healthy municipal ecological network and improve the level of the urban ecological system and ecological service functions [3].
An ecological spatial network is a spatial organization system that can identify linear ecological corridor characteristics, effectively connect various ecological patches, and reflect the combination order of spatial elements and structural and functional characteristics in a specific space [4,5]. With the steady economic development of cities, environmental problems such as cultivated land destruction, forest and grassland destruction, and wetland degradation will also occur. In turn, this affects the balance of the regional ecosystem, making it difficult to recover, and important natural resources in the ecological network will gradually degrade or disappear [6,7]. Maintaining regional ecological security and enhancing the service value of natural ecosystems by constructing ecological networks has become a widespread approach [8,9].
In terms of research objects, early scholars focused on biodiversity and ecological protection of national parks [10,11], natural heritage sites [12,13] and nature reserves [14], in the study of ecological network construction. In recent years, Chinese scholars had combined the development of provinces and municipalities with the construction of ecological networks, such as Guangzhou [15], Guiyang [16] and Etuoke Banner [17]. They found natural resource-based cities have more serious damage to the ecological environment [18]. Among them, Guo, S.S. analyzed the relationship between urbanization and resource environment [19]. Li, J. focused on economic growth and resource environment [20]. Yu J. et al. [21] took the construction of ecological security patterns in landscape resource-based cities. Similarly, Li H.K. et al. [22] studied the ecological security patterns in mining resource-based cities. Economic development of the cities with natural resource endowments has to face the contradiction between resource exploitation and environmental protection [23,24]. The existing research objects are mostly concentrated in cities with high urbanization and large-scale, or the research content is mostly limited to the static impact of a single natural resource on the ecological network. Meanwhile, China’s territorial space planning and management increasingly emphasize the importance of ecological space, maintaining the sustainable development of urban ecological space has become an urgent need for policy implementation [25,26]. We should realize that with the strategic transformation of urban economic development, how to repair and optimize the urban ecological pattern has become an important topic, especially for medium-sized cities with a low urbanization rate.
At present, the basic framework of regional ecological network construction has been formed, which includes pattern element planning and design, source identification, resistance surface setting and correction, corridor extraction, pattern optimization and effectiveness evaluation, application of research results [27,28], and the continuation of changing to quantitative data sources. Morphological spatial pattern analysis (MSPA) combined with raster operation in pixel level scale recognition, as well as other ecological sources [29,30]. The Minimum Cumulative resistance (MCR) model generates the best path by the weight of the resistance surface, which is used to extract the potential ecological corridor [31,32]. A gravity model has been widely used in the optimization of urban spatial structure, and later also in the study of the interaction structure between urban economy and regional environment [33,34].
Therefore, this study selected Zhangzhou City as a typical case of a natural endowment city to analyze the characteristics and status quo of urban ecological space. Based on the appropriate management of urban ecological space systems in the future, we explored the role of a positioning and optimization strategy. Based on morphological spatial pattern analysis (MSPA) and a minimum cumulative resistance (MCR) model, the urban ecological source areas were identified, and the potential ecological corridors were extracted. Combined with a gravity model, the importance of these corridors was quantitatively analyzed, and the ecological corridor was constructed based on these results. Finally, we summarized the optimization direction of urban space partition, linear space, and node space corresponding to different blocks, corridors, and strategic points in ecological space hierarchy, and explore potential strategies for ecological civilization construction of natural endowment cities. It is expected to provide effective support for Zhangzhou’s territorial space planning, ecological space construction and ecological protection red line management and control, and also provide a scientific basis for future urban overall planning, and national forest construction planning in Zhangzhou. The study method could be a reference for similar regional ecological space network research.

2. Research Object and Methods

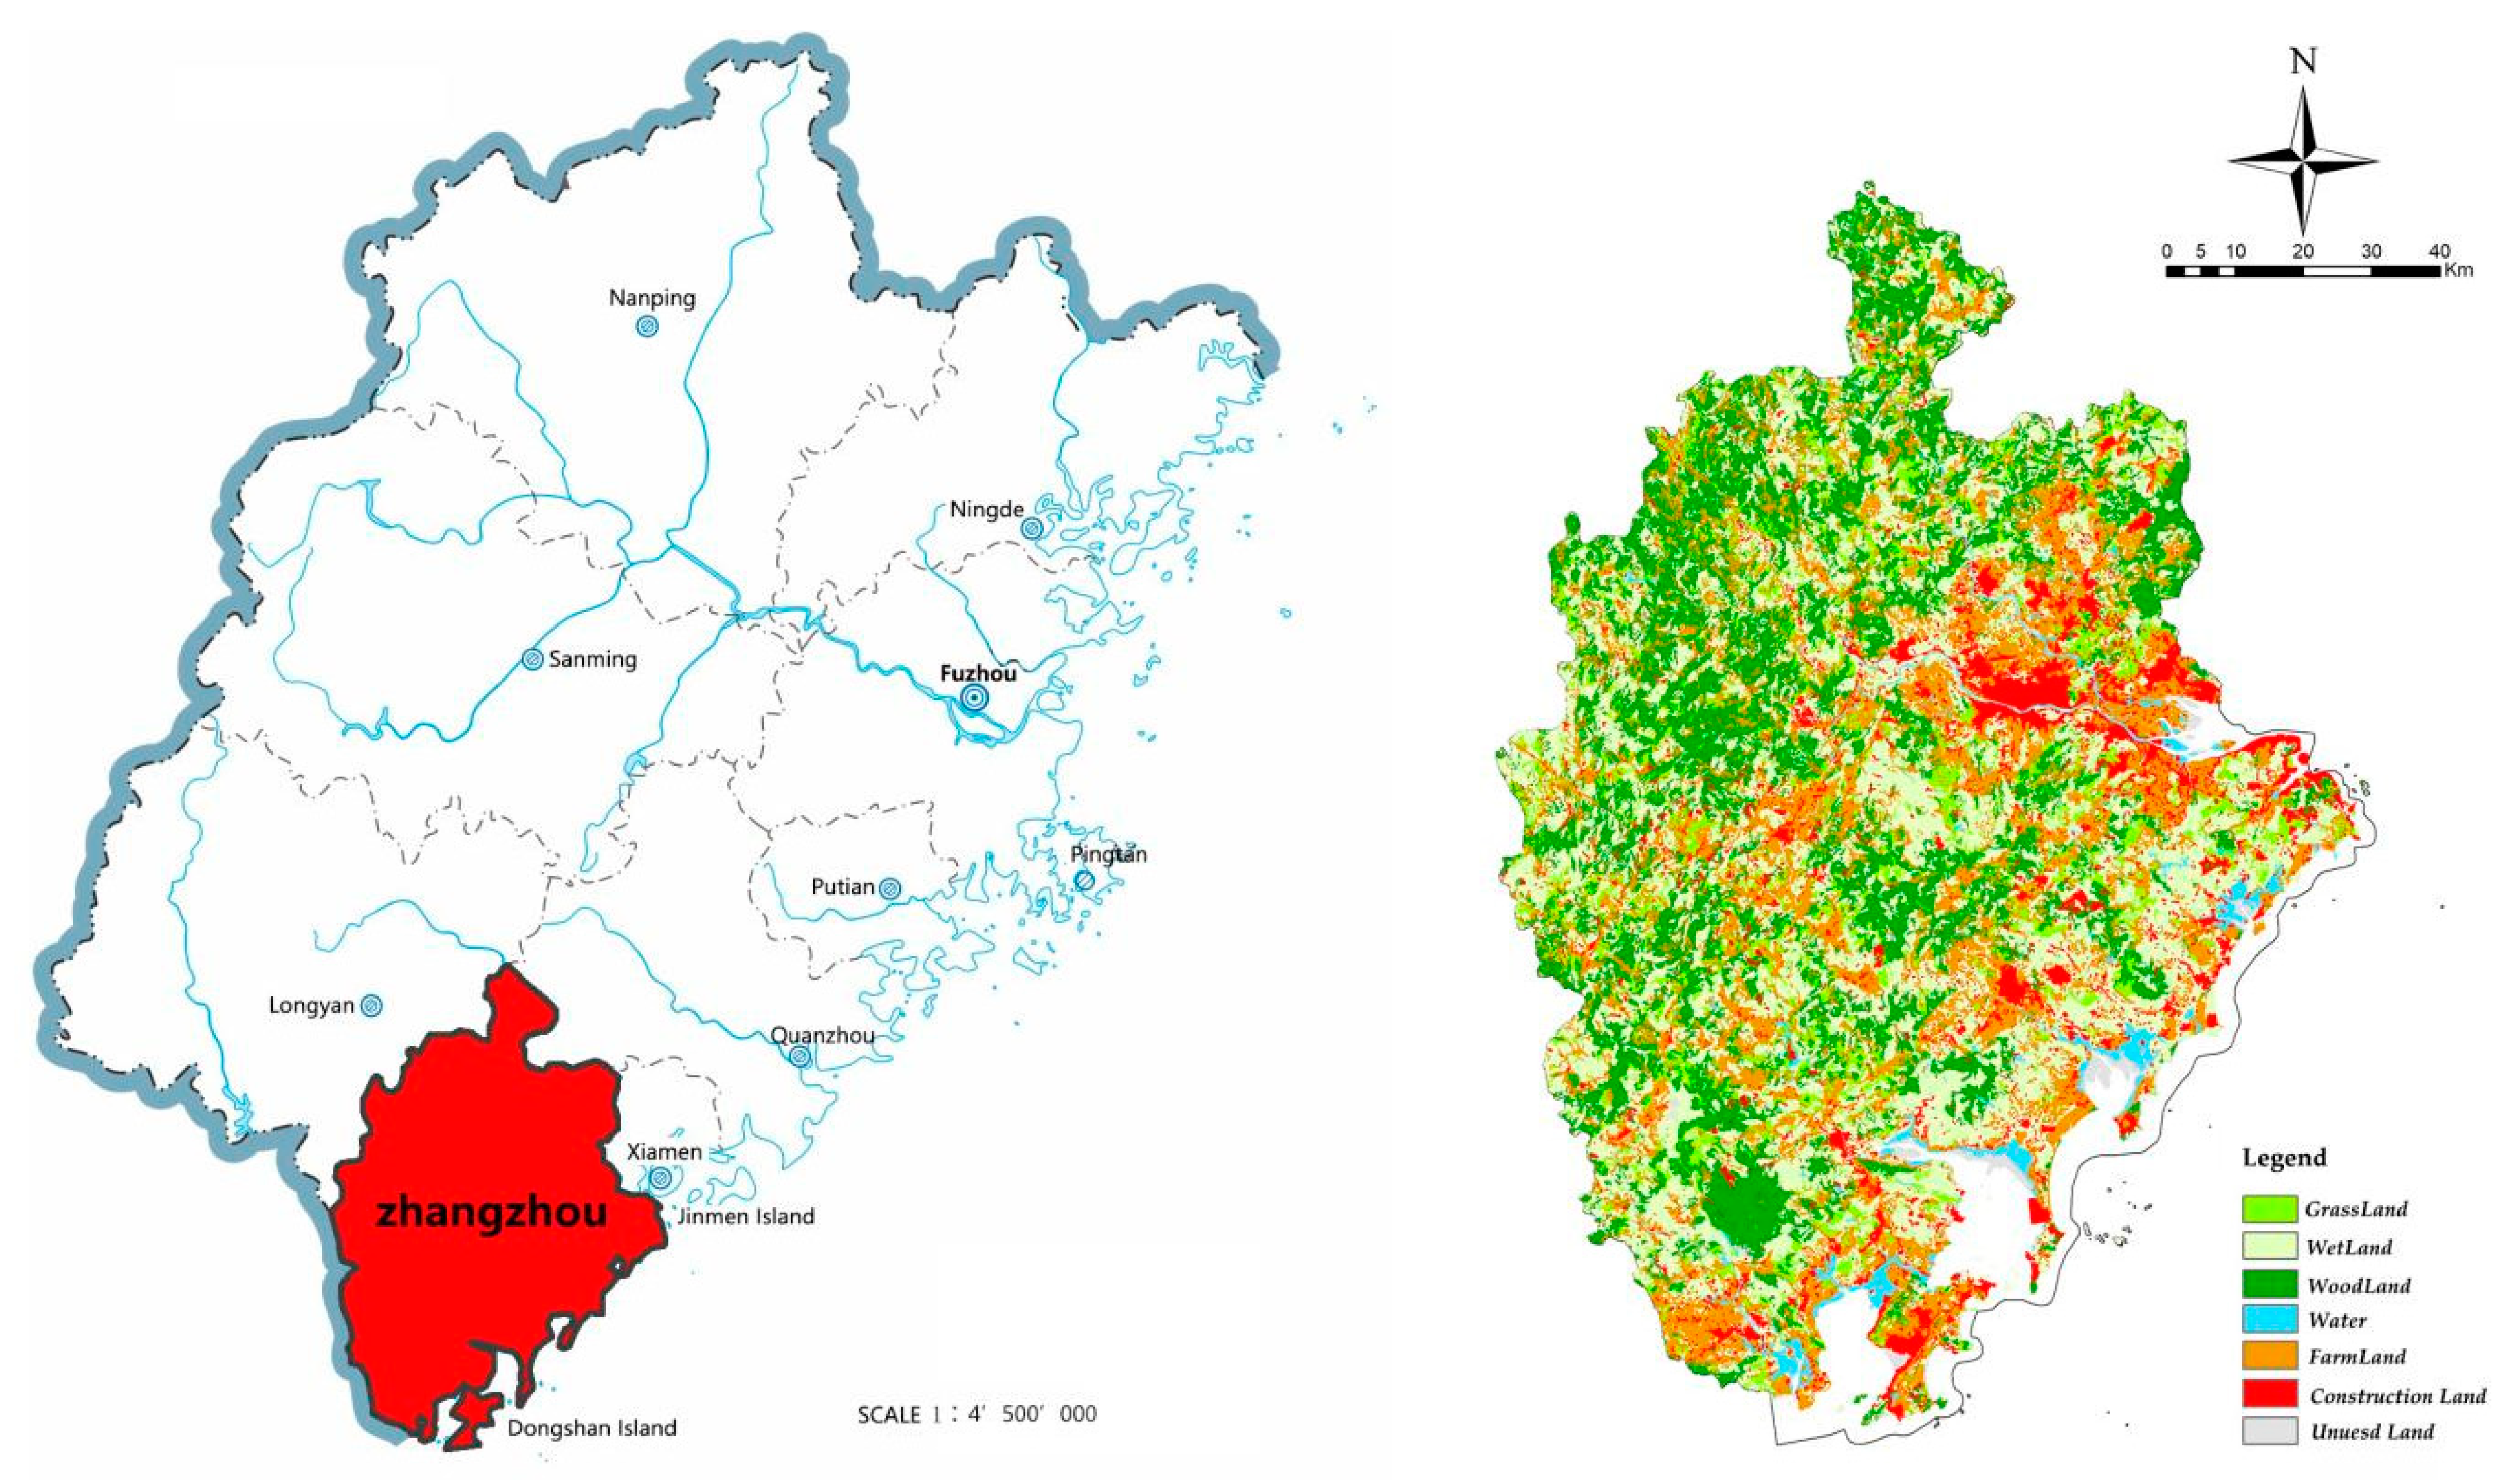
2.1. Overview of the Research Area

Zhangzhou City, located in the southernmost part of Fujian Province, is adjacent to the Xiamen Special Economic Zone in the east, Zhangping and Yongding counties in the north, the cities of Meizhou and Chaozhou in Guangdong Province in the west, and Taiwan Province in the southeast across the sea. This region is not only an important area of the Golden Triangle economic development zone in southern Fujian but also a famous “land of fish and rice”. In Figure 1, according to the forest resources file data in 2020, the forest area of Zhangzhou reached 12.84 million acres, accounting for approximately 68% of the city’s land area, and the forest coverage rate is 64.78%, making this the city with the highest forest coverage rate in the coastal areas of southern Fujian Province [35,36,37]. From the perspective of natural resource endowment, its landform is dominated by hills, plains, and mountains, with the largest plain in the province (Zhangzhou plain) and the second-largest river (Jiulong River), as well as a vast sea area and long continental and island coastline. The humid south Asian tropical monsoon climate brings abundant rainfall to Zhangzhou throughout the year, providing the city with abundant water resources year-round. Therefore, natural light, heat, and water resources are the most abundant heat resources in the province. Generally speaking, Zhangzhou has better geographical and climatic resources than the same latitude areas, and it is a representative city with abundant natural resources in Fujian province and even the whole country. However, as the fourth largest GDP city in Fujian Province, Zhangzhou’s economic development has been stagnant [38]. Good natural resources provide economic power but also development resistance. We pose the question: how should we balance the contradiction between the natural environment and urban construction? Under the premise of sustainable economic development, continuing to maintain its ecological network pattern has become an urgent issue for government managers to explore.

2.2. Data Sources

The main data selected in this research are as follows: (1) digital elevation model (DEM) data in the research area were obtained from the geospatial data cloud website (http://www.gscloud.cn/, accessed on 1 April 2022 with a resolution of 30 m × 30 m). (2) The classification data of land use in 2020 were obtained from the RESDC website (http://www.resdc.cn, accessed on 1 April 2022). According to the characteristics of land use in Zhangzhou City, the maximum likelihood method was used to classify the land types. The land types were divided into seven types: forestland, cultivated land, grassland, water area, wetland, construction land, and unused land in Figure 1. (3) Night light data of Zhangzhou City in December 2020 were obtained from the National Oceanic and Atmospheric Administration (NOAA) website (https://ngdc.noaa.gov/eog/viirs/download_ut_mos.html, accessed on 1 April 2022). (4) A survey of Zhangzhou’s Natural protected areas was obtained from the internal data of the Zhangzhou Forestry Bureau.

2.3. Research Method

2.3.1. Ecological Source Identification Based on the MSPA Method

Four landscape types (woodland, grassland, water, and wetland) were extracted as the foreground, whereas farmland and construction land were taken as the background. The Guidos Toolbox analysis software was used to carry out a series of mathematical operations, such as expansion reconstruction, skeleton extraction, open operation, and closed operation, on the raster data of these six types of land, to divide the pattern image into seven meaningful indicator types [39]. Considering that the ecological environment of Zhangzhou is relatively good, this research selects patches with an area of more than 30 km2 in the core area as ecological sources in this study.

2.3.2. Identification of Important Ecological Source Areas and Evaluation of Landscape Connectivity

Landscape connectivity is a quantitative index of species migration ability between ecological sources, and also determines the stability of ecosystems and biodiversity [38]. Currently, MSPA analysis commonly uses three indicators, namely the overall connectivity index (IIC), possible connectivity index (PC), and patch importance (dI), to evaluate the overall structural characteristics of the landscape and identify the relative contribution of each patch and corridor to ecological connectivity. The calculation formula is as follows [40]:
(1)
Overall connectivity index (IIC) and possible connectivity index (PC):
I I C = i = 1 n j = 1 n a i × a j 1 + n l i j A L 2
P C = i = 1 n j = 1 n P i j × a i × a j A L 2
where N represents the total number of patches, ai and aj represent the area of patches i and j, respectively, nlij represents the number of connections between patches i and j, AL represents the area of the whole landscape, and P*ij represents the maximum probability of connections between patches i and j. When 0 ≤ IIC ≤ 1, IIC = 0, there is no connection between habitat patches. In contrast, when IIC = 1, the whole landscape is comprised of habitat patches.
(2)
Patch importance (dI):
d I % = 100 I I r e m o v e I
where I is the connectivity index value of a certain landscape. In this study, it refers to the overall connectivity index (IIC). Iremove is the overall index value of the remaining patches after removing a single patch or corridor.

2.3.3. Construction of Ecological Resistance Surface

Different landscape types affect the ability of organisms to migrate; some blocking, some promoting. They are also being affected by human activities and other factors. In this paper, based on existing studies, different landscapes were assigned basic resistance values (Table 1), and nighttime light data were used to modify the basic resistance surface. The calculation method is as follows:
R = T L I i T L I a × R i
where R′ is the modified resistance value of patch i, TLIi is the noctilucent light value of patch i of land use type a, TLIa is the average nighttime light tube data of land use type a, and Ri is the basic resistance value of patch i.

2.3.4. Potential Ecological Corridor Construction Based on the MCR Model

The MCR model can determine the minimum consumption path between source and target, which is the best path for migration and diffusion of biological species and can effectively avoid various external disturbances [41,42]. The basic formula of the minimum cumulative resistance model is as follows:
M C R = f min j = n i = m ( D i j × R i )
where f is the positive correlation function between the minimum resistance at any point in space and the distance to all other points and the characteristics of the base plane. Dij is the spatial distance of species from point J to a certain point through landscape base plane I; Ri is the resistance value of landscape i.

2.3.5. Extraction of Important Ecological Corridors Based on the Gravity Model

The interaction matrix between ecological sources is generated based on the gravity model, from which the interaction between ecological sources is analyzed and the interaction intensity is graded. The gravity model formula is as follows [43]:
G ab = L max 2 × I n S a × I n S b L a b 2 × P a × P b
where Gab is the interaction force between patches a and b, Sa and Sb are the areas of patches a and b, Pa and Pb are the average resistance value of patches a and b, Lab is the cumulative resistance value of corridors between patches a and b, and Lmax is the maximum cumulative resistance value of all corridors.

3. Results and Analysis

3.1. Identification and Analysis of Ecological Source Area

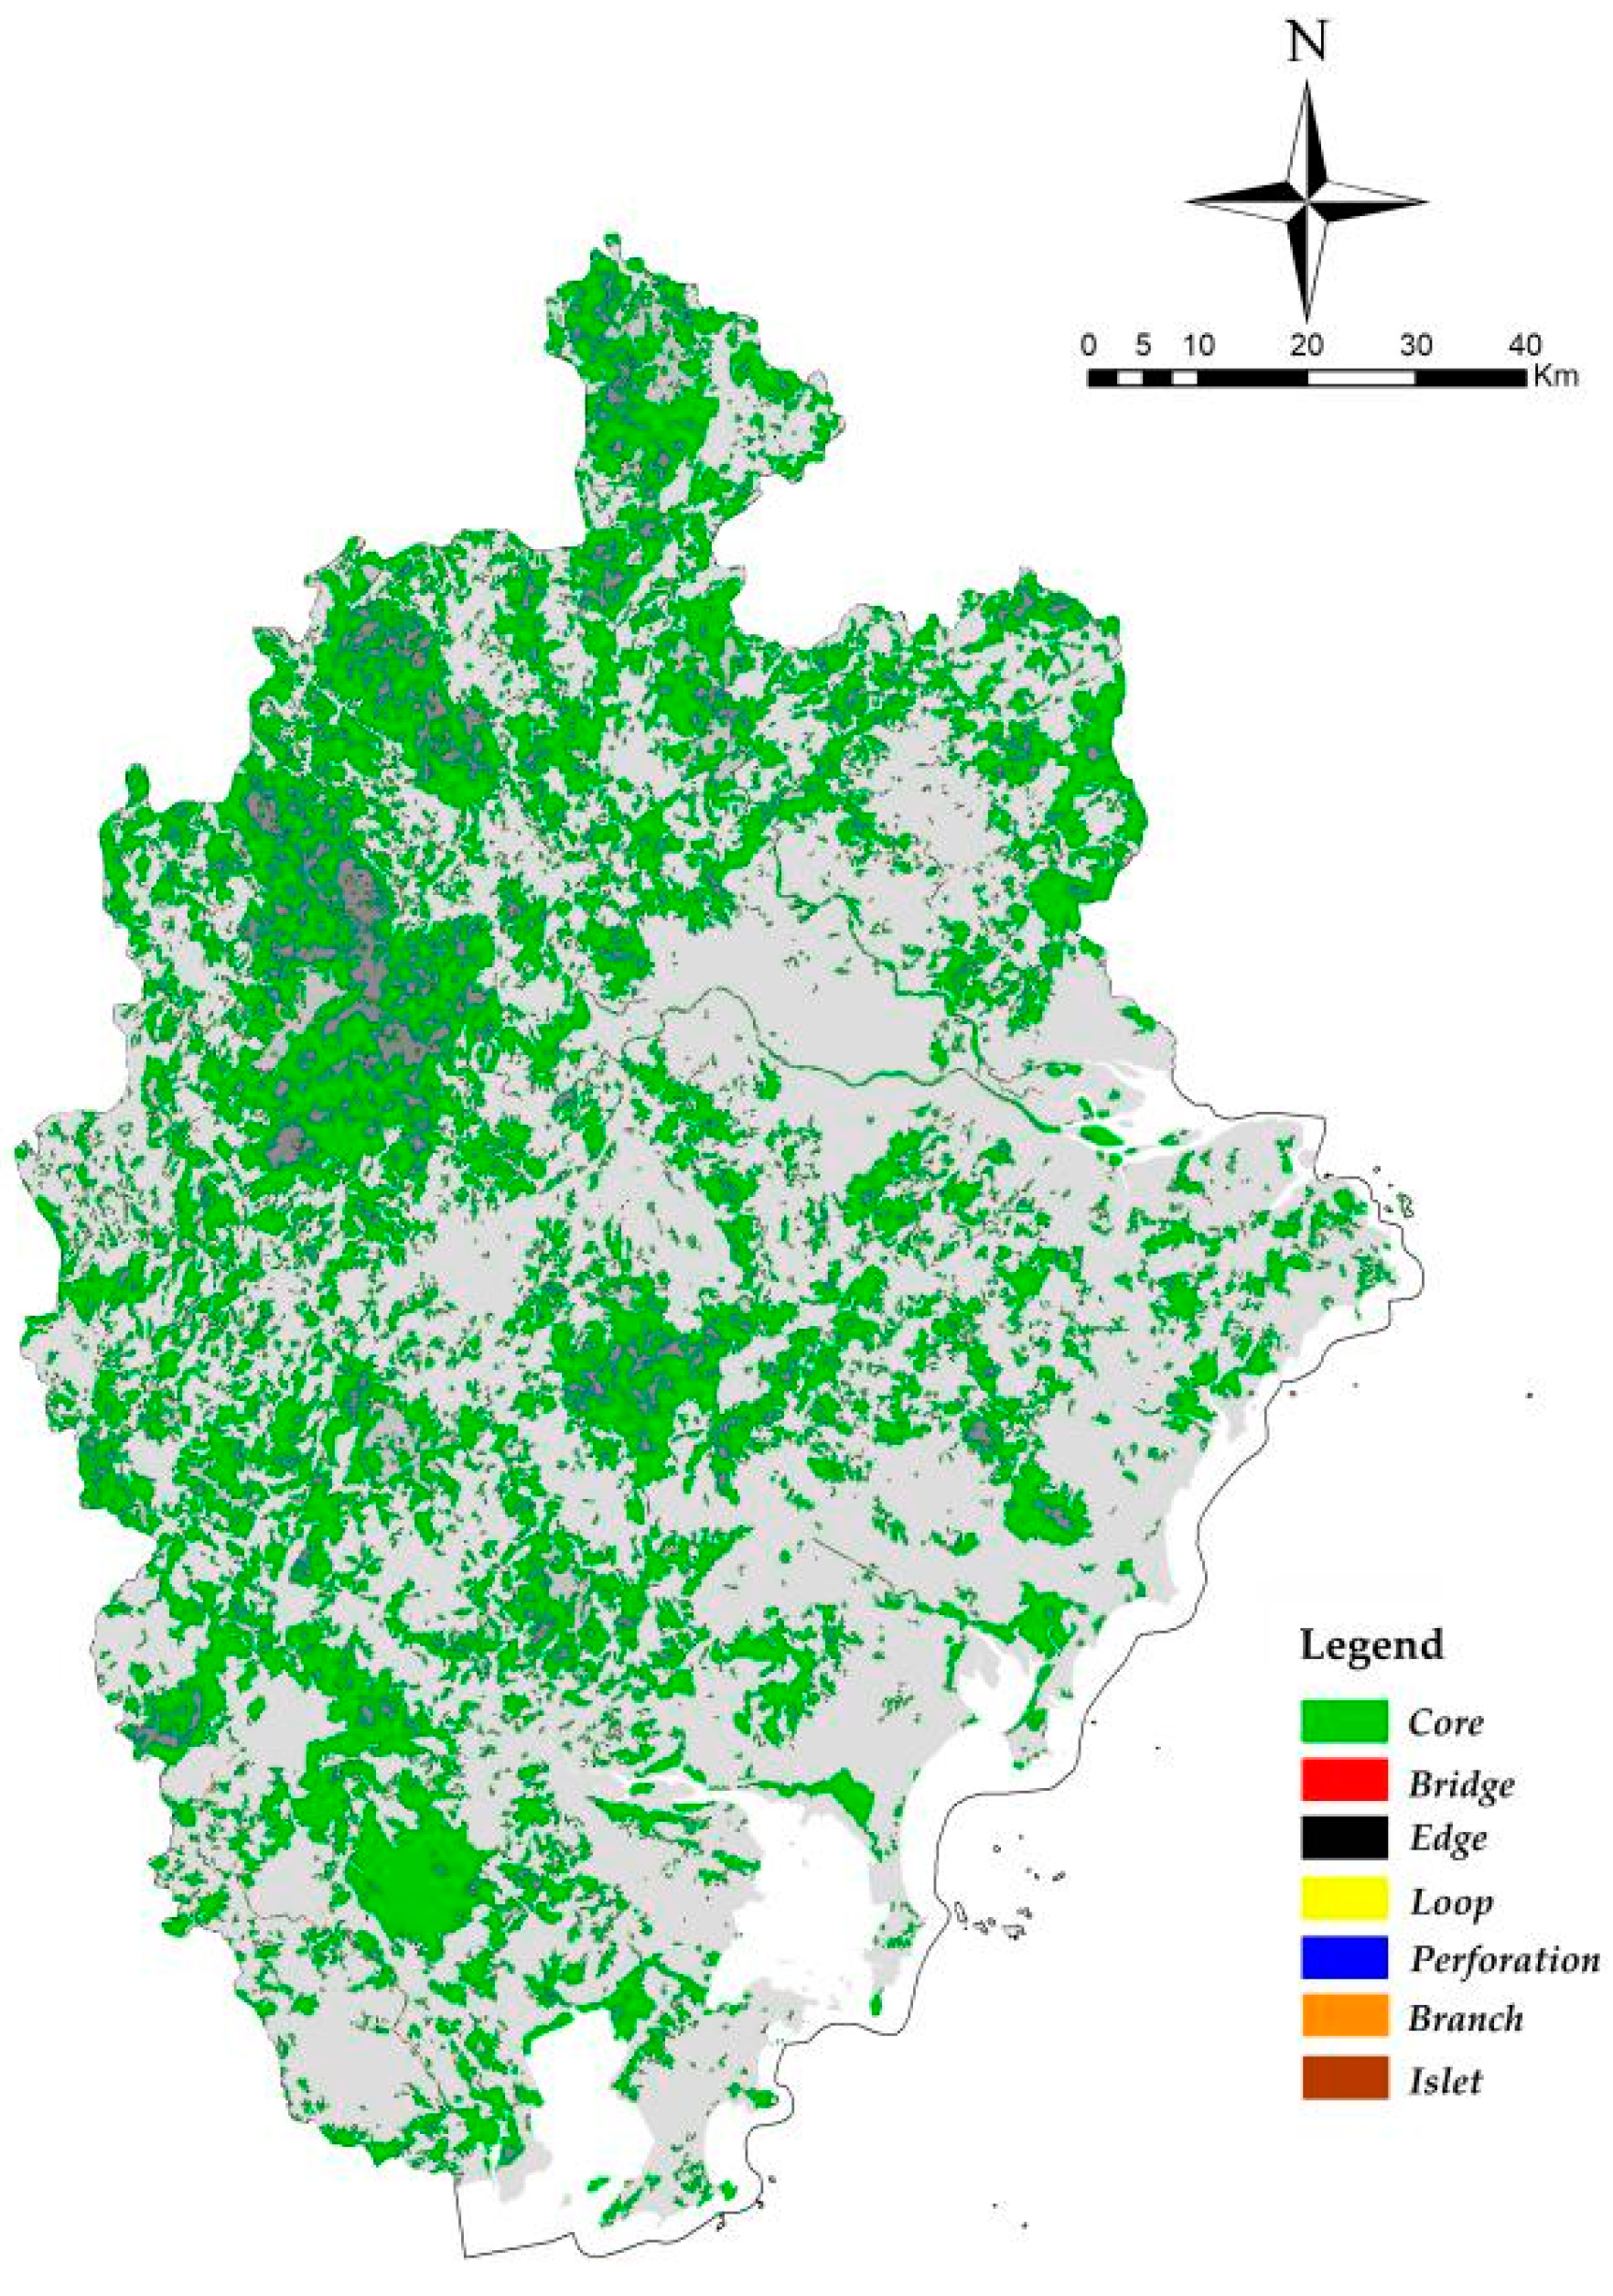
3.1.1. Landscape Pattern Analysis Based on MSPA

The results of landscape pattern analysis based on the MSPA method are shown in Figure 2 and Table 2. The core area of the research area was approximately 3954.19 km2, accounting for 31.25% of the research area and 83.51% of the ecological landscape. On the whole, the single patch area of the core area of the ecological landscape in Zhangzhou was large, with the northwest region of Zhangzhou being contiguous, and the southeast region being fragmented. Its regional scope is mainly concentrated in Pinghe County, Nanjing County, and Hua’an County of Zhangzhou, including a number of national, provincial, and municipal forest parks and nature reserves represented by Ling Tong Mountain National Geoparks and Hua’an National Forest Park. The marginal area is the outer edge of the ecological landscape patch, and the perforation is the inner edge of the patch, both of which are the regions producing an edge effect, accounting for 4.83% and 0.94% of the research area, and 12.89% and 2.50% of the total ecological landscape area, respectively. The large area of the edge zone and pores indicates that the core zone is stable and has a strong ability to resist the interference of external factors. The bridge area plays a role in connecting the structures for biological migration and communication but only accounts for 0.07% of the study area, indicating that the connection between the core areas is poor and the fragmentation is obvious. A branch line is a region where only one end is connected with the edge area, bridge area, loop area, or pore area, which has a certain connectivity effect, accounting for 4.83% of the research area. The loop area is a shortcut for animals within the patch, which is conducive to the migration of species within the same patch, but its actual area accounts for only 0.01%. At the same time, island patches, as isolated ecological landscape patches, have a small area and fragmented distribution, which can be used as steppingstones in the ecological network. However, their area proportion is almost negligible in the whole research area. The aforementioned situation shows that the landscape pattern of Zhangzhou city shows good patch connectivity in the core area of the northwest region, but lacks an internal migration corridor of species. On the other hand, there is a lack of large ecological source patches in the southeastern part of central China, which are fragmented and have poor connectivity, and the migration and flow of organisms are easily disturbed. Therefore, it is necessary to increase or expand the construction of ecological source areas.

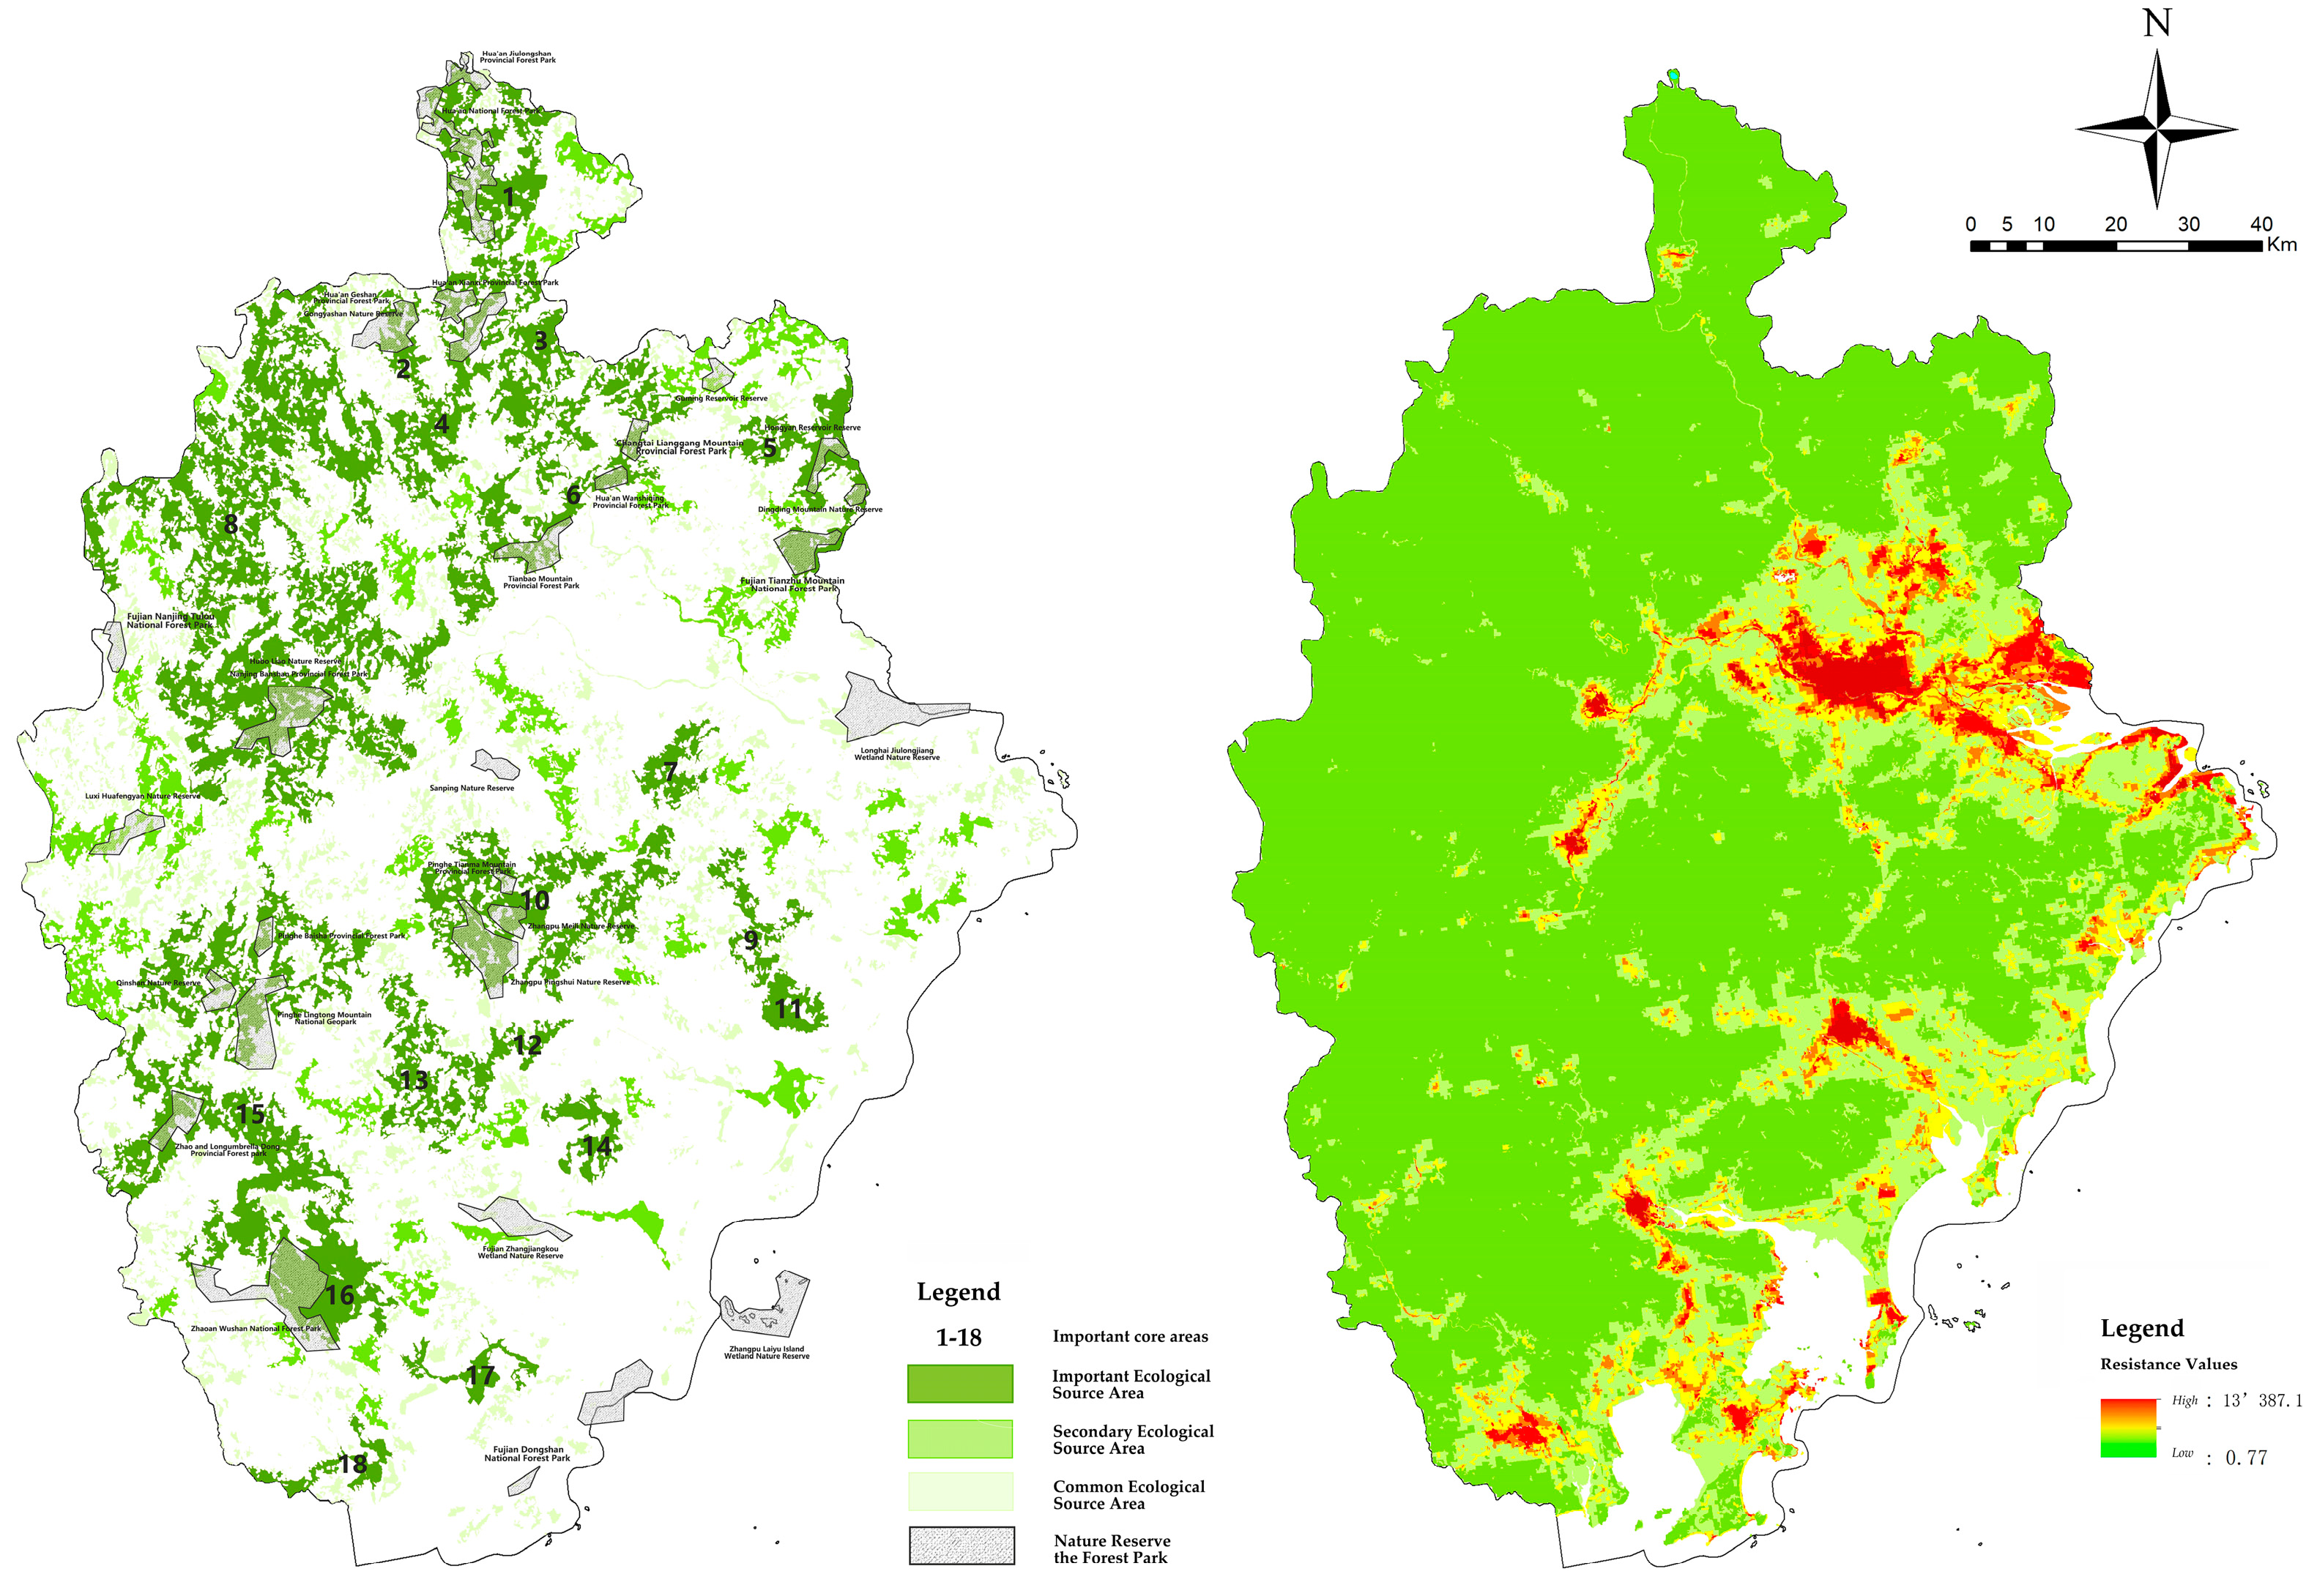
3.1.2. Extraction and Analysis of Important Ecological Source Areas

According to the landscape connectivity calculated by Confer 2.6 and the dIIC, dPC, and area size of each patch, there are 18 important core areas (Table 3, Figure 3), accounting for 37.68% of the core area, and nearly 57 secondary ecological sources, which account for 17.32% of the core area. Together, they make up nearly half of the core area.
The patches of ecological source areas were evenly distributed. Overall, the 18 important ecological source areas in the research area included large forests, wetlands, and natural protected areas. The number one ecological source area covers an area of 189.88 km2, including Hua’an National Forest Park, Hua’an Jiulongshan Provincial Forest Park, and Hua’an Xianxi Provincial Forest Park. Part of the number two ecological source area includes the Hua’an Geshan Provincial Forest Park and Gongyashan Nature Reserve. The number five ecological source area includes Hongyan Reservoir Reserve, Dingding Mountain Nature Reserve, and Fujian Tianzhu Mountain National Forest Park. The number six ecological source area has Changtai Lianggang Mountain Provincial Forest Park, Hua’an Wanshiqing Provincial Forest Park, and Tianbao Mountain Provincial Forest Park. The number eight ecological source area includes Hubo Liao Nature Reserve and Nanjing Banshan Provincial Forest Park. The number ten ecological source area includes Pinghe Tianma Mountain Provincial Forest Park, Zhangpu Meili Nature Reserve, and Zhangpu Pingshui Nature Reserve. The number fifteen ecological source area has Pinghe Baisha Provincial Forest Park, Pinghe Lingtong Mountain National Geopark, Qinshan Nature Reserve, and Zhao and Longumbrella Dong Provincial Forest Park. The number sixteen ecological source area is mainly represented by Zhaoan Wushan National Forest Park. There are many gaps in the northern part of the study area and the coastal areas of the southern part of the study area, which lack a large ecological source patch distribution, exhibit fragmented and poor connectivity, and biological migration and flow are vulnerable to obstruction and interference. Therefore, it is necessary to increase or expand the construction of ecological source areas. In fact, of the nearly 5000 ecological sources in Zhangzhou, most of them exist in a broken and independent state. Therefore, they can also be used as stepping stones for biological diffusion. At the same time, source areas seven, nine, eleven, twelve, thirteen, and fourteen are close to each other and have similar areas. They are located in the central region running through the north-south coastal direction of Zhangzhou. The connectivity within patches is high, but the overall connectivity between patches is low, which is an important hub affecting biological migration and communication in the north-south direction. There are patches of well-connected ecological source areas in the northwest and southwest of the study area, especially represented by ecological source areas one, eight, and fifteen, indicating that the habitat quality in this area is high and suitable for biological migration and survival.

3.2. Analysis of Ecological Network Construction

3.2.1. Extraction and Analysis of Potential Ecological Corridors Based on the MCR Model

Based on the modified landscape resistance surface, as shown in Figure 3, the resistance value is 0.77–13,387.1. As the land types were mainly forest land, grassland, and garden land, the resistance values in the research area showed obvious differentiation. The high resistance values were mainly concentrated in the construction area of each district and county. The resistance values were most concentrated along the two banks of Jiulong River (Zhangzhou urban area) in the north of the central part of the study area. Due to the surge of construction land, the ecological resistance is high, which seriously affects the migration of regional biological species and the flow of biological energy. A total of 153 potential ecological corridors were extracted based on Linkage Mapper.

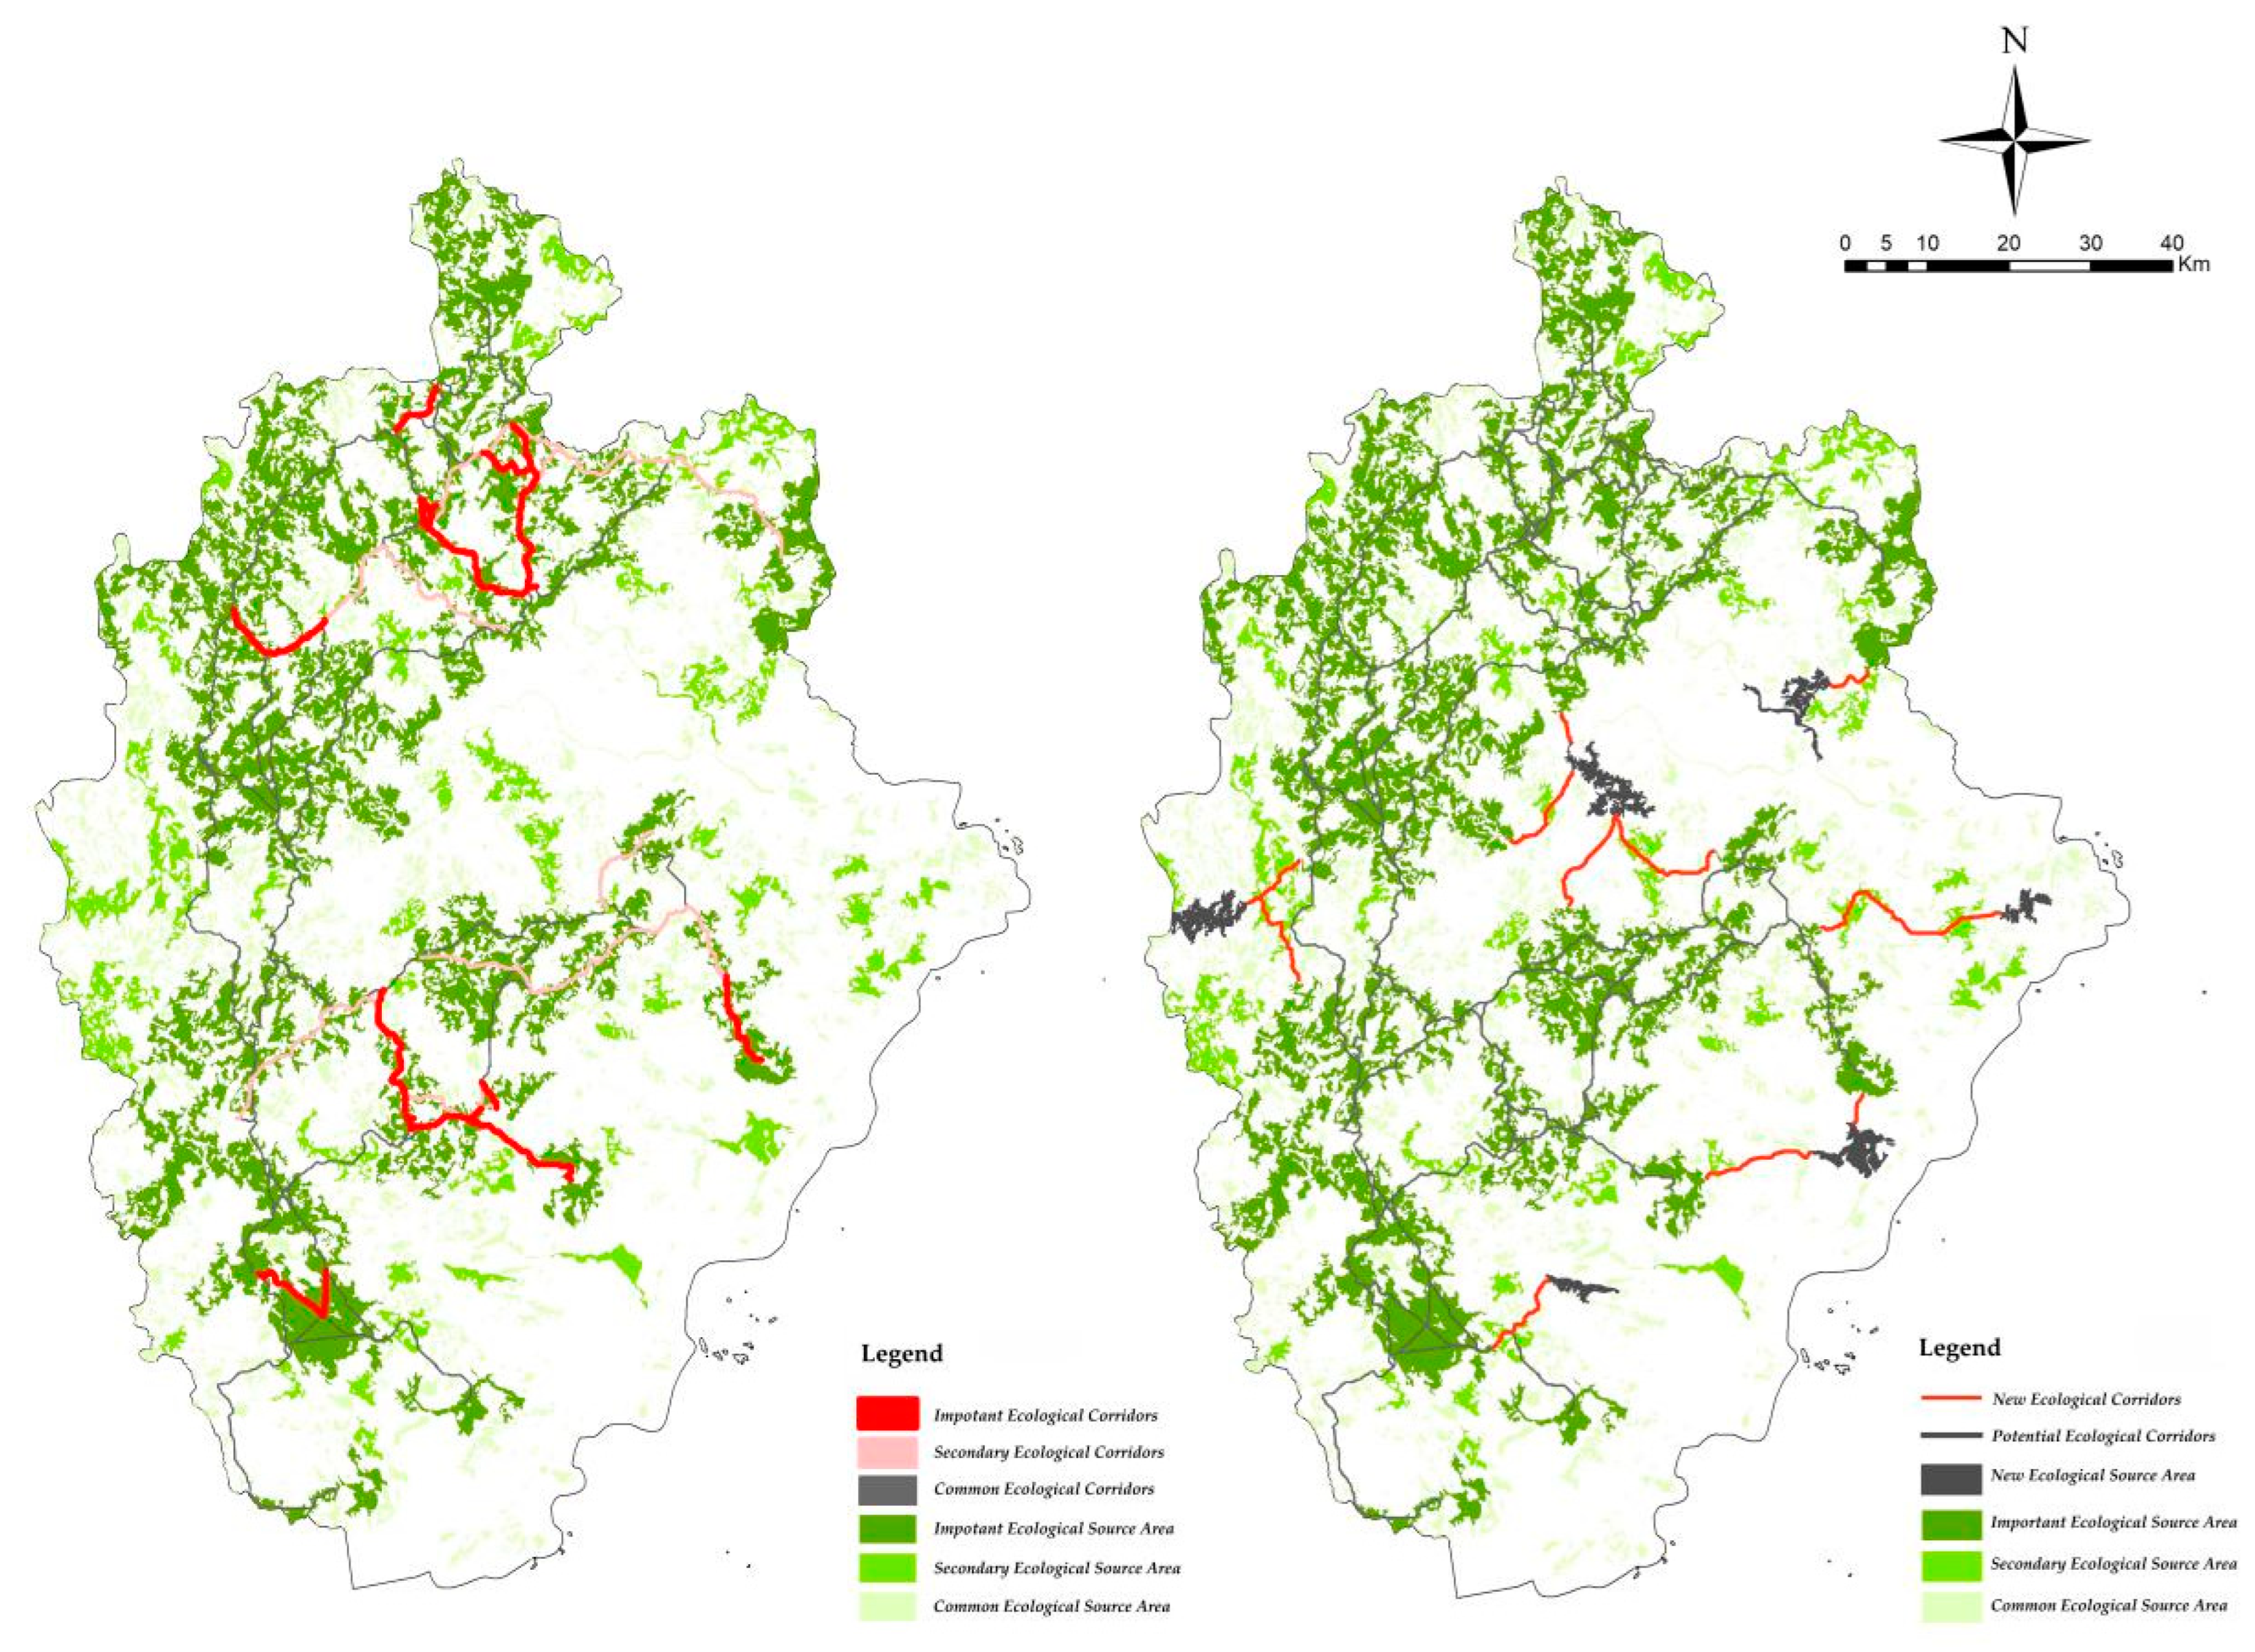
3.2.2. Identification and Analysis of Important Ecological Corridors

Based on the gravity model, the potential ecological corridors were further classified, and those with interaction strength greater than 1000 were extracted as important corridors. In turn, a total of 21 important corridors were obtained. The ones with strength greater than 100 and less than 1000 were used as secondary corridors, and 51 secondary corridors were obtained, whereas the others with strength greater than 0 were general corridors (Table 4 and Figure 4). The interaction intensity between source two and source four was the strongest, and they were close to each other, with low landscape resistance and high habitat quality. Species migration and communication between the two sources are more likely, and the ecological corridor between them needs to be maintained and managed. Additionally, the ecological source areas seventeen and eighteen were the main source areas, and the interaction force intensity with most of the ecological sources was very small (<1). Particularly, the interaction intensity between source seventeen and sources five, seven, sixteen, and eighteen is almost zero. This phenomenon can also explain why the whole region from the southern coastal area of Zhangzhou to the eastern coastal area of the north not only has a large geographical distance span but is also limited by the landscape resistance value. The migration path of biological communication between the source areas is almost broken, and only the internal migration path is retained. In contrast, the source areas one, two, three, four, and six located in the north of Zhangzhou have great interaction intensity, with the general association intensity greater than 1000. The same situation also occurred in the source areas fourteen, fifteen and sixteen in the southwest of Zhangzhou, where the interaction intensity between the source areas was generally greater than 100 and locally greater than 1000. This situation also shows that the ecological network of Zhangzhou presents an obvious two-level distribution state. The main source areas in northwest and southwest China can provide a good migration environment for terrestrial organisms, but the coastal areas in northeast and southeast China lack important ecological corridors. Therefore, when planning the construction of the ecological network, a special focus should be placed on the Zhangzhou Jiulong River estuary, coastal protection, and its surrounding environment. Applying these principles to the whole ecological network can improve the connectivity of the southeast, but also the northeast ecological connectivity between the source, and provide a channel for biological migration of east-west corridors and open environments, thereby enhancing the balance and stability of the whole ecological network of Zhangzhou.

3.3. Optimization of the Ecological Network in Zhangzhou City

3.3.1. Maintenance and Addition of Ecological Source Areas

Parts of the middle, east, and south regions along the coastal areas in the study area lack connectivity. Therefore, based on the original ecological sources, combined with the distribution of secondary and general ecological sources in the whole research area, six core areas with the highest connectivity and suitable distribution locations were selected as the new important ecological sources in Figure 4, and ecological environment construction and protection were carried out for these six patches to improve the habitat quality to make up for the lack of ecological corridors in Zhangzhou at this stage. At the same time, important ecological source areas are important nodes in the ecological network due to their crucial role as habitats of species.
Currently, there are many important ecological sources in the north, west, and southwest of Zhangzhou. They are large in area and have good connectivity. At the same time, they also contain a large number of national and provincial forest parks and large nature reserves. Therefore, to enhance maintenance efforts, it is necessary to strengthen the connection with small forest parks, wetlands, and nature reserves scattered around to expand the area of ecological sources and promote the mutual communication of surrounding organisms. On the other hand, the Jiulong River, which runs through the eastern and central regions of Zhangzhou, is a natural ecological corridor that plays a crucial role as an important ecological link between coastal and inland areas. However, this river is currently classified as a weak ecological corridor, thus highlighting the need to focus on maintaining and strengthening the protection of the river and the construction of the surrounding green islands, so as to enhance the integrity and connectivity of the ecological network in the urban center. In addition to the urban construction area, there are a large number of small ecological sources in the eastern and southern coastal areas of Zhangzhou City. As illustrated by the land use status map, most of these areas are cultivated land and garden land. Therefore, in future ecological construction, it is necessary to strengthen the restoration of natural ecological elements such as forest land, garden land, and water area in Zhangzhou City to improve the quality of habitats, so as to maintain the ecological environment of the whole region.

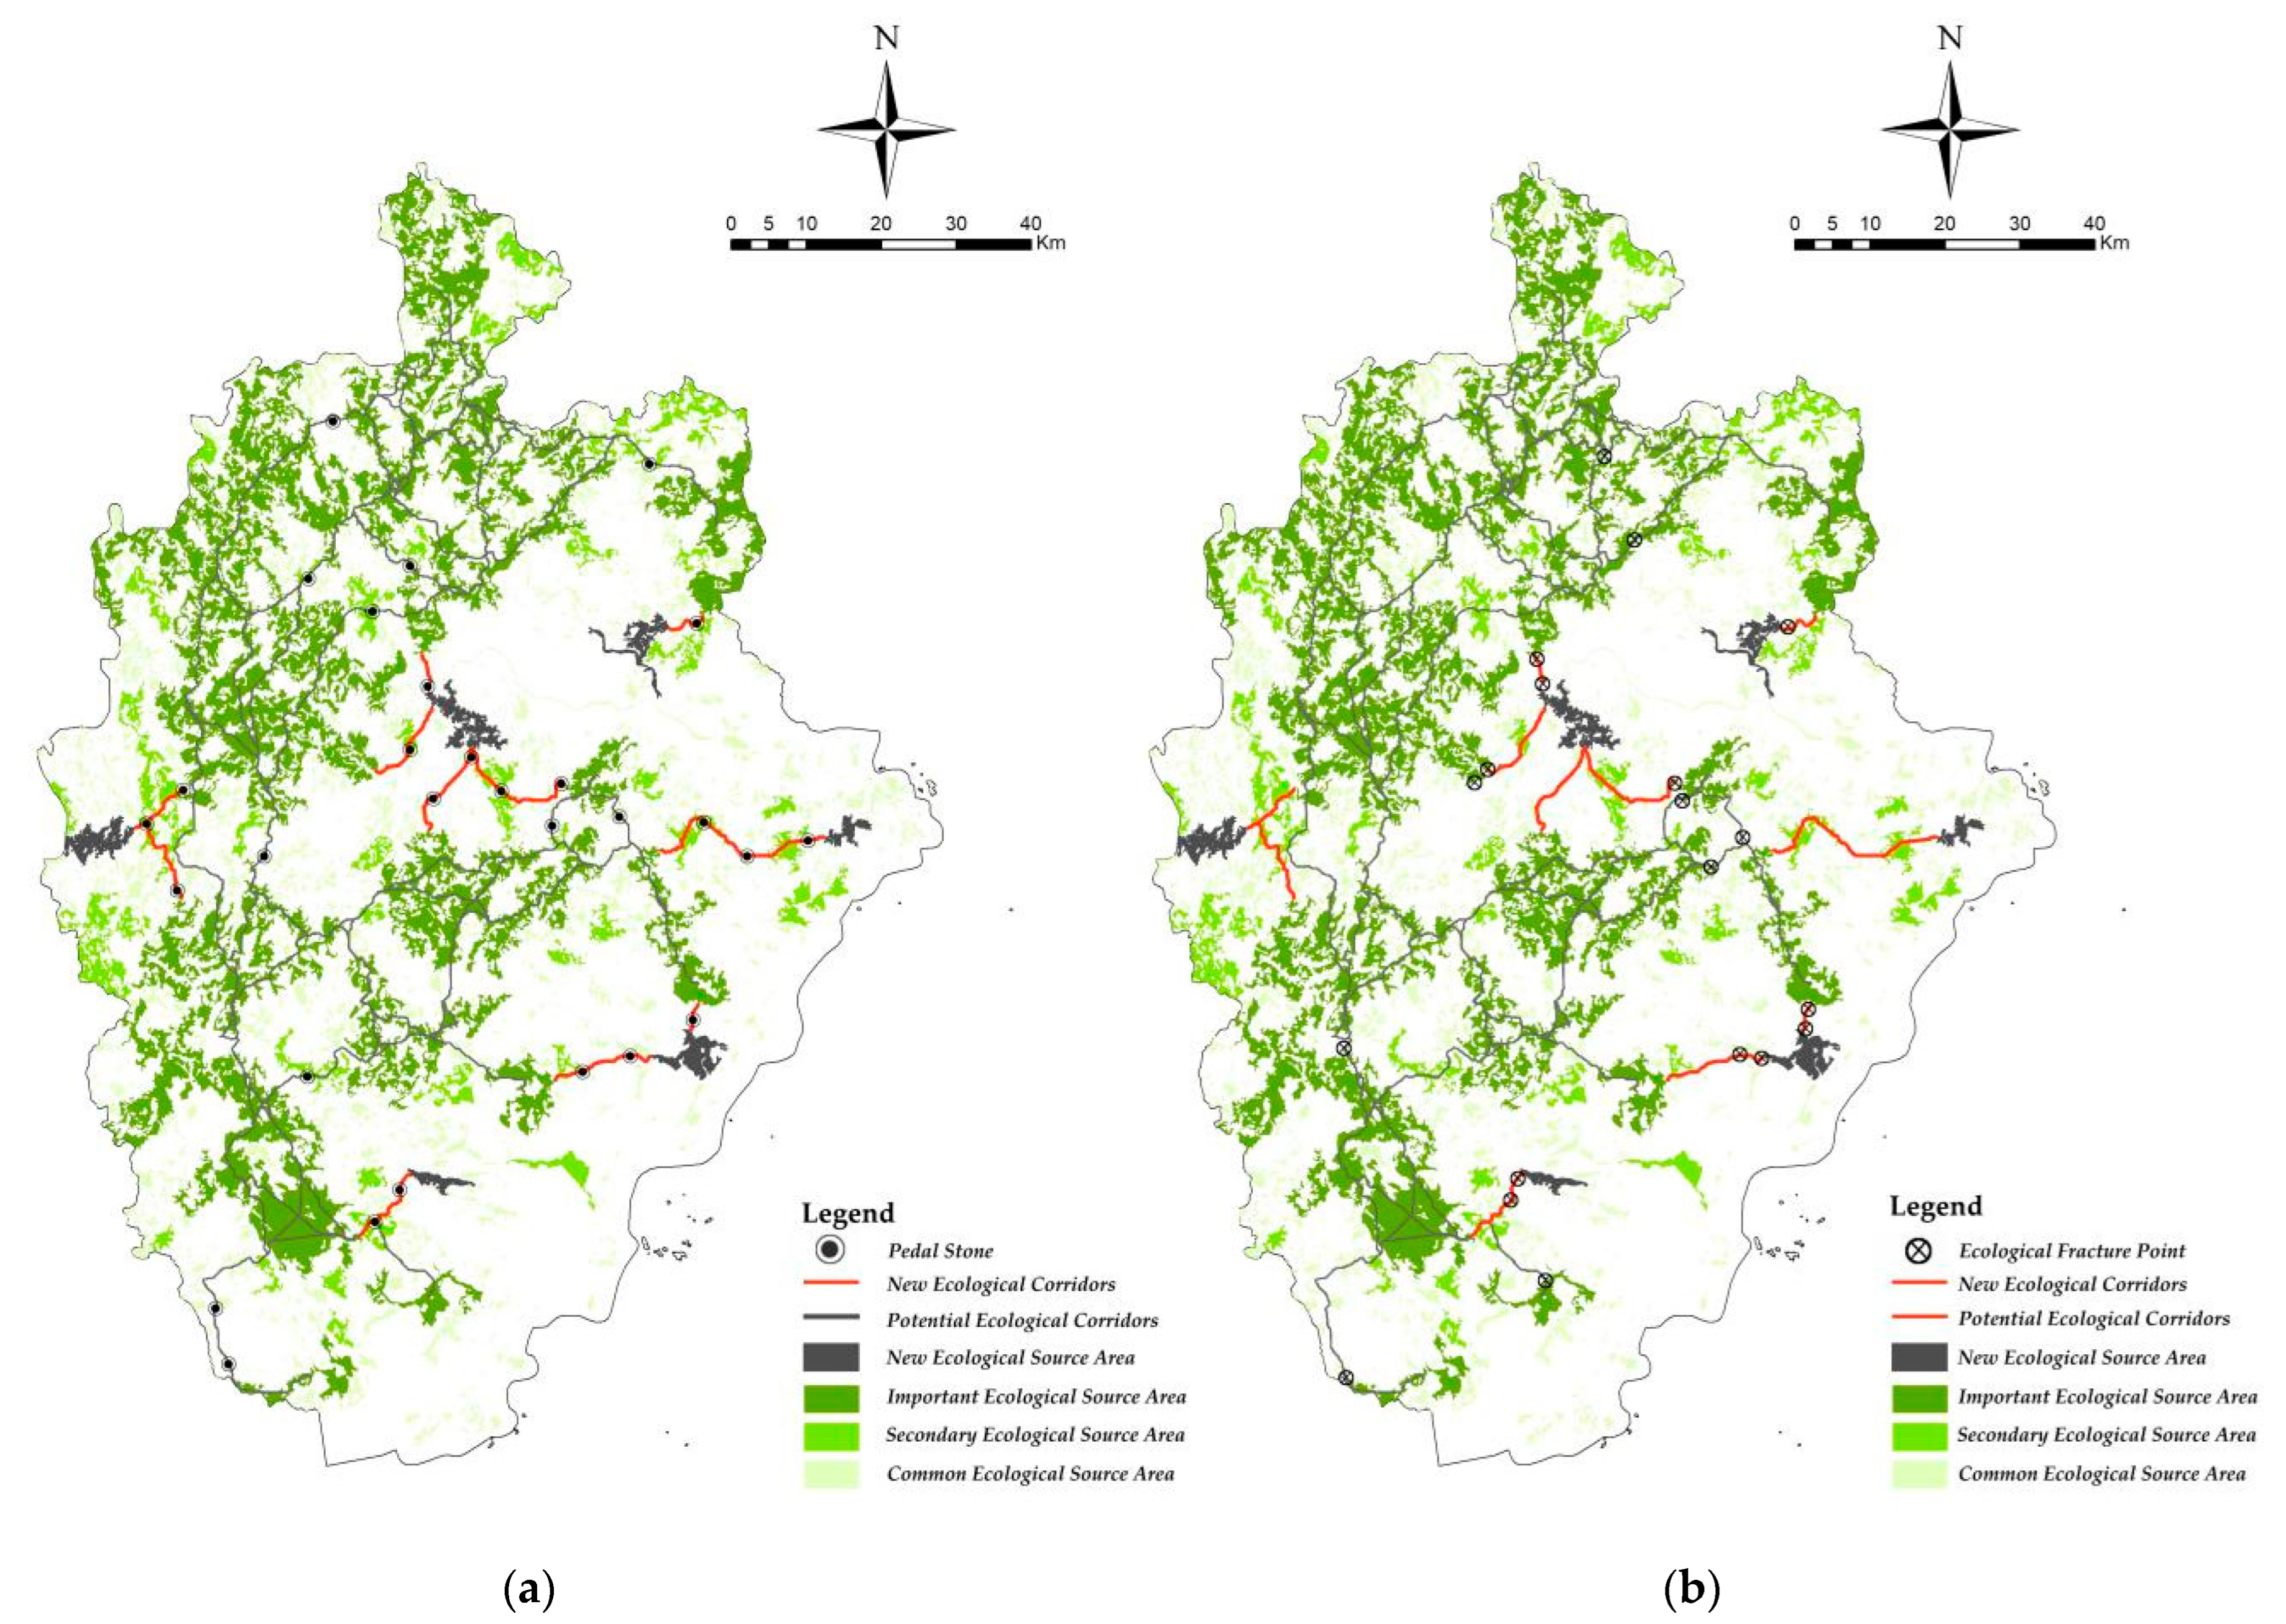
3.3.2. Construction of the Pedal Stone

Pedal stones (pedal stone: it can provide dispersal of species or flow of matter and energy, and play a role as a medium in ecological networks.) play an important role in ecological networks, as they provide temporary resting places for organisms. Increasing the number of pedal stones could not only improve the survival rate of organisms in the process of migration and communication but also enhance the stability of the ecological network [44,45]. The crossing points of general corridors and places with relatively small resistance values are the preferred pedal stones. Meanwhile, the bridge area is an important connection point of the core area and also one of the selected stepping stones, which is of great significance to the connectivity of the whole ecological network and the migration and communication of organisms. The Pinchpoint Mapper tool in the Linkage Mapper toolbox was used to select 29 pedal stones in combination with the distribution of ecological sources and ecological corridors in Zhangzhou and the actual ecological environment (Figure 5a). Among them, 12 stepping stones were located in grasslands and gardens, and most of them were concentrated near eastern coastal and central scenic spots, while others were scattered in natural mountain forest environments, indicating that vegetation quality and density of grassland gardens should be improved to maintain and build surrounding stepping stones. There are eight pedal stones in the forestland, most of which are scattered in the north, west, and central mountain forests of Zhangzhou. We can improve the environmental quality and strengthen the pedal stone function by transforming low-yield forests. Furthermore, seven pedal stones were located on arable land and other land types, which need to strengthen restrictions on human activities and improve the green facilities of the city. Additionally, there were two pedal stones on the water area and wetland, which can selectively promote the growth of certain plants according to the site conditions and ecological functions around the water area to improve the habitat quality of the water area and wetland, in addition to providing temporary habitats for organisms.

3.3.3. Restoration of Ecological Fracture Points

The influence of urban construction land, traffic construction land, and water area in ecological networks should not be ignored. Particularly, these factors can hinder the process of biological migration and communication, and the intersection with the ecological corridor is prone to network fracture, thus forming ecological fracture points [46,47]. The Barrier Mapper analysis tool in the Linkage Mapper toolbox was used to extract twenty ecological fracture points combined with landscape ecological resistance surface and traffic network in the study area (Figure 5b). Overall, ecological fracture points are concentrated in the central and southern coastal areas of the study area. There were seven fracture points in the water area or mangrove wetland of Jiulong River tributaries, and the regional fracture points are affected by urban construction land and related land areas. There are eight ecological fracture points on expressways, particularly the Shenzhen-Hai expressway, the S40 Zhangzhou-Wuzhou expressway, the G1523 Yong-Dongguan expressway, and a railway, with four additional fracture points located on provincial roads or other roads. Therefore, our findings suggest that efforts should be made to preserve the areas around the fracture point in subsequent planning. By elevating the green area around the road or water area or wetland area, the interference of human activities can be minimized to facilitate the development of biological pathways. Otherwise, this could also be achieved through the construction of a viaduct, underground passage, bridge, and other pathways to extend the biological corridor.

4. Conclusions and Prospects

4.1. Conclusions

As an important city of agricultural resources in Fujian Province, Zhangzhou has a high forest coverage rate and a relatively stable economic development rate. However, the urbanization rate of population and land is relatively low. Therefore, balancing ecological protection and economic development has been particularly challenging in this region. In this study, the MSPA method and the MCR model were combined to construct an ecological network in Zhangzhou City. Moreover, through the extraction of important ecological sources and important corridors, a method for increasing ecological sources and establishing stepping stones to repair ecological fracture points was implemented to optimize the entire ecological network of Zhangzhou City, enhance landscape connectivity, promote biological migration and communication, and assess the stability of the entire ecological environment. The following are our main conclusions:
(1)
The ecological area and the construction land area in Zhangzhou city showed a significant opposition, the resistance factor of the ecological advantage area was small, and the ecological resistance of the construction land area increased markedly. The core area of the Zhangzhou landscape pattern identified by the MSPA method is approximately 3954.19 km2, accounting for 31.25% of the total area of the study area and 83.51% of the total area of the ecological landscape. The single patch area of the core area is large, and it is mainly distributed in the northwest region of Zhangzhou and scattered and fragmented in the southeast. This is also consistent with the current polarization of Zhangzhou City and the forest region.
(2)
Based on the landscape connectivity index dIIC, dPC, and Id, 18 important core areas and nearly 57 secondary ecological sources were selected, accounting for 55% of the core area. They were mainly distributed in the western and northern areas of Zhangzhou, while the coastal areas in the middle, east, and south are obviously short of large ecological sources.
(3)
Based on the MCR model and gravity model, 21 important corridors, 51 secondary corridors, and 81 general corridors were extracted. The purpose was to maintain and repair the biological corridor in the east-west and north-south coastal directions of Zhangzhou City and further optimize the stability of the ecological network by maintaining the scale of urban construction land.
(4)
We suggest adding six new ecological source areas along the central and eastern, western, and southern coasts of Zhangzhou city. Additionally, 29 stepping stones and 20 ecological fracture points should be set for the whole ecological network.
In order to maintain and optimize the ecological network space of natural dominant cities such as Zhangzhou City, we should pay attention to the following points: first, we should maintain its good ecological corridor status in the existing planning; secondly, in the process of urban construction, attention should be paid to the improvement of the habitat quality of water and wetland. A certain proportion of ecological rest space should be set around important urban roads. At the same time, increase the number of green facilities in the city. In addition, construction managers should pay attention to formulate specific action plans according to the actual distribution of important potential ecological corridors and important ecological nodes in the city, and carry out reasonable ecological protection according to the distribution of ecological resources in urban areas. Ecological protection is a long-term measure, and prioritizing economic development at the expense of the environment is bound to lead to considerable losses. Therefore, it is of great significance to establish a lasting and stable ecological safety network to maintain local economic development.

4.2. Prospects and Shortcomings

This paper proposes suggestions on regional ecological protection management and ecological spatial network construction, in order to provide effective support for territorial space planning, ecological space construction and ecological protection red line management and control of relevant cities, and also provide reference for similar regional ecological spatial network research, but the research itself also has shortcomings. According to the law of geographical similarity, the energy flow and material transport in the ecosystem are spatially continuous, and the mutual influence between geographical regions makes the ecological processes of neighboring regions also connected with each other. The integrity of the regions should also be considered when constructing the regional ecological security pattern. Therefore, the research scope will be expanded in the future, focusing on Zhangzhou, Xiamen, Quanzhou urban agglomeration and even Fujian Province, to explore the internal ecological network pattern relationship, which will make our optimization strategy more accurate and effective.

Author Contributions

Conceptualization, Y.L.; data curation, M.D.; formal analysis, Y.L. and M.D.; methodology, Y.L.; project administration, Y.L.; resources, Y.L.; software, M.D.; writing—original draft, Y.L.; writing—review & editing, M.D. All authors have read and agreed to the published version of the manuscript.

Funding

This research received no external funding.

Data Availability Statement

Digital elevation model (DEM) data at http://www.gscloud.cn/. It accessed on 1 April 2022. Zhangzhou classification data of land use in 2020 were obtained from the RESDC at http://www.resdc.cn, accessed on 1 April 2022. Night light data of Zhangzhou in December 2020 were obtained from https://ngdc.noaa.gov/eog/viirs/download_ut_mos.html. A survey of Zhangzhou’s Natural protected areas 2022 was obtained from the internal data of the Zhangzhou Forestry Bureau.

Conflicts of Interest

The authors declare no conflict of interest.

References

  1. Pang, B.; Li, X.X.; Zhang, Y.Z.; Fu, Y.; Song, X.C. Analysis of the Decoupling Relationship and Driving Factors between Economic Development and Environmental Pollution in New First-Tier Cities. Ecol. Econ. 2022, 38, 192–197. [Google Scholar]
  2. Song, M.L.; Cui, L.B.; Zhou, Y.X. Management system and institution of natural resources in China: Status, problems and prospects. J. Nat. Resour. 2022, 37, 1–16. [Google Scholar]
  3. Zhang, Y.J.; Yu, B.Y. Analysis of urban ecological network space and optimization of ecological network pattern. Acta Ecol. Sin. 2016, 36, 6969–6984. [Google Scholar]
  4. Su, K.; Yu, Q.; Yang, D. Simulation of Forest-grass Ecological Network Based on Multi-scene Model in Typical Desert-oasis Ecotone. Trans. Chin. Soc. Agric. Mach. 2019, 9, 243–253. [Google Scholar]
  5. Liu, X.; Jiao, Y.; Wang, M.; Zhang, K. Evaluation of key nodes and corridors of river and canal network in Hani Rice Terraces based on graph theory. Chin. J. Ecol. 2018, 1, 287–294. [Google Scholar]
  6. Tang, P.; Wang, H. Analysis on the suitability of green sponge space in modern city based on MCR model. J. Nanjing For. Univ. Nat. Sci. Ed. 2019, 3, 116–122. [Google Scholar]
  7. Wang, Y.Y.; Shen, C.Z.; Jin, X.B.; Bao, G.Y.; Liu, J.; Zhou, Y.K. Developing and optimizing ecological networks based on MSPA and MCR model. Ecol. Sci. 2019, 2, 138–145. [Google Scholar]
  8. Peng, J.; Zhao, H.J.; Liu, Y.X.; Wu, J.S. Research progress and prospect on regional ecological security pattern construction. Geogr. Res. 2017, 3, 407–419. [Google Scholar]
  9. Hou, P.; Wang, Q.; Shen, W.M.; Zhai, J.; Liu, H.M.; Yang, M. Progress of integrated ecosystem assessment: Concept, framework and challenges. Geogr. Res. 2015, 10, 1809–1823. [Google Scholar]
  10. Conine, A.; Xiang, W.N.; Young, J.; Whitley, D. Planning formulti-purposegreen-ways in Concord, North Carolina. Landsc. Urban Plan. 2004, 68, 271–287. [Google Scholar] [CrossRef]
  11. Fábos, J.G. Green way plann in gin the United States: Its origins and recent case studies. Landsc. Urban Plan. 2004, 68, 321–334. [Google Scholar] [CrossRef]
  12. Xie, H.W.; Zhou, N.X.; Guan, J. The construction and optimization of ecological networks based on natural heritage sites in Jiangsu Province. Acta Ecol. Sin. 2014, 22, 6692–6700. [Google Scholar]
  13. Gu, F.; Huang, Y.X.; Chen, C.M.; Cheng, D.L.; Guo, J.L. Construction and optimization of ecological network for nature reserves in Fujian Province, China. Chin. J. Appl. Ecol. 2017, 3, 1013–1020. [Google Scholar]
  14. Biondi, E.; Casavecchia, S.; Pesaresi, S.; Zivkovic, L. Natura 2000 and the Pan-European ecological network: A new methodology for data integration. Biodivers. Conserv. 2012, 21, 1741–1754. [Google Scholar] [CrossRef]
  15. Yang, Z.G.; Jiang, Z.Y.; Guo, C.X.; Yang, X.J.; Xu, X.J.; Ui, X.; Hu, Z.M.; Zhou, H.Y. Construction of ecological network using morphological spatial pattern analysis and minimal cumulative resistance models in Guangzhou City, China. Chin. J. Appl. Ecol. 2018, 10, 3367–3376. [Google Scholar]
  16. Meng, J.J.; Wang, Y.; Wang, X.D.; Zhou, Z.; Sun, N. Construction of Landscape Ecological Security Pattern in Guiyang Based on MCR Model. Resour. Environ. Yangtze Basin 2016, 7, 1052–1061. [Google Scholar]
  17. Jing, Y.B.; Sun, X.; Liu, J.; Sun, D.J. Construction of Ecological Corridor in Etuoke Banner of Inner Mongolia Based on MCR Model. Bull. Soil Water Conserv. 2021, 2, 170–177. [Google Scholar]
  18. Hu, M.J.; Sun, P.; Li, Z.J.; Hou, B. Decoupling effect of economic growth and resource environment in the Yangtze River Delta. World Reg. Stud. 2022, 31, 538–548. [Google Scholar]
  19. Guo, S.; Chen, M.; Liu, H. Coupling procedure and decoupling analysis of urbanization and resource environment: The study of Beijing. Geogr. Res. 2018, 37, 1599–1608. [Google Scholar]
  20. Wang, Y.; Wang, Y. Decoupling analysis and influence factors between resource environment and economic growth in Beijing-Tianjin-Hebei region. Econ. Geogr. 2019, 39, 43–49. [Google Scholar]
  21. Yu, J.; Tang, B.; Chen, Y.; Zhang, L.; Nie, Y.; Deng, W. Landscape ecological risk assessment and ecological security pattern construction in landscape resource-based city: A case study of Zhangjiajie City. Acta Ecol. Sin. 2022, 42, 1290–1299. [Google Scholar]
  22. Li, H.; Liu, Y.; Li, Q.; Wang, X. Analysis of Ecological Security Pattern of Southern Rare Earth Mining Area Based on MCR Model. Sci. Geogr. Sin. 2020, 6, 989–998. [Google Scholar]
  23. Dong, B.; Zhang, M.; Mu, H.; Su, X. Study on decoupling analysis between energy consumption and economic growth in Liaoning province. Energy Policy 2016, 97, 414–420. [Google Scholar] [CrossRef]
  24. Xia, Y.; Zhong, M. Relationship between EKC hypothesis and the decoupling of environmental pollution from economic development: Based on China prefecture-level cities’ decoupling partition. China Popul. Resour. Environ. 2016, 26, 8–16. [Google Scholar]
  25. Kuang, W.H.; Liu, J.Y.; Lu, D.S. Pattern of impervious surface change and its effect on water environment in the Beijing-Tianjin-Tangshan metropolitan area. Acta Geogr. Sin. 2011, 66, 1486–1496. [Google Scholar]
  26. Jin, Y.; Lu, Z.; Tan, F.; Zhang, M.; Zhang, H. Assessment of ecological carrying capacity on the typical resources-based cities: A case study of Tangshan City. Acta Ecol. Sin. 2015, 35, 4852–4859. [Google Scholar]
  27. Liu, Y.D.; He, Z.W.; Chen, J.H.; Xie, C.; Xie, T.Z.; Mu, C.L. Ecological Network Construction Method Based on MSPA and MCR Model: Taking Nanchong as Example. Southwest China J. Agric. Sci. 2021, 2, 354–363. [Google Scholar]
  28. Li, X.F.; Weng, F.F.; Chen, R.R.; Liu, X.Z.; Ding, Z. Ecological network construction based on MSPA and MCR model–Taking Xinxiang City as an example. J. Henan Inst. Sci. Technol. Nat. Sci. Ed. 2022, 1, 45–54. [Google Scholar]
  29. Santiago, S.; Luc, A. A new habitat availability index to integrate connectivity in landscape conservation planning: Comparison with existing indices and application to a case study. Landsc. Urban Plan. 2007, 83, 91–103. [Google Scholar]
  30. Saura, S.; Estreguil, C.; Mouton, C.; Rodríguez-Freire, M. Network analysis to assess landscape connectivity trends: Application to European forests (1990–2000). Ecol. Indic. 2010, 11, 407–416. [Google Scholar] [CrossRef]
  31. Santiago, S.; Lin, R. A common currency for the different ways in which patches and links can contribute to habitat availability and connectivity in the landscape. Ecography 2010, 33, 523–537. [Google Scholar]
  32. Rjan, B.; Santiago, S. Ranking individual habitat patches as connectivity providers: Integrating network analysis and patch removal experiments. Ecol. Model. 2010, 221, 2393–2405. [Google Scholar]
  33. Wang, G.; Yu, Q.; Yang, D.; Zhang, Q.B.; Yue, D.P.; Liu, J.H. Hierarchical ecological network structure based on complex network analysis. Trans. Chin. Soc. Agric. Mach. 2019, 50, 258–266+312. [Google Scholar]
  34. Chen, Y.; Zhang, Z.; Yang, C.; Wan, L.; Ye, C.; Zhang, J.; Li, Q. Identifying risk areas and risk paths of non-point source pollution in Wuhua River Basin. Acta Geogr. Sin. 2018, 73, 1765–1777. [Google Scholar]
  35. Cheng, J. An Ecological Study on Characteristic Agriculture in Southeast of Fujian Province—A Case Study of Zhangzhou City. Master’s Thesis, Fujian Normal University, Fuzhou, China, 2001. [Google Scholar]
  36. Huang, Y.C. Study on the Ecosystem Services Value in Response to Land Use Change in Zhangzhou. Master’s Thesis, Fujian Normal University, Fuzhou, China, 2009. [Google Scholar]
  37. Lian, P.P. Study on the Assessment and Strategy of Modern Agricultural Development of Zhangzhou City from the Perspective of Eco-Civilization. Master’s Thesis, Fujian Normal University, Fuzhou, China, 2014. [Google Scholar]
  38. Zhangzhou Bureau of Statistics. Zhangzhou Statistical Yearbook, 2021. Available online: http://tjj.zhangzhou.gov.cn/cms/html/zzstjj/tjnj/index.html (accessed on 24 August 2022).
  39. Soille, P.; Vogt, P. Morphological Segmentation of Binary Patterns. Pattern Recognit. Lett. 2009, 4, 456–459. [Google Scholar] [CrossRef]
  40. Wu, C.G.; Zhou, Z.X.; Wang, P.C.; Xiao, W.F.; Teng, M.J. The concept and measurement of landscape connectivity and its applications. Acta Ecol. Sin. 2010, 7, 1903–1910. [Google Scholar]
  41. Yin, H.; Kong, F.; Qi, Y.; Wang, H.; Zhou, Y.; Qin, Z. Developing and optimizing ecological networks in urban agglomeration of Hunan Province, China. Acta Ecol. Sin. 2011, 10, 2863–2874. [Google Scholar]
  42. Shi, X.M.; Qin, M.Z.; Li, B.; Li, C.Y.; Song, L.L. Research on the Green Infrastructure Network in the Zhengzhou-Kaifeng Metropolitan Area Based on MSPA and Circuit Theory. J. Henan Univ. Nat. Sci. 2018, 6, 631–638. [Google Scholar]
  43. Li, J.; Meng, J.J.; Mao, X.Y. MCR Based Model for Developing Land Use Ecological Security Pattern in Farming-Pastoral Zone: A Case Study of Jungar Banner, Ordos. Acta Sci. Nat. Lium Univ. Pekin. 2013, 4, 707–715. [Google Scholar]
  44. Hua, Y.; Li, G.Z.; Gao, G.H. Application of Stepping Stone Principle in Design of Nature Reserve. Chin. Wildl. 2013, 4, 30–31. [Google Scholar]
  45. Song, Q.I.; Luo, Z.J.; Chen, Y.Y.; Zhao, J.; Lin, X.X. Construction and optimization of Ecological Network in Yuanzhou District Based on MSPA and the Least-Cost Path Method. Res. Agric. Mod. 2020, 41, 351–360. [Google Scholar]
  46. Zhou, Y.; Zhang, Q.N. Impacts of road networks on species migration and landscape connectivity. Chin. J. Ecol. 2014, 2, 440–446. [Google Scholar]
  47. Hoctor, T.S. Regional Landscape Analysis and Reserve Design to Conserve Florida’s Biodiversity; University of Florida: Gainesville, FL, USA, 2003. [Google Scholar]
Figure 1. Geographical location map of the research area and its land use types (2020).
Sustainability 14 11952 g001
Figure 2. Landscape pattern analysis based on MSPA.
Sustainability 14 11952 g002
Figure 3. Classification of ecological sources and landscape resistance surface.
Sustainability 14 11952 g003
Figure 4. Classification of ecological corridors and distribution of new patches and corridors.
Sustainability 14 11952 g004
Figure 5. (a) Pedal stone distribution. (b) Distribution of ecological fracture points.
Sustainability 14 11952 g005
Table 1. Basic resistance values.
Land TypeWoodlandGrasslandWetlandWaterFarmlandConstruction
Land
Other
Base resistance value350505001001000700
Table 2. Landscape type classification statistics.
Landscape Types 1Area
/km2
Study Area
Area Ratio
Total Ecological Landscape
Area Ratio
Core3954.1931.25%83.51%
Bridge9.180.07%0.19%
Edge610.514.83%12.89%
Loop1.590.01%0.03%
Perforation118.510.94%2.50%
Branch40.880.32%0.86%
Islet0.240.00%0.01%
Total4735.1137.42%
1 Core: large natural patches, which are “sources” of multiple ecological processes to provide habitats or migration destinations for wildlife. Bridge: a channel for species dispersal and energy exchange between adjacent core patches. Edge: the transition zone between the core area and its surrounding construction land. Perforation: the transition zone between the core area and its internal township construction land patch. Loop: corridors connecting the interior of the same core area. Branch: a corridor connecting the core area with the surrounding landscape. Islet: small isolated patches, in which internal and external species are less likely to communicate, often referred to as pedal stone.
Table 3. Patch connectivity indices of 18 core regions.
NodIdIICdPCArea/km2NodIdIICdPCArea/km2
17.7912.3115.23189.88109.0816.2417.89221.39
21.302.052.6331.59111.321.892.3032.26
34.497.449.20109.36121.372.363.0333.39
43.135.496.9276.44133.195.506.6877.70
54.547.618.35110.78141.592.702.9438.87
65.399.6411.36131.411515.7327.4631.01383.57
71.502.633.3536.56165.499.1411.52133.80
829.9055.0156.14729.12171.291.872.4731.38
91.622.803.1939.45181.281.752.3031.27
Table 4. Patch connectivity indices of eighteen core regions.
NO123456789101112131415161718
103374.44013.42395.7289.0467.4235.169.547.147.519.375.671.8135.098.9241.20.10.7
2 0.03984.615,658.2550.51418.01465.8163.7129.3113.845.6206.8207.9380.3253.5666.20.21.6
3 0.06313.8664.61202.6401.585.061.358.523.698.295.2177.5125.2313.90.10.9
4 0.0550.72271.51634.1138.8114.497.038.7182.6184.8338.7219.9585.10.21.3
5 0.0430.096.260.134.240.216.755.249.995.677.5175.50.10.7
6 0.0308.598.267.467.227.3108.2103.3193.8140.8345.50.21.0
7 0.056.955.973.527.241.021.357.050.574.90.00.3
8 0.0292.9204.680.0464.6509.1902.8507.91495.60.32.4
9 0.0252.63113.371.133.792.982.5116.40.10.4
10 0.0190.01107.9303.31167.9720.6889.90.21.4
11 0.060.530.180.573.5105.30.10.4
12 0.0206.89242.32449.51037.20.11.1
13 0.0419.31167.71095.00.10.9
14 0.0426.2829.40.21.5
15 0.03395.60.32.3
16 0.00.65.6
17 0.00.0
18 0
Publisher’s Note: MDPI stays neutral with regard to jurisdictional claims in published maps and institutional affiliations.

