Article

Study on Removal of Methylene Blue by Condensation Self-Assembled Graphene Oxide/Thiourea Composite Adsorbent

1
College of Chemistry and Chemical Engineering, Central South University, Changsha 410083, China
2
College of Chemistry, Chemical Engineering of Hunan Normal University, Changsha 410081, China
3
School of Chemical Engineering, Zhengzhou University, Zhengzhou 450001, China
*
Authors to whom correspondence should be addressed.
Sustainability 2022, 14(22), 15290; https://doi.org/10.3390/su142215290
Submission received: 2 November 2022 / Revised: 10 November 2022 / Accepted: 12 November 2022 / Published: 17 November 2022

Abstract

:
A novel adsorbent (GO-TOA) was prepared by condensation and self-assembly of graphene oxide (GO) and thiourea, and it was characterized systematically. The results revealed that thiourea has anchored on graphene oxide (GO) successfully. The results showed that GO-TOA had a higher adsorption capacity (641.724 mg/g) and adsorption rate (92.32%) than GO (196.8 mg/g and 65.6%), indicating that the introduction of thiourea greatly improved the adsorption capacity of GO. Adsorption kinetics, adsorption thermodynamics isotherm, and adsorption thermodynamics were used to study the adsorption mechanism. The results show that GO-TOA still has an adsorption rate of 90.44% compared with 0 cycles (92.32), indicating that GO-TOA has good activation and regeneration capacity. In addition, ethanol and dilute hydrochloric acid were used for the desorption of MB, and the effect of desorption was found very well. Through reusability experiments, we also found that GO-TOA has excellent application potential. We believe that GO-TOA will be a potential adsorbent for MB.

1. Introduction

The problem of water environment pollution is becoming more and more serious with the rapid development of society [1,2]. Due to the human demand for color, the world printing and dyeing industry has developed rapidly, and the discharge of printing and dyeing wastewater is increasing day by day, resulting in serious water pollution [3,4]. In order to achieve sustainable green development, printing and dyeing wastewater treatment has become a top priority [5,6].
Methylene blue (MB) is a phenothiazine salt, which is widely used in chemical and biological dyes. If MB enters into the water, it not only has mutagenicity, but also makes people feel nausea, dizziness, chest pain and so on [7,8]. At present, there are many treatment methods for MB wastewater at home and abroad, such as photo degradation [9], membrane treatment [10], electrochemical degradation [11], adsorption [12], etc. Among them, adsorption method has the advantages of simple operation, low energy consumption, high purification rate and recyclable organic dyes. However, many adsorption materials are expensive or inefficient. Therefore, the preparation of high-quality and low-cost adsorbents has become an important task for researchers [13,14,15].
Graphene oxide (GO) is the oxide of graphene, which contains a lot of oxygen-containing groups (−OH, −COOH, −C-O-C and −C=O). Therefore, it has strong hydrophilicity and good compatibility with a variety of solvents, so it is often used in water research [16]. Due to its unique properties, GO can not only adsorb metal ions [17], but also adsorb organic compounds [18]. However, GO tends to accumulate between layers, resulting in the decrease of specific surface area and adsorption performance. In addition, GO is difficult to separate from aqueous solution because of its strong hydrophilicity. Therefore, the modification of GO materials has become an upsurge [19,20,21]. Thiourea is an organic compound containing elemental sulfur and nitrogen at low price. It contains two primary amino groups and C=S bond; these groups have good adsorption properties [22,23]. In this paper, thiourea and GO were used for condensation and self-assembly to obtain an adsorption material [24], which was used to adsorb MB dye. In addition, the adsorption behavior, adsorption mechanism and reusability of adsorbents were also explored.

2. Materials and Methods

2.1. Reagent

Graphite powder was purchased from Shanghai Aladdin Chemical Reagent Company (Shanghai, China). Sulfuric acid, phosphoric acid, hydrochloric acid, nitric acid, potassium permanganate, hydrogen peroxide, aqueous ammonia, N, N-dimethylformamide, acetone, ethanol, methylene blue, and sodium chloride were all purchased from Sinopharm Chemical Reagent. Phenylthiourea, N-hydroxysuccinimide and 1-ethyl-(3-dimethylaminopropyl) carbodiimide hydrochloride were purchased from Shanghai Maclean Chemical Reagent. The water used in the experiment was deionized water.

2.2. Synthesis of GO and GO-TOA

In this study, GO was synthesized via the optimized Hummers method. After that, 30 mg GO and 40 mL N, N-dimethylformamide (AR, 99.5%) were added to the round bottom flask, and ultrasonic treatment was carried out for 2 h. Next, 0.575 g of 1-ethyl-(3-dimethylaminopropyl) carbodiimide hydrochloride and 0.345 g of N-hydroxysuccinimide were added to the flask as carboxyl activators, and the reaction was activated under ice bath for 2 h. Following this, 3 mmol thiourea was added, then continued for 24 h at room temperature. In the next step, the product was successively washed with deionized water, acetone and ethanol. Finally, the black foam-like (60 °C, 12 h) [24].

2.3. Characterization

The morphology and photoelectronic structure of the material surface were characterized by field emission scanning electron microscopy (SEM; Hitachi SU8220, Hong Kong, China) and X-ray photoelectron spectroscopy (XPS; Thermo Fisher Science ESCALAB 250Xi, Waltham, MA, USA). The functional groups and crystalline structures of the materials were characterized by Fourier infrared spectrophotometer (FTIR; Thermo Fisher Science FTIR-7600) and a Bruker X-ray polycrystalline diffraction/Cu target (XRD; D8 Discover Bruker AXS D8 Discover, Billerica, MA, USA). Laser micro-Raman spectrometer (Raman; Thermo Fisher DXR) and a dual-beam UV-Vis spectrometer (UV; Hach DR6000, Ames, IA, USA) were used to confirm the successful synthesis of the materials. In order to further prove that the materials were successfully synthesized, a thermogravimetric analyzer (TGA; NETZSCH STA409PC, NETZSCH, Netzsh, Germany), Brunauer-Emmett-Teller (BET; Micromeritics ASAP2020, Hong Kong, China) and Contact angle measurement (JY-82B Kruss DSA, Guangzhou, China) were used to characterize it.

2.4. Adsorption

In this case, 50 mL of MB (140 mg/L) solution with a certain concentration and 10 mg of adsorbent were successively added to a 150 mL Erlenmeyer flask. NaOH (0.5 mMol) and HNO3 (0.5 mMol) were used to adjust the pH value of the solution (pH was adjusted before adding adsorbent). Next, the Erlenmeyer flask was placed in a dark constant temperature (25 °C) shaker box and shaken at 120 rpm for 2 h. After the equilibration time, the concentration of MB dye in the supernatant solution was measured by a dual-beam ultraviolet-visible spectrometer. The adsorption amount Qe and the adsorption rate Re were calculated by the following two formulas:
Q e = C 0 C e m × V
  R e = C 0 C e C 0 × 100 %
In the above formula, C0 (mg/L) and Ce (mg/L) represent the concentration of the MB dye before and after adsorption, respectively. V (L) represents the volume of the MB solution, and m represents the amount of the adsorbent added.

3. Results and Discussion

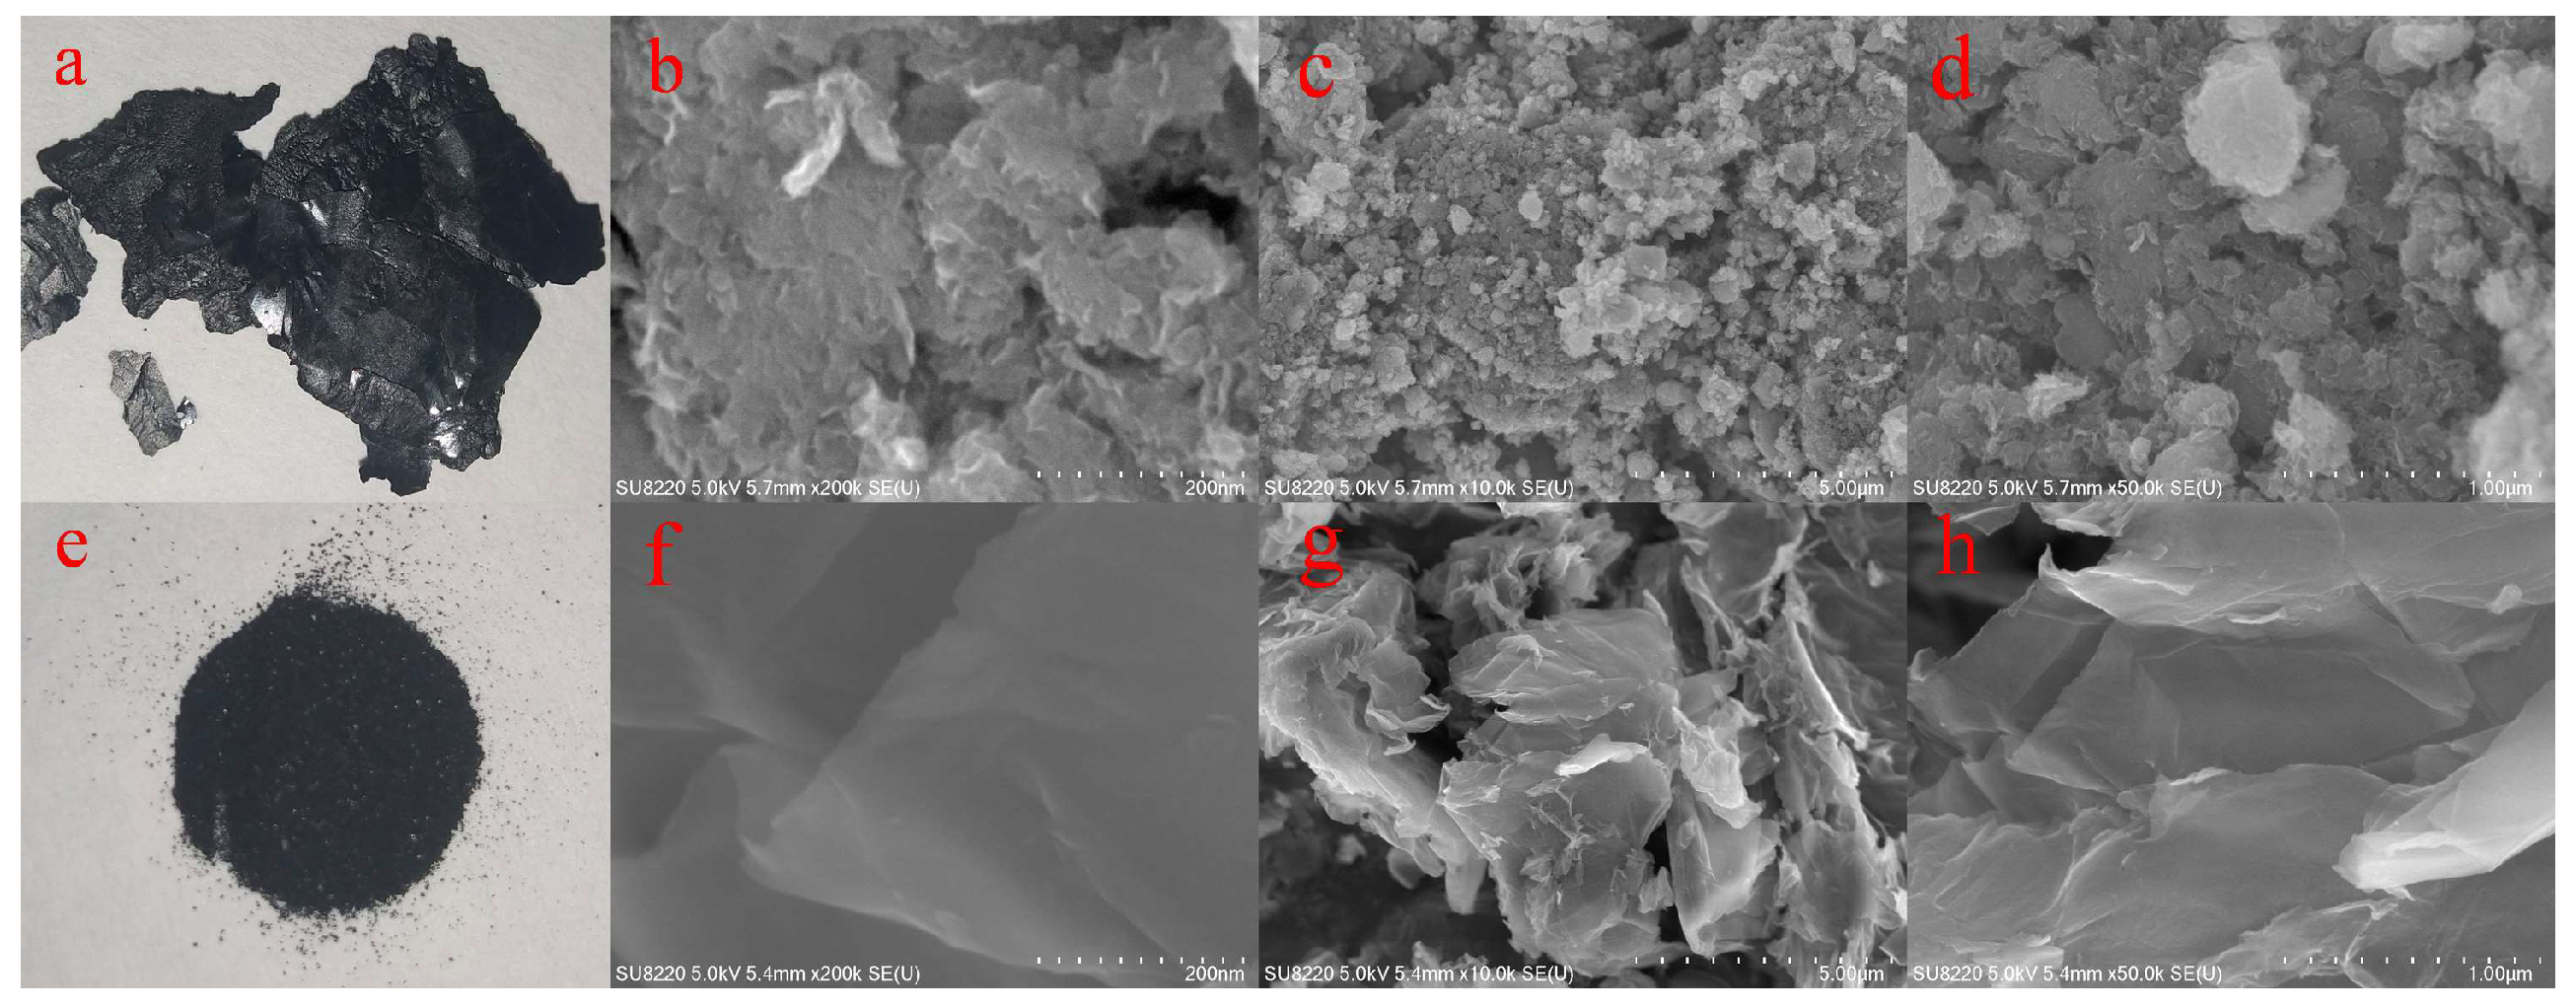
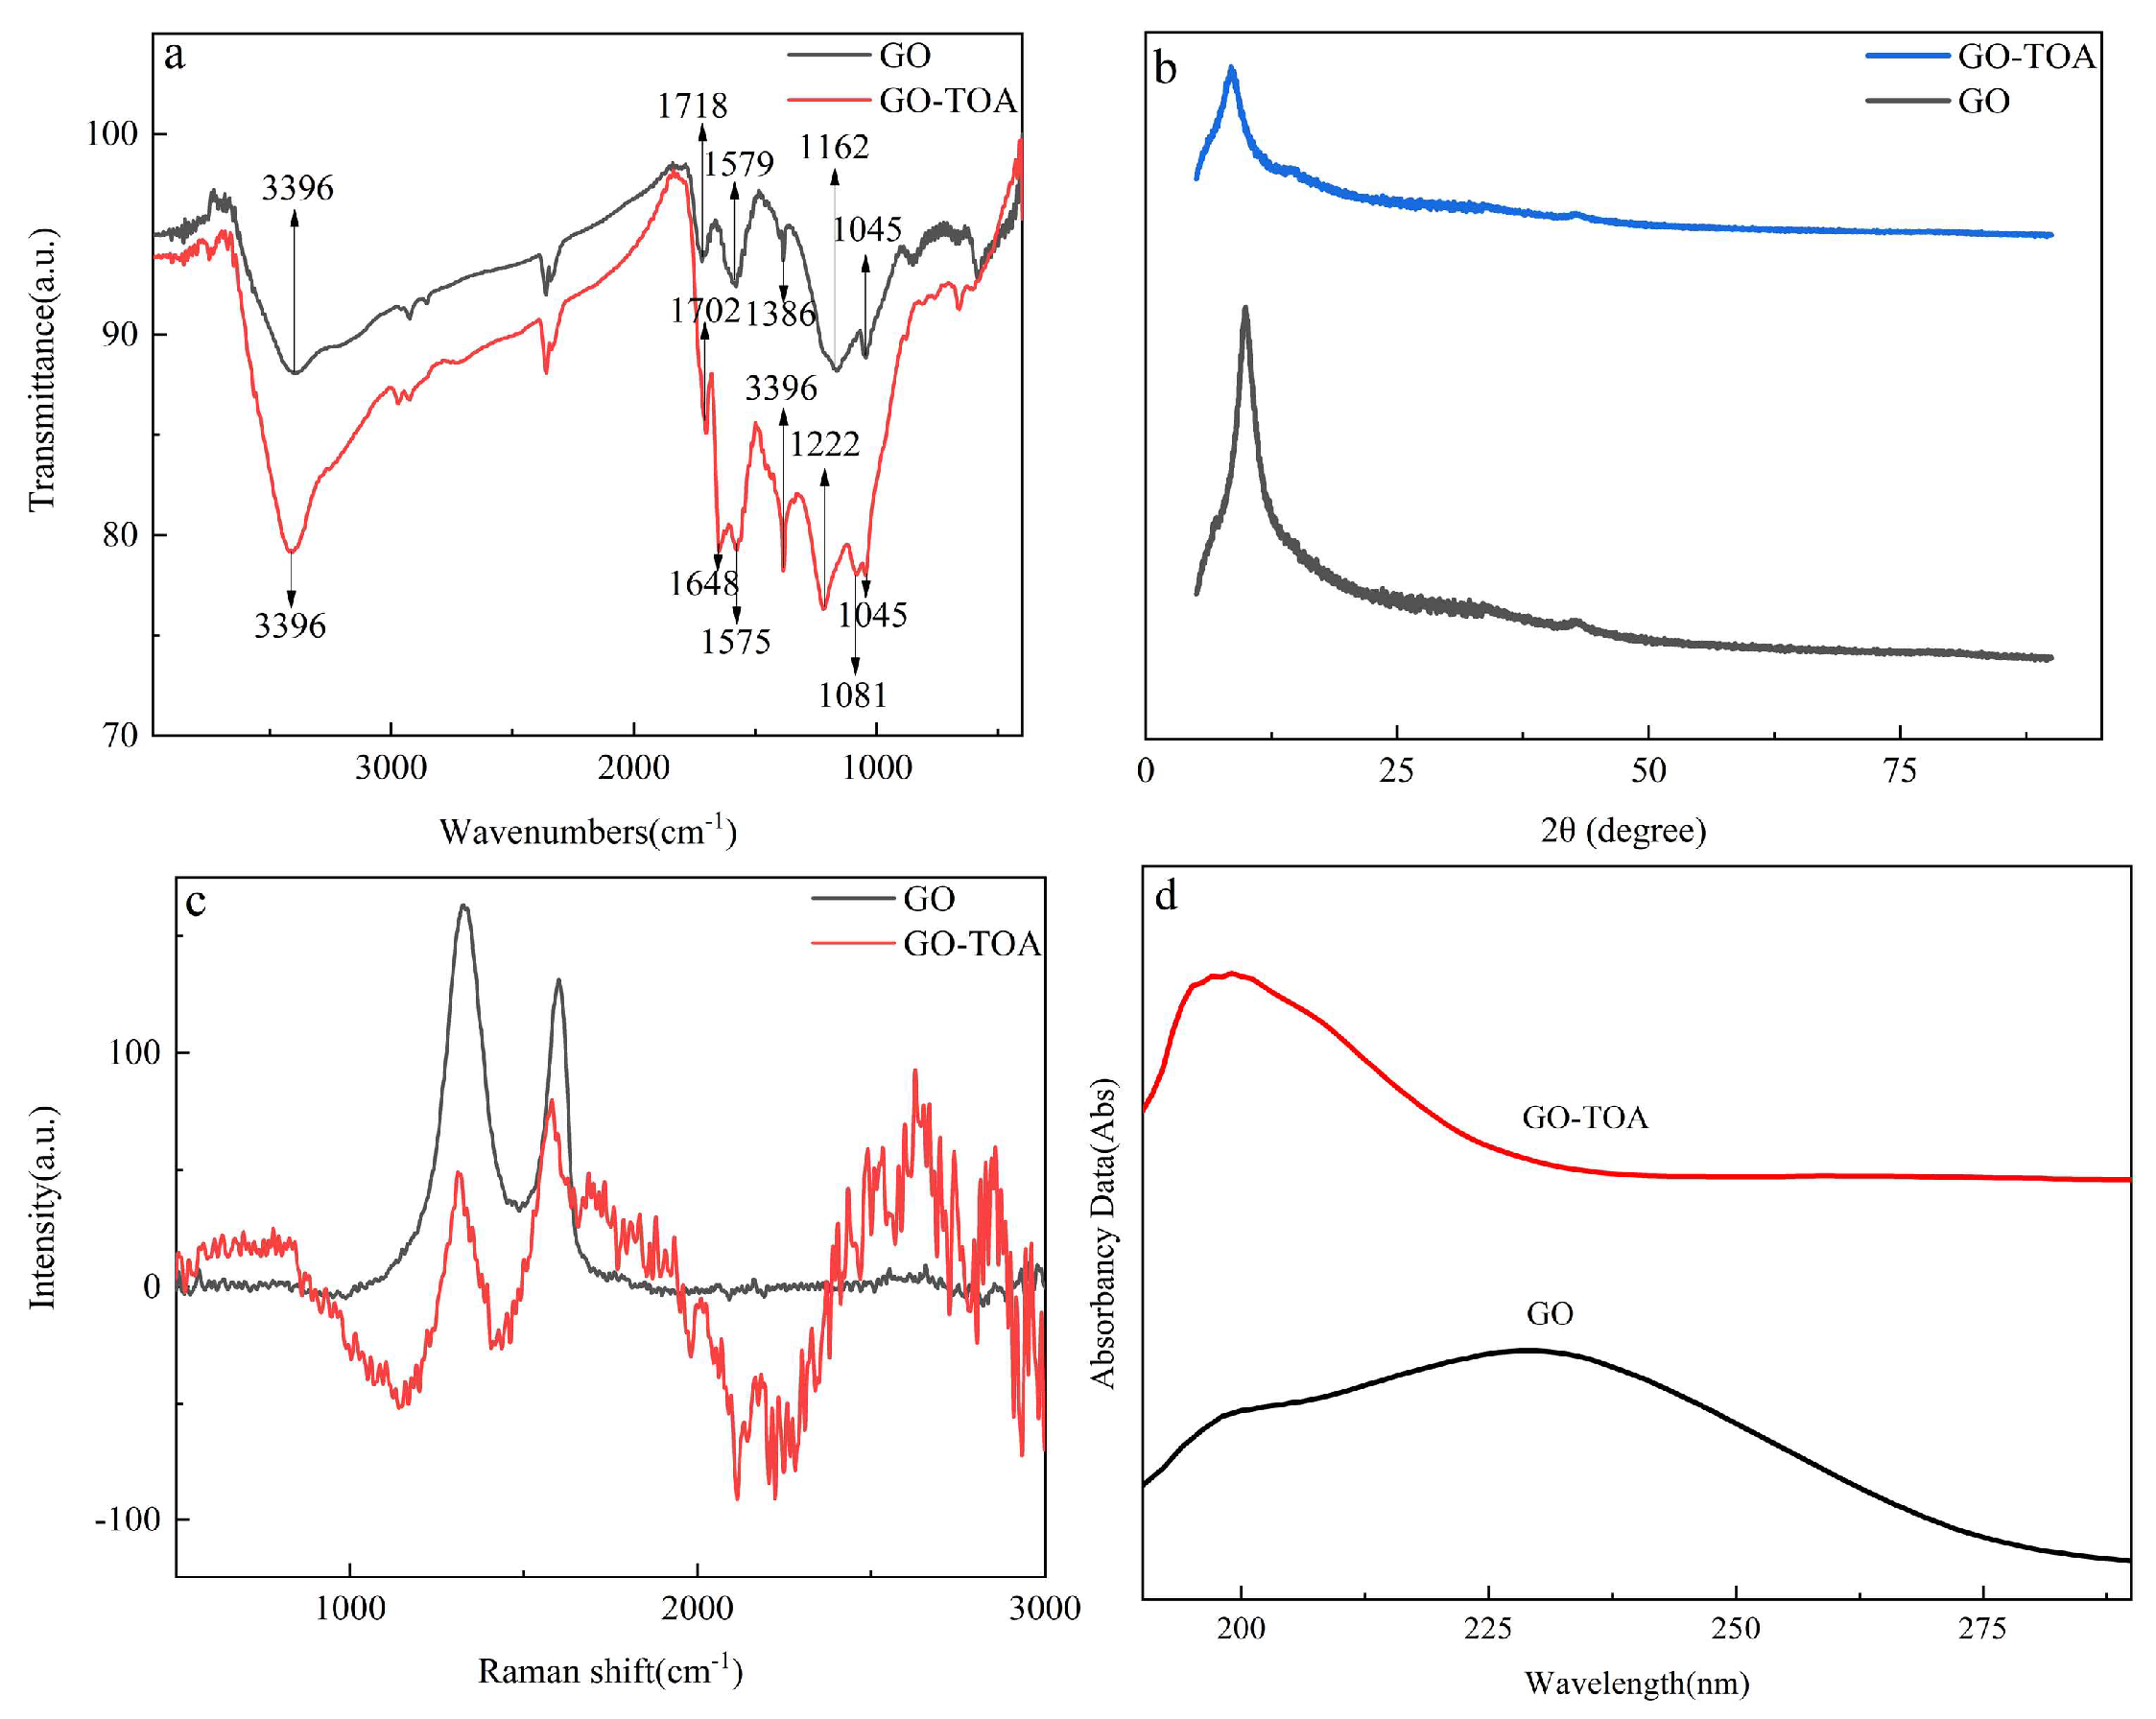
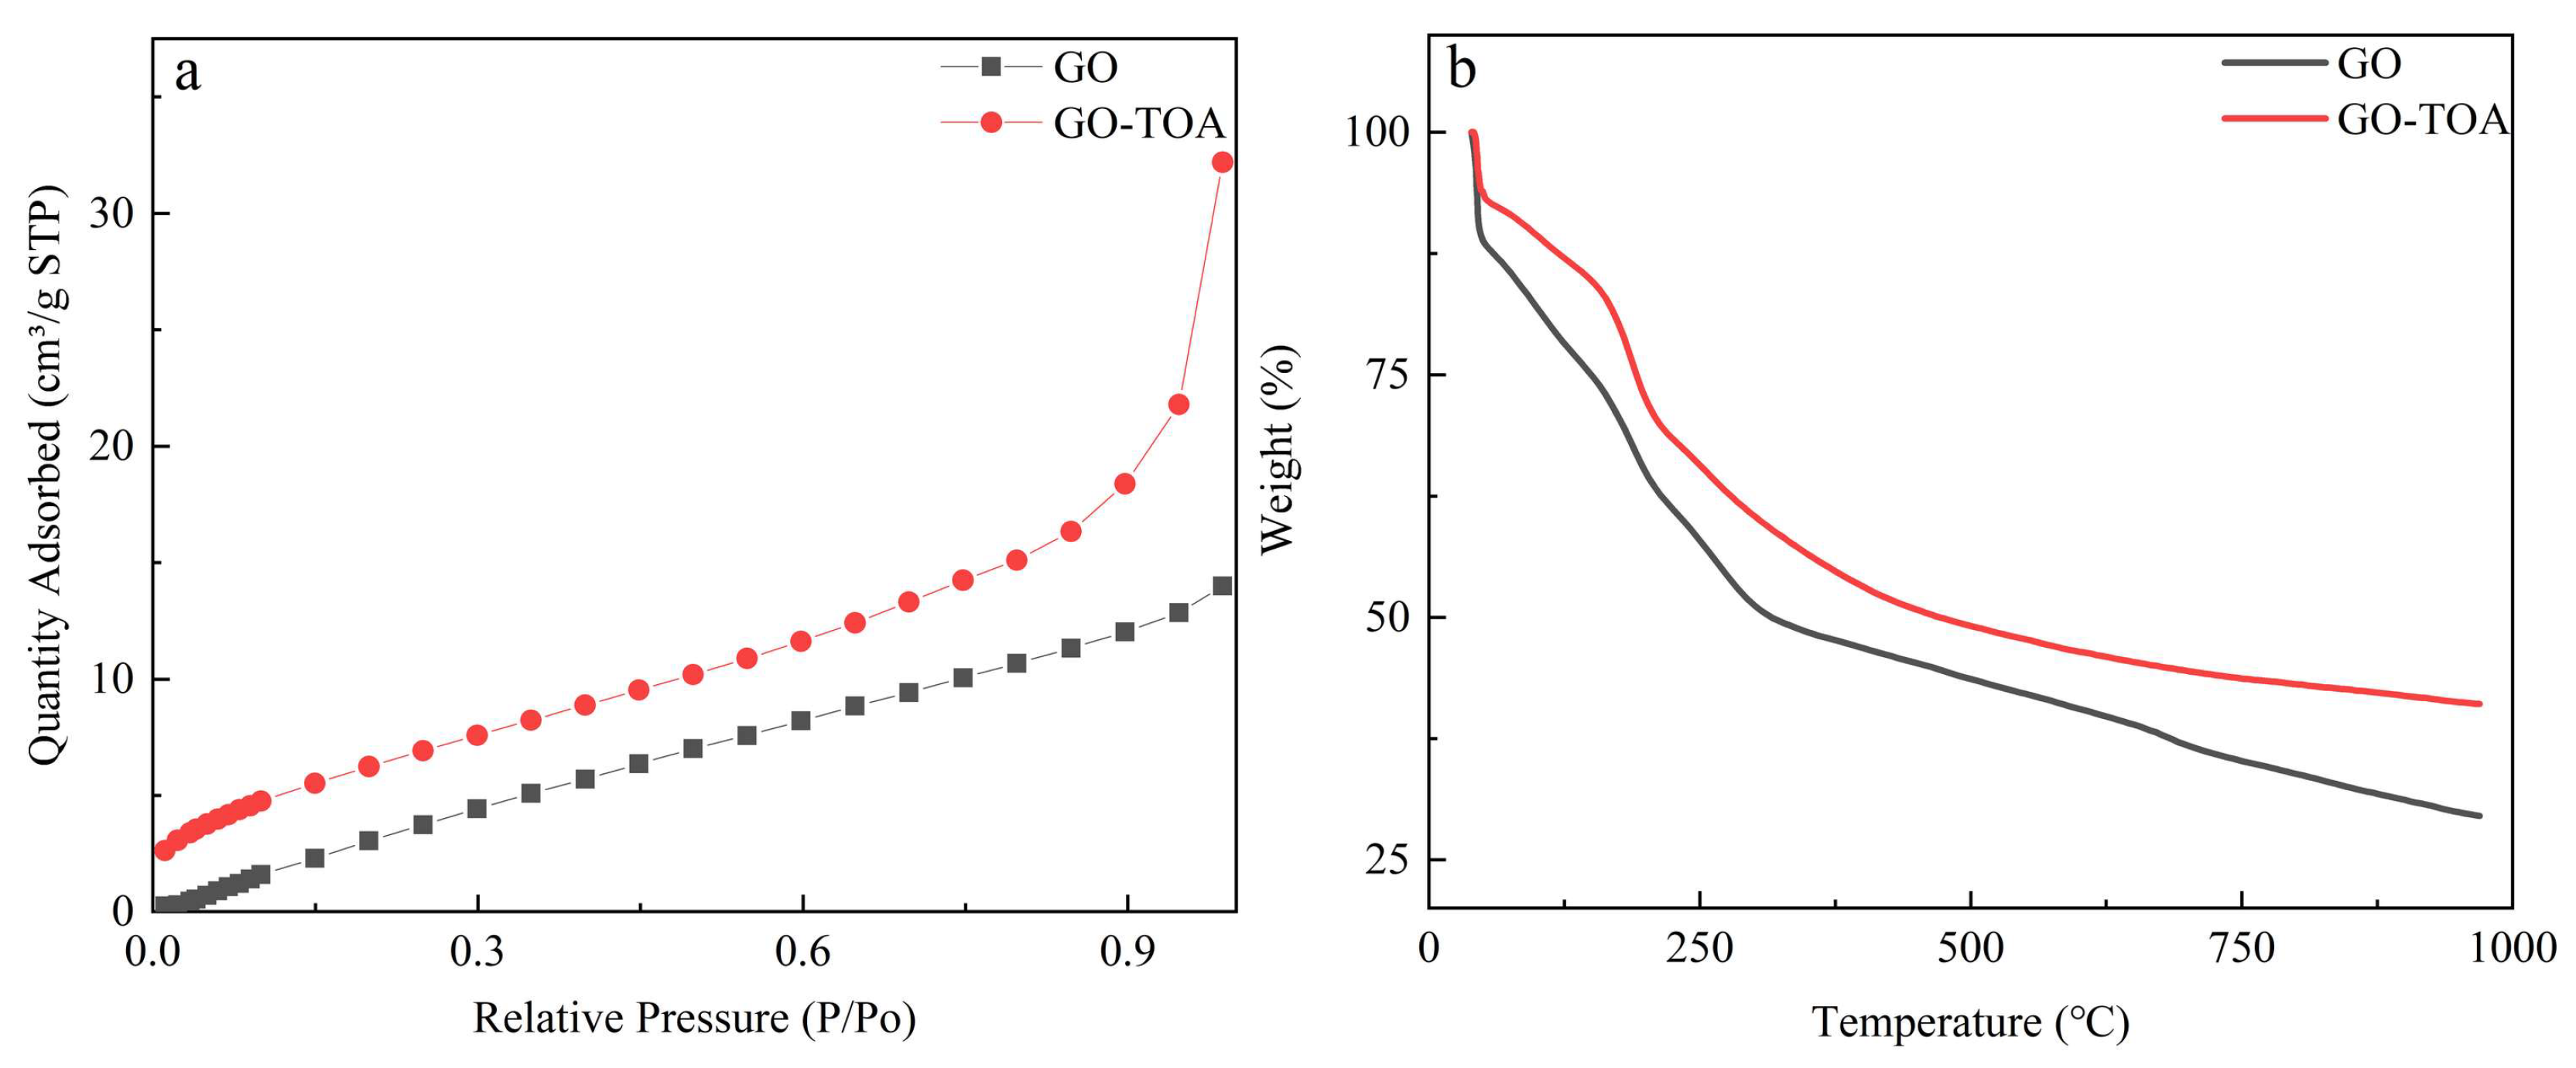
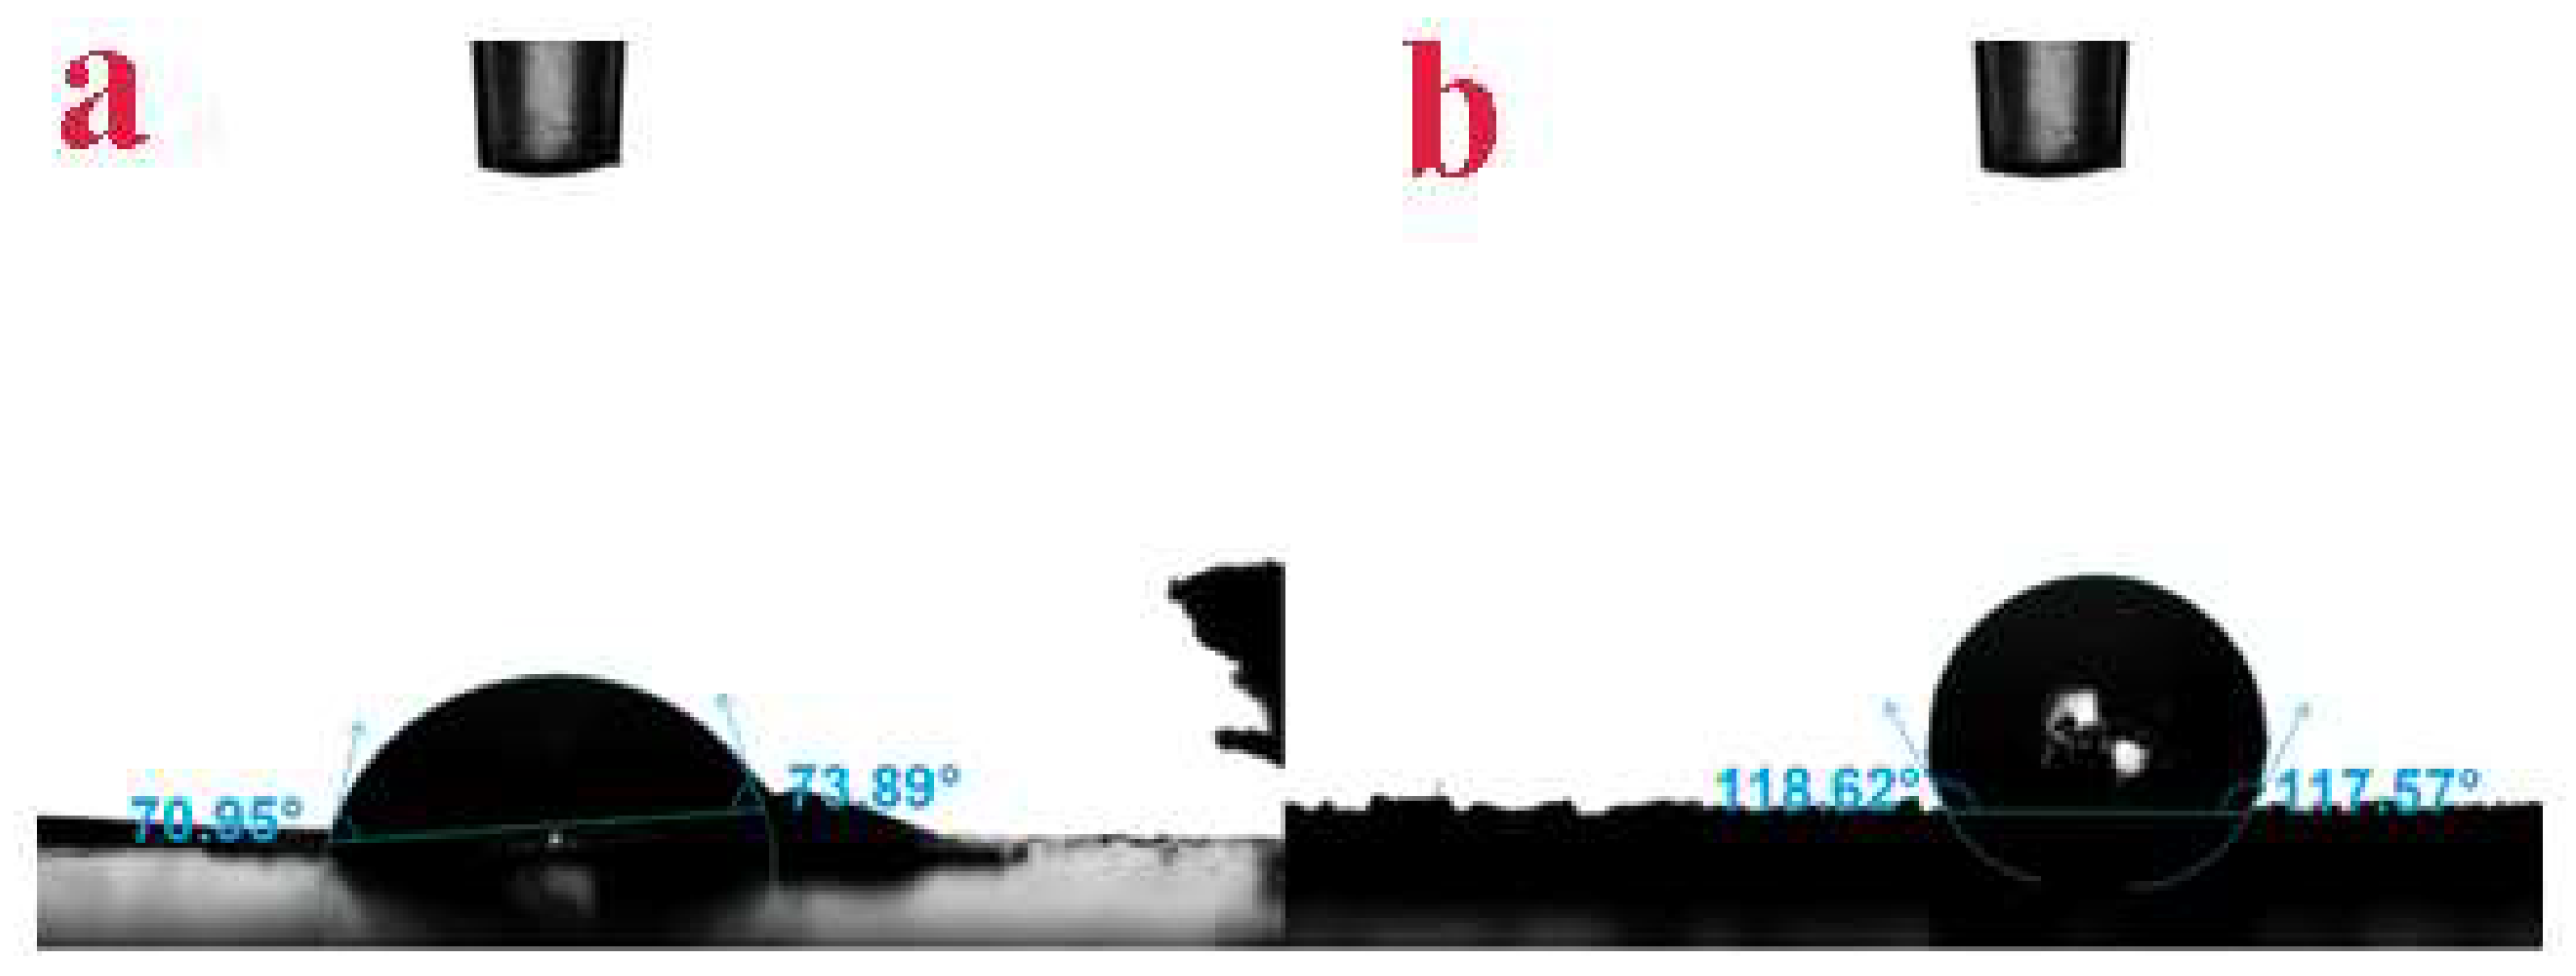
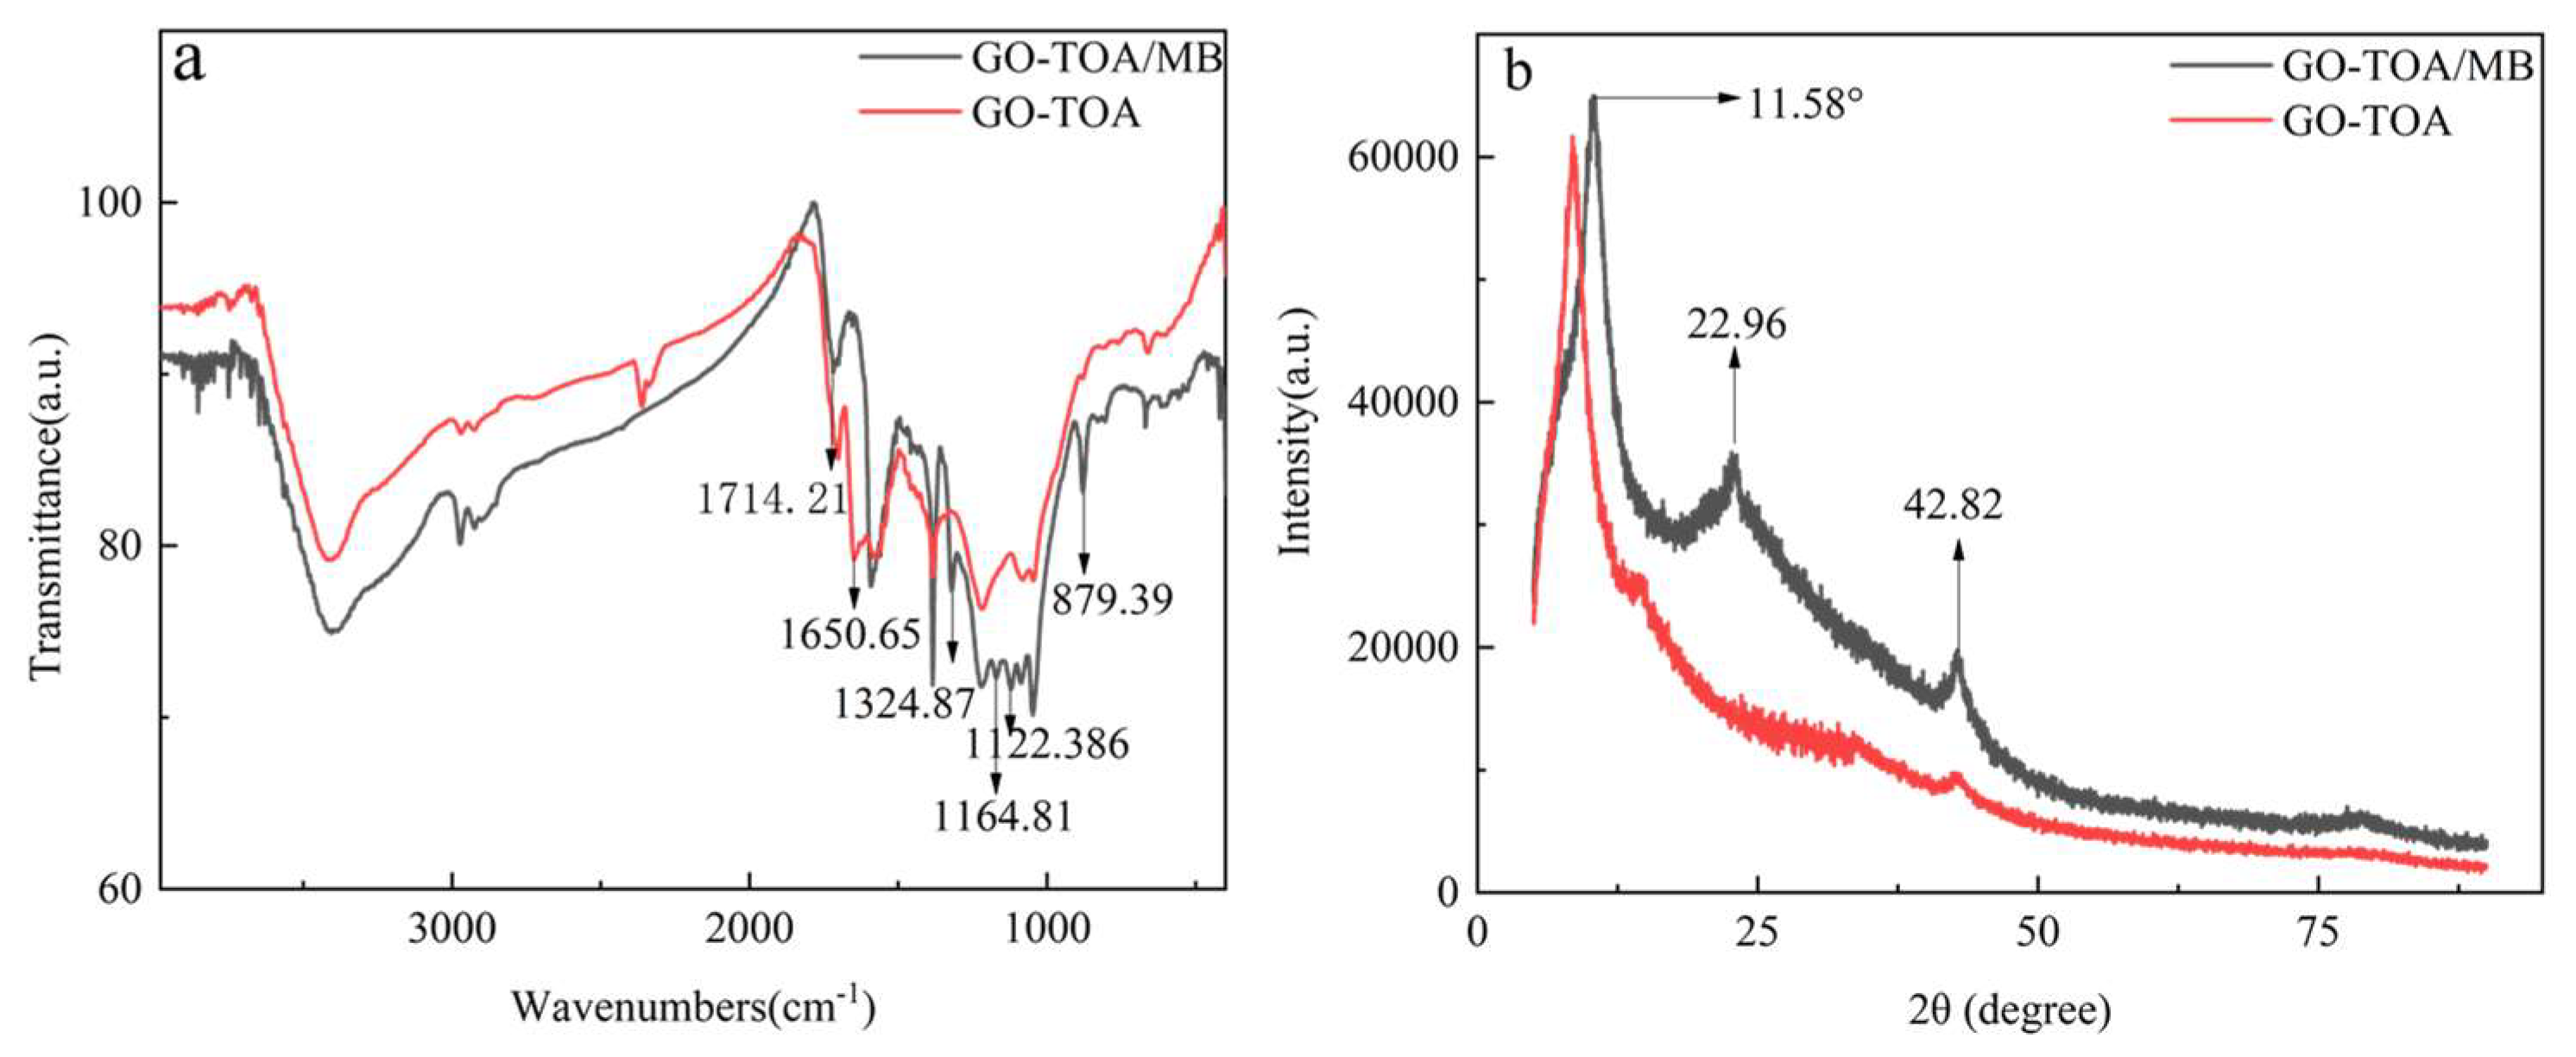
3.1. Characterization of Adsorbents

Figure 1a (GO) and Figure 1e (GO-TOA) show the camera photos before and after GO modification. It can be seen from camera photos that the GO was changed from a typical sheet shape to a powder form after self-assembly [24]. Figure 1b–d show the SEM images of GO under the different magnitudes of enlargement conditions, where Figure 1b–d are SEM images with dimensions of 200 um, 5 um, and 1 um, respectively. It can be seen from the Figure that GO has the same multilayer structure as previously reported [25]. Figure 1f–h show the SEM images of GO-TOC under the different magnitudes of enlargement conditions, where Figure 1f–h are SEM images with dimensions of 200 um, 5um, and 1um, respectively. It can be seen from the Figure that GO-TOA exhibits a single-layer structure and a porous structure. Therefore, it indicates that the material is successfully synthesized.
It can be seen from Figure 2 that the XPS spectrum of GO-TOA produces a new N 1s peak (5.18% N atom) at 400.08 eV compared with GO (Figure 2a). Figure 2b shows that GO has three typical C 1s peaks C-C, C-O, C=O, corresponding to 284.48, 286.68, and 285.13 eV, respectively. Figure 2c shows that the carboxyl group of GO was replaced by the amide group due to the introduction of thiourea, and the ratio of C/O increased from 1.98 to 2.876 [24]. As can be seen from Figure 2c, GO-TOA produced a new C-N bond at 285.13 eV. As can be seen from Figure 2d, GO-TOA has two N 1s peaks, a primary amino-N group on thiourea at 401.6 eV, and an amide-N peak at 399.6 eV.
Figure 3a shows the infrared absorption spectra of GO and GO-TOA. At 3396 and 1386 cm−1 were the −OH stretching vibration peak and -OH bending vibration peaks, respectively. At 1718 cm−1, it is the C=O bending vibration peak of GO. 1579 cm−1 is the bending vibration peak of C=C on the benzene ring. At 1162 and 1045 cm−1 are typical C-O and C-O-C stretching vibration peaks. These typical peaks fully prove the synthesis of GO [26]. According to the infrared spectrum of GO-TOA, the peak at 1718 cm−1 disappeared, indicating the carboxyl bond of GO was destroyed [24]. On the contrary, two new peaks are generated at 1702, 1648, and 1575 cm−1, representing the C=O stretching vibration peak of amide, the N-H bending vibration absorption peak of primary amine, and the stretching vibration peak of the C-N bond. In addition, a sharp new peak appears at 1222 and 1081 cm−1, which may belong to the C=S and S-H stretching vibration peaks [24]. These data fully show that the material has been successfully synthesized.
As can be seen from Figure 3b, there is a sharp peak at 2θ = 10.1°, which is a typical crystal face peak of GO [27]. After the introduction of thiourea, the peak at 2θ = 10.1° was red-shifted to 9.70°, and the intensity of the peak was slightly lowered, indicating the crystal plane structure of the substance changed after the introduction of thiourea [24,27]. Therefore, the synthesis of GO-TOA was sufficiently confirmed.
In order to further prove that the product GO-TOA was successfully synthesized, Raman spectroscopy and UV spectroscopy were used to characterize the product. The typical D and G peaks of GO appear at 1325 and 1597 cm−1, respectively (Figure 3c). The D-peak (1325 cm−1) represents the lattice defect of the C atom, and the G-peak (1597 cm−1) represents the in-plane stretching vibration of the C atom sp2 hybridization. After the introduction of thiourea, the D peak was at 1318 cm−1, while the G peak was at 1581 cm−1. The ratio of ID/IG of GO is 1.25, while the ratio of GO-TOA is reduced to 0.59, indicating that the defect density of the product becomes smaller. According to the UV spectrum of Figure 3d, the typical carboxyl peak of GO disappears at 230 nm [28], and a new absorption peak occurs at 199 nm. These phenomena fully show that thiourea was successfully introduced into GO.
In order to further prove the successful introduction of thiourea, Brunauer Emmett teller and thermogravimetric analysis were used to characterize GO-TOA. It can be seen from Figure 4a and Table 1 that all pore structure parameters and N2 adsorption capacity of GO-TOA are increased compared with GO. As can be seen from Figure 4b, the quality is reduced due to the evaporation of moisture on the surface of the GO before 100 °C. At about 200 °C, the quality rapidly decreases due to the thermal decomposition of the oxy-gen-containing functional groups on the surface of the GO. At about 300 °C, the quality of the carbon skeleton is significantly reduced due to the thermal cracking of the carbon skeleton [29]. After the introduction of thiourea, the oxygen-containing functional group of GO is reduced. Therefore, the degree of mass reduction between 150 and 300 °C is weakened. It can also be seen from Table 2 that GO-TOA is successfully synthesized. In addition, we also used contact angle tester to prove that the material was successfully synthesized. It can be seen from Figure 5 that the contact angle between GO and water is 70.95° to 73.89°. However, the contact angle between GO-TOA and water is 117.57° to 118.62°. This phenomenon not only proved that the material was successfully synthesized but also solved the problem of separation of GO in aqueous solution [24,27].
In conclusion, GO-TOA materials were successfully synthesized.

3.2. Effect of Adsorption Parameters

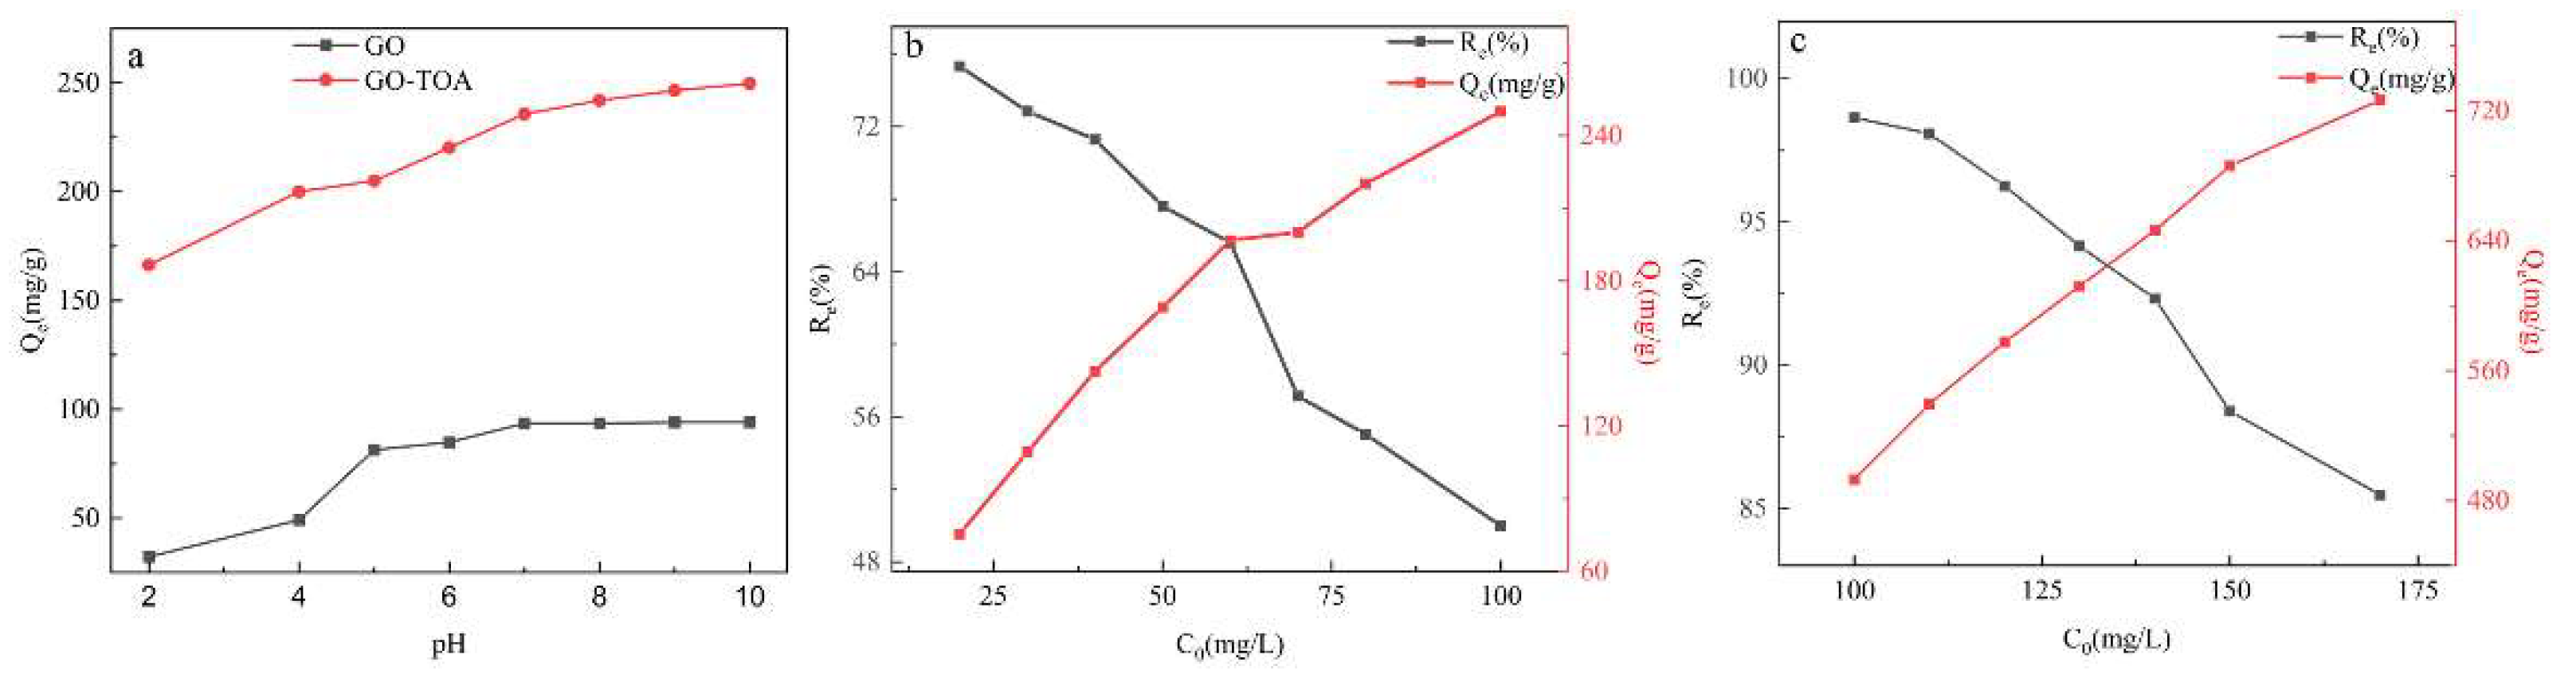
3.2.1. Effect of pH and Initial Concentration

It is well known that pH is a key parameter in the adsorption process [30]. It can be seen from Figure 6 that the adsorption capacity of GO and GO-TOA increases with the increase of pH, which may be due to the negative charge on the surface of the material under alkaline conditions, resulting in electrostatic adsorption with cationic dye MB. On the contrary, the surface of GO and GO-TOA is positively charged under acid condition, which results in electrostatic repulsion with MB [24]. In addition, a blank sample without adsorbent (GO, GO-TOA) is set in all pH experiments in this paper. The adsorption capacity and rate were obtained by subtracting the system without adsorbent from the system with adsorbent. However, if the pH is too high, the dye will precipitate. Therefore, the optimum adsorption pH is 10.
It can be clearly seen from Figure 6 that the adsorption amounts of GO and GO-TOA increase with the increase of the initial MB concentration, but the adsorption rate decreases. It can be concluded from the figure that when the concentration of MB is 60 mg/L, the adsorption capacity and adsorption rates of GO are the highest, being 196.8 mg/g and 65.6%, respectively. When the concentration of MB was 140 mg/L, the adsorption capacity and adsorption rates of GO-TOA were the highest, being 641.724 mg/g and 92.32%, respectively. Therefore, the adsorption performance of GO after self-assembly is greatly improved.

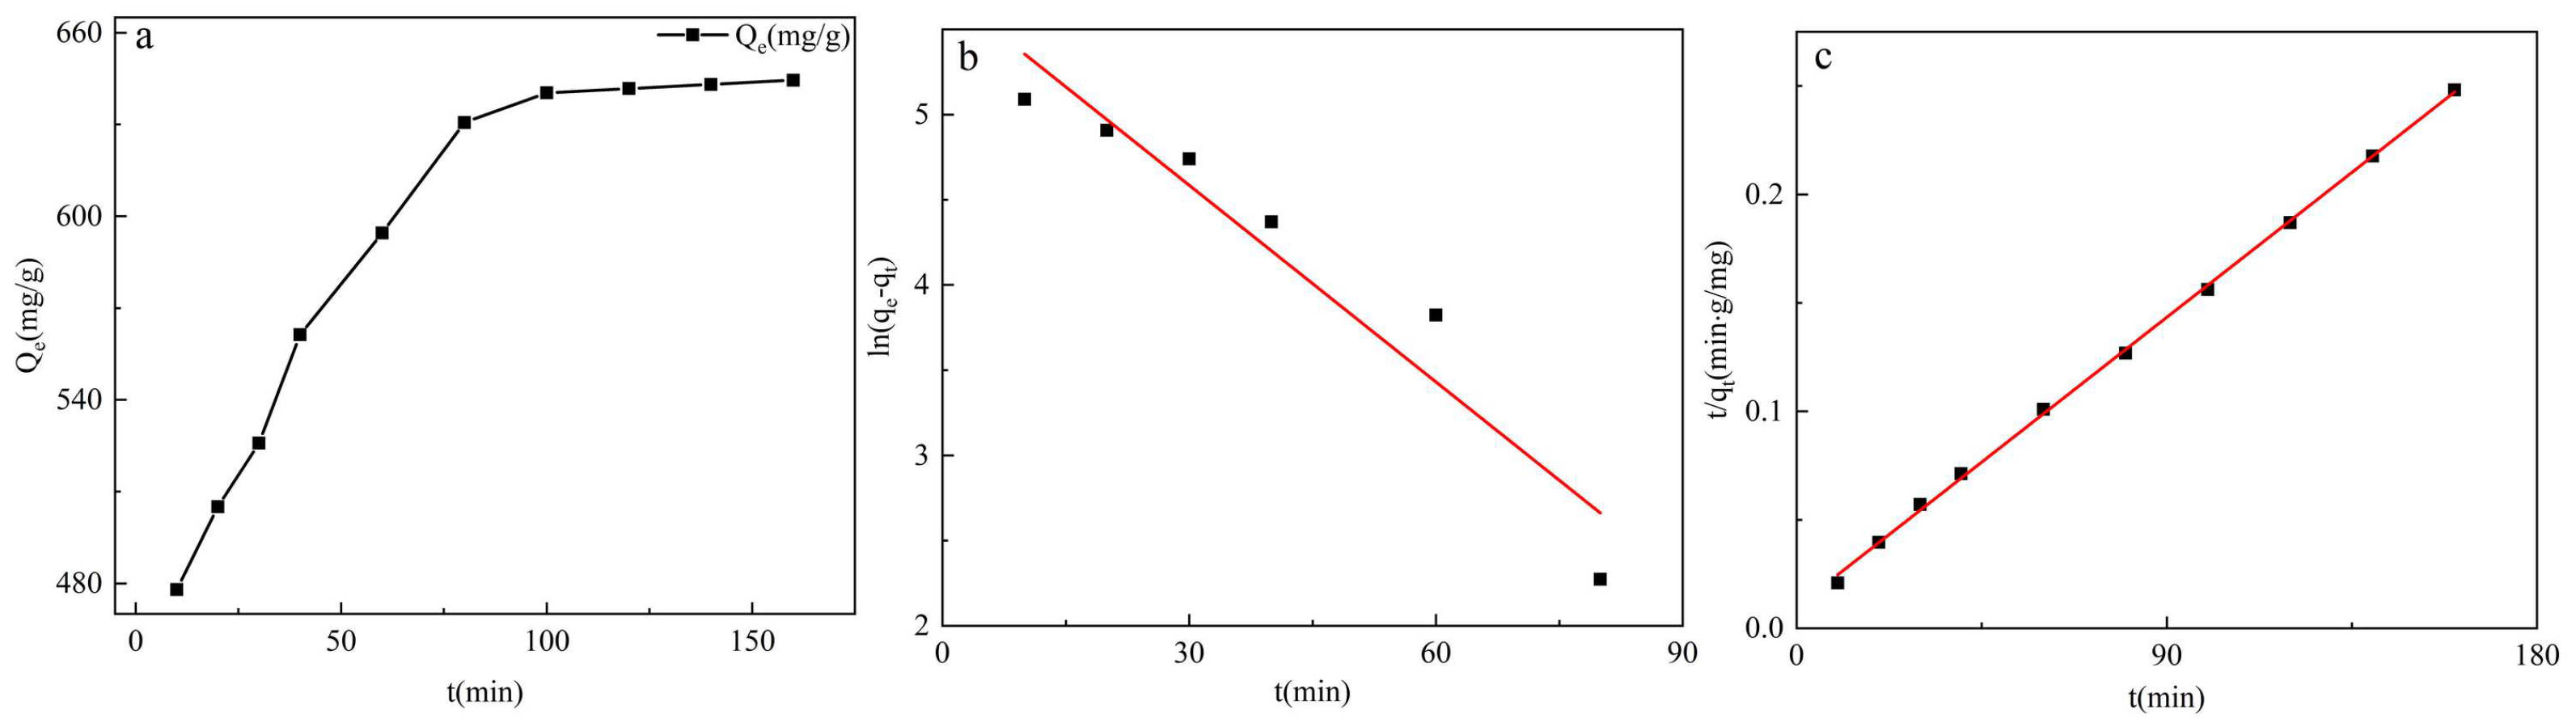
3.2.2. Adsorption Time and Kinetics

It can be seen from Figure 7a that the adsorption capacity has reached 477.998 mg/g when the time is 10 min, and the adsorption capacity of GO-TOA was increased with the passage of time. The adsorption capacity tends to balance when the time is more than 100 min.
In order to explore the adsorption behavior of GO-TOA, two commonly used kinetic model equations are used (pseudo-first-order (3) and pseudo-second-order (4)) [24], and the equations are as follows:
l n q e q t = l n q e K 1 t
  t / q t = 1 / k 2 q e 2 + t / q e
In the formula, qe belongs to the adsorption capacity at adsorption equilibrium, and qt represents the adsorption capacity at a certain time. K1 and K2 are the adsorption rate constants of adsorption kinetics, respectively [24,27].
Figure 7 and Table 3 were obtained using a linear fit of the kinetic formula. It can be seen from Figure 7b,c that the linear fit of the pseudo-second-order kinetics is significantly higher than the pseudo-second-order kinetics. In addition, the actual adsorption amount of GO-TOA was 641.724 mg/g, and the adsorption amounts of pseudo-first-order kinetics and pseudo-second-order kinetics were 311.064 mg/g and 675.676 mg/g, respectively. Moreover, compared with the pseudo-first-order dynamic linear correlation coefficient R2 (0.901), the pseudo-second-order dynamic correlation coefficient R2 (0.999) is closer to 1. Therefore, the adsorption of MB by GO-TOA conforms to the pseudo-second-order kinetic model, and its adsorption rate is controlled by the chemical adsorption mechanism. Moreover, there is the phenomenon of electron transfer and coexistence between adsorbent and adsorbate [31].

3.2.3. Temperature and Adsorption Isotherm

In order to better understand the interaction behavior between adsorbent (GO-TOA) and adsorbate (MB) molecules, the Langmuir (5) and Freundlich (6) adsorption isotherm models were used. The two formulas are as follows:
C e / q e = C e / q m + 1 / q m k L
q e = K F ( C e ) 1 / n
where qe and Ce represent the adsorption capacity and residual MB concentration in the adsorption equilibrium solution, respectively. The qm represents the theoretical maximum adsorption capacity of the adsorbent. KL and KF represent the Langmuir adsorption energy constant and Freundlich adsorption equilibrium constant, respectively. In this case, 1/n is another constant in the Freundlich isotherm model [24,27].
Figure 8 shows that the linear fit of the Langmuir adsorption isotherm model is higher than the Freundlich adsorption isotherm. The linear correlation coefficient R2 (0.999) of Langmuir is much higher than Freundlich (0.895) (Table 2). Therefore, the adsorption behavior of GO-TOA is more suitable for the Langmuir adsorption isotherm model. Thus, MB molecule is monolayer adsorbed on the surface of GO-TOA, and its adsorption sites are uniform, and there is no adsorption competition between adsorbate molecules. [31]. Moreover, the 1/n value is 0.096, so the adsorption is advantageous [32].
In order to study the adsorption mechanism further, a thermodynamic formula is used. The formula is as follows [24]:
  K D = Q e C e
Δ G = R T   I n K D
Δ G = Δ H T Δ S
where qe and Ce represent the adsorption capacity and residual MB concentration in the adsorption equilibrium solution, respectively. KD represents the adsorption thermodynamic equilibrium constant, ΔG is the adsorption standard Gibbs free energy variable, R is the gas molar constant, T is the absolute temperature, ΔH is the change in equivalent adsorption enthalpy, and ΔS is the change in adsorption standard entropy [27].
Figure 8 and Table 4 were obtained using a linear fit of the thermodynamic formula. As can be seen from Figure 8a, the adsorption capacity gradually increases with the temperature height, suggesting that the adsorption is an endothermic reaction. Since ΔH and ΔS are positive values, it indicates that the adsorption behavior is an endothermic physical adsorption process. In addition, a negative value of ΔG indicates that the adsorption behavior is spontaneous [33].

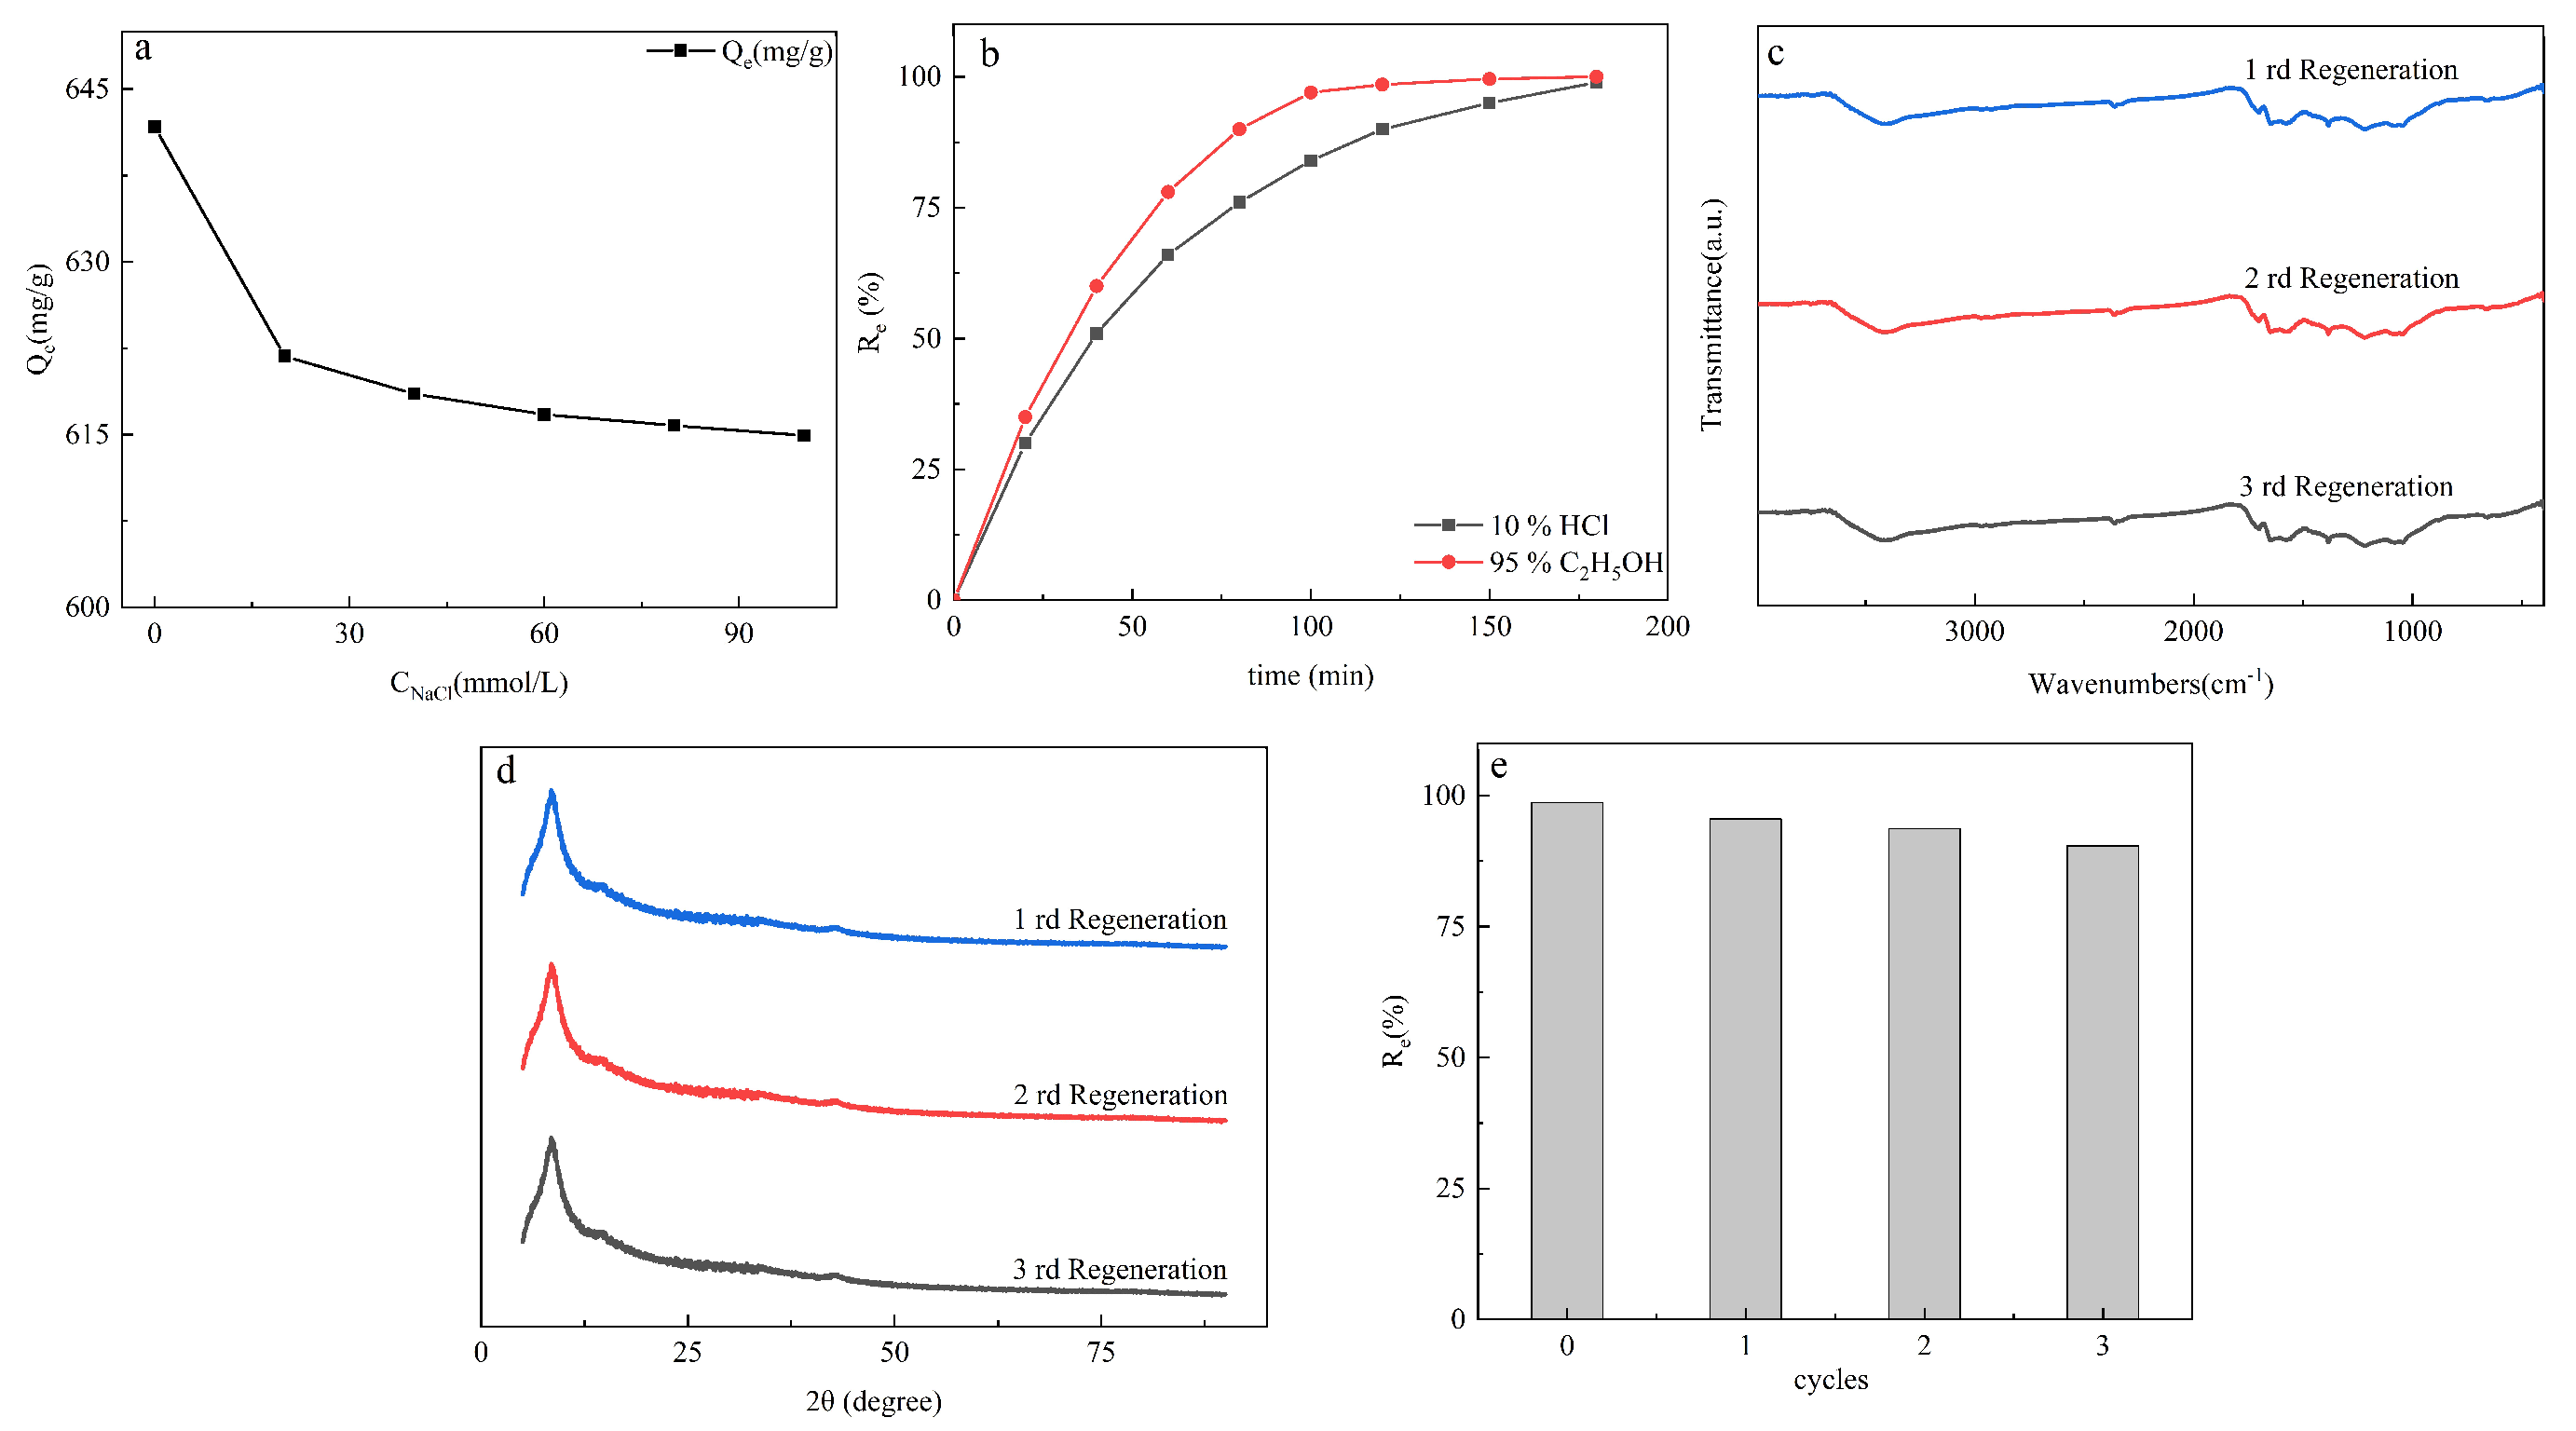
3.2.4. Effect of Salt Ion Concentration

Salt ion concentration is an important parameter in the adsorption process [34]. Figure 9a shows that with the increase of NaCl concentration, the adsorption capacity decreases gradually and finally tends to equilibrium. There may be two reasons for this. Firstly, chloride ion can shield the positive charge on MB surface and inhibit the adsorption reaction caused by electrostatic adsorption [35]. Secondly, the thickness of the double layer (EDL) of the hydrated particles was reduced, resulting in a decrease in dye adsorption rate [36,37].

3.3. Regeneration of GO-TOA

The regeneration performance of adsorbent is one of the key factors to evaluate an excellent adsorbent [24]. In this experiment, 10% hydrochloric acid solution and 95% ethanol were used to desorption MB from GO-TOA. However, we can see from Figure 9b and Table 5 that 95% ethanol is a good choice for MB desorption compared with 10% hydrochloric acid, because the desorption time of ethanol is shorter, and ethanol can be easily recovered by heating and evaporation. On the contrary, 10% hydrochloric acid will introduce chloride ions, which will lead to secondary pollution sources. Therefore, we choose 95% ethanol as desorption agent. It is apparent from Figure 9c,d that the structure of GO-TOA is substantially unchanged after three regeneration cycles, and the adsorption rate is still as high as 90.44% (Figure 9e and Table 5). These data fully demonstrate that GO-TOA is a promising MB adsorbent.

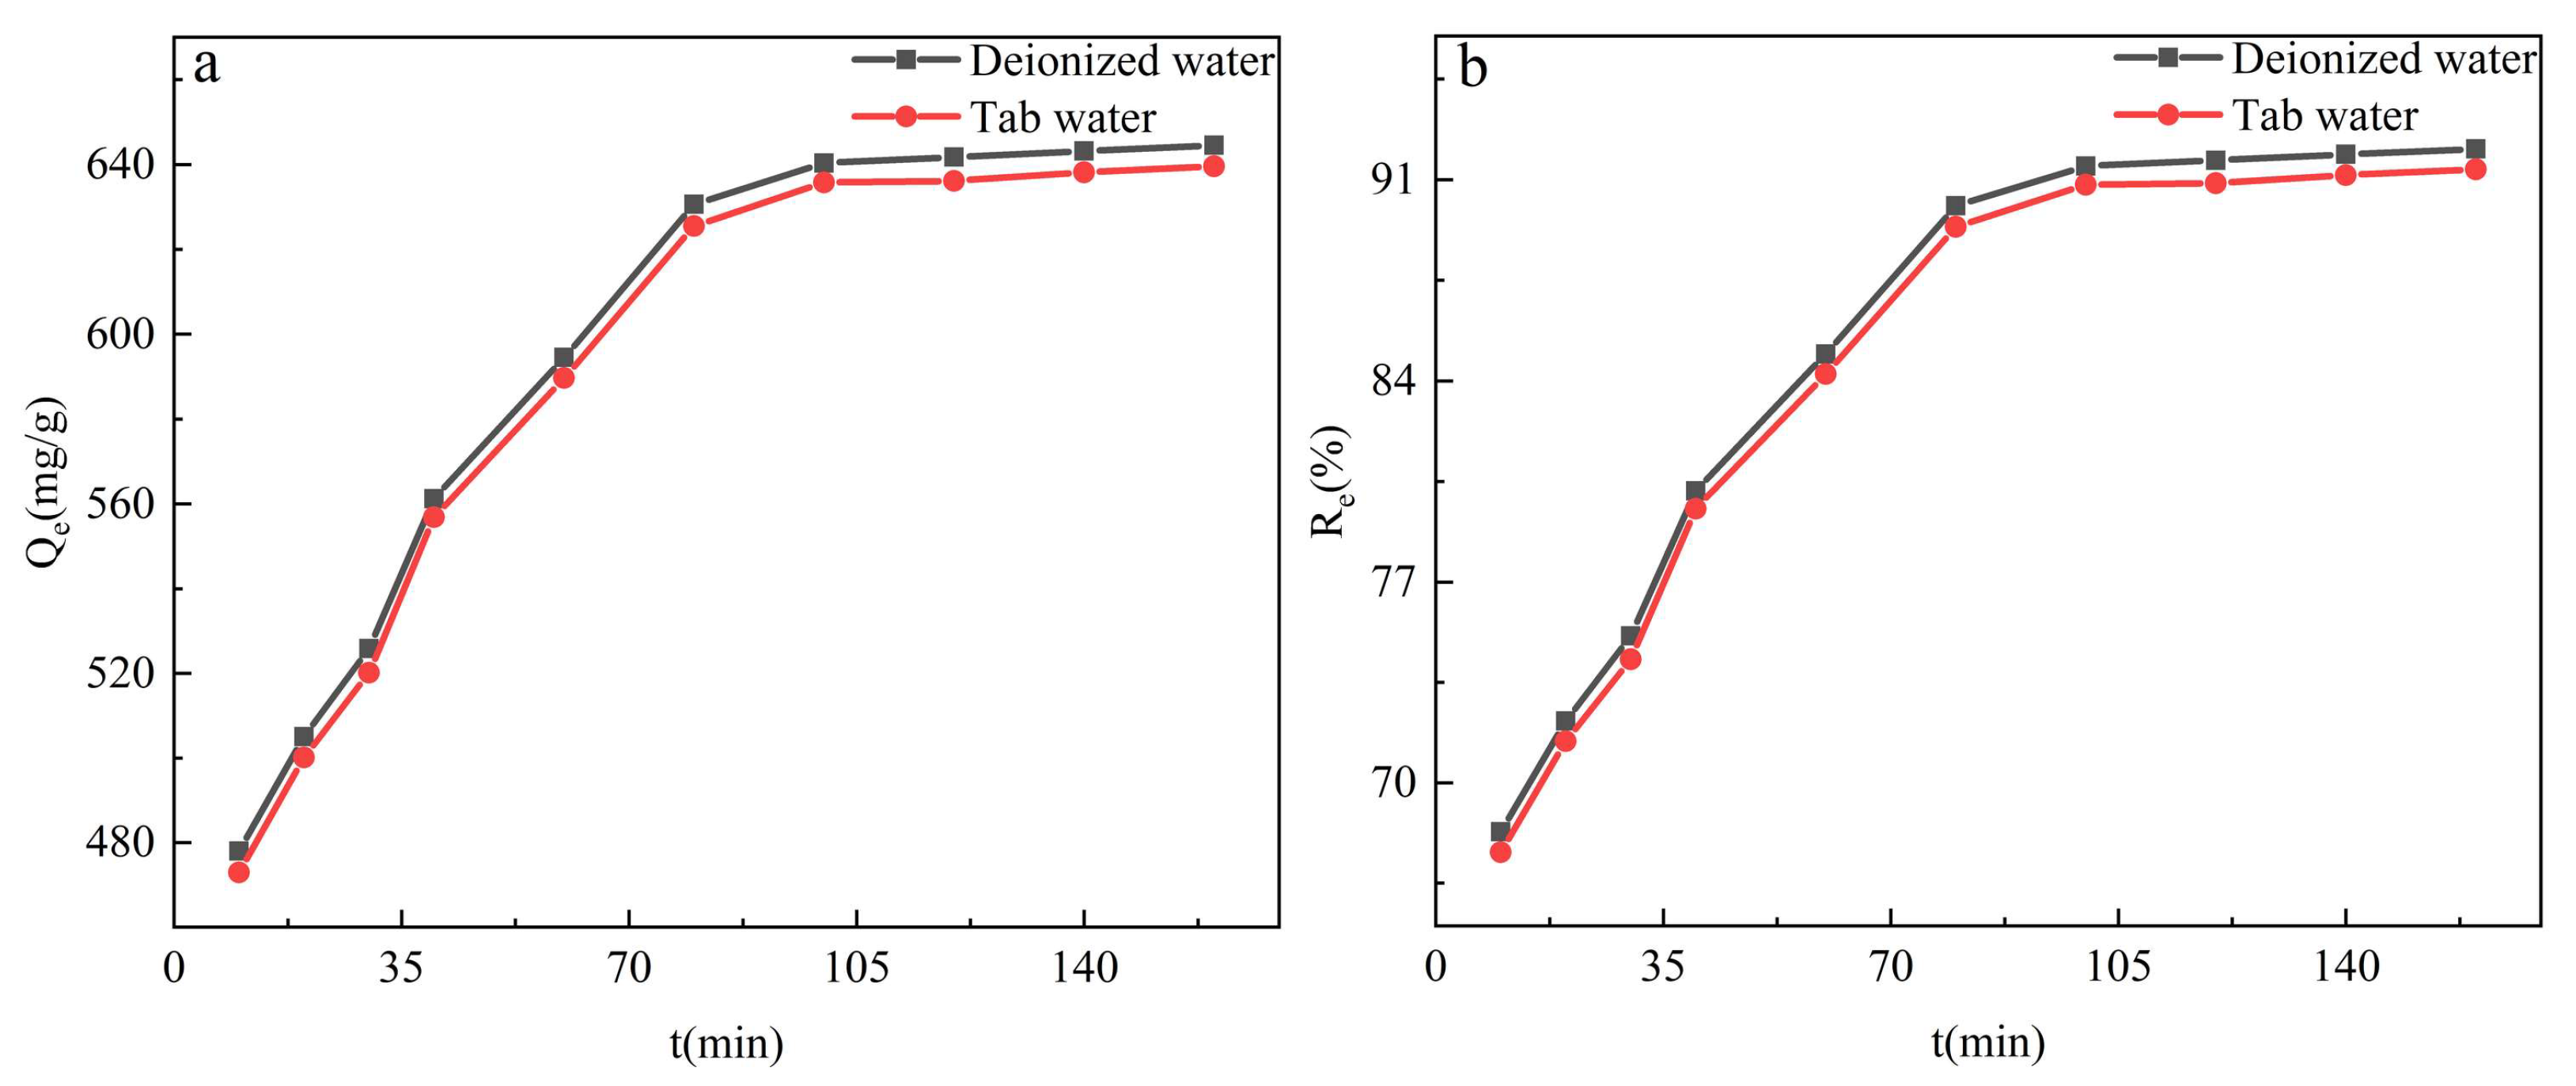
3.4. Effect of MB Solution with Different Water Samples on Adsorption

It cannot contain only one kind of MB dye when dealing with real wastewater. Therefore, this study set up a new adsorption experiment, using tap water to prepare MB dye solution. A certain concentration of 50 mL MB (140 mg/L) solution and 10 mg of adsorbent materials were sequentially added to the Erlenmeyer flask, and the pH was adjusted using NaOH and HNO3, and then the Erlenmeyer flask was placed in a dark constant temperature shaker box and shaken at 120 rpm for 2 h. After the equilibration time, the concentration of MB dye in the supernatant solution was measured by a dual-beam ultraviolet-visible spectrometer. The adsorption amount Qe and the adsorption rate Re were calculated by Formulas (1) and (2). From Figure 10, we can see that GO-TOA is still very effective in absorbing MB in tap water, which fully shows that it is a good adsorption material.

3.5. Comparison with Other Adsorbents

Nowadays, many MB adsorbents have been reported. In order to highlight the excellent performance of GO-TOA adsorbents, we compared the adsorption performance of GO-TOA with other adsorbents. It can be clearly seen from Table 6 that compared with other adsorbents, GO-TOA has the advantages of larger adsorption capacity and shorter adsorption time. Therefore, we believe that GO-TOA is a promising adsorbent for MB.

3.6. Adsorption Mechanism

The N and O atoms in GO-TOA have high electronegativity and can adsorb MB by hydrogen bonding [24]. In addition, GO-TOA, which is rich in electronic amino groups, can produce electrostatic adsorption with cationic dye MB [43]. Not only that, but MB is rich in π electron aroma; these π electrons can interact with the π electron of GO-TOA [24]. Therefore, in this experiment, electrostatic adsorption, hydrogen bonding, and π-π interaction play an important role in adsorption. It can be seen from the infrared image of Figure 11a shows that the functional group structure of the material changes after MB adsorption, indicating that the MB was adsorption to the GO-TOA. The peaks at 2985 and 2759 cm−1 are obviously enhanced, which is the stretching vibration peak of C-H in methylene blue structure [24]. Two new vibration peaks are generated at 1714 and 879 cm−1, which belong to the tensile vibration peak of C=S and the in-plane bending vibration peak of C-H in the methylene blue structure. Two new peaks were also observed at 1122.386 and 1164.81 cm−1. Moreover, the peak of GO-TOA at 1650 cm−1 disappears after the adsorption of MB, which may be due to other functional groups shielding the absorption of this peak. In addition, two new vibration peaks are generated at 2985 and 2759 cm−1, which was the methylene vibration peak of the MB structure [24]. It can be seen from the XRD diagram of Figure 11b that the crystal structure of the material changes after the adsorption of MB. The peak of GO-TOA at 9.70° shifted to 10.34° and a new peak was generated at 22.96° and 42.82°, respectively, indicating that the crystal structure of GO-TOA has changed after adsorption of MB [44]. The above phenomena can fully prove that GO-TOA successfully adsorbs MB dye.

4. Conclusions

In this study, a new adsorbent (GO-TOA) was successfully prepared by self-assembly of graphene oxide (GO) and thiourea. The structural changes of the modified and unmodified samples were studied by a series of characterization instruments. GO-TOA was used to adsorb MB dye. Through experiments, we found that the best adsorption process parameters are as follows: pH = 10, CMB = 140 mg/L, time = 100 min, temperature = 40 °C. In addition, the adsorption capacity of GO-TOA gradually decreased to equilibrium with the increase of ionic concentration of sodium chloride. Furthermore, the adsorption of MB on GO-TOA conformed to the pseudo-second-order kinetics model and the Langmuir adsorption isotherm model. Moreover, its adsorption belongs to endothermic reactions. Through the activation and regeneration of the materials, we found that GO-TOA materials have good structural stability and good reusability. After GO Self-assembly, the maximum adsorption capacity increases from 196.8 mg/g to 641.724 mg/g, and its adsorption rate increases from 65.60% to 92.32%. Therefore, we believe that this material will become a very potential MB adsorbent.

Author Contributions

J.B.: data curation, writing—original draft, conceptualization, methodology, investigation, formal analysis. L.Y.: project administration, supervision, funding acquisition. H.J.: writing—review and editing, supervision, validation. C.W.: writing—review and editing, visualization, resources. All authors have read and agreed to the published version of the manuscript.

Funding

This work was funded by Scientific Research Foundation of Hunan Provincial Education Department: 18C0071; Scientific Research Foundation of Hunan Provincial Education Department: 18C0048; National Natural Science Foundation of China: 51608194; Opening Fund of Key Laboratory of Chemical Biology and Traditional Chinese Medicine Research (Hunan Normal University), Ministry of Education: KLCBTCMR18-15.

Data Availability Statement

Data available on request from the authors.

Conflicts of Interest

The authors declare no conflict of interest.

References

  1. Bu, J.Q.; Wan, Q.Q.; Deng, Z.W.; Liu, H.; Li, T.H.; Zhou, C.Y.; Zhong, S.A. Waste coal cinder catalyst enhanced electrocatalytic oxidation and persulfate advanced oxidation for the degradation of sulfadiazine. Chemosphere 2022, 303, 134880. [Google Scholar] [CrossRef] [PubMed]
  2. Wan, Q.Q.; Bu, J.Q.; Deng, Z.W.; Liu, H.; Li, T.H.; Luo, T.; Zhou, C.Y.; Zhong, S.A. Peroxymonosulfate activation by bimetallic modified syderolite pellets catalyst for degradation of brominobenzonitrile. Process Saf. Environ. Prot. 2022, 165, 505–513. [Google Scholar] [CrossRef]
  3. Bu, J.Q.; Wan, Q.Q.; Deng, Z.W.; Liu, H.; Li, T.H.; Zhou, C.Y.; Zhong, S.A. High-efficient degradation of sulfamethazine by electro-enhanced peroxymonosulfate activation with bimetallic modified Mud sphere catalyst. Sep. Purif. Technol. 2022, 292, 120977. [Google Scholar] [CrossRef]
  4. Cheng, X.; Liu, Z.Y.; Jing, Q.F.; Mao, P.; Guo, K.; Lu, J.S.; Xie, B.; Fan, H.Q. Porous (K0.5Na0.5)(0.94)Li0.06NbO3-polydimethylsiloxane piezoelectric composites harvesting mechanical energy for efficient decomposition of dye wastewater. J. Colloid Interface Sci. 2023, 629, 11–21. [Google Scholar] [CrossRef]
  5. Liu, Y.Y.; Ke, Y.L.; Shang, Q.G.; Yang, X.F.; Wang, D.S.; Liao, G.Y. Fabrication of multifunctional biomass-based aerogel with 3D hierarchical porous structure from waste reed for the synergetic adsorption of dyes and heavy metal ions. Chem. Eng. J. 2023, 451, 138934. [Google Scholar] [CrossRef]
  6. Yuan, Y.; Yin, W.X.; Huang, Y.T.; Feng, A.Q.; Chen, T.M.; Qiao, L.; Cheng, H.Y.; Liu, W.Z.; Li, Z.X.; Ding, C.; et al. Intermittent electric field stimulated reduction-oxidation coupled process for enhanced azo dye biodegradation. Chem. Eng. J. 2023, 451, 138732. [Google Scholar] [CrossRef]
  7. Alibak, A.H.; Khodarahmi, M.; Fayyazsanavi, P.; Alizadeh, S.M.; Hadi, A.J.; Aminzadehsarikhanbeglou, E. Simulation the adsorption capacity of polyvinyl alcohol/carboxymethyl cellulose based hydrogels towards methylene blue in aqueous solutions using cascade correlation neural network (CCNN) technique. J. Clean. Prot. 2022, 337, 130509. [Google Scholar] [CrossRef]
  8. Ahamad, T.; Naushad, M.; Eldesoky, G.E.; Al-Saeedi, S.I.; Nafady, A.; Al-Kadhi, N.S.; Al-Muhtaseb, A.H.; Khan, A.A.; Khan, A. Effective and fast adsorptive removal of toxic cationic dye (MB) from aqueous medium using amino-functionalized magnetic multiwall carbon nanotubes. J. Mol. Liq. 2019, 282, 154–161. [Google Scholar] [CrossRef]
  9. Vig, A.S.; Gupta, A.; Pandey, O.P. Efficient photodegradation of methylene blue (MB) under solar radiation by ZrC nanoparticles. Adv. Powder Technol. 2018, 29, 2231–2242. [Google Scholar]
  10. Mavukkandy, M.O.; Zaib, Q.; Arafat, H.A. CNT/PVP blend PVDF membranes for the removal of organic pollutants from simulated treated wastewater effluent. J. Environ. Chem. Eng. 2018, 6, 6733–6740. [Google Scholar] [CrossRef]
  11. Sangeetha, S.; Krishnamurthy, G.; Raghavan, M.S. Electrochemical sensing and photocatalytic degradation of methylene blue (MB) dye by cobalt-beta hydroxy benzoate complex. Mater. Sci. Semicond. Process. 2019, 101, 164–173. [Google Scholar] [CrossRef]
  12. Akkoz, Y.; Coskun, R.; Delibas, A. Preparation and characterization of sulphonated bio-adsorbent from waste hawthorn kernel for dye (MB) removal. J. Mol. Liq. 2019, 287, 110988. [Google Scholar] [CrossRef]
  13. Zou, X.Q.; Zhang, H.; Chen, T.; Li, H.T.; Meng, C.H.; Xia, Y.; Guo, J. Preparation and characterization of polyacrylamide/sodium alginate microspheres and its adsorption of MB dye. Colloids Surf. A-Physicochem. Eng. Asp. 2019, 567, 184–192. [Google Scholar] [CrossRef]
  14. Ahmed, M.J.; Okoye, P.U.; Hummadi, E.H.; Hameed, B.H. High-performance porous biochar from the pyrolysis of natural and renewable seaweed (Gelidiella acerosa) and its application for the adsorption of methylene blue. Bioresour. Technol. 2019, 278, 159–164. [Google Scholar] [CrossRef]
  15. Li, B.; Guo, J.Z.; Lv, K.L.; Fan, J.J. Adsorption of methylene blue and Cd(II) onto maleylated modified hydrochar from water. Environ. Pollut. 2019, 254, 113014. [Google Scholar] [CrossRef]
  16. Zahed, M.; Parsamehr, P.S.; Tofighy, M.A.; Mohammadi, T. Synthesis and functionalization of graphene oxide (GO) for salty water desalination as adsorbent. Chem. Eng. Res. Des. 2018, 138, 358–365. [Google Scholar] [CrossRef]
  17. Ji, C.; Yang, S.Y.; Tao, E.; Cheng, Y.; Hao, X.; Li, Y. Three-dimensional network graphene oxide/sodium alginate aerogel beads with slit-shaped structure: Synthesis, performance and selective adsorption mechanism for Cu(II). J. Environ. Chem. Eng. 2021, 9, 106819. [Google Scholar] [CrossRef]
  18. Ranjan, P.; Verma, P.; Agrawal, S.; Rao, T.R.; Samanta, S.K.; Thakur, A.D. Inducing dye-selectivity in graphene oxide for cationic dye separation applications. Mater. Chem. Phys. 2019, 226, 350–355. [Google Scholar] [CrossRef]
  19. Wang, F.; Zhang, L.J.; Wang, Y.Y.; Liu, X.J.; Rohani, S.; Lu, J. Fe3O4@SiO2@CS-TETA functionalized graphene oxide for the adsorption of methylene blue (MB) and Cu(II). Appl. Surf. Sci. 2017, 420, 970–981. [Google Scholar] [CrossRef]
  20. Nayl, A.A.; Abd-Elhamid, A.I.; El-Shanshory, A.A.; Soliman, H.M.A.; Kenawy, E.; Aly, H.F. Development of sponge/graphene oxide composite as eco-friendly filter to remove methylene blue from aqueous media. Appl. Surf. Sci. 2019, 496, 143676. [Google Scholar] [CrossRef]
  21. Zhao, Y.Q.; Yu, W.M.; Li, R.J.; Xu, Y.C.; Liu, Y.; Sun, T.Y.; Shen, L.G.; Lin, H.J. Electric field endowing the conductive polyvinylidene fluoride (PVDF)-graphene oxide (GO)-nickel (Ni) membrane with high-efficient performance for dye wastewater treatment. Appl. Surf. Sci. 2019, 483, 1006–1016. [Google Scholar] [CrossRef]
  22. Li, J.; Gong, J.L.; Zeng, G.M.; Zhang, P.; Song, B.; Cao, W.C.; Fang, S.Y.; Huan, S.Y.; Ye, J. The performance of UiO-66-NH2/graphene oxide (GO) composite membrane for removal of differently charged mixed dyes. Chemosphere 2019, 237, 124517. [Google Scholar] [CrossRef] [PubMed]
  23. Khojasteh, H.; Salavati-Niasari, M.; Safajou, H.; Safardoust-Hojaghan, H. Facile reduction of graphene using urea in solid phase and surface modification by N-doped graphene quantum dots for adsorption of organic dyes. Diam. Relat. Mater. 2017, 79, 133–144. [Google Scholar] [CrossRef]
  24. Bu, J.Q.; Yuan, L.; Zhang, N.; Liu, D.; Meng, Y.; Peng, X. High-efficiency adsorption of methylene blue dye from wastewater by a thiosemicarbazide functionalized graphene oxide composite. Diam. Relat. Mater. 2020, 101, 107604. [Google Scholar] [CrossRef]
  25. Ningaraju, S.; Jagadish, K.; Srikantaswamy, S.; Prakash, A.P.G.; Ravikumar, H.B. Synthesis of graphite oxide nanoparticles and conductivity studies of PSF/GO and PSAN/GO polymer nanocomposites. Mater. Sci. Eng. B-Adv. Funct. Solid-State Mater. 2019, 246, 62–75. [Google Scholar] [CrossRef]
  26. Cheng, Z.L.; Li, Y.X.; Liu, Z. Novel adsorption materials based on graphene oxide/Beta zeolite composite materials and their adsorption performance for rhodamine B. J. Alloys Compd. 2017, 708, 255–263. [Google Scholar] [CrossRef]
  27. Masteri-Farahani, M.; Ghahremani, M. Surface functionalization of graphene oxide and graphene oxide-magnetite nanocomposite with molybdenum-bidentate Schiff base complex. J. Phys. Chem. Solids 2019, 130, 6–12. [Google Scholar] [CrossRef]
  28. Kudin, K.N.; Ozbas, B.; Schniepp, H.C.; Prud’homme, R.K.; Aksay, I.A.; Car, R. Raman spectra of graphite oxide and functionalized graphene sheets. Nano Lett. 2008, 8, 36–41. [Google Scholar] [CrossRef]
  29. Stankovich, S.; Dikin, D.A.; Piner, R.D.; Kohlhaas, K.A.; Kleinhammes, A.; Jia, Y.; Wu, Y.; Nguyen, S.T.; Ruoff, R.S. Synthesis of graphene-based nanosheets via chemical reduction of exfoliated graphite oxide. Carbon 2007, 45, 1558–1565. [Google Scholar] [CrossRef]
  30. Gautam, D.; Lal, S.; Hooda, S. Adsorption of Rhodamine 6G Dye on Binary System of Nanoarchitectonics Composite Magnetic Graphene Oxide Material. J. Nanosci. Nanotechnol. 2019, 20, 2939–2945. [Google Scholar] [CrossRef]
  31. Zambare, R.; Song, X.X.; Bhuvana, S.; Prince, J.S.A.; Nemade, P. Ultrafast Dye Removal Using Ionic Liquid-Graphene Oxide Sponge. ACS Sustain. Chem. Eng. 2017, 5, 6026–6035. [Google Scholar] [CrossRef]
  32. Rauf, M.A.; Bukallah, S.B.; Hamour, F.A.; Nasir, A.S. Adsorption of dyes from aqueous solutions onto sand and their kinetic behavior. Chem. Eng. J. 2008, 137, 238–243. [Google Scholar] [CrossRef]
  33. Chen, P.; Cao, Z.F.; Wen, X.; Wang, J.; Yang, F.; Wang, S.; Zhong, H. In situ nano-silicate functionalized graphene oxide composites to improve MB removal. J. Taiwan Inst. Chem. Eng. 2017, 81, 87–94. [Google Scholar] [CrossRef]
  34. Liu, J.Y.; Chen, F.J.; Li, C.Z.; Lu, L.Z.; Hu, C.W.; Wei, Y.; Raymer, P.; Huang, Q.G. Characterization and utilization of industrial microbial waste as novel adsorbent to remove single and mixed dyes from water. J. Clean. Prot. 2019, 208, 552–562. [Google Scholar] [CrossRef]
  35. Nandi, B.K.; Goswami, A.; Purkait, M.K. Removal of cationic dyes from aqueous solutions by kaolin: Kinetic and equilibrium studies. Appl. Clay Sci. 2009, 42, 583–590. [Google Scholar] [CrossRef]
  36. Weng, C.H.; Pan, Y.F. Adsorption characteristics of methylene blue from aqueous solution by sludge ash. Colloids Surf. A-Physicochem. Eng. Asp. 2006, 274, 154–162. [Google Scholar] [CrossRef]
  37. Liu, Y.; Zheng, Y.A.; Wang, A.Q. Enhanced adsorption of Methylene Blue from aqueous solution by chitosan-g-poly (acrylic acid)/vermiculite hydrogel composites. J. Environ. Sci. 2010, 22, 486–493. [Google Scholar] [CrossRef]
  38. He, K.; Chen, G.Q.; Zeng, G.M.; Chen, A.W.; Huang, Z.Z.; Shi, J.B.; Peng, M.; Huang, T.T.; Hu, L. Enhanced removal performance for methylene blue by kaolin with graphene oxide modification. J. Taiwan Inst. Chem. Eng. 2018, 89, 77–85. [Google Scholar] [CrossRef]
  39. Ren, F.; Li, Z.; Tan, W.Z.; Liu, X.H.; Sun, Z.F.; Ren, P.G.; Yan, D.X. Facile preparation of 3D regenerated cellulose/graphene oxide composite aerogel with high-efficiency adsorption towards methylene blue. J. Colloid Interface Sci. 2018, 532, 58–67. [Google Scholar] [CrossRef]
  40. Huang, T.T.; Yan, M.; He, K.; Huang, Z.Z.; Zeng, G.M.; Chen, A.W.; Peng, M.; Li, H.; Yuan, L.; Chen, G.Q. Efficient removal of methylene blue from aqueous solutions using magnetic graphene oxide modified zeolite. J. Colloid Interface Sci. 2019, 543, 43–51. [Google Scholar] [CrossRef]
  41. Nas, M.S.; Calimli, M.H.; Burhan, H.; Yilmaz, M.; Mustafov, S.D.; Sen, F. Synthesis, characterization, kinetics and adsorption properties of Pt-Co@GO nano-adsorbent for methylene blue removal in the aquatic mediums using ultrasonic process systems. J. Mol. Liq. 2019, 296, 112100. [Google Scholar] [CrossRef]
  42. Wan, Q.; Liu, M.Y.; Xie, Y.L.; Tian, J.W.; Huang, Q.; Deng, F.J.; Mao, L.C.; Zhang, Q.S.; Zhang, X.Y.; Wei, Y. Facile and highly efficient fabrication of graphene oxide-based polymer nanocomposites through mussel-inspired chemistry and their environmental pollutant removal application. J. Mater. Sci. 2017, 52, 504–518. [Google Scholar] [CrossRef]
  43. Liu, J.S.; Liu, G.N.; Liu, W.X. Preparation of water-soluble beta-cyclodextrin/poly(acrylic acid)/graphene oxide nanocomposites as new adsorbents to remove cationic dyes from aqueous solutions. Chem. Eng. J. 2014, 257, 299–308. [Google Scholar] [CrossRef]
  44. Bu, J.Q.; Yuan, L.; Zhang, N.; Meng, Y.; Peng, X. Novel Adsorbent of N-Phenylthiourea-Functionalized Graphene Oxide and Its Removal of Methyl Orange in Aqueous Solutions. J. Chem. Eng. Data 2021, 66, 199–209. [Google Scholar] [CrossRef]
Figure 1. Photographs of GO (a), GO-TOA (b); SEM images of GO (ce), GO-TOA (fh).
Sustainability 14 15290 g001
Figure 2. The survey XPS spectra of GO and GO-TOA (a), C 1s XPS spectra of GO (b), C1s XPS spectra of GO-TOA (c), and N 1s XPS spectra of GO-TOA (d).
Sustainability 14 15290 g002
Figure 3. FTIR spectra of GO and GO-TOA (a), Raman spectra of GO and GO−TOA (b), XRD patterns for GO and GO-TOA (c), and UV-Vis spectra of GO and GO-TOA (d).
Sustainability 14 15290 g003
Figure 4. The nitrogen adsorption isotherms of GO and GO-TOA (a); TGA curves of GO and GO-TOA (b).
Sustainability 14 15290 g004
Figure 5. The contact angle between GO (a), GO-TOA (b) and water.
Sustainability 14 15290 g005
Figure 6. The effect of pH GO and GO-TOA (a) (C0(MB) = 50 mg/L); adsorption rate and capacity of GO (b) and GO-TOA (c) for different concentrations of MB (t = 120 min, pH = 10, dose = 0.2 g/L, T = 25 °C).
Sustainability 14 15290 g006
Figure 7. The adsorption capacity of GO-TOA towards MB at a different time (a) (t = 120 min, pH = 10, dose = 0.2 g/L, T = 25 °C, C0(MB) = 140 mg/L); pseudo-first-order (b) and pseudo-second-order (c) kinetic models for the adsorption of MB dye onto GO-TOA.
Sustainability 14 15290 g007
Figure 8. The effect of temperature for adsorption (a) (t = 120 min, pH = 10, dose = 0.2 g/L, C0(MB) = 140 mg/L), Langmuir isotherms (b) and Freundlich isotherms (c) models for the adsorption of MB dye onto GO-TOA, and thermodynamic analysis (d).
Sustainability 14 15290 g008
Figure 9. The effect of ionic strength (a) (t = 120 min, pH = 10, dose = 0.2 g/L, C0(MB) = 140 mg/L, T = 25 °C), the effect of desorption reagent for adsorption (b), the FTIR spectrum (c) and XRD pattern (d) of regenerated GO−TOA; GO−TOA cycle and regeneration (e).
Sustainability 14 15290 g009
Figure 10. The adsorption capacity (a) and adsorption rate (b) of GO-TOA towards MB at a different time and water sample (pH = 10.0, dose = 0.2 g/L, T = 25 °C, C0(MB) = 140.0 mg/L).
Sustainability 14 15290 g010
Figure 11. The FTIR spectra (a) and XRD pattern (b) of GO−TOA adsorbed MB.
Sustainability 14 15290 g011
Table 1. The pore structure parameters of GO and GO-TOA.
SamplesSurface Area (m2/g)Pore Volume (cm3/g)Average Pore Size (nm)
GO25.4000.02133.358
GO-TOA40.4600.075012.260
Table 2. TGA weight loss of GO and GO-TOA at different temperature interval.
SampleWeight Loss (%)
Up to 100 °CUp to 300 °CUp to 600 °CUp to 900 °C
GO18.4348.8259.4668.85
GO-TOA10.7639.5253.5558.08
Table 3. The fitting parameters of the kinetic model and adsorption isotherm for MB adsorption on the GO-TOA.
Kinetic ModelsParametersC0 = 140.0 mg/L
Actual amount of adsorptionQe,exp (mg/g)641.724
Pseudo-first-orderQe(cal) (mg/g)311.064
K1 (min−1)0.0385
R20.901
Pseudo-second-orderQe(cal) (mg/g)675.676
K2 (min−1)0.000224
R20.999
Adsorption isotherms
LangmuirQm (mg/g)KLR2
746.2690.1810.999
FreundlichKFnR2
430.88010.3640.895
Table 4. Thermodynamic parameters for the adsorption of MB dye onto GO-TOA.
T (K)lnKΔG (KJ/mol)ΔH (kJ/mol)ΔS (J/mol/K)
2982.386−5.9122.0226.63
3032.399−6.043
3082.412−6.176
3132.425−6.311
Table 5. Activation and regeneration capacity.
Desorption ReagentDose (mL)Desorption Rate (%)Time (min)
10% HCl10100180
95% C2H5OH10100120
Number of cyclesAdsorption rate (%)
098.63
195.53
293.67
390.44
Table 6. Adsorption capacity (Qe) of different adsorbents for MB.
Type of AdsorbentDose (mg)C0(MB) (mg/L)pHQe (mg/g)TimeReference
10% GK802011.528.016700[38]
RCE/GO5020.0668.030[39]
1:1 Cu-Z-GO-M1040.01094.481600[40]
Pt-Co@GO9.696.010273.6 90[41]
GO/silicates10120.012230.090[33]
GO-PDA-PSPSH1050.0718558[42]
GO10140.010196.8100This work
GO-TOA10140.010641.724100This work
Publisher’s Note: MDPI stays neutral with regard to jurisdictional claims in published maps and institutional affiliations.

