
Principal Component Analysis (PCA)–Geographic Information System (GIS) Modeling for Groundwater and Associated Health Risks in Abbottabad, Pakistan

 , , ,
, , ,  ,
,
Abstract
1. Introduction
2. Materials and Methods
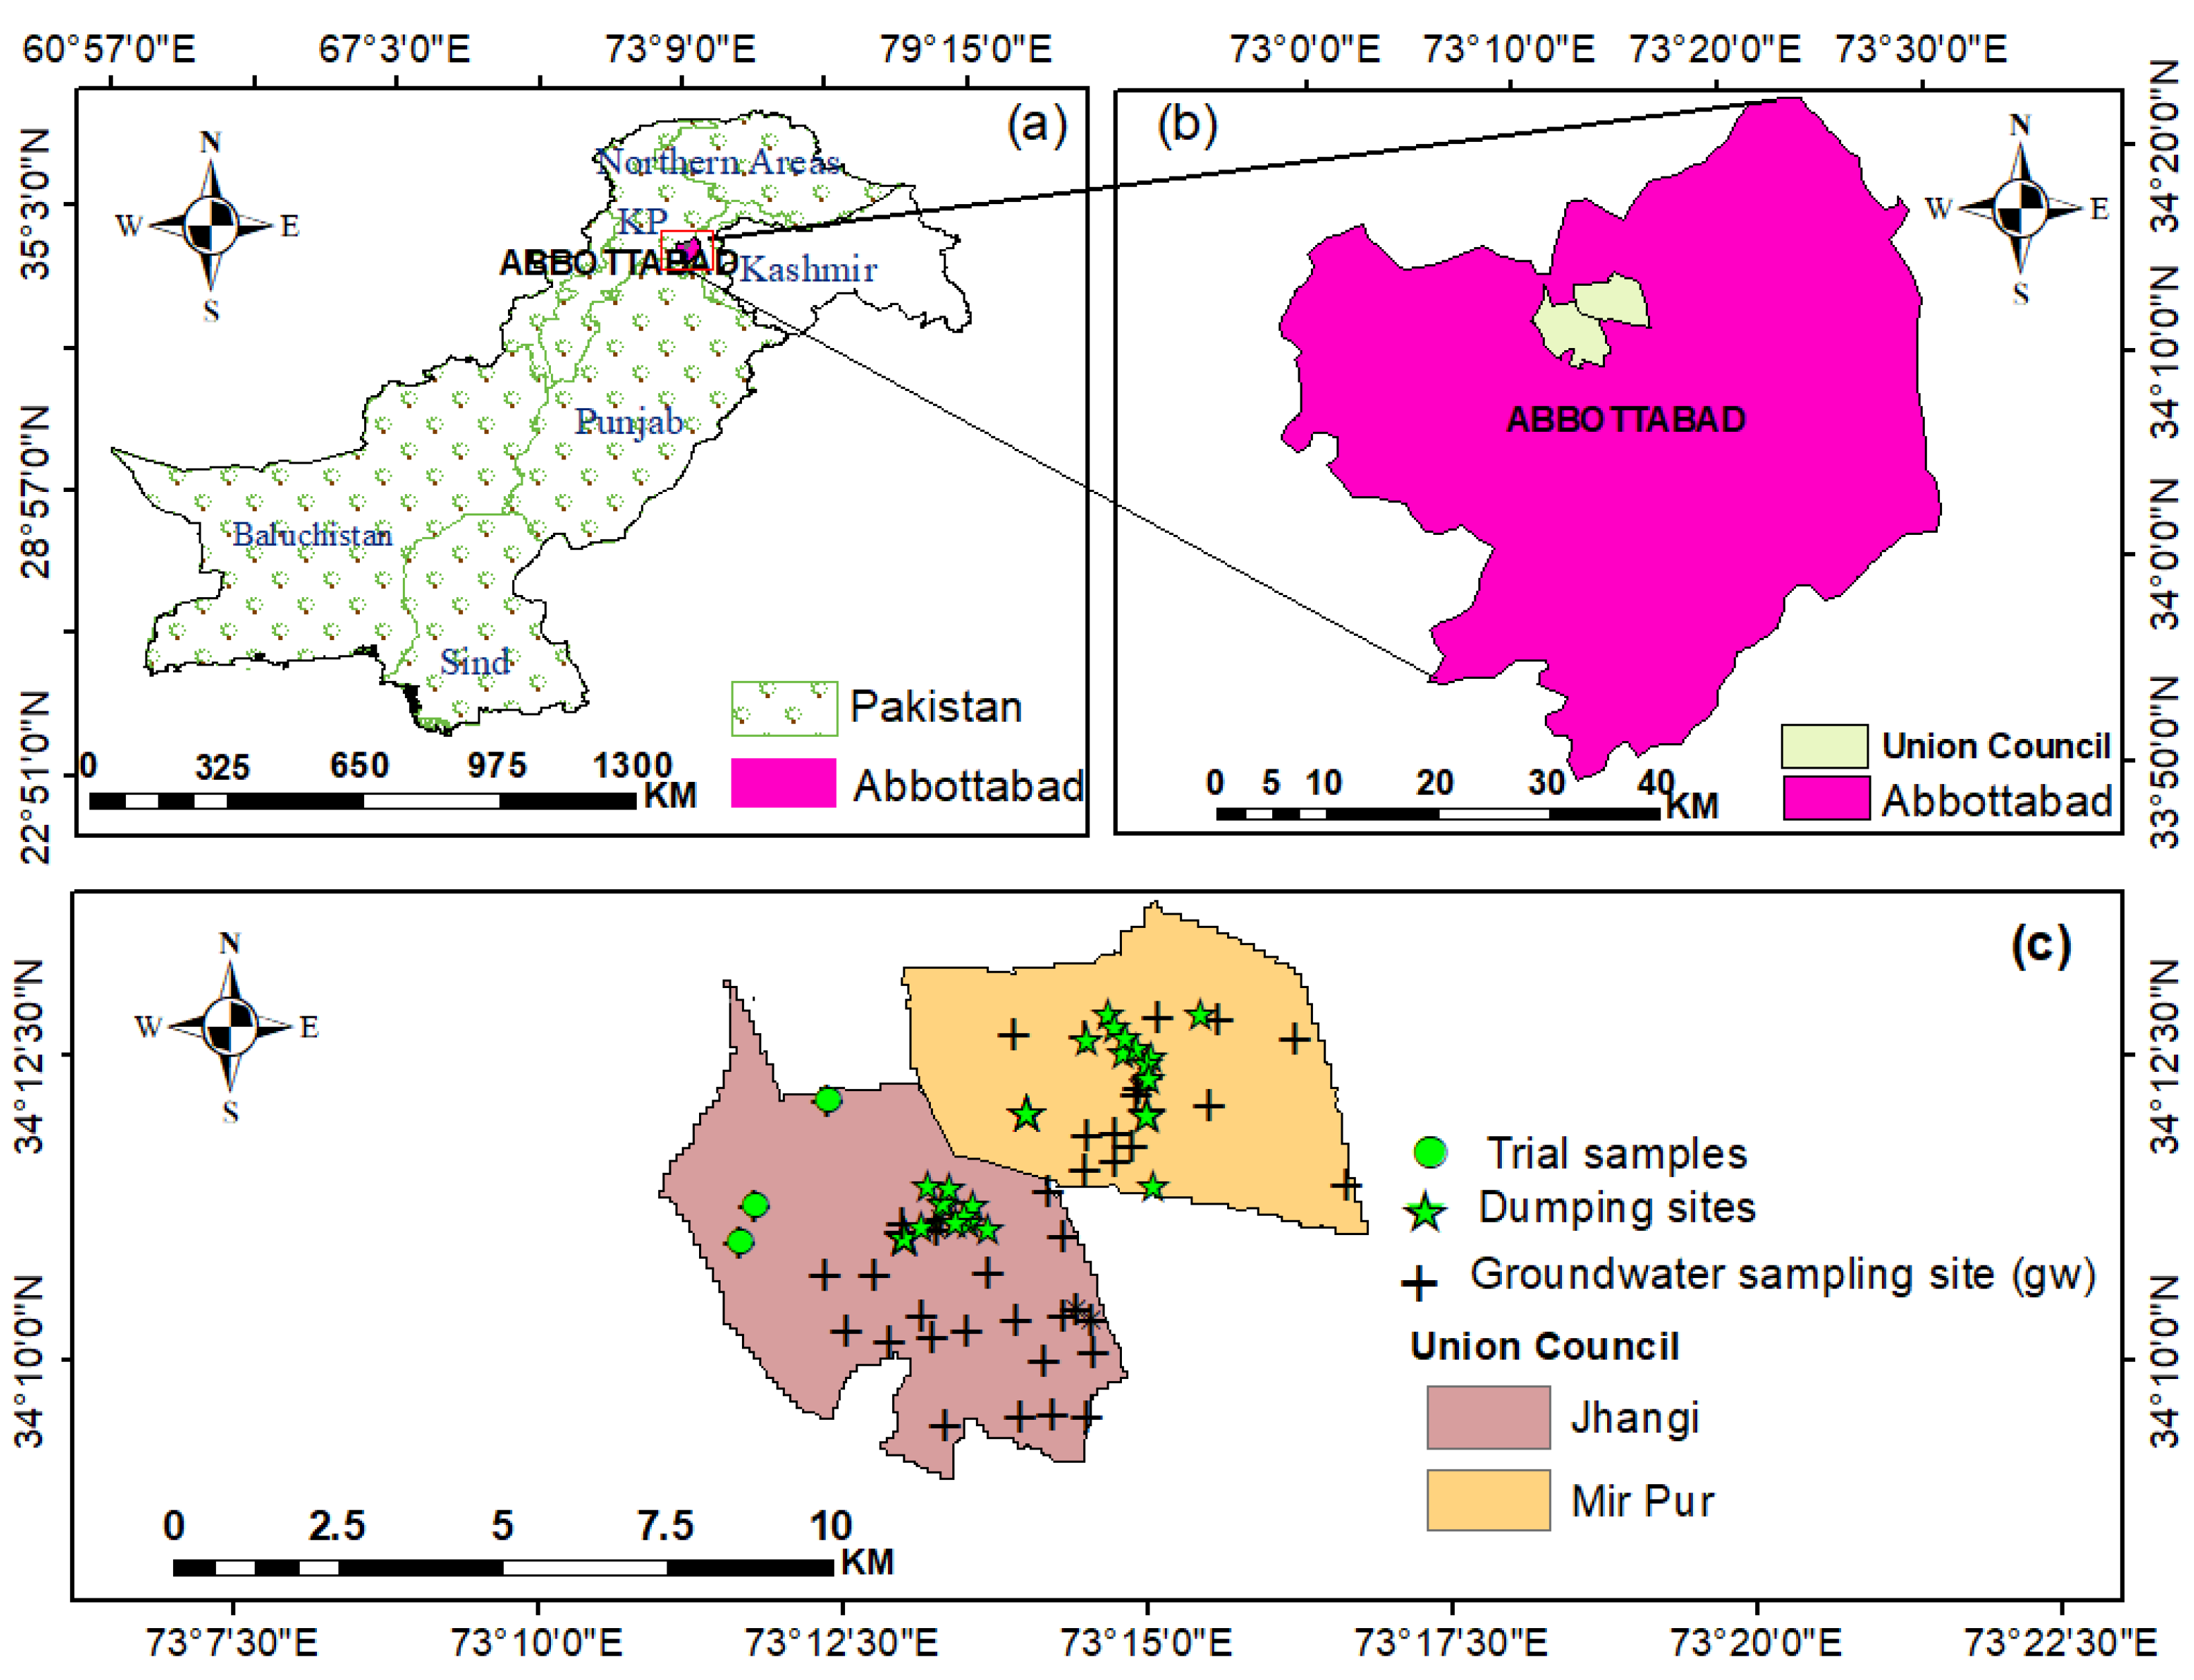
2.1. Study Area
2.2. Data
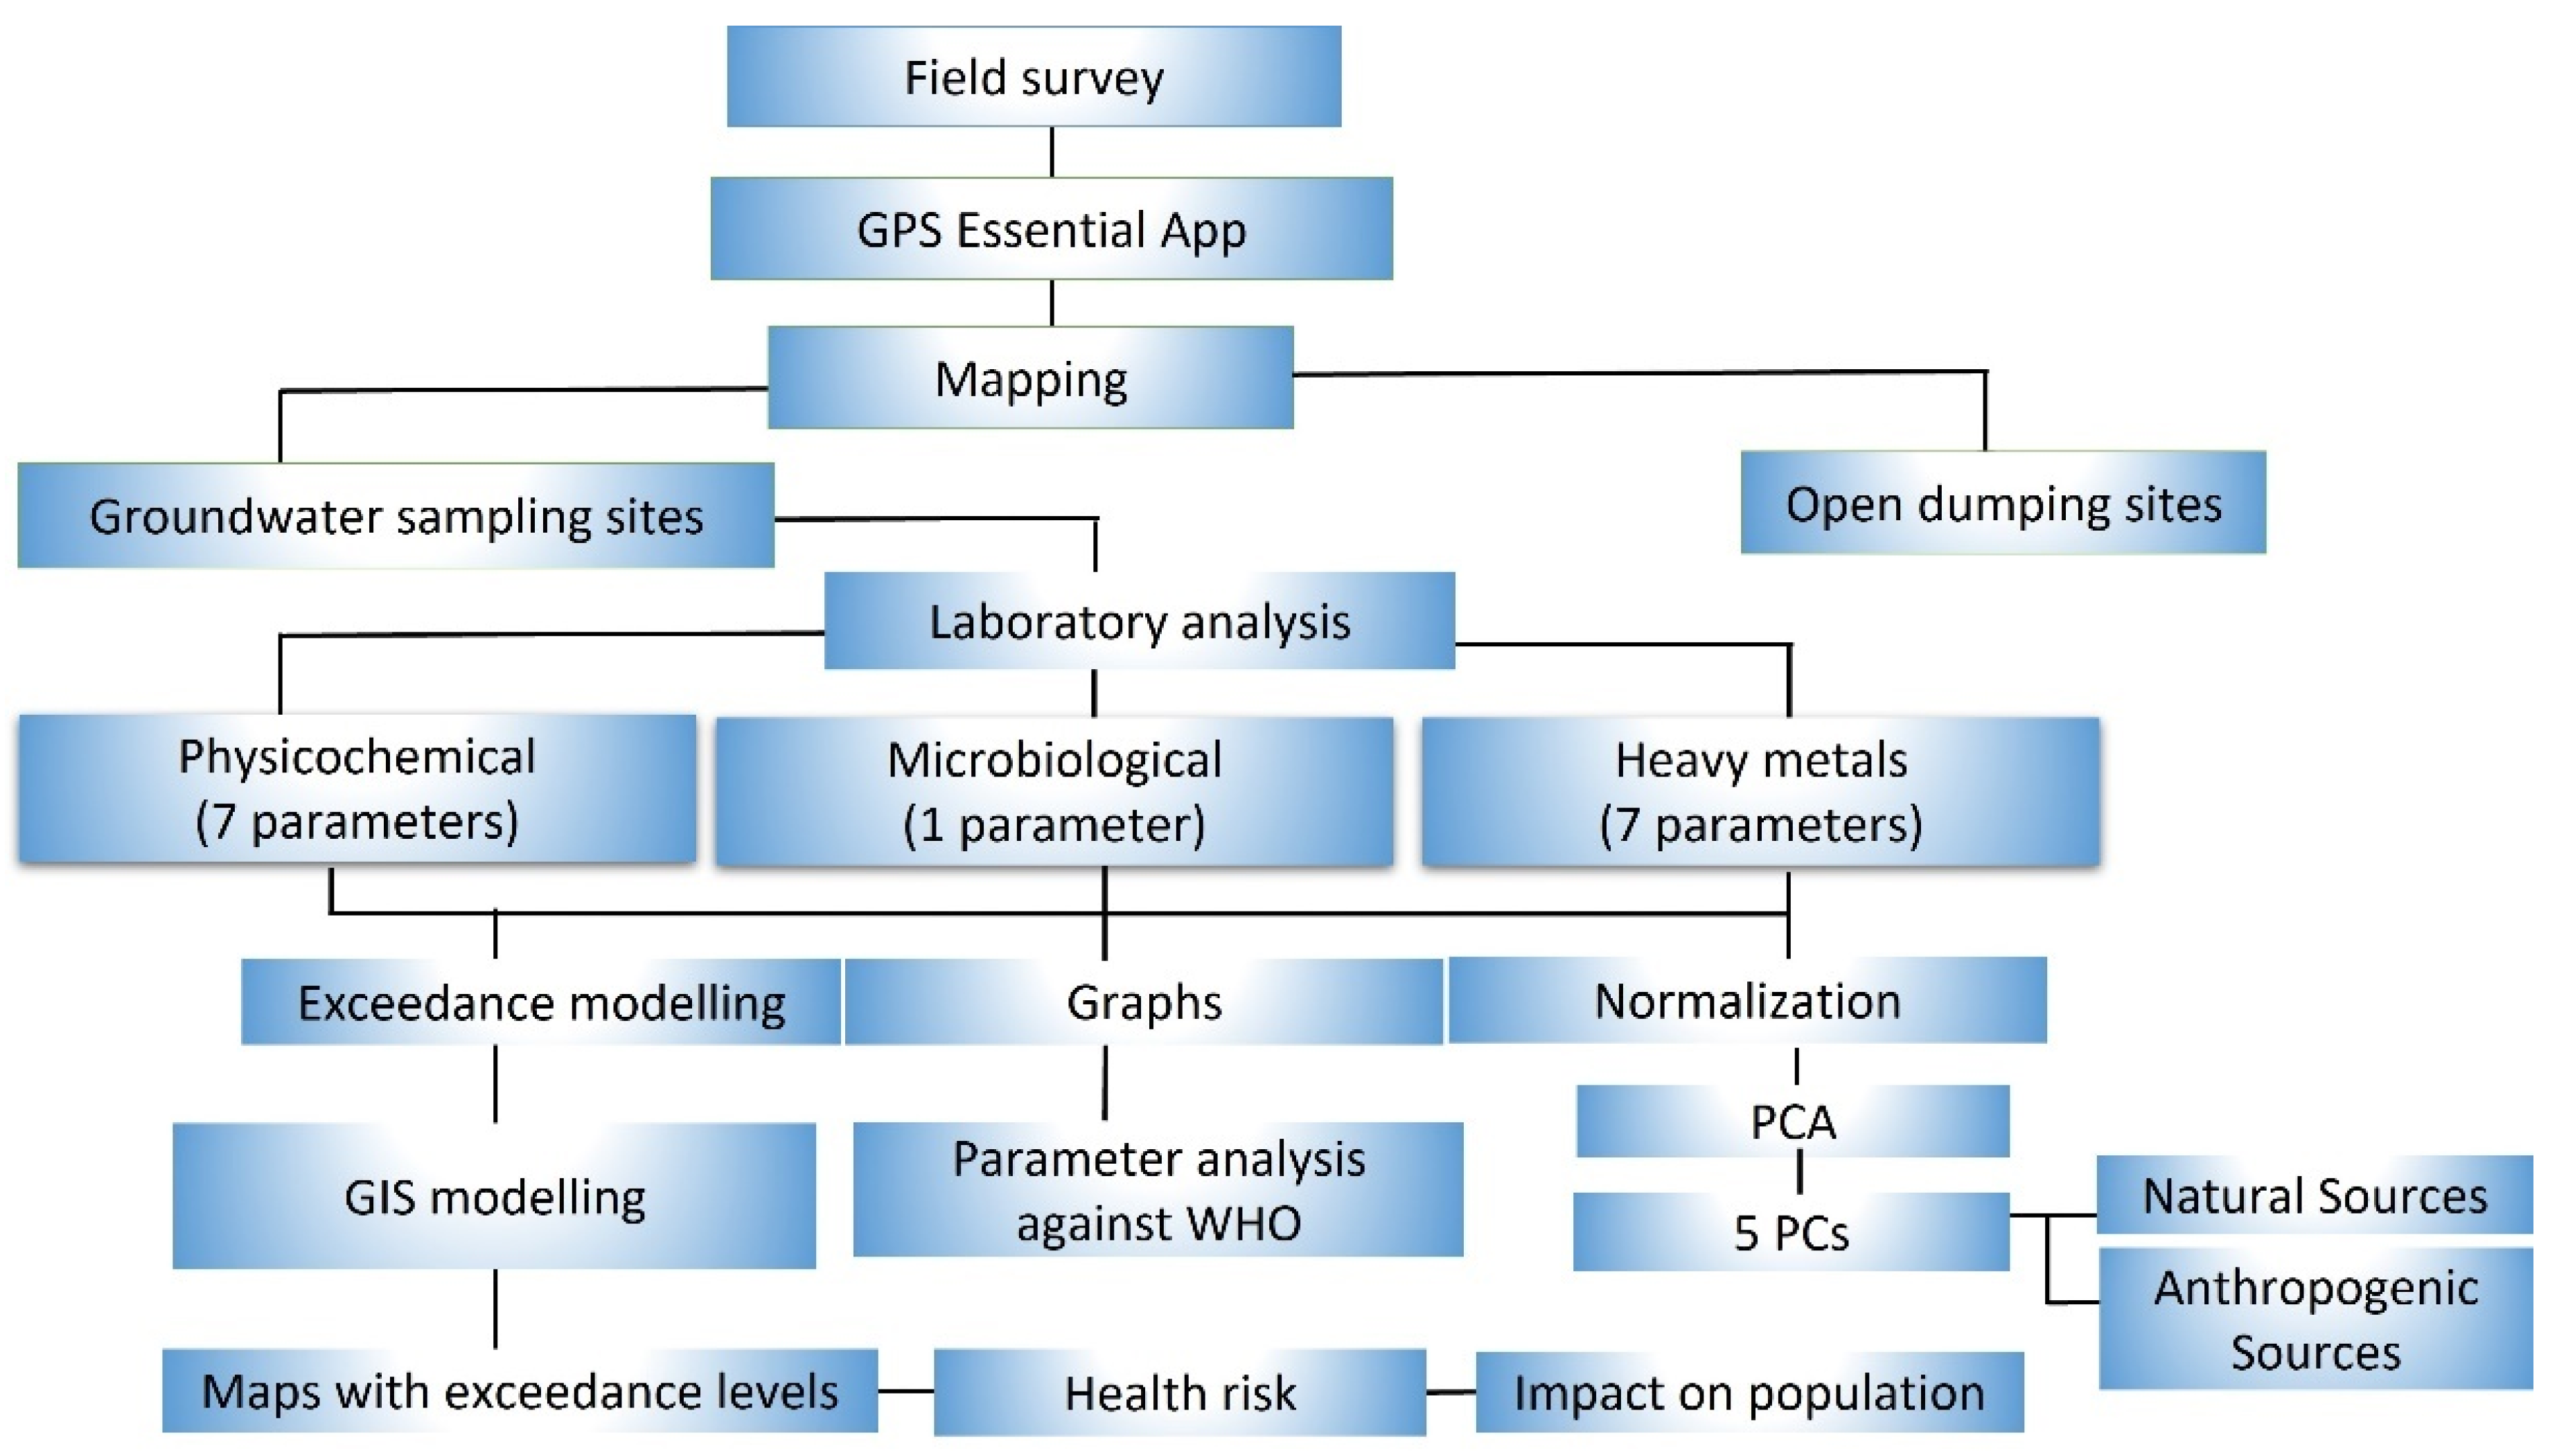
2.3. Methods
2.3.1. Field Survey and Sampling
2.3.2. Laboratory Analysis
2.3.3. Principal Component Analysis (PCA)
2.3.4. GIS-Based Modeling
3. Results and Discussion
3.1. Results of Laboratory Analysis for Parameters
3.2. PCA
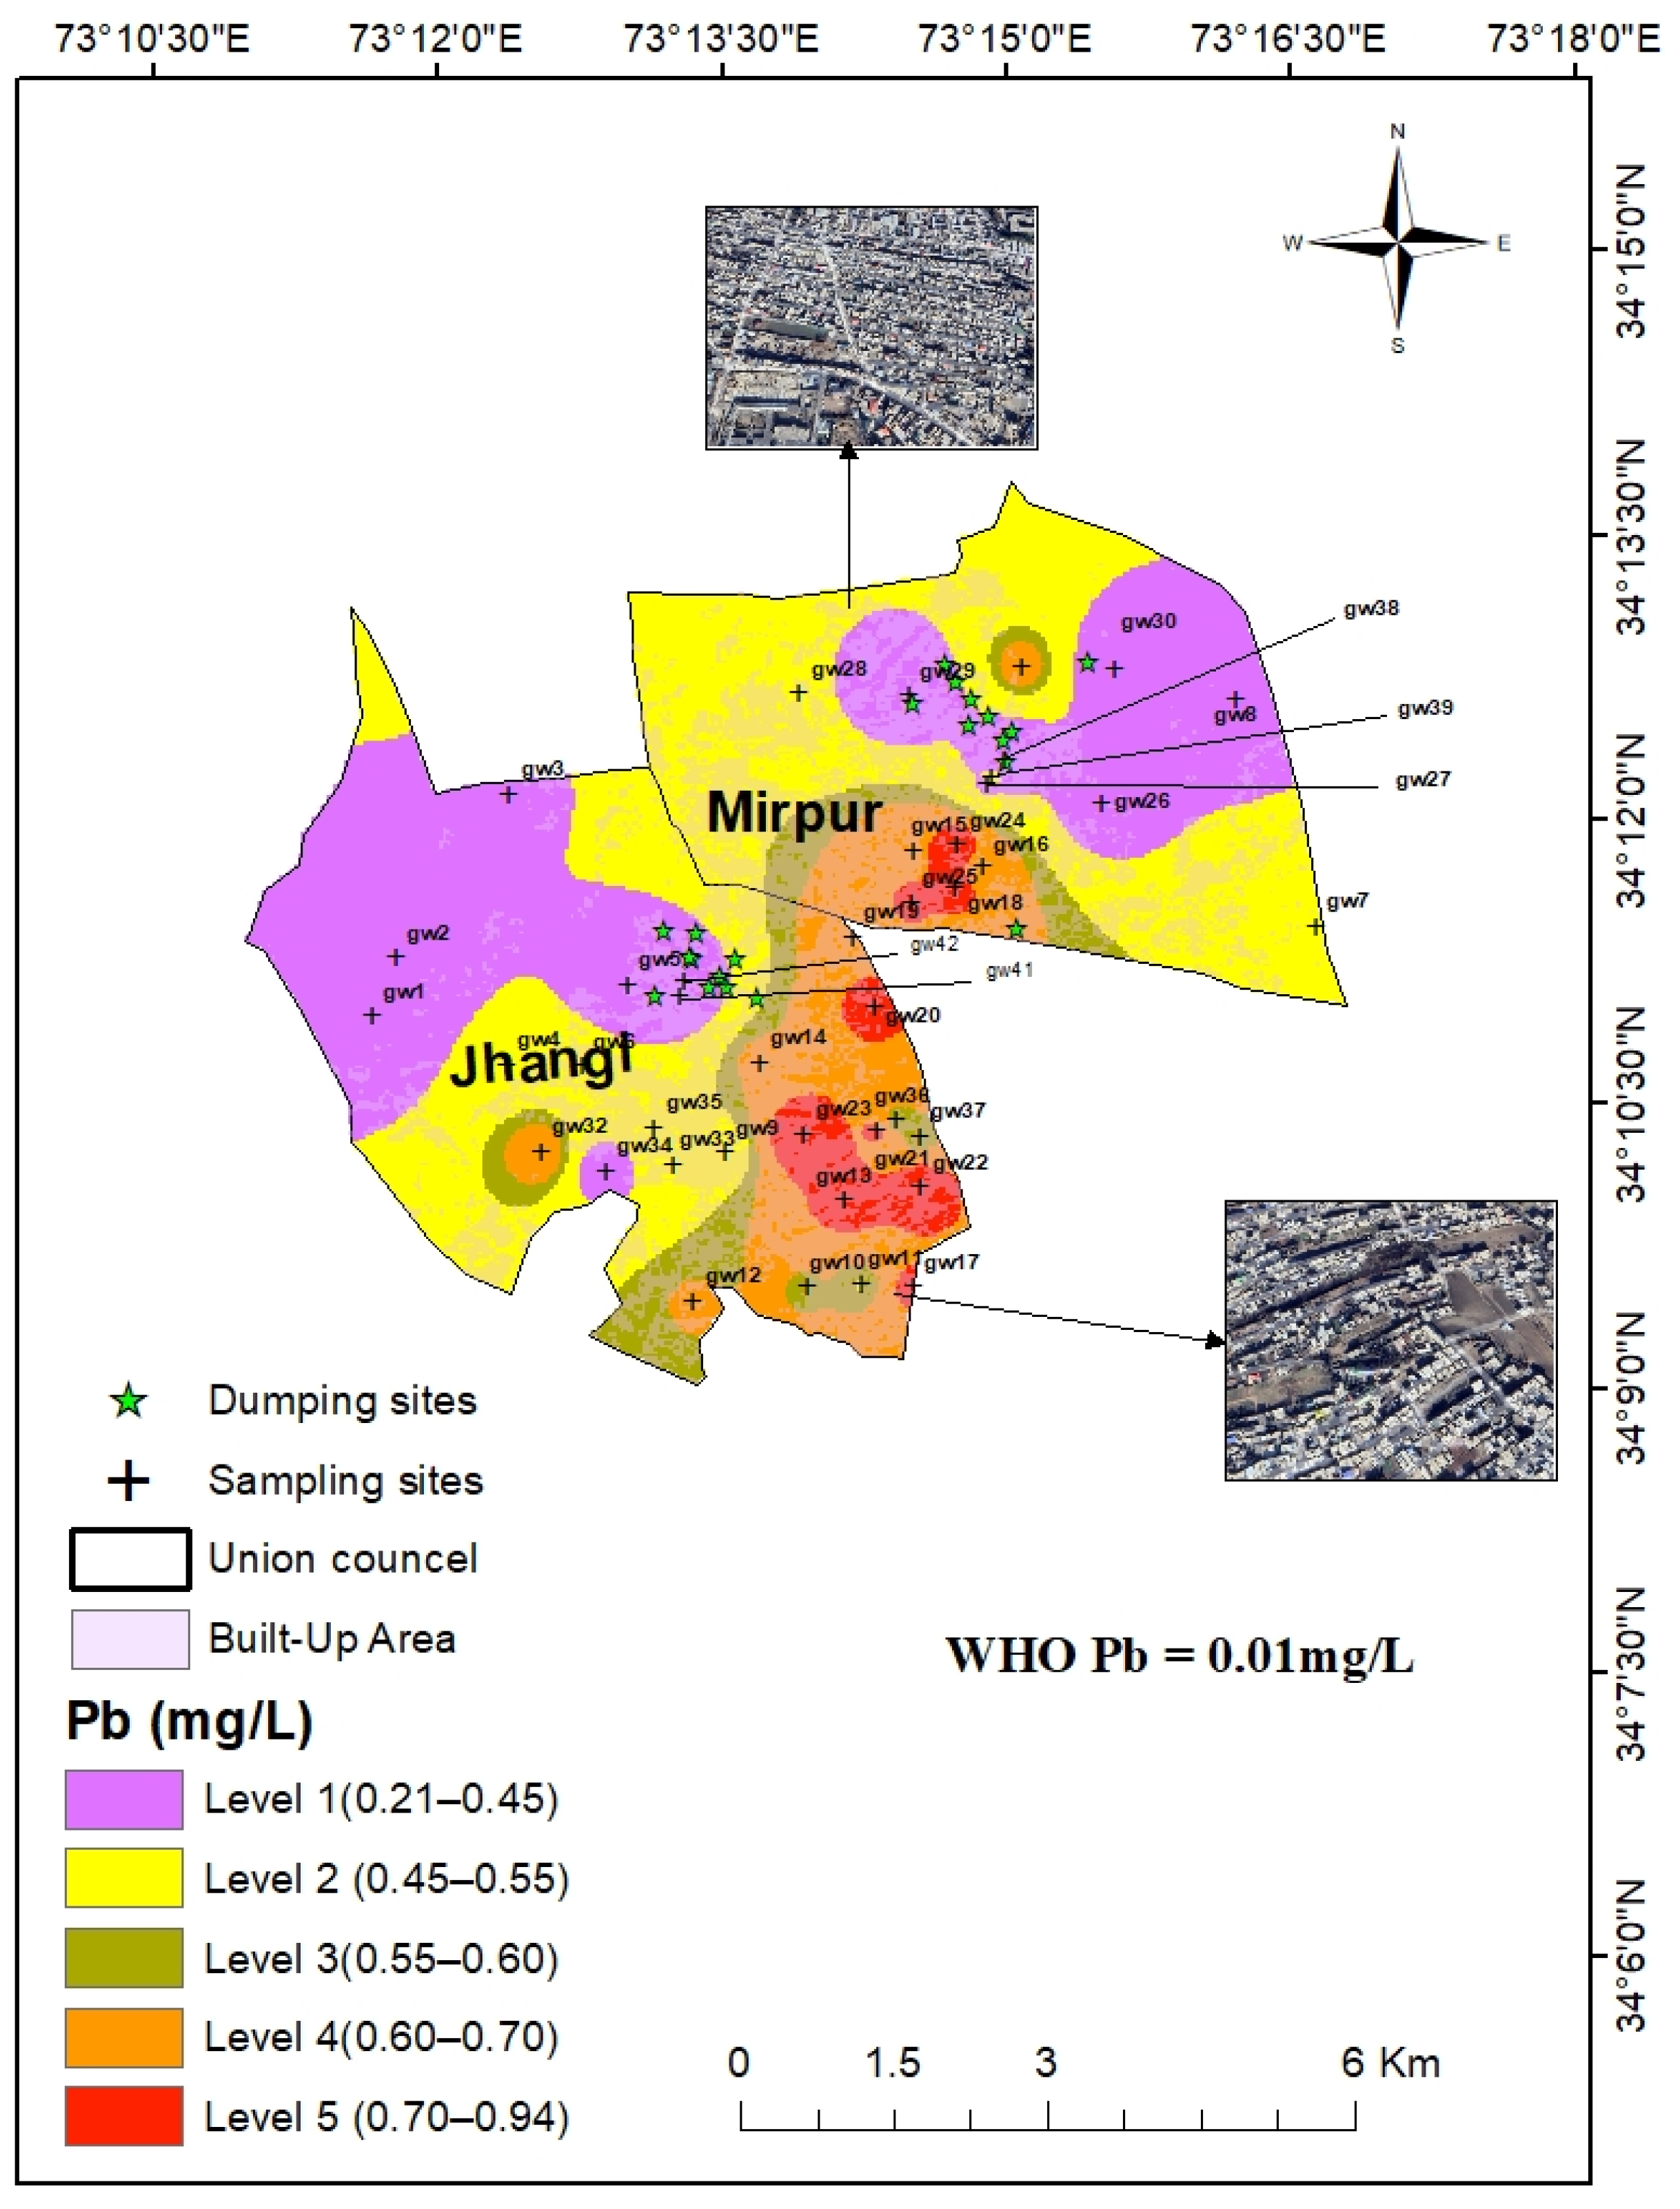
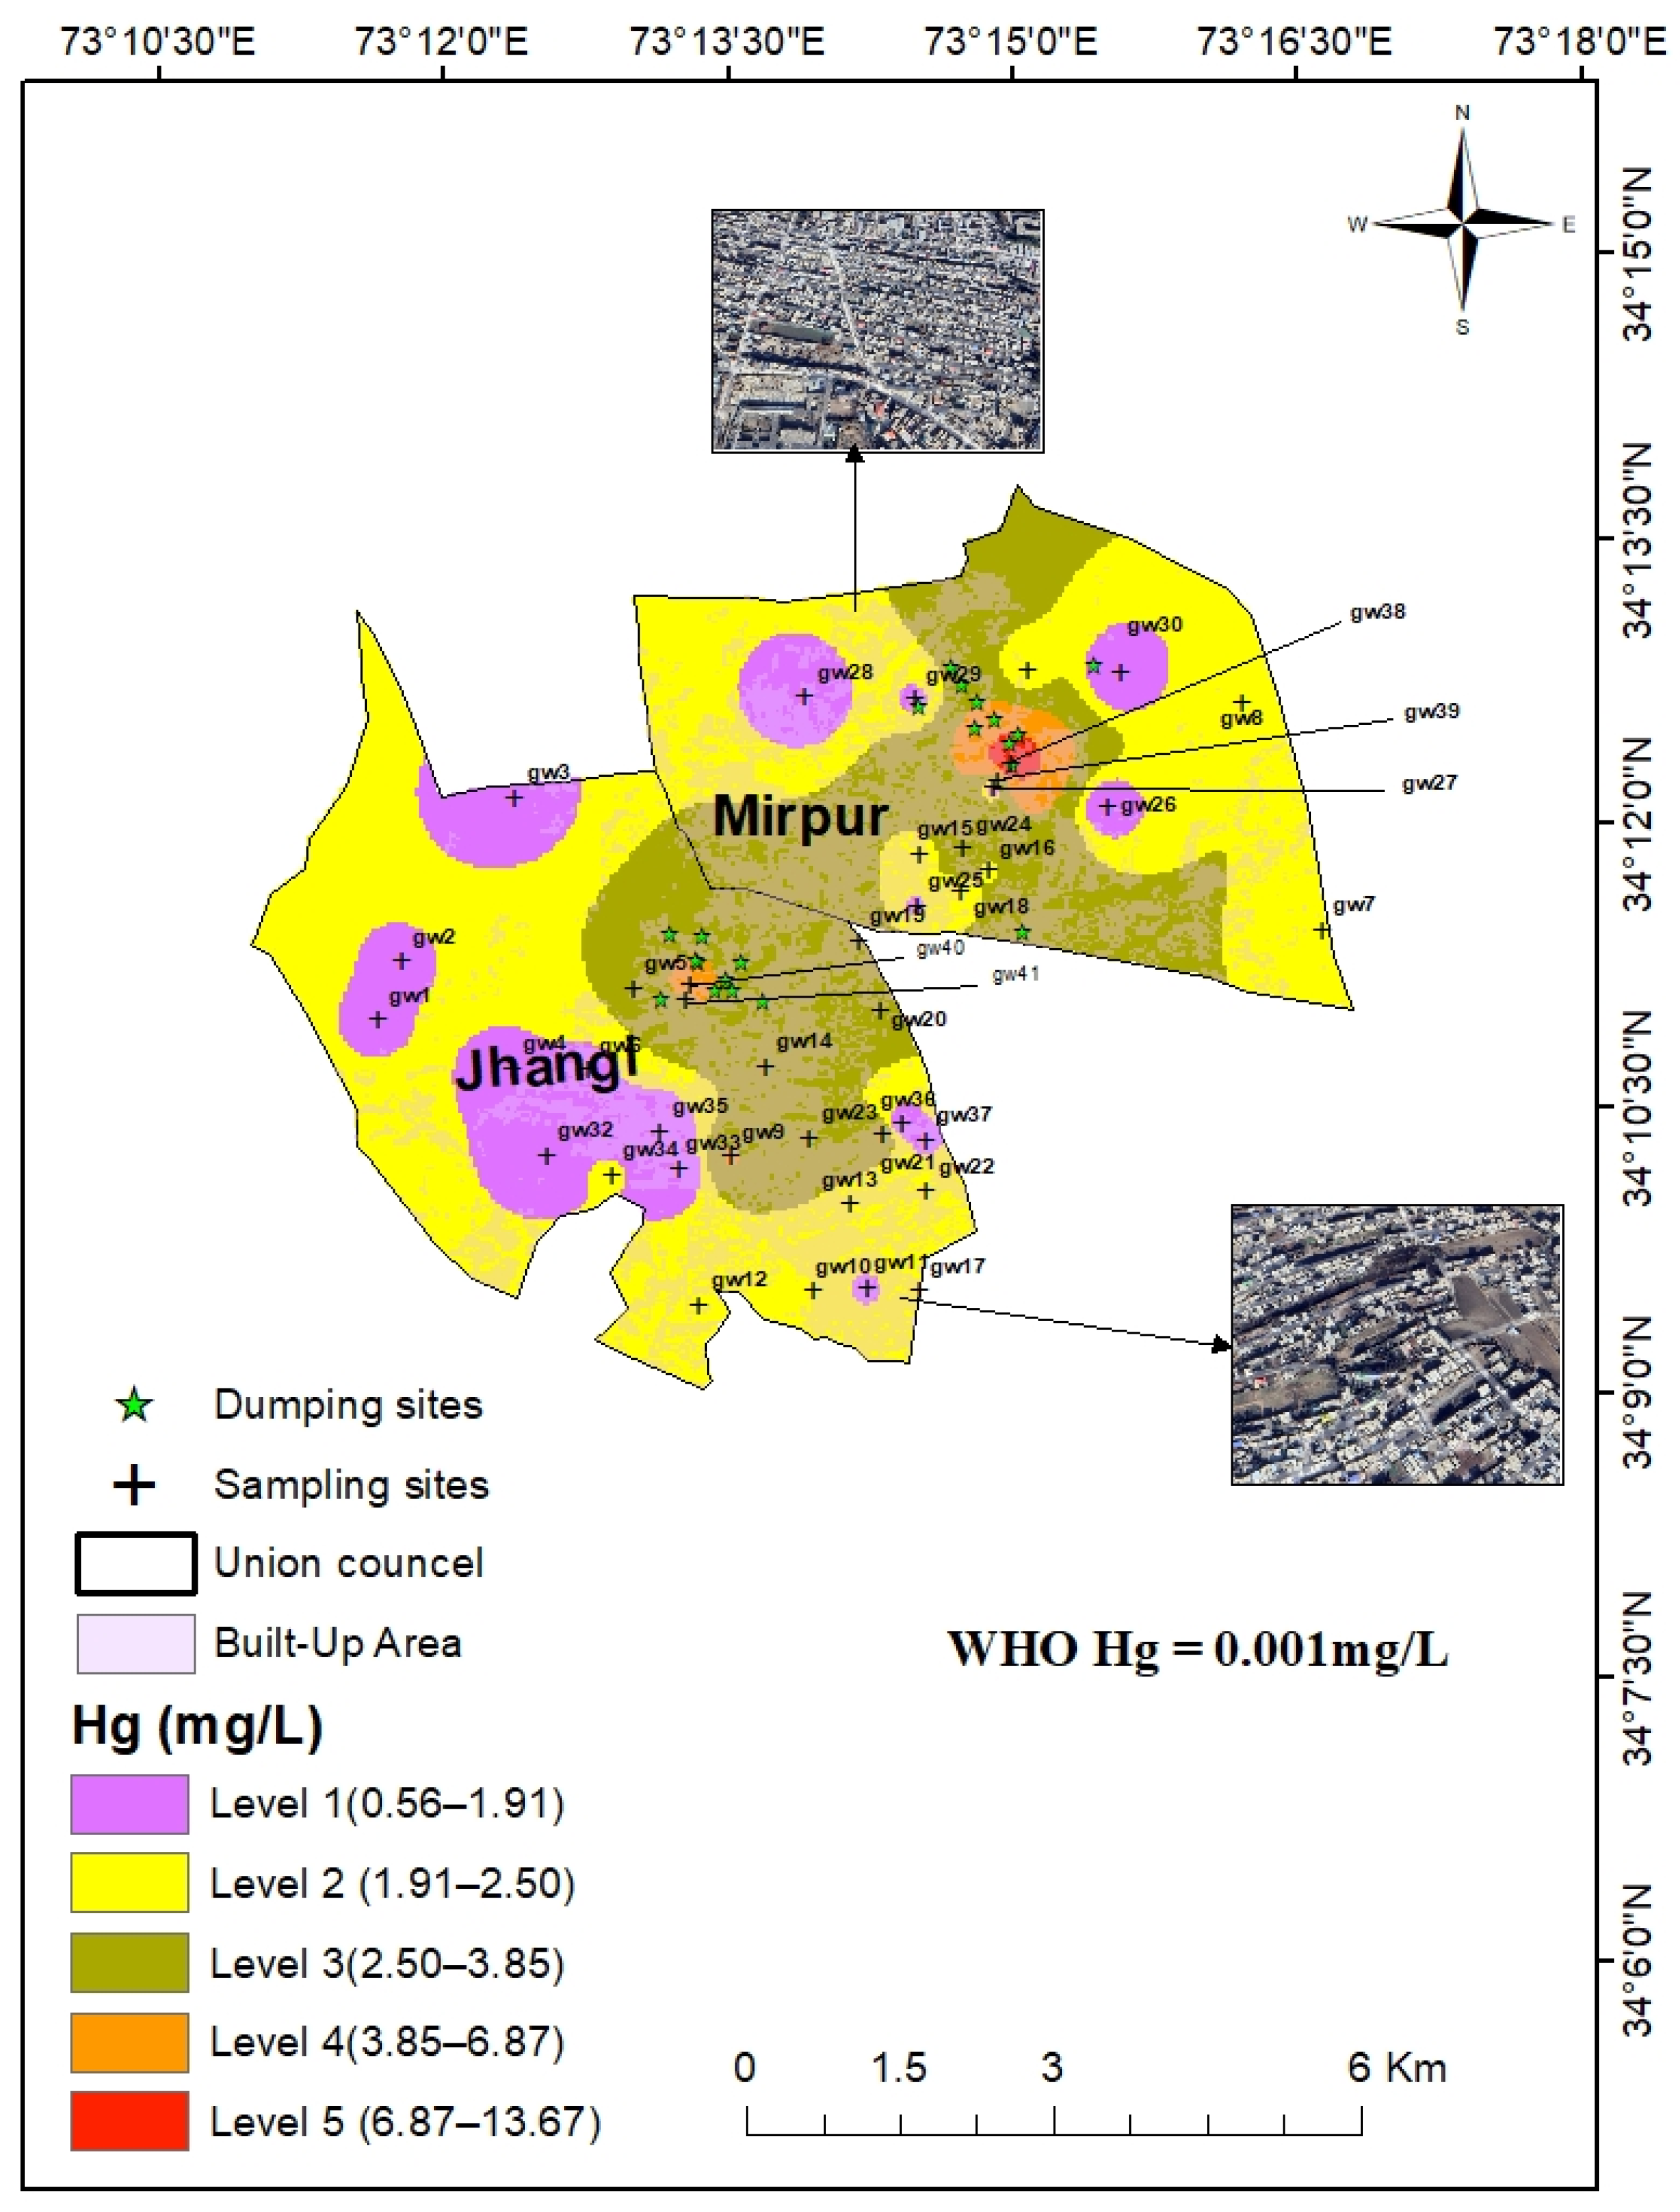
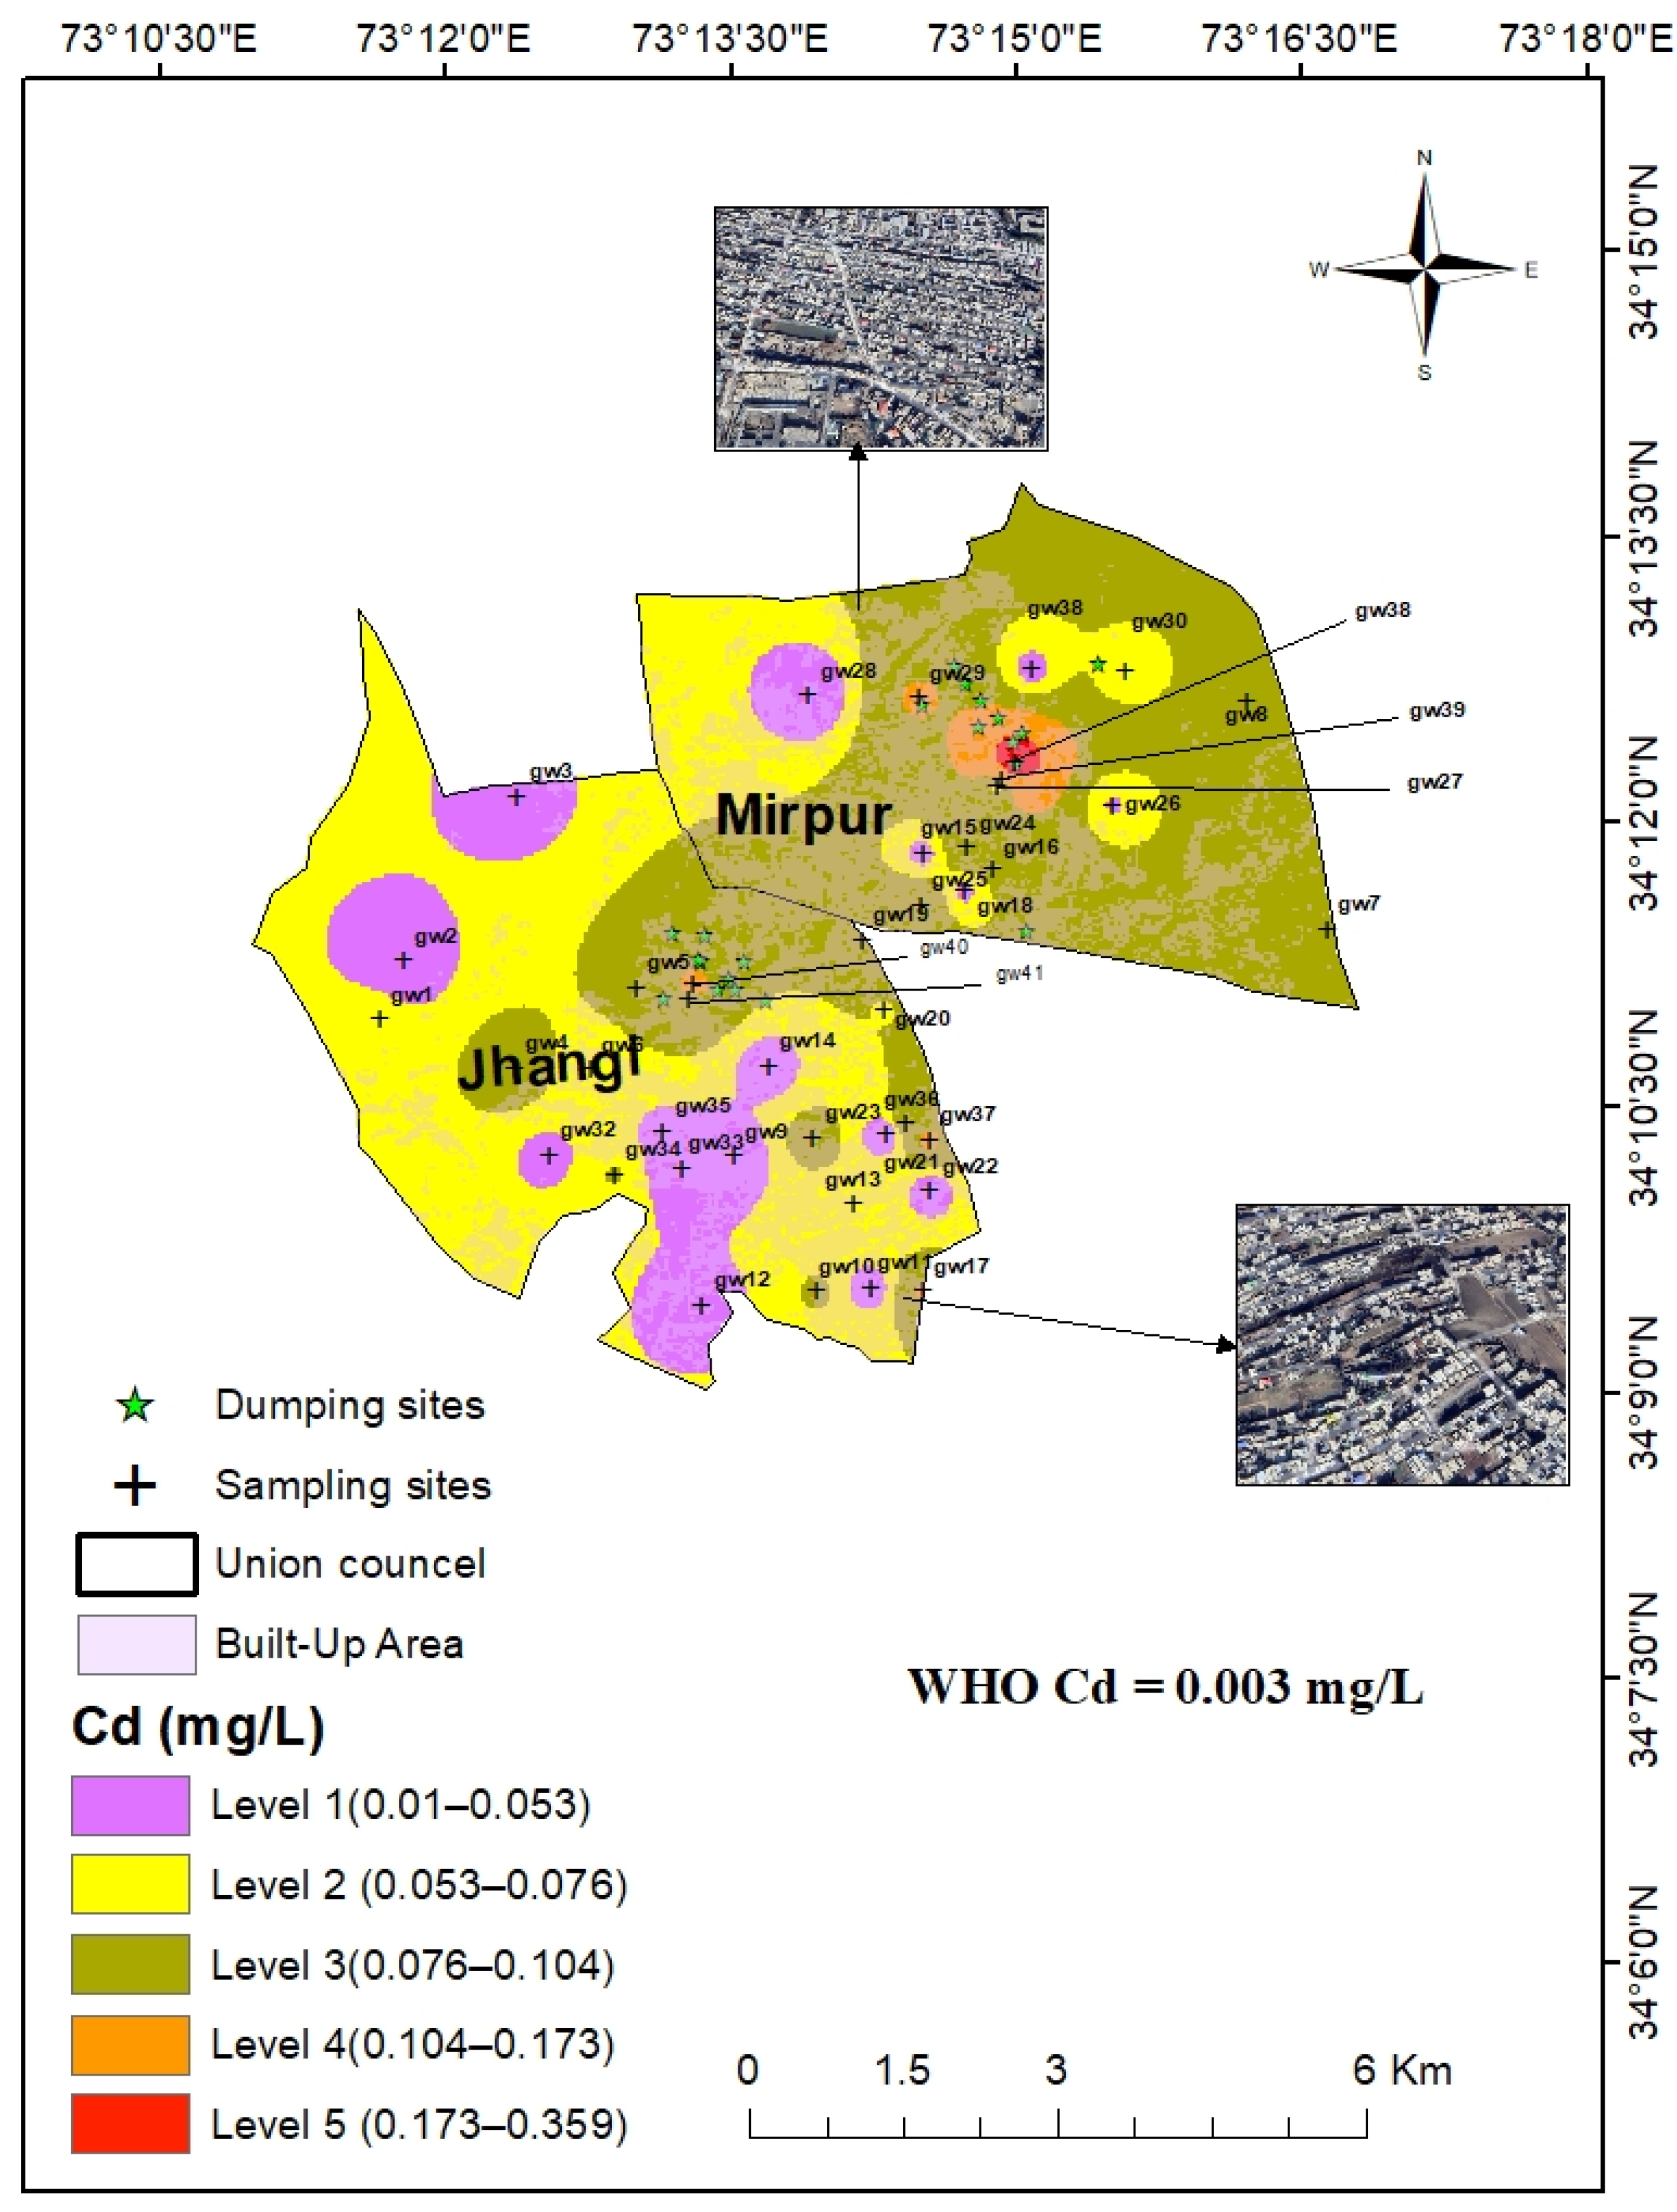
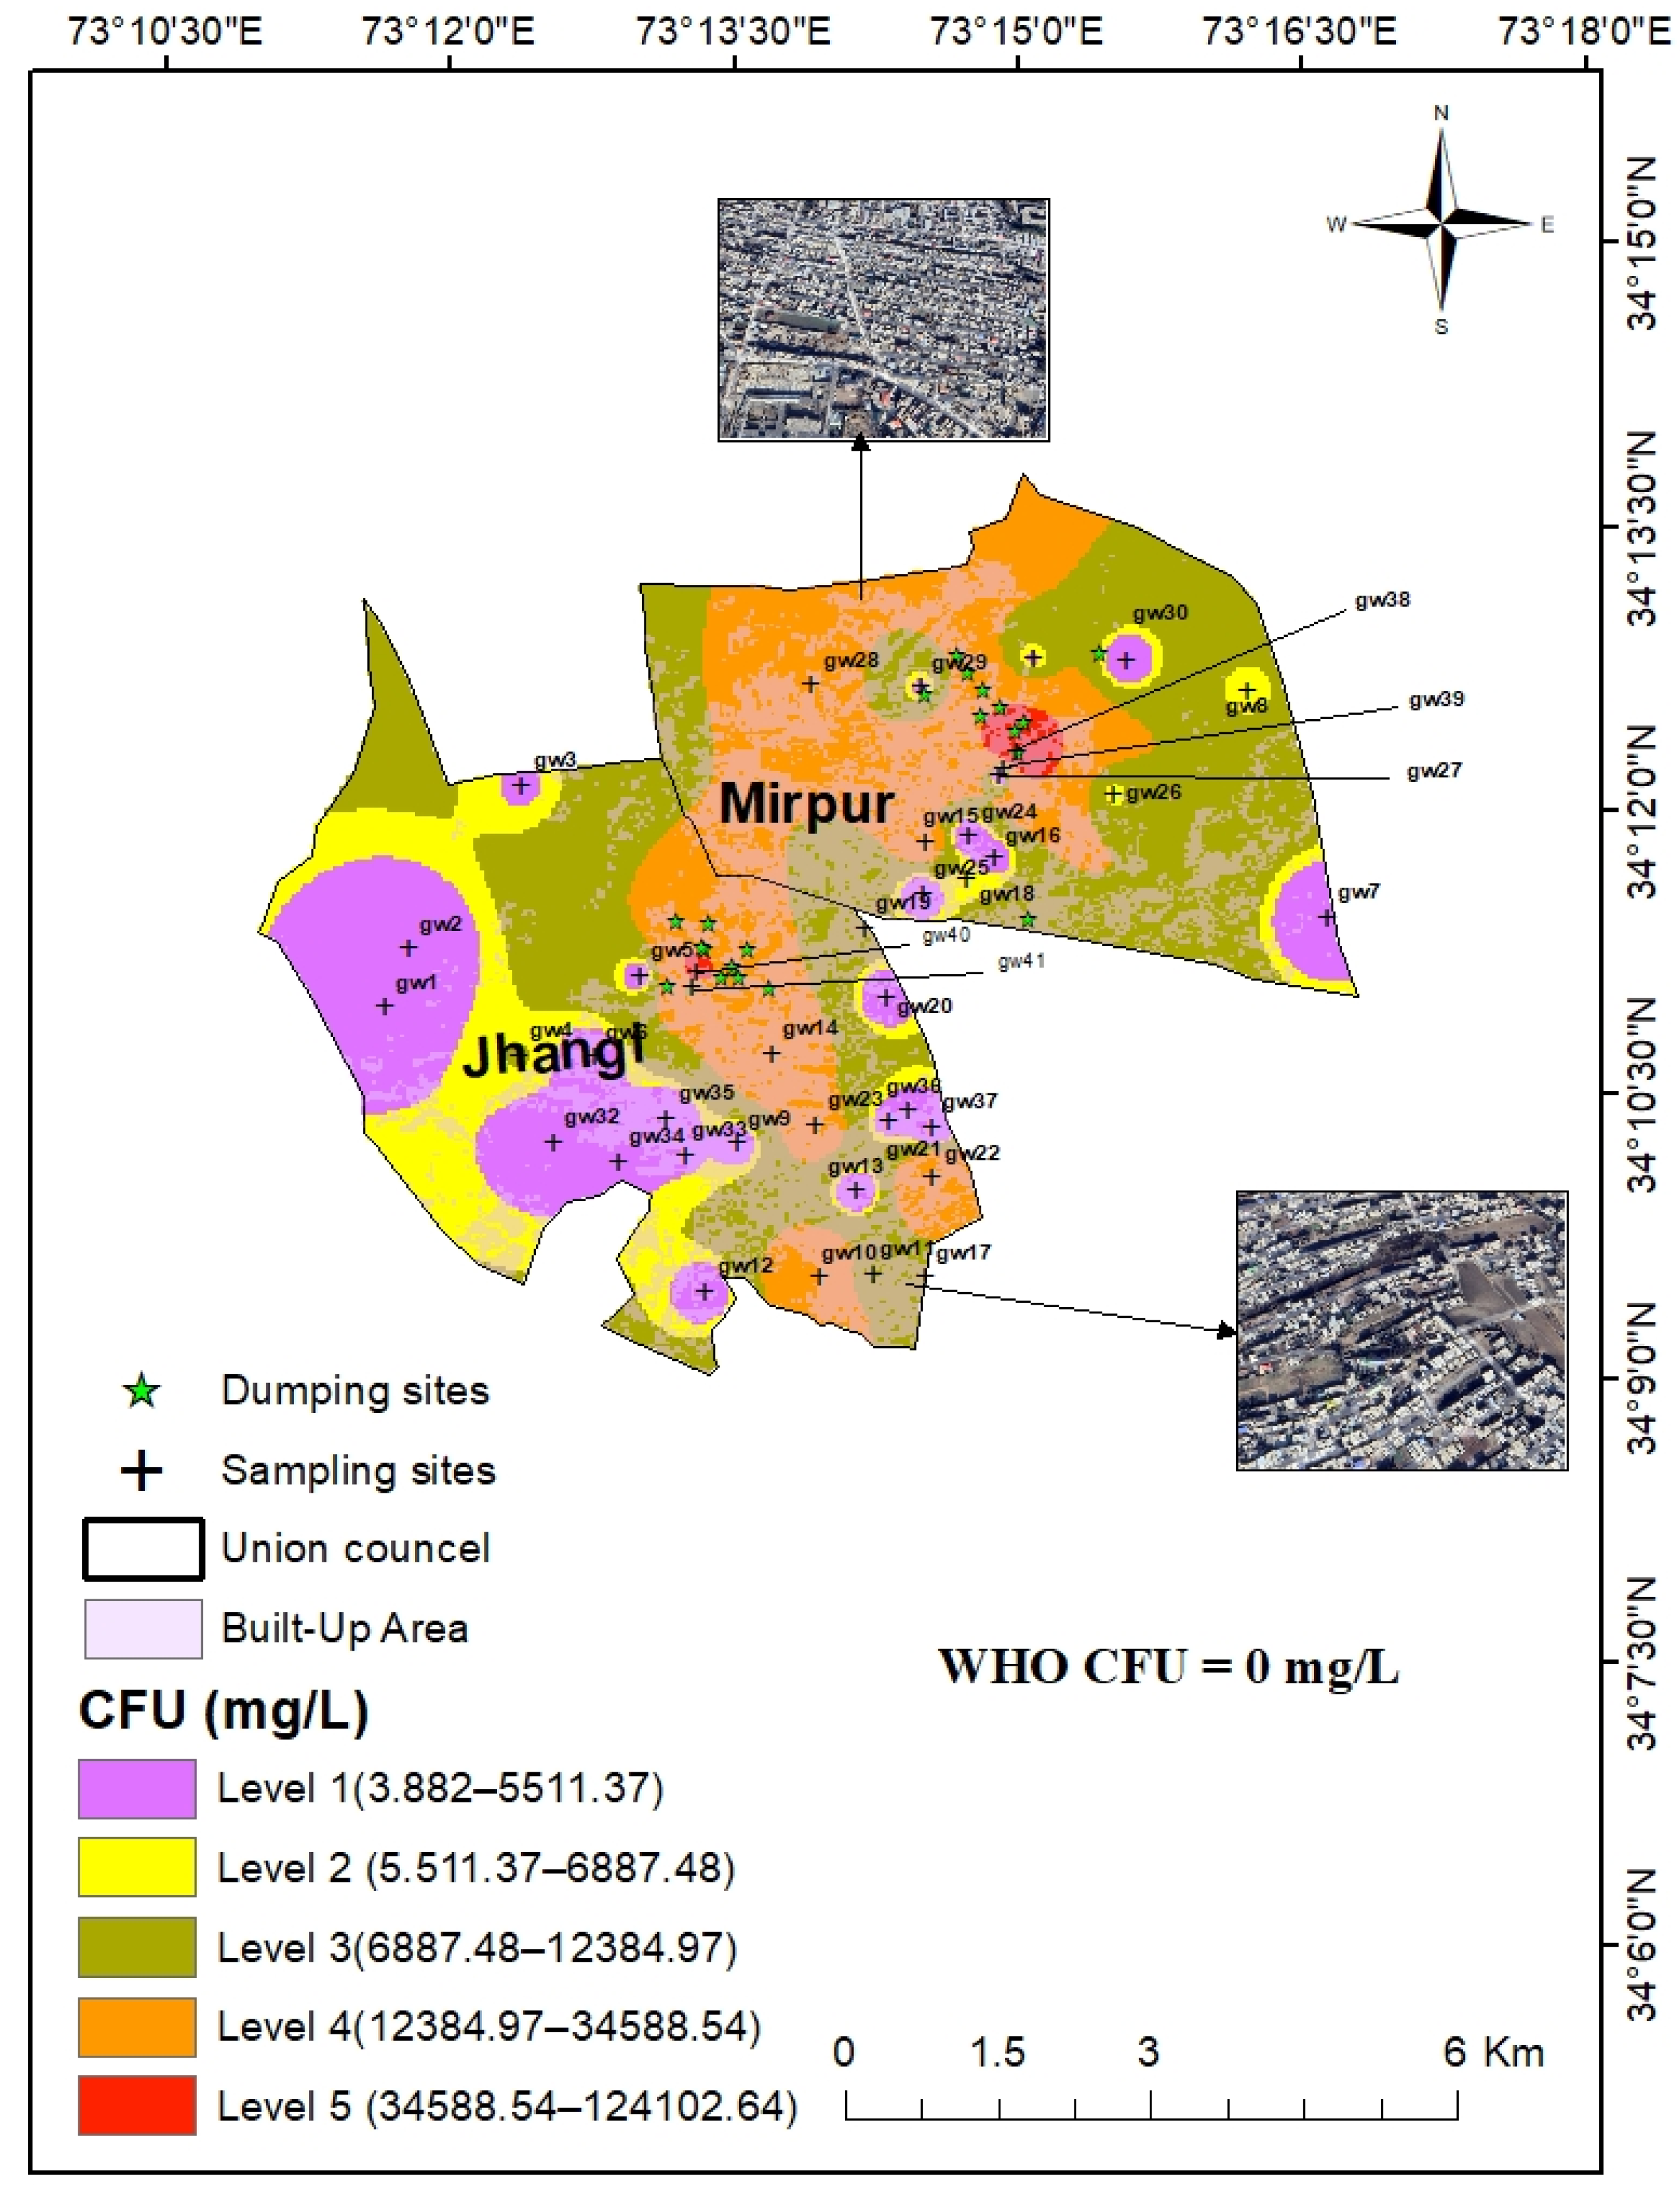
3.3. GIS Modeling for Exceeded Parameters
4. Conclusions
Author Contributions
Funding
Institutional Review Board Statement
Informed Consent Statement
Data Availability Statement
Acknowledgments
Conflicts of Interest
References
- Ashbolt, N.J. Microbial contamination of drinking water and disease outcomes in developing regions. Toxicology 2004, 198, 229–238. [Google Scholar] [CrossRef] [PubMed]
- Bain, R.; Cronk, R.; Hossain, R.; Bonjour, S.; Onda, K.; Wright, J.; Bartram, J. Global assessment of exposure to faecal contamination through drinking water based on a systematic review. Trop. Med. Int. Health 2014, 19, 917–927. [Google Scholar] [CrossRef] [PubMed]
- Wu, L.; Long, T.Y.; Liu, X.; Guo, J.S. Impacts of climate and land-use changes on the migration of non-point source nitrogen and phosphorus during rainfall-runoff in the Jialing River Watershed, China. J. Hydrol. 2012, 475, 26–41. [Google Scholar] [CrossRef]
- Malik, M.A.; Azam, M.; Saboor, A. Water Quality Status of Upper KPK and Northern Areas of Pakistan; Pakistan Council of Research in Water Resources (PCRWR), Water Resources Research Centre: Peshawar, Pakistan, 2010.
- Ahmed, A.; Iftikhar, H.; Chaudhry, G.M. Water resources and conservation strategy of Pakistan. Pak. Dev. Rev. 2007, 2007, 997–1009. [Google Scholar] [CrossRef]
- Akhtar, N.; Syakir Ishak, M.I.; Bhawani, S.A.; Umar, K. Various natural and anthropogenic factors responsible for water quality degradation: A review. Water 2021, 13, 2660. [Google Scholar] [CrossRef]
- Ejaz, N.; Akhtar, N.; Hashmi, H.; Naeem, U.A. Environmental impacts of improper solid waste management in developing countries: A case study of Rawalpindi city. Sustain. World 2010, 142, 379–387. [Google Scholar]
- Abdel-Shafy, H.I.; Mansour, M.S. Solid waste issue: Sources, composition, disposal, recycling, and valorization. Egypt. J. Pet. 2018, 27, 1275–1290. [Google Scholar] [CrossRef]
- Abiriga, D.; Vestgarden, L.S.; Klempe, H. Groundwater contamination from a municipal landfill: Effect of age, landfill closure, and season on groundwater chemistry. Sci. Total Environ. 2020, 737, 140307. [Google Scholar] [CrossRef]
- Chhatwal, G.R. Dictionary of Environmental Chemistry; Anmol Publications: New Delhi, India, 1990. [Google Scholar]
- Daud, M.K.; Nafees, M.; Ali, S.; Rizwan, M.; Bajwa, R.A.; Shakoor, M.B.; Zhu, S.J. Drinking water quality status and contamination in Pakistan. Biomed. Res. Int. 2017, 2017, 7908183. [Google Scholar] [CrossRef]
- Gunarathne, V.; Ashiq, A.; Ramanayaka, S.; Wijekoon, P.; Vithanage, M. Biochar from municipal solid waste for resource recovery and pollution remediation. Environ. Chem Lett. 2019, 17, 1225–1235. [Google Scholar] [CrossRef]
- Rehman, A.; Saeed, S.; Aslam, M.S.; Khan, M.W. Municipal solid waste management crises in the developing countries: A case study of Peshawar city. Int. J. Basic Appl. Sci. 2018, 5, 23–32. [Google Scholar]
- Ebistu, T.A.; Minale, A.S. Solid waste dumping site suitability analysis using geographic information system (GIS) and remote sensing for Bahir Dar Town, Northwestern Ethiopia. Afr. J. Environ. Sci. Technol. 2013, 7, 976–989. [Google Scholar] [CrossRef]
- Ali, S.M.; Pervaiz, A.; Afzal, B.; Hamid, N.; Yasmin, A. Open dumping of municipal solid waste and its hazardous impacts on soil and vegetation diversity at waste dumping sites of Islamabad city. J. King. Saud. Univ. Sci. 2014, 26, 59–65. [Google Scholar] [CrossRef]
- Yasin, H.; Usman, M. Site investigation of open dumping site of municipal solid waste in Faisalabad. Earth Sci. Pak. 2017, 1, 23–25. [Google Scholar] [CrossRef]
- Pakistan Environmental Protection Agency. Pakistan Environmental Protection Act (PEPA). 1997. Available online: www.environment.gov.pk (accessed on 5 March 2021).
- Usman, M.; Yasin, H.; Nasir, D.A.; Mehmood, W. A case study of groundwater contamination due to open dumping of municipal solid waste in Faisalabad, Pakistan. Earth Sci. Pak. 2017, 1, 15–16. [Google Scholar] [CrossRef]
- Kundi, B. Pakistan’s Water Crisis: Why a National Water Policy Is Needed; The Asia Foundation: San Francisco, CA, USA, 2017. [Google Scholar]
- ADB. Solid Waste Management Sector in Pakistan. 2022. Available online: https://www.adb.org/sites/default/files/publication/784421/solid-waste-management-pakistan-road-map.pdf (accessed on 7 July 2021).
- Talib, M.A.; Tang, Z.; Shahab, A.; Siddique, J.; Faheem, M.; Fatima, M. Hydrogeochemical characterization and suitability assessment of groundwater: A case study in Central Sindh, Pakistan. Int. J. Environ. Health Res. 2019, 16, 886. [Google Scholar] [CrossRef]
- Khatri, N.; Tyagi, S. Influences of natural and anthropogenic factors on surface and groundwater quality in rural and urban areas. Front. Life Sci. 2015, 8, 23–39. [Google Scholar] [CrossRef]
- Srinkanth, R.; Rao, A.M.M.; Khanum, A.; Reddy, S.R.P. Mercury contamination of groundwater around Hussain Sagar Lake, India. Bull. Environ. Contam. Toxicol. 1993, 51, 96–98. [Google Scholar]
- Dey, N.C.; Parvez, M.; Dey, D.; Saha, R.; Ghose, L.; Barua, M.K.; Chowdhury, M.R. Microbial contamination of drinking water from risky tubewells situated in different hydrological regions of Bangladesh. Int. J. Hyg. Environ. Health 2017, 220, 621–636. [Google Scholar] [CrossRef]
- Bhutta, M.; Ramzan, M.; Hafeez, C.A. Pakistan Council for Research in Water Resources; Pakistan Council: Islamabad, Pakistan, 2008. [Google Scholar]
- Dumenci, N.A.; Yolcu, O.C.; Temel, F.A.; Turan, N.G. Identifying the maturity of co-compost of olive mill waste and natural mineral materials: Modelling via ANN and multi-objective optimization. Bioresour. Technol. 2021, 338, 125516. [Google Scholar] [CrossRef]
- Haghizadeh, A.; Moghaddam, D.D.; Pourghasemi, H.R. GIS-based bivariate statistical techniques for groundwater potential analysis (an example of Iran). J. Earth Syst. Sci. 2017, 126, 1–17. [Google Scholar] [CrossRef]
- Zeinivand, H.; Ghorbani Nejad, S. Application of GIS-based data-driven models for groundwater potential mapping in Kuhdasht region of Iran. Geocarto Int. 2018, 33, 651–666. [Google Scholar] [CrossRef]
- Khodaparast, M.; Rajabi, A.M.; Edalat, A. Municipal solid waste landfill siting by using GIS and analytical hierarchy process (AHP): A case study in Qom city, Iran. Environ. Earth Sci. 2018, 77, 1–12. [Google Scholar] [CrossRef]
- Akbar, T.A.; Hassan, Q.K.; Achari, G. A methodology for clustering lakes in Alberta on the basis of water quality parameters. Clean Soil Air Water 2011, 39, 916–924. [Google Scholar] [CrossRef]
- Abou Zakhem, B.; Al-Charideh, A.; Kattaa, B. Using principal component analysis in the investigation of groundwater hydrochemistry of Upper Jezireh Basin, Syria. Hydrol. Sci. J. 2017, 62, 2266–2279. [Google Scholar] [CrossRef]
- Amanah, T.R.N.; Putranto, T.T.; Helmi, M. Application of cluster analysis and principal component analysis for assessment of groundwater quality—A study in Semarang, Central Java, Indonesia. In IOP Conference Series: Earth and Environmental Science; IOP Publishing: Bristol, UK, 2019; Volume 2019248, p. 012063. [Google Scholar]
- Ali, M.; Chandu, V.; Nandini, V.; Mostafa, M.; Alkendi, R. Evaluation of water quality in the households of Baniyas Region, Abu Dhabi using multivariate statistical approach. Sustain. Water Resour. Manag. 2019, 5, 1579–1592. [Google Scholar] [CrossRef]
- Yang, G.; Moyer, D.L. Estimation of nonlinear water-quality trends in high-frequency monitoring data. Sci. Total Environ. 2020, 715, 136686. [Google Scholar] [CrossRef]
- Ramadas, M.; Samantaray, A.K. Applications of remote sensing and GIS in water quality monitoring and remediation: A state-of-the-art review. Water Remediat. 2018, 2018, 225–246. [Google Scholar]
- Ahmadi, H.; Kaya, O.A.; Babadagi, E.; Savas, T.; Pekkan, E. GIS-based groundwater potentiality mapping using AHP and FR models in central antalya, Turkey. Environ. Sci. Proc. 2020, 5, 11. [Google Scholar]
- Ozdemir, A. Using a binary logistic regression method and GIS for evaluating and mapping the groundwater spring potential in the Sultan Mountains (Aksehir, Turkey). J. Hydrol. 2011, 405, 123–136. [Google Scholar] [CrossRef]
- Naghibi, S.A.; Pourghasemi, H.R.; Pourtaghi, Z.S.; Rezaei, A. Groundwater qanat potential mapping using frequency ratio and Shannon’s entropy models in the Moghan watershed, Iran. Earth Sci. Inform. 2015, 8, 171–186. [Google Scholar] [CrossRef]
- Aguilera, P.A.; Fernández, A.; Ropero, R.F.; Molina, L. Groundwater quality assessment using data clustering based on hybrid Bayesian networks. Stoch. Environ. Res. Risk Assess. 2013, 27, 435–447. [Google Scholar] [CrossRef]
- Duan, H.; Deng, Z.; Deng, F.; Wang, D. Assessment of Groundwater Potential Based on Multicriteria Decision Making Model and Decision Tree Algorithms. Math. Probl. Eng. 2016, 16, 1–11. [Google Scholar] [CrossRef]
- Chen, W.; Li, H.; Hou, E.; Wang, S.; Wang, G.; Panahi, M.; Ahmad, B.B. GIS-based groundwater potential analysis using novel ensemble weights-of-evidence with logistic regression and functional tree models. Sci. Total Environ. 2018, 634, 853–867. [Google Scholar] [CrossRef] [PubMed]
- Adeyeye, O.A.; Ikpokonte, E.A.; Arabi, S.A. GIS-based groundwater potential mapping within Dengi area, North Central Nigeria. Egypt. J. Remote Sens. Space Sci. 2019, 22, 175–181. [Google Scholar] [CrossRef]
- Ahmed, T.; Pervez, A.; Mehtab, M.; Sherwani, S.K. Assessment of drinking water quality and its potential health impacts in academic institutions of Abbottabad (Pakistan). Desalination Water Treat. 2015, 54, 1819–1828. [Google Scholar] [CrossRef]
- Local Government. Elections and Rural Development Department. District Abbottabad. 2022. Available online: https://www.lgkp.gov.pk/districts/district-abbottabad/ (accessed on 31 January 2022).
- Talang, R.P.N.; Sirivithayapakorn, S. Environmental and financial assessments of open burning, open dumping and integrated municipal solid waste disposal schemes among different income groups. J. Clean. Prod. 2021, 312, 127761. [Google Scholar] [CrossRef]
- Boateng, T.K.; Opoku, F.; Akoto, O. Heavy metal contamination assessment of groundwater quality: A case study of Oti landfill site, Kumasi. Appl. Water Sci. 2019, 9, 1–15. [Google Scholar] [CrossRef]
- Wilk-Woźniak, E.; Ligęza, S.; Shubert, E. Effect of Water Quality on Phytoplankton Structure in Oxbow Lakes under Anthropogenic and Non-Anthropogenic Impacts. Soil Air Water 2014, 42, 421–427. [Google Scholar] [CrossRef]
- Ullah, S.; Ahmad, K.; Sajjad, R.U.; Abbasi, A.M.; Nazeer, A.; Tahir, A.A. Analysis and simulation of land cover changes and their impacts on land surface temperature in a lower Himalayan region. J. Environ. Manag. 2019, 245, 348–357. [Google Scholar] [CrossRef]
- Goswami, R.; Kumar, M.; Biyani, N.; Shea, P.J. Arsenic exposure and perception of health risk due to groundwater contamination in Majuli (river island), Assam, India. Environ. Geochem. Health 2020, 42, 443–460. [Google Scholar] [CrossRef] [PubMed]
- Nisbet, R.; Elder, J.; Miner, G. Handbook of Statistical Analysis and Data Mining Applications; Academic Press: Cambridge, MA, USA, 2009. [Google Scholar]
- Wu, Z.G.; Jiang, W.; Nitin, M.; Bao, X.Q.; Chen, S.L.; Tao, Z.M. Characterizing diversity based on nutritional and bioactive compositions of yam germplasm (Dioscorea spp.) commonly cultivated in China. J. Food Drug Anal. 2016, 24, 367–375. [Google Scholar] [CrossRef] [PubMed]
- Vongdala, N.; Tran, H.D.; Xuan, T.D.; Teschke, R.; Khanh, T.D. Heavy metal accumulation in water, soil, and plants of municipal solid waste landfill in Vientiane, Laos. Int. J. Environ. Res. Public Health 2019, 16, 22. [Google Scholar] [CrossRef] [PubMed]
- Gu, K.; Zhou, Y.; Sun, H.; Dong, F.; Zhao, L. Spatial distribution, and determinants of PM2. 5 in China’s cities: Fresh evidence from IDW and GWR. Environ. Monit. Assess. 2021, 193, 1–22. [Google Scholar] [CrossRef] [PubMed]
- Sayadi Shahraki, A.; Boroomand Nasab, S.; Naseri, A.A.; Soltani Mohammadi, A. Estimation of groundwater depth using ANN-PSO, kriging, and IDW models (case study: Salman Farsi Sugarcane Plantation). Cent. Asian J. Environ. Sci. Technol. Innov. 2021, 2, 91–101. [Google Scholar] [CrossRef]
- Gong, G.; Mattevada, S.; O’Bryant, S.E. Comparison of the accuracy of kriging and IDW interpolations in estimating groundwater arsenic concentrations in Texas. Environ. Res. 2014, 130, 59–69. [Google Scholar] [CrossRef]
- Spokas, K.; Graff, C.; Morcet, M.; Aran, C. Implications of the spatial variability of landfill emission rates on geospatial analyses. J. Waste Manag. 2003, 23, 599–607. [Google Scholar] [CrossRef]
- Zhou, Y.; Michalak, A.M. Characterizing attribute distributions in water sediments by geostatistical downscaling. Environ. Sci. Technol. 2009, 43, 9267–9273. [Google Scholar] [CrossRef][Green Version]
- World Health Organization. Guidelines for Drinking-Water Quality; WHO: Geneva, Switzerland, 1993.
- Hassan, A.; Kura, N.U.; Amoo, A.O.; Adeleye, A.O.; Ijanu, E.M.; Bate, G.B.; Okunlola, I.A. Assessment of Landfill Induced Ground Water Pollution of Selected Boreholes and Hand-Dug Wells around Ultra-Modern Market Dutse North-West, Nigeria. Environ. Stud. 2018, 1, 1–10. [Google Scholar]
- Idrees, N.; Tabassum, B.; Abd_Allah, E.F.; Hashem, A.; Sarah, R.; Hashim, M. Groundwater contamination with cadmium concentrations in some West UP Regions, India. Saudi J. Biol. Sci. 2018, 25, 1365–1368. [Google Scholar] [CrossRef]
- Nabeela, F.; Azizullah, A.; Bibi, R.; Uzma, S.; Murad, W.; Shakir, S.K.; Ullah, W.; Qasim, M.; Häder, D.P. Microbial contamination of drinking water in Pakistan—A review. Environ. Sci. Pollut. Res. 2014, 21, 13929–13942. [Google Scholar] [CrossRef] [PubMed]
- Obasi, P.N.; Akudinobi, B.B. Potential health risk and levels of heavy metals in water resources of lead–zinc mining communities of Abakaliki, southeast Nigeria. Appl. Water Sci. 2020, 10, 1–23. [Google Scholar] [CrossRef]
- Gu, S.; Dai, J.; Qu, T.; He, Z. Emerging roles of microRNAs and long noncoding RNAs in cadmium toxicity. Biol. Trace Elem. Res. 2020, 195, 481–490. [Google Scholar] [CrossRef] [PubMed]
- Sarlinova, M.; Majerova, L.; Matakova, T.; Musak, L.; Slovakova, P.; Skerenova, M.; Kavcova, E.; Halasova, E. Polymorphisms of DNA repair genes and lung cancer in chromium exposure. Lung Cancer Autoimmune Disord. 2014, 833, 1–8. [Google Scholar] [CrossRef]
- Batayneh, A.; Ghrefat, H.; Zaman, H.; Mogren, S.; Zumlot, T.; Elawadi, E.; Laboun, A.; Qaisy, S. Assessment of the physicochemical parameters and heavy metals toxicity: Application to groundwater quality in unconsolidated shallow aquifer system. Res. J. Environ. Toxicol. 2012, 6, 169. [Google Scholar] [CrossRef]
- Abdelwaheb, M.; Jebali, K.; Dhaouadi, H.; Dridi-Dhaouadi, S. Adsorption of nitrate, phosphate, nickel and lead on soils: Risk of groundwater contamination. Ecotoxicol. Environ. Saf. 2019, 179, 182–187. [Google Scholar] [CrossRef]
- WHO. Arsenic. 2022. Available online: https://www.who.int/news-room/fact-sheets/detail/arsenic (accessed on 31 January 2022).
- Wang, X.; Liu, L.; Zhao, L.; Xu, H.; Zhang, X. Assessment of dissolved heavy metals in the Laoshan Bay, China. Mar. Pollut. Bull. 2019, 149, 110608. [Google Scholar] [CrossRef]
- Batayneh, A.T.; Al-Taani, A.A. Integrated resistivity and water chemistry for evaluation of groundwater quality of the Gulf of Aqaba coastal area in Saudi Arabia. Geosci. J. 2016, 20, 403–413. [Google Scholar] [CrossRef]
- Salam, M.; Alam, F.; Hossain, M.; Saeed, M.A.; Khan, T.; Zarin, K.; Rwan, B.; Ullah, W.; Khan, W.; Khan, O. Assessing the drinking water quality of educational institutions at selected locations of district Swat, Pakistan. Environ. Earth Sci. 2021, 80, 1–11. [Google Scholar] [CrossRef]
- Kopittke, P.M.; Menzies, N.W. Effect of Cu toxicity on growth of cowpea (Vigna unguiculata). Plant Soil 2006, 279, 287–296. [Google Scholar] [CrossRef]
- Zanonib, A.E. Ground-Water Pollution and Sanitary Landfills; US Government Printing Office: Washington, DC, USA, 1972; p. 87.
- Reinhart, D.R.; Grosh, C.J. Analysis of Florida MSW Landfill Leachate Quality; Report 97-3; Florida Center for Solid and Hazardous Waste Management: Tallahassee, FL, USA, 1998; pp. 31–53.
- Kjeldsen, P.; Christophersen, M. Composition of leachate from old landfills in Denmark. Waste Manag. Res. 2001, 19, 249–256. [Google Scholar] [CrossRef]
- Han, H. The norm activation model and theory-broadening: Individuals’ decision-making on environmentally responsible convention attendance. J. Environ. Psychol. 2014, 40, 462–471. [Google Scholar] [CrossRef]
- Christensen, T.H.; Kjeldsen, P.; Albrechtsen, H.J.R.; Heron, G.; Nielsen, P.H.; Bjerg, P.L.; Holm, P.E. Attenuation of landfill leachate pollutants in aquifers. Crit. Rev. Environ. Sci. Technol. 1994, 24, 119–202. [Google Scholar] [CrossRef]
- Christensen, T.H.; Kjeldsen, P.; Bjerg, P.L.; Jensen, D.L.; Christensen, J.B.; Baun, A.; Heron, G. Biogeochemistry of landfill leachate plumes. Appl. Geochem. 2001, 16, 659–718. [Google Scholar] [CrossRef]
- Rashid, S.; Shah, I.A.; Tulcan, R.X.S.; Rashid, W.; Sillanpaa, M. Contamination, exposure, and health risk assessment of Hg in Pakistan: A review. Environ. Pollut. 2022, 2022, 118995. [Google Scholar] [CrossRef] [PubMed]
- USA EPA. Health Effects of Exposures to Mercury. 2022. Available online: https://www.epa.gov/mercury/health-effects-exposures-mercury (accessed on 14 April 2022).
- Clark, L. Disease risks posed by wild birds associated with agricultural landscapes. Prod. Contam. Probl. 2014, 2014, 139–165. [Google Scholar]
- Akbar, T.A.; Lin, H. GIS based ArcPRZM-3 model for bentazon leaching towards groundwater. J. Environ. Sci. 2010, 22, 1854–1859. [Google Scholar] [CrossRef]


| Parameters | Instrument Detection Limit |
|---|---|
| As | 1 (mg/L) |
| Hg | 4.2 (mg/L) |
| Pb | 0.45 (mg/L) |
| Cd | 0.028 (mg/L) |
| Fe | 0.1 (mg/L) |
| K | 0.043 (mg/L) |
| Zn | 0.018 (mg/L) |
| Ca | 0.092 (mg/L) |
| Na | 0.012 (mg/L) |
| pH | 0–14 |
| EC | 99.9 µs/cm |
| TDS | 50 ppm |
| Turbidity | 0.05 NTU/FNU |
| Parameters | WHO Drinking Water Standards |
|---|---|
| Physicochemical Parameters | |
| pH | 6.5–8.5 |
| TDS (ppm) | 1000 |
| Tur (NTU) | <5 |
| EC (µS cm−1) | 400 |
| DO (ppm) | 6.5–8 |
| Na (mg/L) | 200 |
| Ca (mg/L) | 100 |
| Microbiological Parameter | |
| Total coliforms | 0 (CFU/mL) |
| Heavy Metals | |
| As (mg/L) | 0.05 |
| Hg (mg/L) | 0.001 |
| Pb (mg/L) | 0.01 |
| Cd (mg/L) | 0.003 |
| Zn (mg/L) | 3 |
| K (mg/L) | 12 |
| Fe (mg/L) | 0.3 |
| Locations | pH (0–14) | Turbidity NTU | TDS (ppm) | EC (µS cm−1) | Sodium (mg/L) | Calcium (mg/L) |
|---|---|---|---|---|---|---|
| gw1 | 7.03 | 0.48 | 120 | 226 | 11.12 | 145.8 |
| gw2 | 7.26 | 0.71 | 112 | 213 | 9.62 | 134.5 |
| gw3 | 6.73 | 0.51 | 119 | 226 | 11.73 | 136.2 |
| gw4 | 8.14 | 1.03 | 103 | 192 | 9.63 | 100.3 |
| gw5 | 7.61 | 0.69 | 52 | 98 | 8.99 | 23.82 |
| gw6 | 7.94 | 1.69 | 48.3 | 97 | 5.71 | 76.28 |
| gw7 | 7.51 | 1.84 | 227 | 455 | 12.44 | 71.39 |
| gw8 | 7.01 | 1.51 | 46.7 | 93 | 3.03 | 60.31 |
| gw9 | 7.78 | 1.79 | 272 | 546 | 17.73 | 54.49 |
| gw10 | 7.34 | 2.8 | 284 | 568 | 9.83 | 78.97 |
| gw11 | 7.32 | 2.88 | 316 | 633 | 0.99 | 73.49 |
| gw12 | 6.93 | 2.65 | 572 | 1144 | 15.34 | 114 |
| gw13 | 7.56 | 2.15 | 349 | 697 | 11.74 | 97.94 |
| gw14 | 7.42 | 1.67 | 312 | 624 | 10.77 | 85.13 |
| gw15 | 7.11 | 2.04 | 450 | 901 | 11.96 | 95.09 |
| gw16 | 7.02 | 2.39 | 364 | 730 | 7.88 | 80.47 |
| gw17 | 7.84 | 1.87 | 385 | 770 | 9.57 | 82.72 |
| gw18 | 7.14 | 1.64 | 272 | 544 | 6.35 | 70.23 |
| gw19 | 7.4 | 1.91 | 365 | 730 | 9.17 | 80.22 |
| gw20 | 7.17 | 2.58 | 325 | 651 | 8.45 | 74.22 |
| gw21 | 7.47 | 1.34 | 265 | 531 | 7.28 | 49.79 |
| gw22 | 7.07 | 4.4 | 633 | 1266 | 14.28 | 76.85 |
| gw23 | 7.97 | 3.01 | 393 | 786 | 24.95 | 45.03 |
| gw24 | 7.17 | 1.64 | 278 | 556 | 5.82 | 71.22 |
| gw25 | 6.99 | 0.92 | 334 | 662 | 13.77 | 111.21 |
| gw26 | 7.05 | 1.24 | 377 | 744 | 5.15 | 134.32 |
| gw27 | 6.6 | 0.8 | 256 | 514 | 22.35 | 98.17 |
| gw28 | 6.96 | 3.45 | 424 | 849 | 10.84 | 76.92 |
| gw29 | 6.95 | 3.26 | 320 | 641 | 18.78 | 82.73 |
| gw30 | 6.91 | 2.76 | 72 | 146 | 7.84 | 45.29 |
| gw31 | 6.88 | 1.73 | 511 | 1019 | 17.52 | 23.56 |
| gw32 | 6.39 | 0.8 | 476 | 938 | 11.23 | 39.48 |
| gw33 | 6.76 | 3.78 | 391 | 770 | 8 | 44.76 |
| gw34 | 6.87 | 2.74 | 512 | 1009 | 4.89 | 62.87 |
| gw35 | 6.84 | 0.65 | 475 | 936 | 4.52 | 77.21 |
| gw36 | 8.49 | 2.34 | 85 | 160 | 6.159 | 39.81 |
| gw37 | 8.58 | 3.02 | 91 | 161 | 5.829 | 48.58 |
| gw38 | 8.45 | 2.15 | 114 | 216 | 12.21 | 76.47 |
| gw39 | 8.5 | 2.18 | 90 | 173 | 4.006 | 46.32 |
| gw40 | 8.16 | 2.4 | 98 | 188 | 9.776 | 69.41 |
| gw41 | 8.36 | 2.08 | 101 | 198 | 11.43 | 74.21 |
| Locations | K (mg/L) | Pb (mg/L) | Fe (mg/L) | Zn (mg/L) | Cd (mg/L) | Hg (mg/L) | As (mg/L) | CFU |
|---|---|---|---|---|---|---|---|---|
| gw1 | 1.73 | 0.223 | 2.7 | 0.421 | 0.066 | 1.851 | 17.7 | 0 |
| gw2 | 0.89 | 0.25 | 1.2 | 0.194 | 0.017 | 1.821 | 13 | 0 |
| gw3 | 1.41 | 0.418 | 3.04 | 0.058 | 0.021 | 1.058 | 13.5 | 5000 |
| gw4 | 1.2 | 0.535 | 1.59 | 0.061 | 0.121 | 1.653 | 15.83 | 7000 |
| gw5 | 0.64 | 0.274 | 2.68 | 0.226 | 0.085 | 2.558 | 13.59 | 3000 |
| gw6 | 1.74 | 0.545 | 1.96 | 0.24 | 0.063 | 1.488 | 9.97 | 2000 |
| gw7 | 3.55 | 0.506 | 2.52 | 0.247 | 0.104 | 2.16 | 12.63 | 1000 |
| gw8 | 0.62 | 0.326 | 2.76 | 0.202 | 0.082 | 2.358 | 12.04 | 6000 |
| gw9 | 2.3 | 0.481 | 3.93 | 0.246 | 0.007 | 4.012 | 8.63 | 3000 |
| gw10 | 3.34 | 0.603 | 3.67 | 0.188 | 0.088 | 2.178 | 10.93 | 30,000 |
| gw11 | 1.88 | 0.564 | 4.76 | 0.19 | 0.031 | 1.78 | 9.62 | 7000 |
| gw12 | 3.65 | 0.624 | 3.76 | 0.185 | 0.023 | 2.045 | 9.06 | 3000 |
| gw13 | 2.33 | 0.828 | 4.86 | 0.129 | 0.068 | 2.469 | 7.28 | 1000 |
| gw14 | 1.68 | 0.643 | 4.12 | 0.154 | 0.019 | 2.753 | 9.38 | 30,000 |
| gw15 | 3.7 | 0.706 | 2.24 | 0.215 | 0.036 | 2.113 | 13.43 | 21,000 |
| gw16 | 2.38 | 0.656 | 1.95 | 0.229 | 0.093 | 2.442 | 11.74 | 3000 |
| gw17 | 3.29 | 0.754 | 2.67 | 0.099 | 0.135 | 2.482 | 10.71 | 10,000 |
| gw18 | 2.21 | 0.775 | 4.37 | 0.057 | 0.041 | 2.339 | 11.89 | 6000 |
| gw19 | 2.25 | 0.678 | 0.79 | 0.214 | 0.101 | 3.556 | 6.72 | 7000 |
| gw20 | 2.18 | 0.814 | 1.59 | 0.084 | 0.081 | 2.999 | 12.7 | 1000 |
| gw21 | 2.34 | 0.738 | 3.47 | 0.197 | 0.001 | 3.363 | 14.38 | 4000 |
| gw22 | 3.02 | 0.84 | 3.32 | 0.09 | 0.027 | 2.209 | 16.02 | 32,000 |
| gw23 | 2.34 | 0.958 | 2.6 | 0.149 | 0.115 | 3.089 | 13.46 | 21,000 |
| gw24 | 1.74 | 0.85 | 4.98 | 0.136 | 0.121 | 3.113 | 10.99 | 0 |
| gw25 | 1.06 | 0.739 | 1.03 | 0.821 | 0.133 | 1.789 | 3.28 | 1000 |
| gw26 | 1.88 | 0.278 | 3.67 | 1.021 | 0.05 | 1.014 | 15.14 | 6000 |
| gw27 | 1.92 | 0.442 | 0.6 | 0.527 | 0.071 | 1.212 | 3.87 | 0 |
| gw28 | 3.7 | 0.466 | 3.66 | 1.188 | 0.001 | 0.778 | 16.85 | 14,000 |
| gw29 | 1.85 | 0.241 | 2.54 | 0.565 | 0.138 | 1.719 | 12.39 | 5000 |
| gw30 | 1.35 | 0.332 | 3 | 1.133 | 0.067 | 0.791 | 6.58 | 2000 |
| gw31 | 0.79 | 0.675 | 0.98 | 1.068 | 0.04 | 1.938 | 14.12 | 5000 |
| gw32 | 1.81 | 0.71 | 3.39 | 0.555 | 0.038 | 1.561 | 17.12 | 1000 |
| gw33 | 1.86 | 0.507 | 4.46 | 0.646 | 0.016 | 0.96 | 0 | 5000 |
| gw34 | 3.44 | 0.343 | 4.26 | 0.252 | 0.084 | 1.995 | 5.59 | 3000 |
| gw35 | 2.22 | 0.517 | 2.31 | 0.963 | 0.044 | 0.564 | 5.58 | 0 |
| gw36 | 2.305 | 0.571 | 0.016 | 0.222 | 0.129 | 1.242 | 2.746 | 3000 |
| gw37 | 2.179 | 0.568 | 0.084 | 1.642 | 0.143 | 1.756 | 3.585 | 0 |
| gw38 | 3.169 | 0.245 | 0.602 | 0.366 | 0.366 | 13.85 | 2.981 | 126,000 |
| gw39 | 1.907 | 0.504 | 0.112 | 0.838 | 0.145 | 3.219 | 3.337 | 4000 |
| gw40 | 2.751 | 0.323 | 0.217 | 0.293 | 0.142 | 4.977 | 0.387 | 50,000 |
| gw41 | 1.585 | 0.378 | 0.122 | 1.365 | 0.129 | 3.455 | 0.361 | 8000 |
| Var. | PC-1 | PC-2 | PC-3 | PC-4 | PC-5 |
|---|---|---|---|---|---|
| CFU | 0.898 | ||||
| Hg | 0.913 | ||||
| Cd | 0.825 | ||||
| pH | 0.590 | 0.488 | |||
| EC | 0.880 | ||||
| TDS | 0.879 | ||||
| K | 0.711 | ||||
| Tur | 0.599 | 0.463 | |||
| Fe | 0.537 | 0.415 | |||
| Zn | −0.809 | ||||
| DO | 0.791 | ||||
| As | 0.554 | ||||
| Ca | −0.808 | ||||
| Pb | 0.420 | 0.528 | |||
| Na | 0.859 | ||||
| Variance (%) | 27.663 | 18.592 | 12.992 | 9.439 | 7.292 |
| Cumul. (%) | 27.663 | 46.255 | 59.246 | 68.686 | 75.978 |
Publisher’s Note: MDPI stays neutral with regard to jurisdictional claims in published maps and institutional affiliations. |
© 2022 by the authors. Licensee MDPI, Basel, Switzerland. This article is an open access article distributed under the terms and conditions of the Creative Commons Attribution (CC BY) license (https://creativecommons.org/licenses/by/4.0/).
Share and Cite
Akbar, T.A.; Javed, A.; Ullah, S.; Ullah, W.; Pervez, A.; Akbar, R.A.; Javed, M.F.; Mohamed, A.; Mohamed, A.M. Principal Component Analysis (PCA)–Geographic Information System (GIS) Modeling for Groundwater and Associated Health Risks in Abbottabad, Pakistan. Sustainability 2022, 14, 14572. https://doi.org/10.3390/su142114572
Akbar TA, Javed A, Ullah S, Ullah W, Pervez A, Akbar RA, Javed MF, Mohamed A, Mohamed AM. Principal Component Analysis (PCA)–Geographic Information System (GIS) Modeling for Groundwater and Associated Health Risks in Abbottabad, Pakistan. Sustainability. 2022; 14(21):14572. https://doi.org/10.3390/su142114572
Chicago/Turabian StyleAkbar, Tahir Ali, Azka Javed, Siddique Ullah, Waheed Ullah, Arshid Pervez, Raza Ali Akbar, Muhammad Faisal Javed, Abdullah Mohamed, and Abdeliazim Mustafa Mohamed. 2022. "Principal Component Analysis (PCA)–Geographic Information System (GIS) Modeling for Groundwater and Associated Health Risks in Abbottabad, Pakistan" Sustainability 14, no. 21: 14572. https://doi.org/10.3390/su142114572
APA StyleAkbar, T. A., Javed, A., Ullah, S., Ullah, W., Pervez, A., Akbar, R. A., Javed, M. F., Mohamed, A., & Mohamed, A. M. (2022). Principal Component Analysis (PCA)–Geographic Information System (GIS) Modeling for Groundwater and Associated Health Risks in Abbottabad, Pakistan. Sustainability, 14(21), 14572. https://doi.org/10.3390/su142114572