Abstract
Energy-efficient buildings have attracted vast attention as a key component of sustainable development. Thermal load analysis is a pivotal step for the proper design of heating, ventilation, and air conditioning (HVAC) systems for increasing thermal comfort in energy-efficient buildings. In this work, novel a methodology is proposed to predict the cooling load (LC) of residential buildings based on their geometrical characteristics. Multi-layer perceptron (MLP) neural network was coupled with metaheuristic algorithms to attain its optimum hyperparameter values. According to the results, the LC pattern can be promisingly captured and predicted by all developed hybrid models. Nevertheless, the comparison analysis revealed that the electrostatic discharge algorithm (ESDA) achieved the most powerful MLP model. Hence, utilizing the proposed methodology would give new insights into the thermal load analysis method and bridge the existing gap between the most recently developed computational intelligence techniques and energy performance analysis in the sustainable design of energy-efficient residential buildings.
1. Introduction
The invention of new approaches and tools has assisted engineers to better deal with many engineering problems [1,2,3]. Hence, utilizing sophisticated apparatus and measurement techniques has resulted in reliable predictive and controlling models [4,5,6]. Soft computing has been one of the most important advances in computational sciences in recent decades as it provided very efficient methods to solve intricate problems in various domains [7,8,9].
Sustainability-oriented research has formed a large portion of energy studies in the recent literature [10,11,12]. In particular, energy efficiency optimization for developing sustainable energy systems has been a noteworthy epitome of soft computing applications [13,14]. Owing to the flexibility and capability of non-linear mapping between a set of dependent-independent parameters, soft computing techniques have proven to perform exceptionally well for the accurate prediction of energy-related parameters [15].
Computational intelligence models have served widely to analyze and tune a broad range of engineering issues [16,17,18] such as the energy performance of heating, ventilating, and air conditioning (HVAC) systems for increasing energy efficiency in buildings [19]. HVAC systems are commonly used in different various industrial and residential buildings to provide thermal comfort for the occupants [20]. Therefore, attaining an appropriate estimation of their workload can facilitate their optimum design [21].
Extensive research efforts have been dedicated to investigating and optimizing the performance of HVAC systems for smart buildings using advanced machine learning (ML) models [22,23]. For instance, Esrafilian-Najafabadi and Haghighat [24] developed a methodology based on ML techniques to predict the impact of occupancy state on the performance of building HVAC control systems. Fayyaz, et al. [25] employed ML models as thermal comfort estimators for the design of HVAC systems. Pertaining studies focusing on applying ML techniques for fault detection in HVAC systems can also be found in the open literature [26,27].
Accurate estimation of thermal loads in a building can result in desirable operation management and thus, yielding major energy and cost savings [28]. Accordingly, predicting the heating load (LH) and cooling load (LC) of HVAC systems can be interestingly achieved using robust ML models. Sha, et al. [29] employed a gradient tree boosting model to predict LC in high-rise buildings. Li, et al. [30] predicted LC 24-h ahead implementing a recurrent neural network (RNN) empowered by an attention mechanism. In an interesting study, Wei, et al. [31] compared the performance of several ML models in the prediction and analysis of LH for the residential district. Their findings demonstrated the superior performance of support vector regression (SVR) and XGBoost models with approximately 5% relative error. In a similar study, two popular types of intelligent models, back propagation neural network and SVR, were deployed by Ling, et al. [32] for the same analysis in an office building. They carried out non-hourly and hourly correlation analyses to select the input variables. It was concluded that utilizing hourly correlation analysis can lead to an 11.7% improvement in the prediction accuracy. Fuzzy-based tools, regression-based analysis, and tree-based paradigms are among the other powerful predictors that have been effectively utilized to predict LH and LC of HVAC systems [33,34,35].
The optimization of existing problems has been an everyday task of many experts [36,37]. More recently, the so-called “metaheuristic” algorithms have gained growing attention for optimizing a wide variety of engineering problems [38,39,40]. For instance, the artificial bee colony (ABC) is a well-known algorithm that was used by Zhao, et al. [41] and incorporated with the chaotic search strategy and the tabu search method to detect structural damages. They first used several explicit functions to verify the effectiveness of the proposed method. Then, this method was applied to a fixed beam structure. The analysis of results showed that the proposed method can accurately identify structural damage location and precisely determine the structural damage degree.
Such algorithms have been extensively employed by energy experts for fine-tuning the performance of HVAC systems [42,43]. Furthermore, metaheuristic techniques can assist in the training of more accurate ML models to mitigate the computational drawbacks associated with ML algorithms. For instance, finding the local minimum is problematic in constructing artificial neural networks (ANN) paradigms which in turn can limit the goodness-of-fit. Nonetheless, such problems can be remedied with the help of optimizers capable of finding a global solution for the problem of interest [44]. In earlier studies concerning thermal load analysis, several studies can be found in which a metaheuristic optimizer was coupled with ANNs to build a robust hybrid model [45,46]. Chegari, et al. [47] employed multi-objective versions of two metaheuristic algorithms, genetic algorithm (GA) and particle swarm optimization (PSO), to enhance the performance of the ANN model to predict and optimize the energy performance and indoor thermal comfort of the building. Wu, et al. [48] coupled an ANN with a backtracking search algorithm (BSA) and vortex search algorithms (VSA) for increasing its prediction accuracy. The results were found to be promising as the training accuracy was enhanced by nearly 6% and 20% after using BSA and VSA, respectively. Similar research efforts regarding the positive role of these algorithms can be found in studies by Lin and Wang [49] and Moayedi, et al. [50].
Metaheuristic algorithms are being regularly upgraded by introducing new members, some of which are potentially more powerful compared to the precedents. In other words, many existing complexities can be solved when more advanced algorithms are implemented [51,52]. It is noteworthy that the problem of energy efficiency and management in HVAC systems has been investigated only with earlier versions of metaheuristic algorithms. Therefore, some questions arise regarding the extent to which the new generation of optimization algorithms can serve for solving energy performance problems, what the most potential algorithms for this purpose would be, what is their accuracy, and can new algorithms enhance the solution of previous generation tools.
To answer such questions, this study applies a novel metaheuristic technique, namely the electrostatic discharge algorithm (ESDA) to bridge the gap between the most recent soft computing advances and the essential problem of HVAC performance prediction. This technique mimics the electrostatic discharge phenomenon to optimize the defined problem [53]. The ESDA implemented in this study assists a multi-layer perceptron (MLP) neural network in predicting the LC of residential buildings by considering the geometry. Moreover, five other metaheuristic algorithms, including chimp optimization algorithm (ChOA), future search algorithm (FSA), satin bowerbird optimization (SBO), seeker optimization algorithm (SOA), and symbiotic organism search (SOS), are applied to validate the efficacy of the ESDA. By executing a comparative ranking among all six models, not only could this study shed light on updating the optimal solutions found for the aforementioned problems, but it can also provide useful information regarding the behavior of metaheuristic algorithms in energy efficiency modeling. Furthermore, a comparison is also made among the models suggested in this work versus the solutions presented in some previous studies.
In the subsequent sections, the paper continues with describing the used data and employed methodologies and explaining model development. The results are then presented and assessed. Next, a discussion addresses the results from different points of view, and finally, the study ends up with pertinent conclusions.
2. Materials and Methods
2.1. Data Provision
Extracted from an available free data repository, the data used in this research were originally provided by Tsanas and Xifara [54]. They carried out a set of experiments using Ecotect software [55] to analyze the thermal loads of twelve residential buildings located in Athens, Greece. The buildings, each composed of 18 elementary cubes, were identical in terms of volume and used material but had different dimensions and areas.
For performing the energy simulations, eight variables that represent the geometrical and architectural characteristics of the building were considered. These variables, which are used as the input features (IF) of the ML model in this study, include relative compactness (IF1), surface area (IF2), wall area (IF3), roof area (IF4), overall height (IF5), orientation (IF6), glazing area (IF7), and glazing area distribution (IF8). Additionally, the LC is the target feature (TF) of the models. Figure 1 illustrates the histogram of IFs and TF. In these charts, the x-axis shows the range of data, and the y-axis shows the frequency of data in the corresponding range.
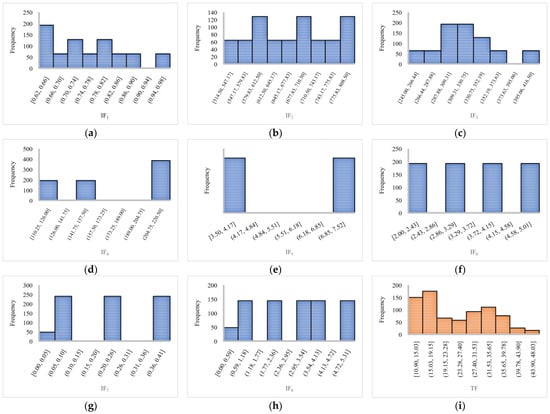
Figure 1.
Histogram charts of the dataset factors. (a) IF1. (b) IF2. (c) IF3. (d) IF4. (e) IF5. (f) IF6. (g) IF7. (h) IF8. (i) TF.
As it can be observed, four orientations, four glazing areas (i.e., 0.00, 0.10, 0.25, and 0.40 of the roof area), and five glazing area distributions, including Uniform, North, South, West, and East, are considered in the simulations. Hence, the dataset can be divided into two subsets with and without glazing based on the variable IF7. The first set comprises 720 buildings with glazing (12 buildings × 3 IF7 × 5 IF8 × 4 IF6), while the second set contains 48 buildings that do not have any glazing (12 buildings × 4 IF6). Collectively, the dataset comprises the results of 768 simulation records [56].
Statistically speaking, the average value of the IF1, IF2, IF3, IF4, IF5, IF6, IF7, and IF8 is 0.76, 671.71, 318.50, 176.60, 5.25, 3.50, 0.23, and 2.81, respectively, while the average of TF is 24.59. It is worth mentioning that the correlation analysis of the IFs with TF revealed the highest correlation for IF4 and IF5 with the respective coefficient of determinations (R2) equal to 0.7440 and 0.8024, respectively.
2.2. Overview of ESDA
As explained earlier, the ESDA represents a metaheuristic algorithm that works based on the physical rules of electrostatic discharge, mainly the difference in electrostatic potentials between two bodies. The ESDA was first designed by Bouchekara [53].
Metaheuristic algorithms are mostly population-based meaning that the activities of a certain number of individuals result in finding the optimal solution to the defined problem. The population of the ESDA is composed of individuals each representing electrical components. The algorithm runs by initializing the population whose quality is assessed using a fitness function. In the first step of optimization, three objects are randomly considered and sorted. Thereafter, a random value (R1) is generated and assessed based on the following equation defining the discharge conditions:
In case , it is assumed that the position of the second member (x2) is weaker in comparison to the first member (x1). Equation (2) is utilized to define the updated x2 (i.e., ) concerning x1:
where is a random number.
Likewise, for the case of discharge among all members, Equation (3) defines the adjustment of the third member’s position (x3 to become ) with respect to x2 and x1:
where and are random numbers.
Afterward, the position of the members is checked to retrieve those outside the boundaries. The algorithm then checks the number of discharges experienced by each member. For the members with 3 events or less, a new random value is generated. Equation (4) defines the elimination/maintenance condition as follows:
The members that experienced more than 3 events are dismissed and replaced with newly generated members [53,57]. Additional explanations about the algorithm could be found in the original study by Bouchekara [53].
2.3. Data Partitioning
After data provision and analysis, the data were split into training and testing groups; to develop the ML models. The training data were used to train the learning algorithm so that it captures how the TF varies by the variation of IFs. A wide series of non-linear calculations are required in this step to map the dependency of the TF on each input variable. Once the model learns the mapping pattern, its generalization capability is assessed by predicting the TF for the test data. Eighty percent of the original data (i.e., 614 samples) were randomly allocated to the training and the remaining 20% (i.e., 154 samples) were used for testing purposes.
2.4. Hybridization and Development
ESDA was coupled with an MLP neural network to evaluate its optimization performance reducing the errors of the MLP model. The hybrid MLP-ESDA model is composed of two parts: (i) the MLP model, which is trained with the training data to predict the output, and (ii) the EDSA, which is implemented to fine-tune the configuration of the MLP model.
The hybridization of these two models consists of several steps. Firstly, a proper MLP architecture should be determined. Many previous efforts in the literature have shown the suitability of one-hidden layer MLP for highly complicated problems [58,59,60]. Hence, the MLP used in this study has one hidden layer that contains six computational units. The number of these computational units was determined after trying a large number of alternatives and measuring the resultant accuracy. It was observed that MLP with six computational units in the single hidden layer MLP gives the best performance.
The next step is to define the activation function. Based on the authors’ experience, as well as recommendations in earlier works [61,62], Tangent-Sigmoid (Tansig) and Purelin were assigned to the hidden layer and output layer, respectively. Once the basic model is created, the ESDA is applied for finding the optimal values of two variable: weights and biases. As shown in Figure 2, these variables determine how the LC is associated with the IFs. The EDSA updates the value of weights and biases that leads to a more accurate prediction.
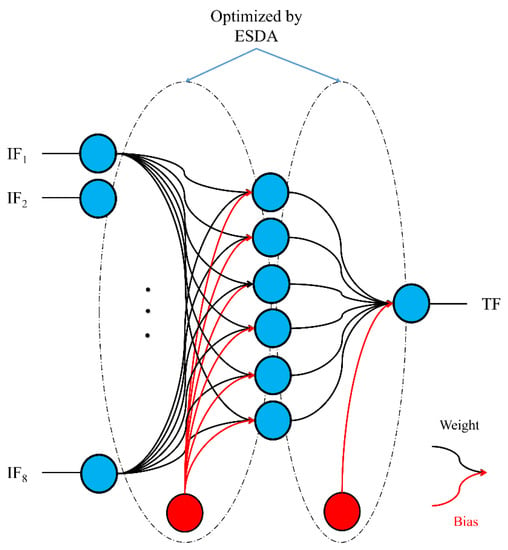
Figure 2.
The MLP-ESDA topology. The black and red arrows indicate weights and biases, respectively.
In Figure 2, a feed-forward network is depicted wherein IF1, IF2, IF3, IF4, IF5, IF6, IF7, and IF8 are first imported. They are then taken into non-linear calculations using weighs and biases and the result of this process is exported from six middle units. These values are again taken into linear calculations using a second group of weighs and one bias, and the result is the predicted LC exported from the last computational unit.
2.5. Goodness-of-Fit Metrics
The evaluation of the goodness-of-fit of ML models is an essential step in developing generalized and robust predictors. Goodness-of-fit describes to what extent the model’s predictions are harmonious with real values (i.e., TF). Various statistical indicators can be utilized to express the error in the prediction and correlation between results.
In this analysis, root mean square error (RMSE), mean absolute error (MAE), and mean absolute percentage error (MAPE) indicators were used to calculate the error in the predictions using Equations (5)–(7). Furthermore, the Pearson correlation coefficient (RP) was employed to demonstrate the correlation between the real and predicted outputs as described in Equation (8). These indicators are widely used in prediction-oriented studies to determine the accuracy of the used models [63,64,65].
In the above equations, . and are the estimated and real LC values (i.e., output), respectively, and K is the size of datasets (i.e., K = 614 in the training phase and K = 154 in the testing phase).
3. Results and Discussion
The principal objective of this work is to investigate the ability of the ESDA algorithm for predicting the LC of HVAC systems in residential buildings. To achieve this goal, the prediction competency of the MLP-ESDA was assessed and compared to similar models optimized by different other algorithms. This section presents the results and provides pertinent discussions on the optimization process and the training and testing performances of the hybrid model.
3.1. Optimization
Generally, the optimization process using a metaheuristic algorithm is an iterative procedure that reduces the error step by step. The goodness of the solution in each iteration is evaluated using a specific criterion. In predictive ML models, statistical error metrics are typically used to monitor optimization efficiency. In this study, RMSE was employed as the optimization score to evaluate the predictions of the MLP model.
As an influential parameter in metaheuristic algorithms, population size can highly affect the search process and subsequently, the quality of the optimization. In this work, for the targeted MLP-ESDA along with MLP-ChOA, MLP-FSA, MLP-SBO, MLP-SOA, and MLP-SOS models, which were used to benchmark the performance of MLP-ESDA model, the population size was determined after trying different reasonable values and selecting the value the lowest RMSE. Ultimately, the population size of ESDA, ChOA, FSA, SBO, SOA, and SOS was determined to be 400, 200, 500, 50, 100, and 100, respectively.
Figure 3a,b displays the reduction in RMSE values during 1000 iteration of the optimization process and the best-obtained RMSE value, respectively. Accordingly, MLP-ESDA, MLP-ChOA, MLP-FSA, MLP-SBO, MLP-SOA, and MLP-SOS attained RMSEs of 2.1037, 3.0612, 3.3623, 2.7054, 2.7024, and 2.2865, respectively after 1000 iterations demonstrating the superior performance of MLP-ESDA model.
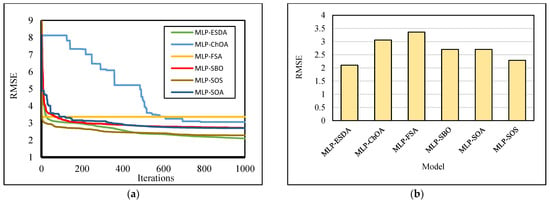
Figure 3.
Optimization results (a) training path and (b) final RMSEs.
3.2. Prediction Reliability Assessment-Training
All models developed in this study predicted the output with high accuracy. The training MAE values for MLP-ESDA, MLP-ChOA, MLP-FSA, MLP-SBO, MLP-SOA, and MLP-SOS models were 1.5442, 2.2179, 2.4751, 1.8917, 1.8439, and 1.6334, highlighting the lower training error of the model optimized with ESDA algorithm.
Moreover, the training RP values of 0.9752, 0.9469, 0.9354, 0.9586, 0.9587, and 0.9706 were achieved using MLP-ESDA, MLP-ChOA, MLP-FSA, MLP-SBO, MLP-SOA, and MLP-SOS models. This indicates that the predictions of MLP-ESDA model had the highest correlation with the real observations compared to other developed models. Therefore, the ESDA algorithm demonstrated a better optimization performance compared to other algorithms. Figure 4 displays the correlation fit between the predictions and observations (real) of the output for the training data. It can be observed that the predictions of ML-ESDA model exhibited are less scattered from the ideal fit line (i.e., the y = x line) compared to other models, signifying more accurate predictions.
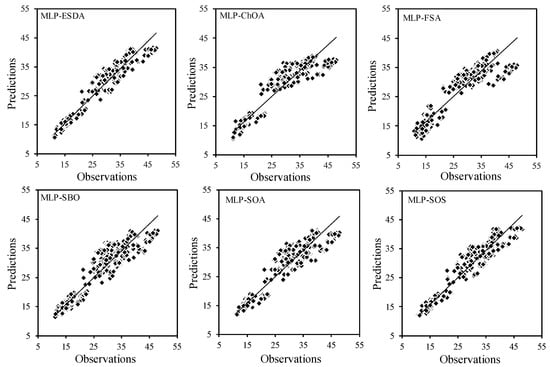
Figure 4.
Correlation fits for the training phase of the developed models.
Ultimately, the MAPE values of the six developed models were 6.300, 9.206, 10.201, 7.568, 7.304, and 6.541%, respectively, which is in agreement with other error metrics.
From a comparative perspective, it can be concluded that the MLP model optimized by the ESDA captured the mapping pattern in the training data with more accuracy achieving lower errors (e.g., RMSE, MAE, and MAPE) along with a higher correlation (i.e., larger RP value). Hence, the ESDA outperformed the benchmark algorithms in the training phase. A clearer comparison of the benchmark algorithms shows that after ESDA, the MLP-SOS had the best-fitted results followed by the MLP-SOA and MLP-SBO, while MLP-ChOA and MLP-FSA indicated the poorest prediction performance.
3.3. Predictive Models Reliability Assessment-Testing
To evaluate the generalization capability of the trained models against the future unseen data for specific new conditions (i.e., geometry and architecture) of residential buildings, their performance in predicting the output value of the testing data was analyzed. Utilizing the aforementioned goodness-of-fit indicators, it was evidenced that the performance of all models was quite promising. The testing RMSE values of MLP-ESDA, MLP-ChOA, MLP-FSA, MLP-SBO, MLP-SOA, and MLP-SOS models were 2.3616, 3.2729, 3.4552, 2.0761, 3.0102, and 2.5983, respectively and the testing MAE values were 1.7341, 2.3262, 2.5221, 3.0312, 2.0434, and 1.8204, respectively.
Figure 5 shows the correlation between the real and estimated output obtained from different models. Accordingly, the predictions of all models indicated a high correlation with the real observations. Nevertheless, the MLP model optimized with ESDA had a better fit and lower scatter. The RP values of MLP-ESDA, MLP-ChOA, MLP-FSA, MLP-SBO, MLP-SOA, and MLP-SOS models were found to be 0.9687, 0.9389, 0.9318, 0.9478, 0.9486, and 0.9620, respectively.
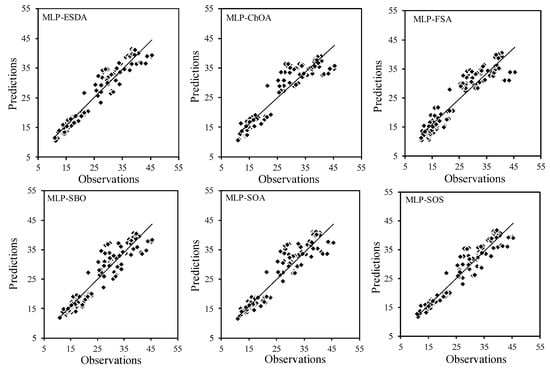
Figure 5.
Correlation fits for the testing phase of the developed models.
Furthermore, the MAPE values also complied with the abovementioned error metrics as models achieved a testing MAPE of 6.935, 9.417, 10.264, 8.291, 8.132, and 7.182%, respectively. Such promising prediction performance indicates the high generalization capability of the developed models. Nevertheless, all benchmark models exhibited predictions with larger errors and lower correlation in comparison to the MLP-ESDA model. Therefore, it can be concluded that the implementation of ESDA resulted in a better optimization process. Amongst the benchmark optimizers, the SOS outperformed other techniques in terms of all evaluated goodness-of-fit indicators followed by SOA and SBO. The ChOA and FSA optimizers led to the lowest prediction accuracies in the testing stage.
3.4. Overall Reliability Assessment
It was demonstrated earlier that the proposed model, i.e., MLP-ESDA, surpassed all considered benchmarks both in the training and testing stages, and thus, it could be deployed as a favorable methodology for optimizing the HVAC operation in residential buildings to promote energy efficiency.
Figure 6 depicts the comparison of the pattern of LC in the real data with the one predicted with the developed models. It is noteworthy that all data (training and testing) are included in these plots. As it can be observed, the general behavior of the LC is successfully forecasted by all models. Accordingly, the models captured the pattern in the peak of LC; however, accurate analysis reveals the distinctions in the sensitivity of models to abrupt and delicate changes in the LC. The ESDA and SOS models demonstrated a better performance concerning the sensitivity to the peak values of the output. This better performance can also be apprehended by observing the tale of data at the very end of the chart (i.e., samples number 750–800).
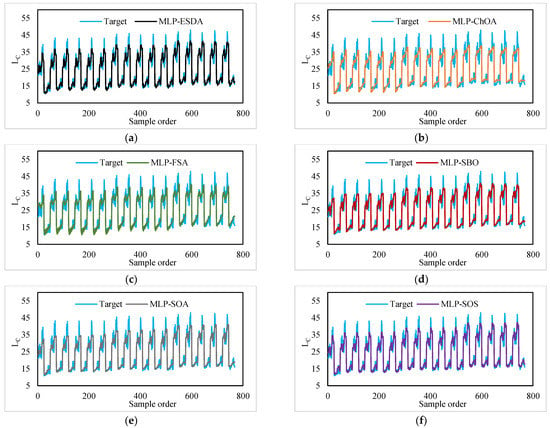
Figure 6.
Pattern comparison of real LC and those offered by the (a) MLP-ESDA, (b) MLP-ChOA, (c) MLP-FSA, (d) MLP-SBO, (e) MLP-SOA, and (f) MLP-SOS.
To better validate the above comparison, Figure 7 shows the Taylor diagrams for both the training and testing datasets. The Taylor diagram depicts the error and correlation together yielding a more convenient comparison among several models. The blue plus sign that represents the MLP-ESDA is below other models, which simultaneously indicates a higher correlation and lower RMSD (i.e., RMSE). The other models can be similarly assessed and ranked.
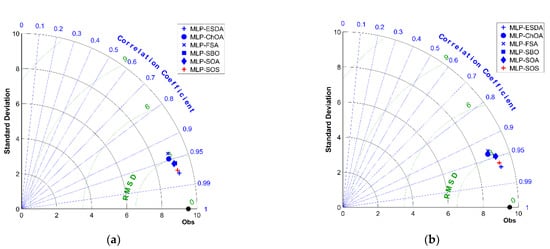
Figure 7.
Taylor diagrams for (a) training data and (b) testing data—(RMSD = RMSE).
3.5. Further Discussion
Energy performance analysis of buildings is among the well-known multi-criteria evaluation and cost–benefit analysis in the concept of sustainable energy [66]. In this regard, HVAC systems have received increasing attention, especially after recent developments in computational sciences. Such systems aim to reduce the impact of outdoor conditions on the building. They provide desirable indoor conditions by heating/cooling functioning, filtering outdoor air and reaching suitable humidity [67,68].
Metaheuristic algorithms have been promisingly employed for different optimization applications on the HVAC systems. In this work, several new algorithms were employed along with a predictive model, namely MLP neural network. The proposed algorithm was called MLP-ESDA, which could predict the cooling load of a residential building with desirable accuracy. Having a relative error between 6 and 7%, this model outperformed five other techniques that were comparatively used in this study. However, it was in a close competition with the MLP-SOS and the MLP-SOA.
In comparison with the earlier algorithms applied to the same problem, the proposed models achieved significant enhancements. For instance, shuffled complex evolution (SCE) was the outstanding model in a study by Zheng, Lyu and Foong [62]. This algorithm in combination with MLP could learn and predict the LC pattern with an RMSE of 2.5468 and 2.5943, respectively, which are higher than the RMSEs of the present study (2.103 and 2.361, respectively). The same conclusion can accordingly be obtained for models other than the SCE (optics inspired optimization and moth-flame optimization), because it performed the best in the cited study. Another example is the teaching-learning-based optimization (TLBO) employed by Zhou, Moayedi, and Foong [45] with the same strategy. Their TLBO-MLP attained the best performance compared to cuckoo optimization and league championship algorithms with the training and testing RMSEs of 2.6263 and 2.6297, respectively. Moreover, the ESAD, the SOS used in this study presented more accurate predictions compared to the models in the cited study. Further assessments can be sought in [69,70]. Overall, it can be concluded that the use of ESDA in this study has added considerable improvements to the efforts that pursue optimizing the energy performance analysis using hybrid methodologies.
However, this study has some limitations and concerted research to amend them can be potential ideas for future investigations. For instance, to purely examine the effect of metaheuristic algorithms, only one type of predictors (i.e., MLP) was considered in this study. Associating this model with other predictors such as SVM and ANFIS when they are optimized with the ESDA algorithm may yield interesting results, and could improve the solution further. Another limitation was related to the dataset. The models were only applied to a dataset with certain indicators of the building geometry. Future research can explore adding other parameters that could enhance the accuracy of predictions. The dimension of data may also be investigated based on this question: To what extent the suggested models are accurate for a case study much larger/smaller than the present one? or does the dimension has any significant effect on the generalizability of the models?
The methodology and implementations of the models can be improved as well. For instance, referring to Figure 3, a total of 1000 iterations were considered for all models. Although it generally seems suitable for metaheuristic algorithms (based on time-effectiveness, previous studies, and algorithms behavior), larger numbers of iterations can be tested to see whether they could noticeably enhance the solution. Finally, keeping the methodology updated with latest developments is another recommendation of the authors for next efforts.
4. Conclusions
Foreseeing the performance of HVAC systems can be beneficial from economic and environmental viewpoints. A new methodology was presented and verified in this study to solve the problem of HVAC cooling load prediction in residential buildings. The suggested model was an MLP neural network coupled with the recently proposed metaheuristic algorithm for optimization called ESDA. After executing the models with adjusted parameters, the following conclusions can be drawn:
- The results of the training and testing stages revealed that the proposed methodology is powerful and able to learn and reproduce the LC pattern with reliable accuracy (relative errors below 7%).
- The ESDA model predictions outperformed that of several benchmark models including ChOA, FSA, SBO, SOA, and SOS algorithms.
- Compared to previous works, the solutions provided in this study were improved and could introduce new potential methodologies for the prediction of LC from a building’s geometry.
- Considering the limitations of the study, some ideas for future concerted research efforts were suggested to further enhance the performance of HVAC systems and predicting their required workload to better contribute to tunning present systems and proper design in future construction projects.
Author Contributions
Conceptualization, N.J. and S.S.; methodology, F.N.; software, N.J. and M.W.K.; validation, O.B. and A.M.; investigation, N.J. and F.N.; writing—original draft preparation, N.J. and S.S.; writing—review and editing, F.N., A.M. and M.L.N.; visualization, O.B. and M.W.K.; project administration, M.L.N.; funding acquisition, M.L.N. All authors have read and agreed to the published version of the manuscript.
Funding
The authors extend their appreciation to the Deputyship for Research & Innovation, Ministry of Education in Saudi Arabia for funding this research work through the project number (IF2/PSAU/2022/01/22684).
Data Availability Statement
The data that support the findings of this study are available from the corresponding author upon request.
Conflicts of Interest
The authors declare no conflict of interest.
References
- Yan, B.; Ma, C.; Zhao, Y.; Hu, N.; Guo, L. Geometrically Enabled Soft Electroactuators via Laser Cutting. Adv. Eng. Mater. 2019, 21, 1900664. [Google Scholar] [CrossRef]
- Zhao, Y.; Hu, H.; Bai, L.; Tang, M.; Chen, H.; Su, D. Fragility analyses of bridge structures using the logarithmic piecewise function-based probabilistic seismic demand model. Sustainability 2021, 13, 7814. [Google Scholar] [CrossRef]
- Zhao, Y.; Joseph, A.J.J.M.; Zhang, Z.; Ma, C.; Gul, D.; Schellenberg, A.; Hu, N. Deterministic snap-through buckling and energy trapping in axially-loaded notched strips for compliant building blocks. Smart Mater. Struct. 2020, 29, 02LT03. [Google Scholar] [CrossRef]
- Wang, H.; Wu, X.; Zheng, X.; Yuan, X. Virtual voltage vector based model predictive control for a nine-phase open-end winding PMSM with a common DC bus. IEEE Trans. Ind. Electron. 2021, 69, 5386–5397. [Google Scholar] [CrossRef]
- Wang, H.; Hou, K.; Zhao, J.; Yu, X.; Jia, H.; Mu, Y. Planning-Oriented resilience assessment and enhancement of integrated electricity-gas system considering multi-type natural disasters. Appl. Energy 2022, 315, 118824. [Google Scholar] [CrossRef]
- Ma, K.; Hu, X.; Yue, Z.; Wang, Y.; Yang, J.; Zhao, H.; Liu, Z. Voltage Regulation With Electric Taxi Based on Dynamic Game Strategy. IEEE Trans. Veh. Technol. 2022, 71, 2413–2426. [Google Scholar] [CrossRef]
- Seyedashraf, O.; Mehrabi, M.; Akhtari, A.A. Novel approach for dam break flow modeling using computational intelligence. J. Hydrol. 2018, 559, 1028–1038. [Google Scholar] [CrossRef]
- Mehrabi, M.; Pradhan, B.; Moayedi, H.; Alamri, A. Optimizing an adaptive neuro-fuzzy inference system for spatial prediction of landslide susceptibility using four state-of-the-art metaheuristic techniques. Sensors 2020, 20, 1723. [Google Scholar] [CrossRef]
- Liu, Z. Article Citation Contribution Indicator: Application in Energy and Environment. 2022, 3, 81–84. [Google Scholar]
- Xie, X.; Sun, Y. A piecewise probabilistic harmonic power flow approach in unbalanced residential distribution systems. Int. J. Electr. Power Energy Syst. 2022, 141, 108114. [Google Scholar] [CrossRef]
- Xu, X.; Niu, D.; Peng, L.; Zheng, S.; Qiu, J. Hierarchical multi-objective optimal planning model of active distribution network considering distributed generation and demand-side response. Sustain. Energy Technol. Assess. 2022, 53, 102438. [Google Scholar] [CrossRef]
- Xu, X.; Niu, D.; Xiao, B.; Guo, X.; Zhang, L.; Wang, K. Policy analysis for grid parity of wind power generation in China. Energy Policy 2020, 138, 111225. [Google Scholar] [CrossRef]
- Ding, Z.; Yüksel, S.; Dincer, H. An Integrated Pythagorean fuzzy soft computing approach to environmental management systems for sustainable energy pricing. Energy Rep. 2021, 7, 5575–5588. [Google Scholar] [CrossRef]
- Adedeji, P.A.; Olatunji, O.O.; Madushele, N.; Ajayeoba, A.O. Soft computing in renewable energy system modeling. In Design, Analysis, and Applications of Renewable Energy Systems; Elsevier: Amsterdam, The Netherlands, 2021; pp. 79–102. [Google Scholar]
- Almutairi, K.; Algarni, S.; Alqahtani, T.; Moayedi, H.; Mosavi, A. A TLBO-Tuned Neural Processor for Predicting Heating Load in Residential Buildings. Sustainability 2022, 14, 5924. [Google Scholar] [CrossRef]
- Zhao, Y.; Wang, Z. Subset simulation with adaptable intermediate failure probability for robust reliability analysis: An unsupervised learning-based approach. Struct. Multidiscip. Optim. 2022, 65, 1–22. [Google Scholar] [CrossRef]
- Zhang, Y.; Shi, X.; Zhang, H.; Cao, Y.; Terzija, V. Review on deep learning applications in frequency analysis and control of modern power system. Int. J. Electr. Power Energy Syst. 2022, 136, 107744. [Google Scholar] [CrossRef]
- Xie, X.; Chen, D. Data-driven dynamic harmonic model for modern household appliances. Appl. Energy 2022, 312, 118759. [Google Scholar] [CrossRef]
- McQuiston, F.C.; Parker, J.D.; Spitler, J.D. Heating, Ventilating, and Air Conditioning: Analysis and Design; John Wiley & Sons: Hoboken, NJ, USA, 2004. [Google Scholar]
- Seyam, S. Types of HVAC systems. HVAC Syst. 2018, 49–66. [Google Scholar]
- Guo, Z.; Moayedi, H.; Foong, L.K.; Bahiraei, M. Optimal modification of heating, ventilation, and air conditioning system performances in residential buildings using the integration of metaheuristic optimization and neural computing. Energy Build. 2020, 214, 109866. [Google Scholar] [CrossRef]
- Ahmad, M.W.; Mourshed, M.; Yuce, B.; Rezgui, Y. Computational Intelligence Techniques for HVAC Systems: A Review, Building Simulation; Springer: Berlin/Heidelberg, Germany, 2016; pp. 359–398. [Google Scholar]
- Alanne, K.; Sierla, S. An overview of machine learning applications for smart buildings. Sustain. Cities Soc. 2022, 76, 103445. [Google Scholar] [CrossRef]
- Esrafilian-Najafabadi, M.; Haghighat, F. Impact of occupancy prediction models on building HVAC control system performance: Application of machine learning techniques. Energy Build. 2022, 257, 111808. [Google Scholar] [CrossRef]
- Fayyaz, M.; Farhan, A.A.; Javed, A.R. Thermal Comfort Model for HVAC Buildings Using Machine Learning. Arab. J. Sci. Eng. 2022, 47, 2045–2060. [Google Scholar] [CrossRef]
- Taheri, S.; Ahmadi, A.; Mohammadi-Ivatloo, B.; Asadi, S. Fault detection diagnostic for HVAC systems via deep learning algorithms. Energy Build. 2021, 250, 111275. [Google Scholar] [CrossRef]
- Subramaniam, U.; Bharadwaj, S.C.; Dutta, N.; Venkateshkumar, M. Application of Machine Learning for Fault Detection and Energy Efficiency Improvement in HVAC Application. In Artificial Intelligence (AI); CRC Press: Boca Raton, FL, USA, 2021; pp. 263–278. [Google Scholar]
- Chalapathy, R.; Khoa, N.L.D.; Sethuvenkatraman, S. Comparing multi-step ahead building cooling load prediction using shallow machine learning and deep learning models. Sustain. Energy Grids Netw. 2021, 28, 100543. [Google Scholar] [CrossRef]
- Sha, H.; Moujahed, M.; Qi, D. Machine learning-based cooling load prediction and optimal control for mechanical ventilative cooling in high-rise buildings. Energy Build. 2021, 242, 110980. [Google Scholar] [CrossRef]
- Li, A.; Xiao, F.; Zhang, C.; Fan, C. Attention-based interpretable neural network for building cooling load prediction. Appl. Energy 2021, 299, 117238. [Google Scholar] [CrossRef]
- Wei, Z.; Zhang, T.; Yue, B.; Ding, Y.; Xiao, R.; Wang, R.; Zhai, X. Prediction of residential district heating load based on machine learning: A case study. Energy 2021, 231, 120950. [Google Scholar] [CrossRef]
- Ling, J.; Dai, N.; Xing, J.; Tong, H. An improved input variable selection method of the data-driven model for building heating load prediction. J. Build. Eng. 2021, 44, 103255. [Google Scholar] [CrossRef]
- Fan, C.; Xiao, F.; Zhao, Y. A short-term building cooling load prediction method using deep learning algorithms. Appl. Energy 2017, 195, 222–233. [Google Scholar] [CrossRef]
- Fan, C.; Ding, Y. Cooling load prediction and optimal operation of HVAC systems using a multiple nonlinear regression model. Energy Build. 2019, 197, 7–17. [Google Scholar] [CrossRef]
- Shamshirband, S.; Petković, D.; Enayatifar, R.; Abdullah, A.H.; Marković, D.; Lee, M.; Ahmad, R. Heat load prediction in district heating systems with adaptive neuro-fuzzy method. Renew. Sustain. Energy Rev. 2015, 48, 760–767. [Google Scholar] [CrossRef]
- Yang, J.; Liu, H.; Ma, K.; Yang, B.; Guerrero, J.M. An Optimization Strategy of Price and Conversion Factor Considering the Coupling of Electricity and Gas Based on Three-Stage Game. IEEE Trans. Autom. Sci. Eng. 2022. [Google Scholar] [CrossRef]
- Li, H.; Hou, K.; Xu, X.; Jia, H.; Zhu, L.; Mu, Y. Probabilistic energy flow calculation for regional integrated energy system considering cross-system failures. Appl. Energy 2022, 308, 118326. [Google Scholar] [CrossRef]
- Moayedi, H.; Mehrabi, M.; Bui, D.T.; Pradhan, B.; Foong, L.K. Fuzzy-metaheuristic ensembles for spatial assessment of forest fire susceptibility. J. Environ. Manag. 2020, 260, 109867. [Google Scholar] [CrossRef]
- Zhao, Y.; Moayedi, H.; Bahiraei, M.; Foong, L.K. Employing TLBO and SCE for optimal prediction of the compressive strength of concrete. Smart Struct. Syst. 2020, 26, 753–763. [Google Scholar]
- Wu, P.; Liu, A.; Fu, J.; Ye, X.; Zhao, Y. Autonomous surface crack identification of concrete structures based on an improved one-stage object detection algorithm. Eng. Struct. 2022, 272, 114962. [Google Scholar] [CrossRef]
- Zhao, Y.; Yan, Q.; Yang, Z.; Yu, X.; Jia, B. A novel artificial bee colony algorithm for structural damage detection. Adv. Civ. Eng. 2020, 2020, 3743089. [Google Scholar] [CrossRef]
- Martin, G.L.; Monfet, D.; Nouanegue, H.F.; Lavigne, K.; Sansregret, S. Energy calibration of HVAC sub-system model using sensitivity analysis and meta-heuristic optimization. Energy Build. 2019, 202, 109382. [Google Scholar] [CrossRef]
- Garces-Jimenez, A.; Gomez-Pulido, J.-M.; Gallego-Salvador, N.; Garcia-Tejedor, A.-J. Genetic and Swarm Algorithms for Optimizing the Control of Building HVAC Systems Using Real Data: A Comparative Study. Mathematics 2021, 9, 2181. [Google Scholar] [CrossRef]
- Moayedi, H.; Mehrabi, M.; Mosallanezhad, M.; Rashid, A.S.A.; Pradhan, B. Modification of landslide susceptibility mapping using optimized PSO-ANN technique. Eng. Comput. 2019, 35, 967–984. [Google Scholar] [CrossRef]
- Zhou, G.; Moayedi, H.; Foong, L.K. Teaching–learning-based metaheuristic scheme for modifying neural computing in appraising energy performance of building. Eng. Comput. 2021, 37, 3037–3048. [Google Scholar] [CrossRef]
- Le, L.T.; Nguyen, H.; Dou, J.; Zhou, J. A comparative study of PSO-ANN, GA-ANN, ICA-ANN, and ABC-ANN in estimating the heating load of buildings’ energy efficiency for smart city planning. Appl. Sci. 2019, 9, 2630. [Google Scholar] [CrossRef]
- Chegari, B.; Tabaa, M.; Simeu, E.; Moutaouakkil, F.; Medromi, H. Multi-objective optimization of building energy performance and indoor thermal comfort by combining artificial neural networks and metaheuristic algorithms. Energy Build. 2021, 239, 110839. [Google Scholar] [CrossRef]
- Wu, D.; Foong, L.K.; Lyu, Z. Two neural-metaheuristic techniques based on vortex search and backtracking search algorithms for predicting the heating load of residential buildings. Eng. Comput. 2020, 38, 647–660. [Google Scholar] [CrossRef]
- Lin, C.; Wang, J. Metaheuristic-designed systems for simultaneous simulation of thermal loads of building. Smart Struct. Syst. 2022, 29, 677–691. [Google Scholar]
- Moayedi, H.; Nguyen, H.; Kok Foong, L. Nonlinear evolutionary swarm intelligence of grasshopper optimization algorithm and gray wolf optimization for weight adjustment of neural network. Eng. Comput. 2021, 37, 1265–1275. [Google Scholar] [CrossRef]
- Mehrabi, M.; Moayedi, H. Landslide susceptibility mapping using artificial neural network tuned by metaheuristic algorithms. Environ. Earth Sci. 2021, 80, 1–20. [Google Scholar] [CrossRef]
- Ghahramani, A.; Karvigh, S.A.; Becerik-Gerber, B. HVAC system energy optimization using an adaptive hybrid metaheuristic. Energy Build. 2017, 152, 149–161. [Google Scholar] [CrossRef]
- Bouchekara, H.R. Electrostatic discharge algorithm: A novel nature-inspired optimisation algorithm and its application to worst-case tolerance analysis of an EMC filter. IET Sci. Meas. Technol. 2019, 13, 491–499. [Google Scholar] [CrossRef]
- Tsanas, A.; Xifara, A. Accurate quantitative estimation of energy performance of residential buildings using statistical machine learning tools. Energy Build. 2012, 49, 560–567. [Google Scholar] [CrossRef]
- Roberts, A.; Marsh, A. ECOTECT: Environmental prediction in architectural education. In Proceedings of the Architectural Information Management 19th eCAADe Conference Proceedings, Helsinki, Finland, 29–31 August 2001. [Google Scholar]
- Xu, Y.; Li, F.; Asgari, A. Prediction and optimization of heating and cooling loads in a residential building based on multi-layer perceptron neural network and different optimization algorithms. Energy 2022, 240, 122692. [Google Scholar] [CrossRef]
- Zhao, Y.; Foong, L.K. Predicting Electrical Power Output of Combined Cycle Power Plants Using a Novel Artificial Neural Network Optimized by Electrostatic Discharge Algorithm. Measurement 2022, 111405. [Google Scholar] [CrossRef]
- Mehrabi, M. Landslide susceptibility zonation using statistical and machine learning approaches in Northern Lecco, Italy. Nat. Hazards 2021, 111, 1–37. [Google Scholar] [CrossRef]
- Nguyen, H.; Mehrabi, M.; Kalantar, B.; Moayedi, H.; Abdullahi, M.A.M. Potential of hybrid evolutionary approaches for assessment of geo-hazard landslide susceptibility mapping. Geomat. Nat. Hazards Risk 2019, 10, 1667–1693. [Google Scholar] [CrossRef]
- Zhao, Y.; Zhong, X.; Foong, L.K. Predicting the splitting tensile strength of concrete using an equilibrium optimization model. Steel Compos. Struct. Int. J. 2021, 39, 81–93. [Google Scholar]
- Das, S.; Swetapadma, A.; Panigrahi, C.; Abdelaziz, A.Y. Improved method for approximation of heating and cooling load in urban buildings for energy performance enhancement. Electr. Power Compon. Syst. 2020, 48, 436–446. [Google Scholar] [CrossRef]
- Zheng, S.; Lyu, Z.; Foong, L.K. Early prediction of cooling load in energy-efficient buildings through novel optimizer of shuffled complex evolution. Eng. Comput. 2020, 38, 105–119. [Google Scholar] [CrossRef]
- Moayedi, H.; Mehrabi, M.; Kalantar, B.; Abdullahi Mu’azu, M.A.; Rashid, A.S.; Foong, L.K.; Nguyen, H. Novel hybrids of adaptive neuro-fuzzy inference system (ANFIS) with several metaheuristic algorithms for spatial susceptibility assessment of seismic-induced landslide. Geomat. Nat. Hazards Risk 2019, 10, 1879–1911. [Google Scholar] [CrossRef]
- Zhao, Y.; Hu, H.; Song, C.; Wang, Z. Predicting Compressive Strength of Manufactured-Sand Concrete Using Conventional and Metaheuristic-Tuned Artificial Neural Network: Abbreviated Title: Various ANNs for Modeling Concrete Strength. Measurement 2022, 194, 110993. [Google Scholar] [CrossRef]
- Zhao, Y.; Bai, C.; Xu, C.; Foong, L.K. Efficient metaheuristic-retrofitted techniques for concrete slump simulation. Smart Struct. Syst. 2021, 27, 745. [Google Scholar]
- Nesticò, A.; Elia, C.; Naddeo, V. Sustainability of urban regeneration projects: Novel selection model based on analytic network process and zero-one goal programming. Land Use Policy 2020, 99, 104831. [Google Scholar] [CrossRef]
- Solano, J.; Caamano-Martin, E.; Olivieri, L.; Almeida-Galarraga, D. HVAC systems and thermal comfort in buildings climate control: An experimental case study. Energy Rep. 2021, 7, 269–277. [Google Scholar] [CrossRef]
- Guo, W.; Zhou, M. Technologies toward thermal comfort-based and energy-efficient HVAC systems: A review. In Proceedings of the 2009 IEEE International Conference on Systems, Man and Cybernetics, San Antonio, TX, USA, 11–14 October 2009; IEEE: Piscataway, NJ, USA; pp. 3883–3888. [Google Scholar]
- Moayedi, H.; Mu’azu, M.A.; Foong, L.K. Novel swarm-based approach for predicting the cooling load of residential buildings based on social behavior of elephant herds. Energy Build. 2020, 206, 109579. [Google Scholar] [CrossRef]
- Zhou, G.; Moayedi, H.; Bahiraei, M.; Lyu, Z. Employing artificial bee colony and particle swarm techniques for optimizing a neural network in prediction of heating and cooling loads of residential buildings. J. Clean. Prod. 2020, 254, 120082. [Google Scholar] [CrossRef]
Publisher’s Note: MDPI stays neutral with regard to jurisdictional claims in published maps and institutional affiliations. |
© 2022 by the authors. Licensee MDPI, Basel, Switzerland. This article is an open access article distributed under the terms and conditions of the Creative Commons Attribution (CC BY) license (https://creativecommons.org/licenses/by/4.0/).