
The Effect of Recycled Sand on the Tensile Properties of Engineered Cementitious Composites


Abstract
1. Introduction
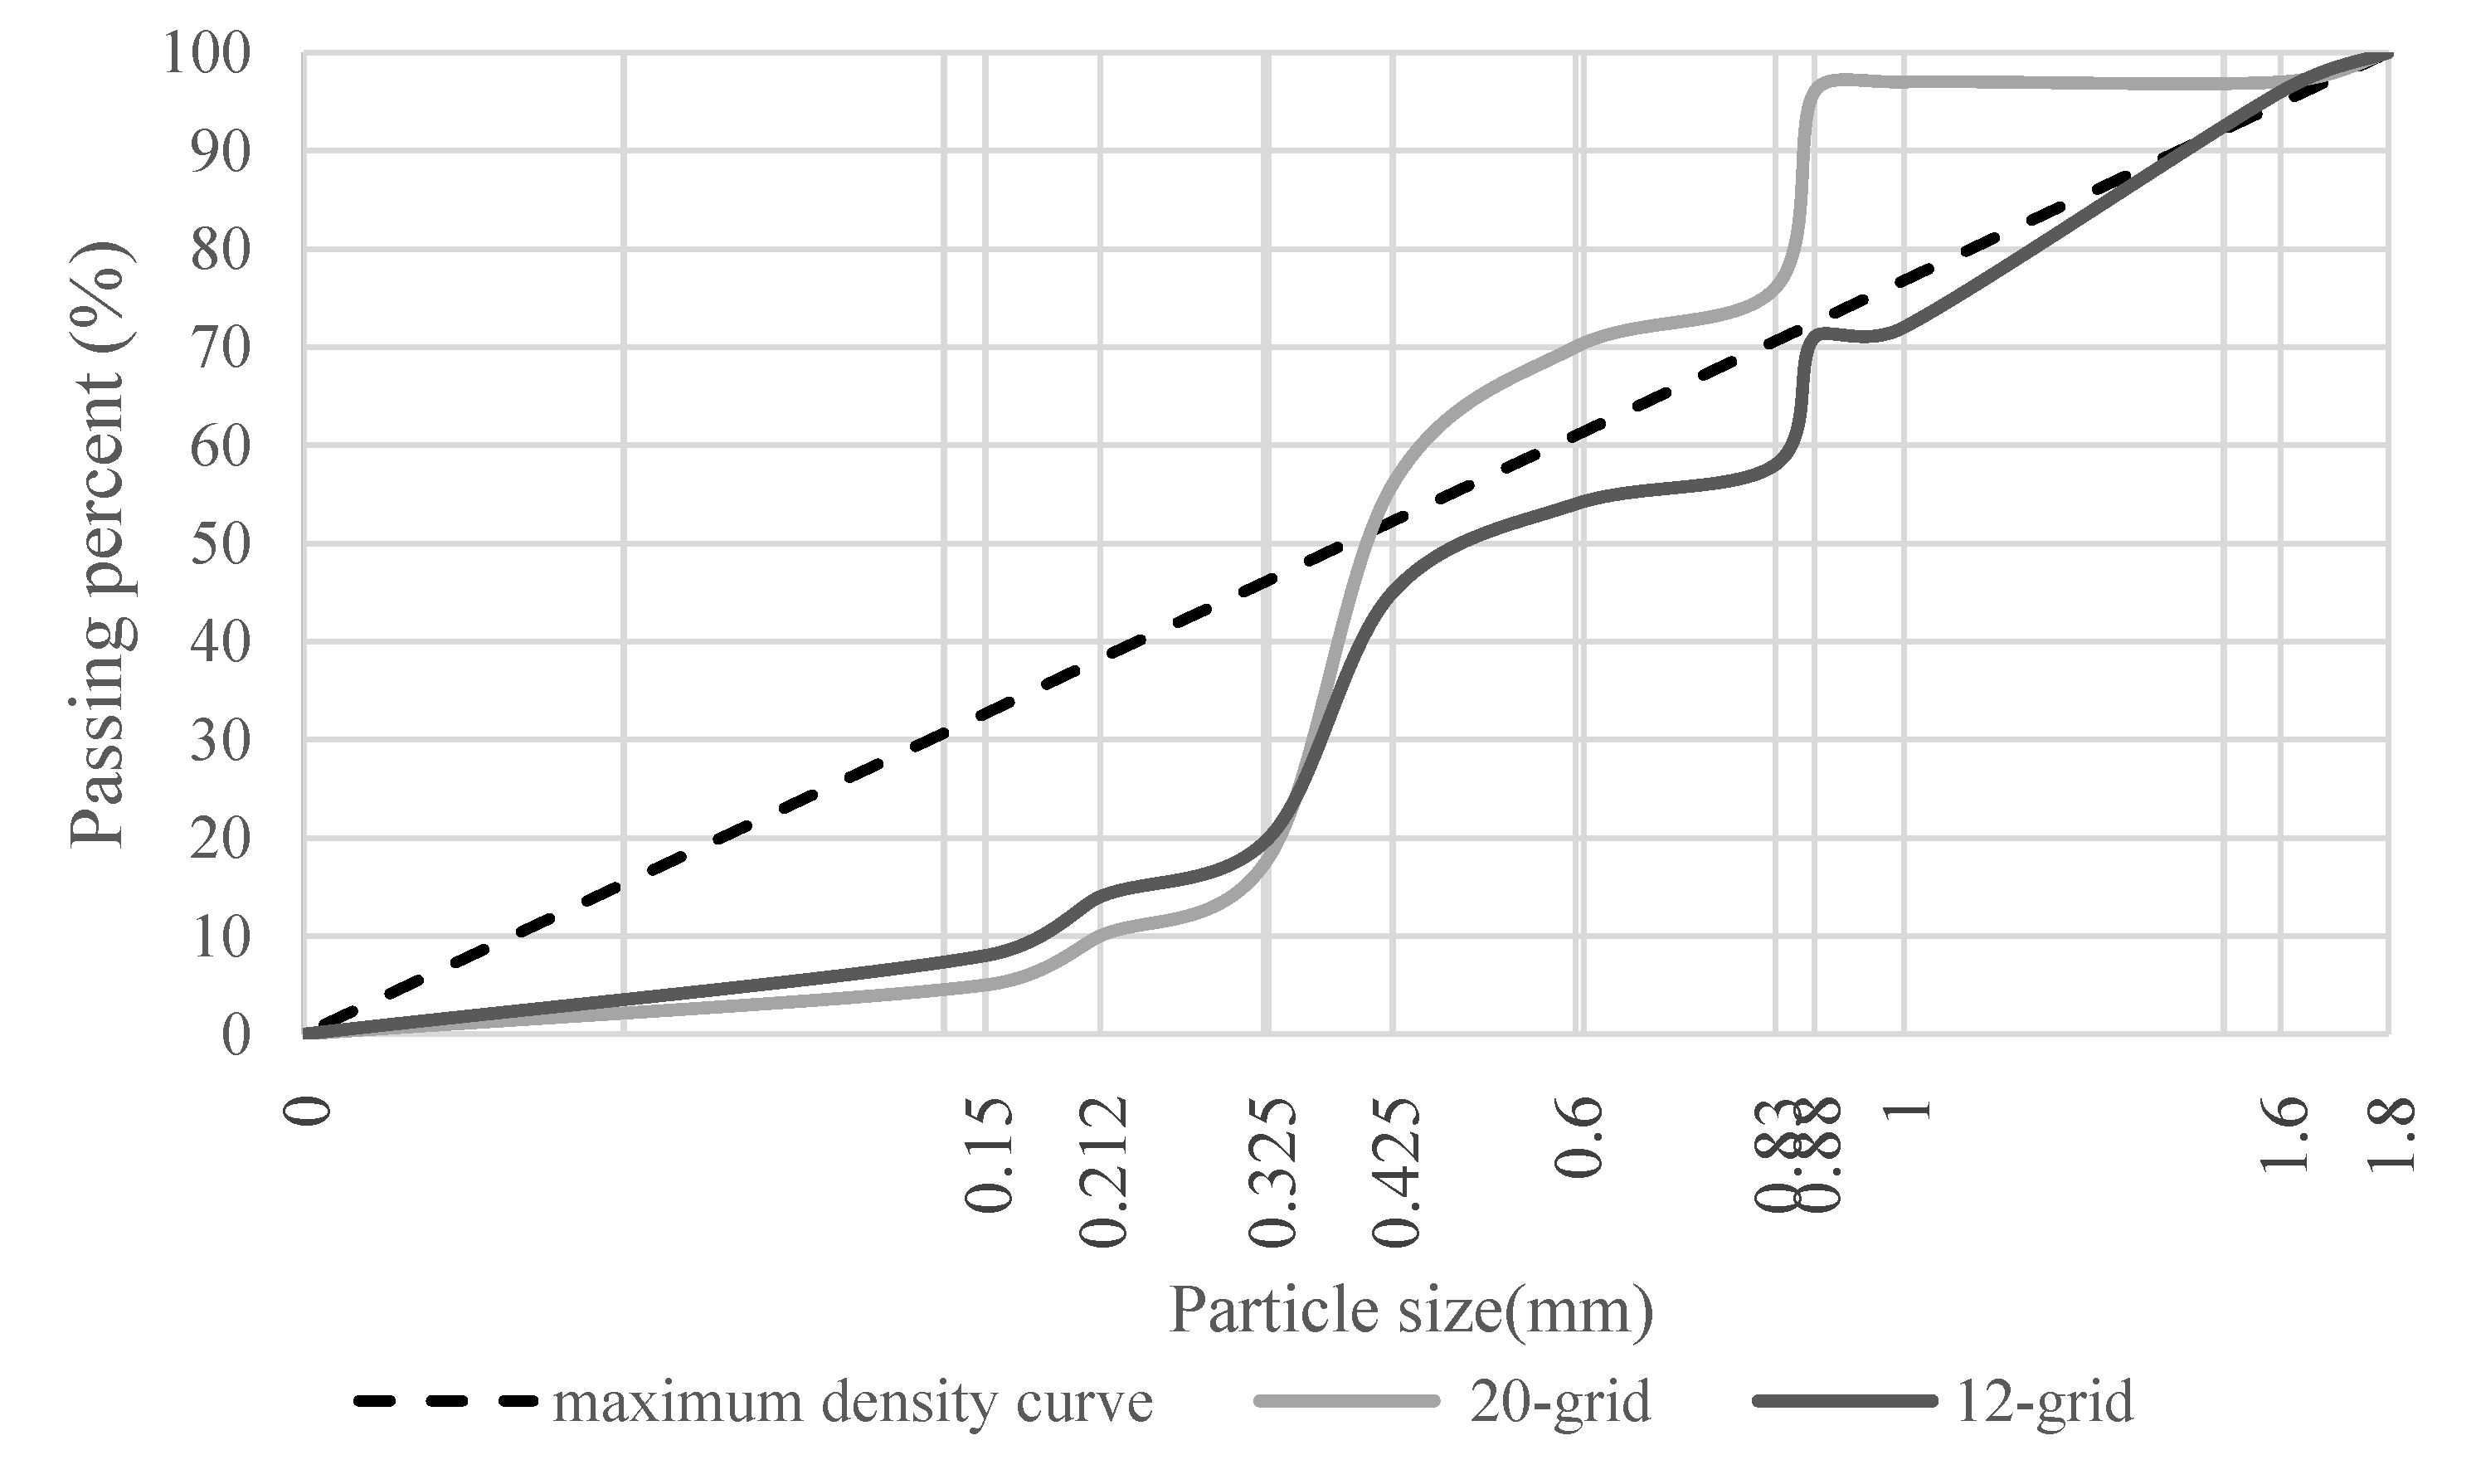
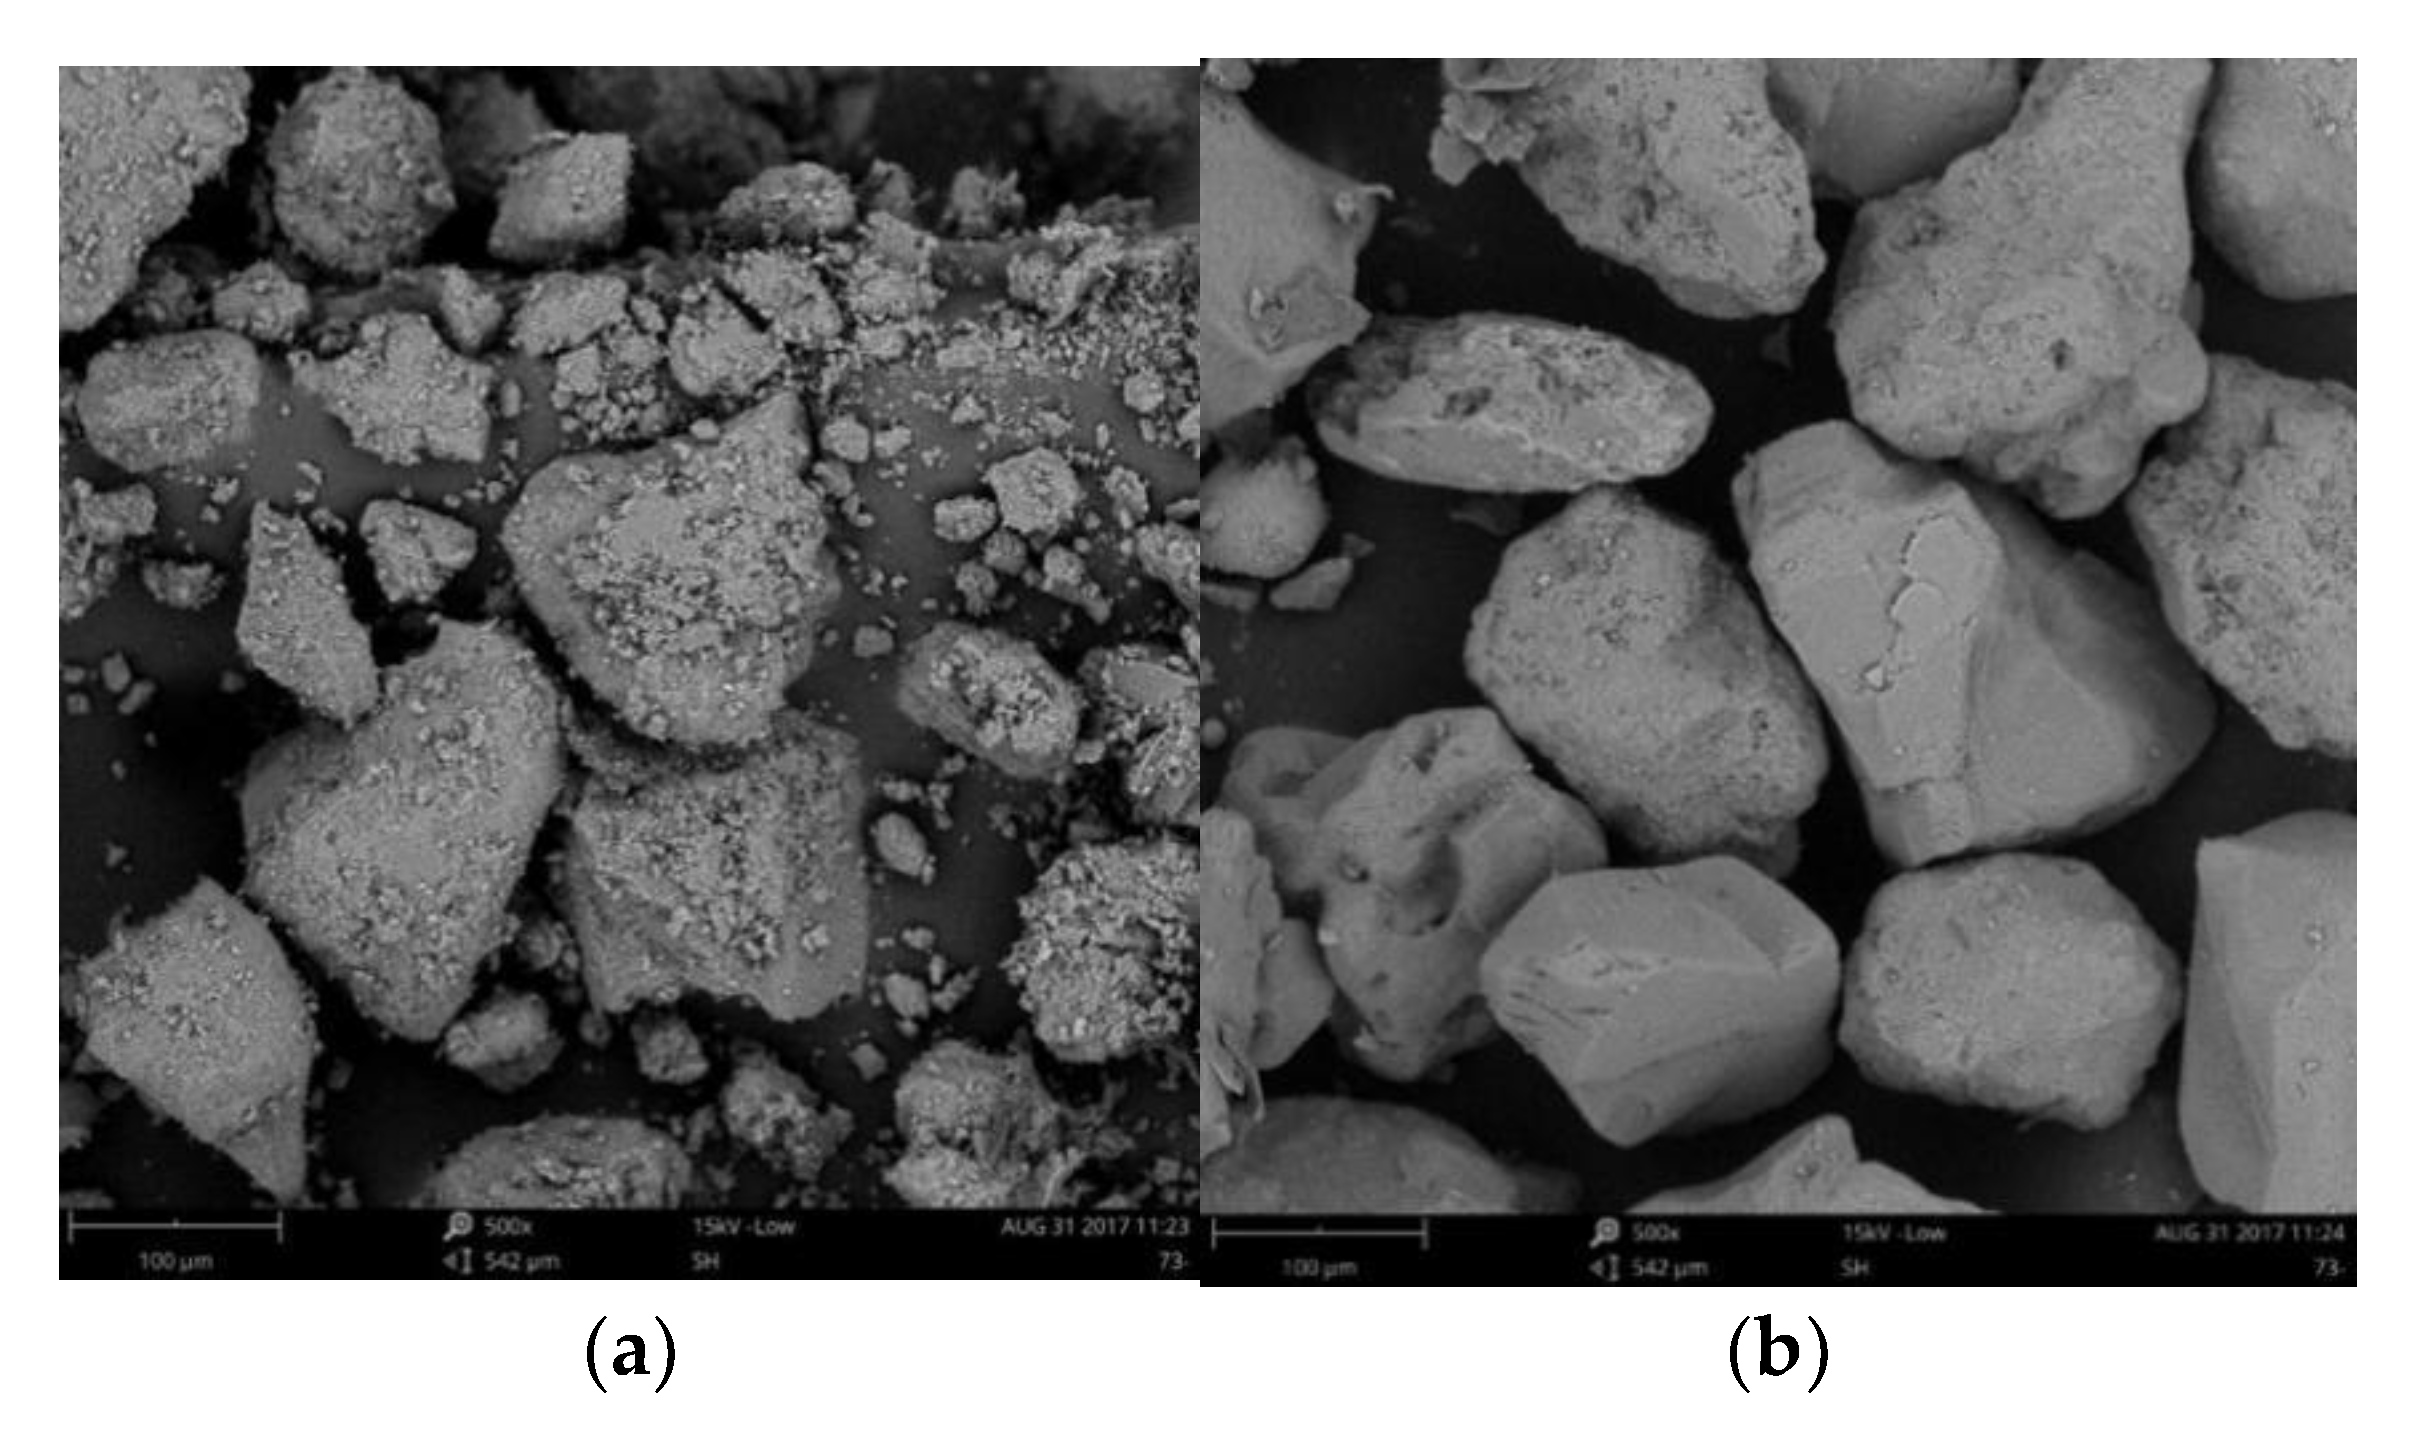
- Achieve a better understanding of recycled sand applicable to ECC. X-ray fluorescence (XRF), scanning electron microscope (SEM) and particle size analysis were used to obtain chemical compositions, physical properties, and fineness of RS.
- Investigate the influence of RS replacement on the basic mechanical properties of ECC.
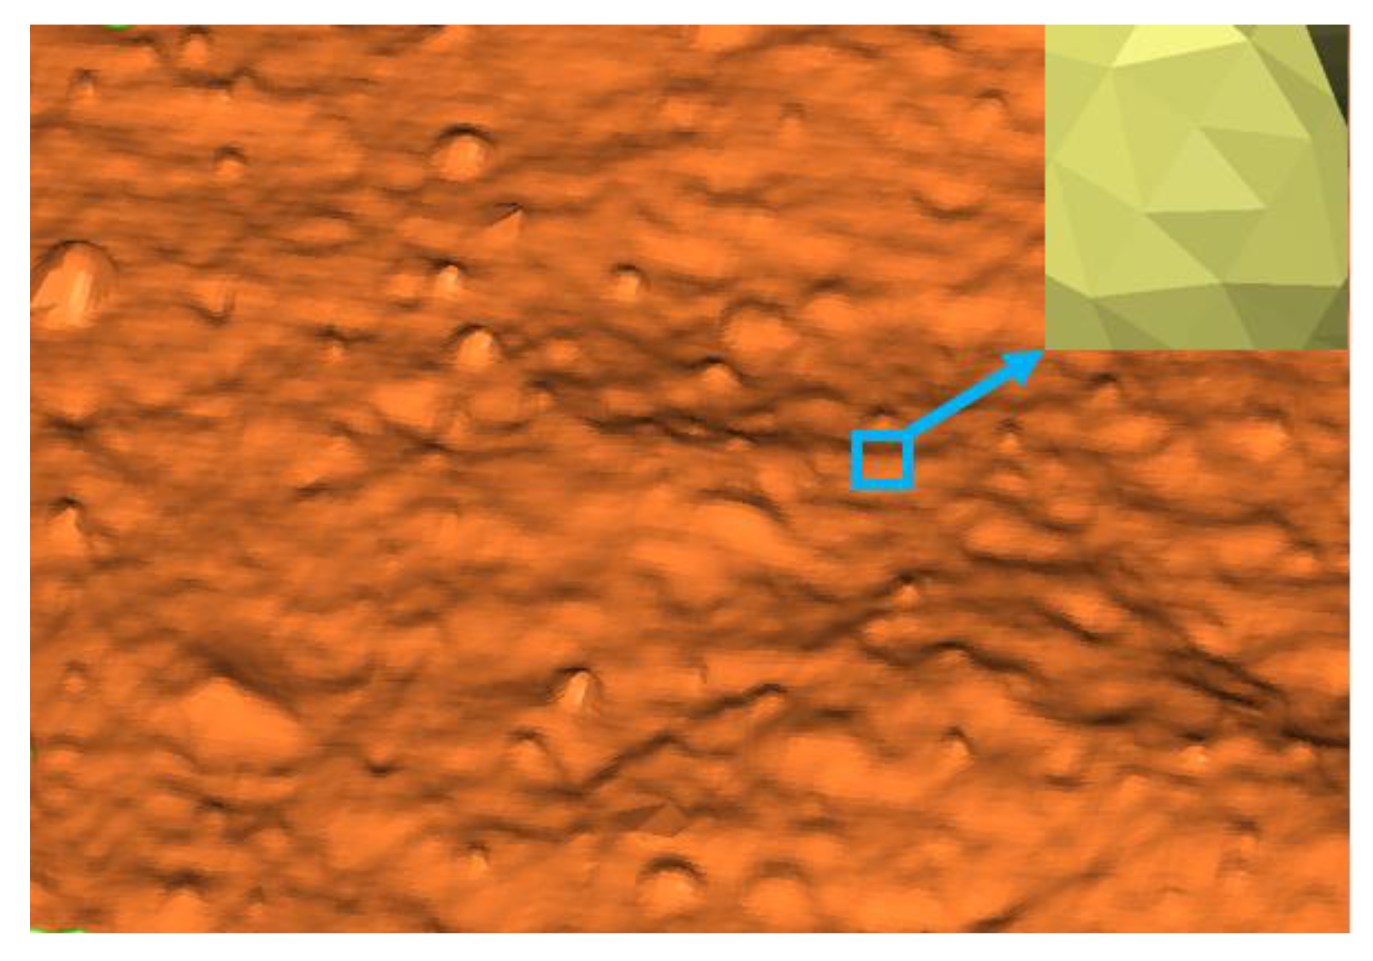
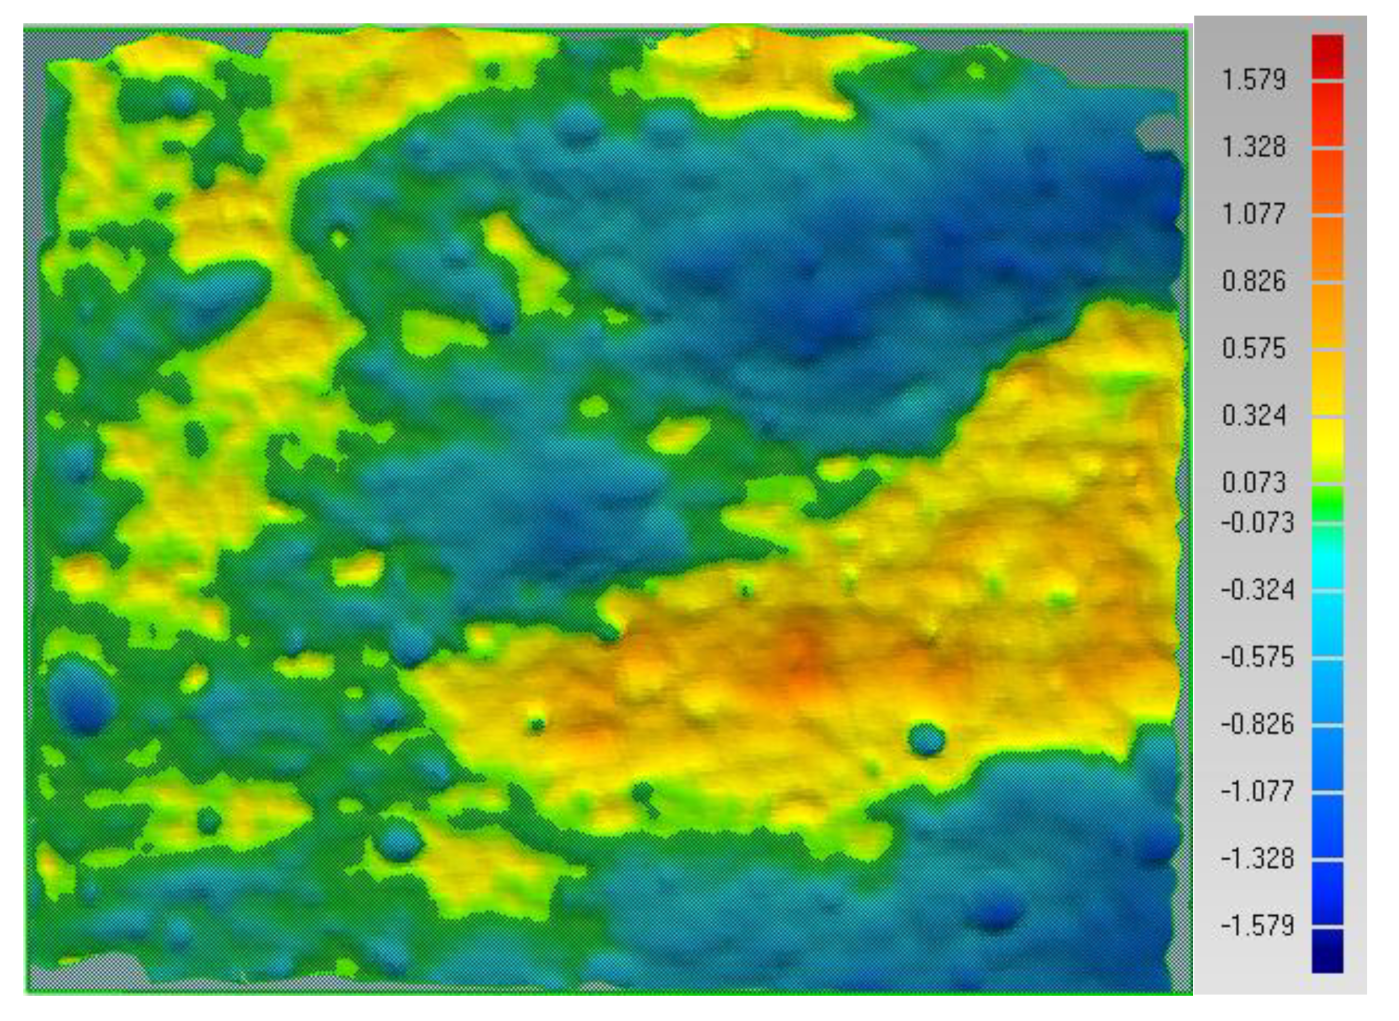
- Find the influence of RS replacement on the meso-scale and micro-scale properties of RS-ECC and explore the connection between the RS-ECCs tensile strain capacity and meso-scale property.
2. Materials and Experimental Program
2.1. Materials and Mix Proportions
2.2. Preparation of Specimens
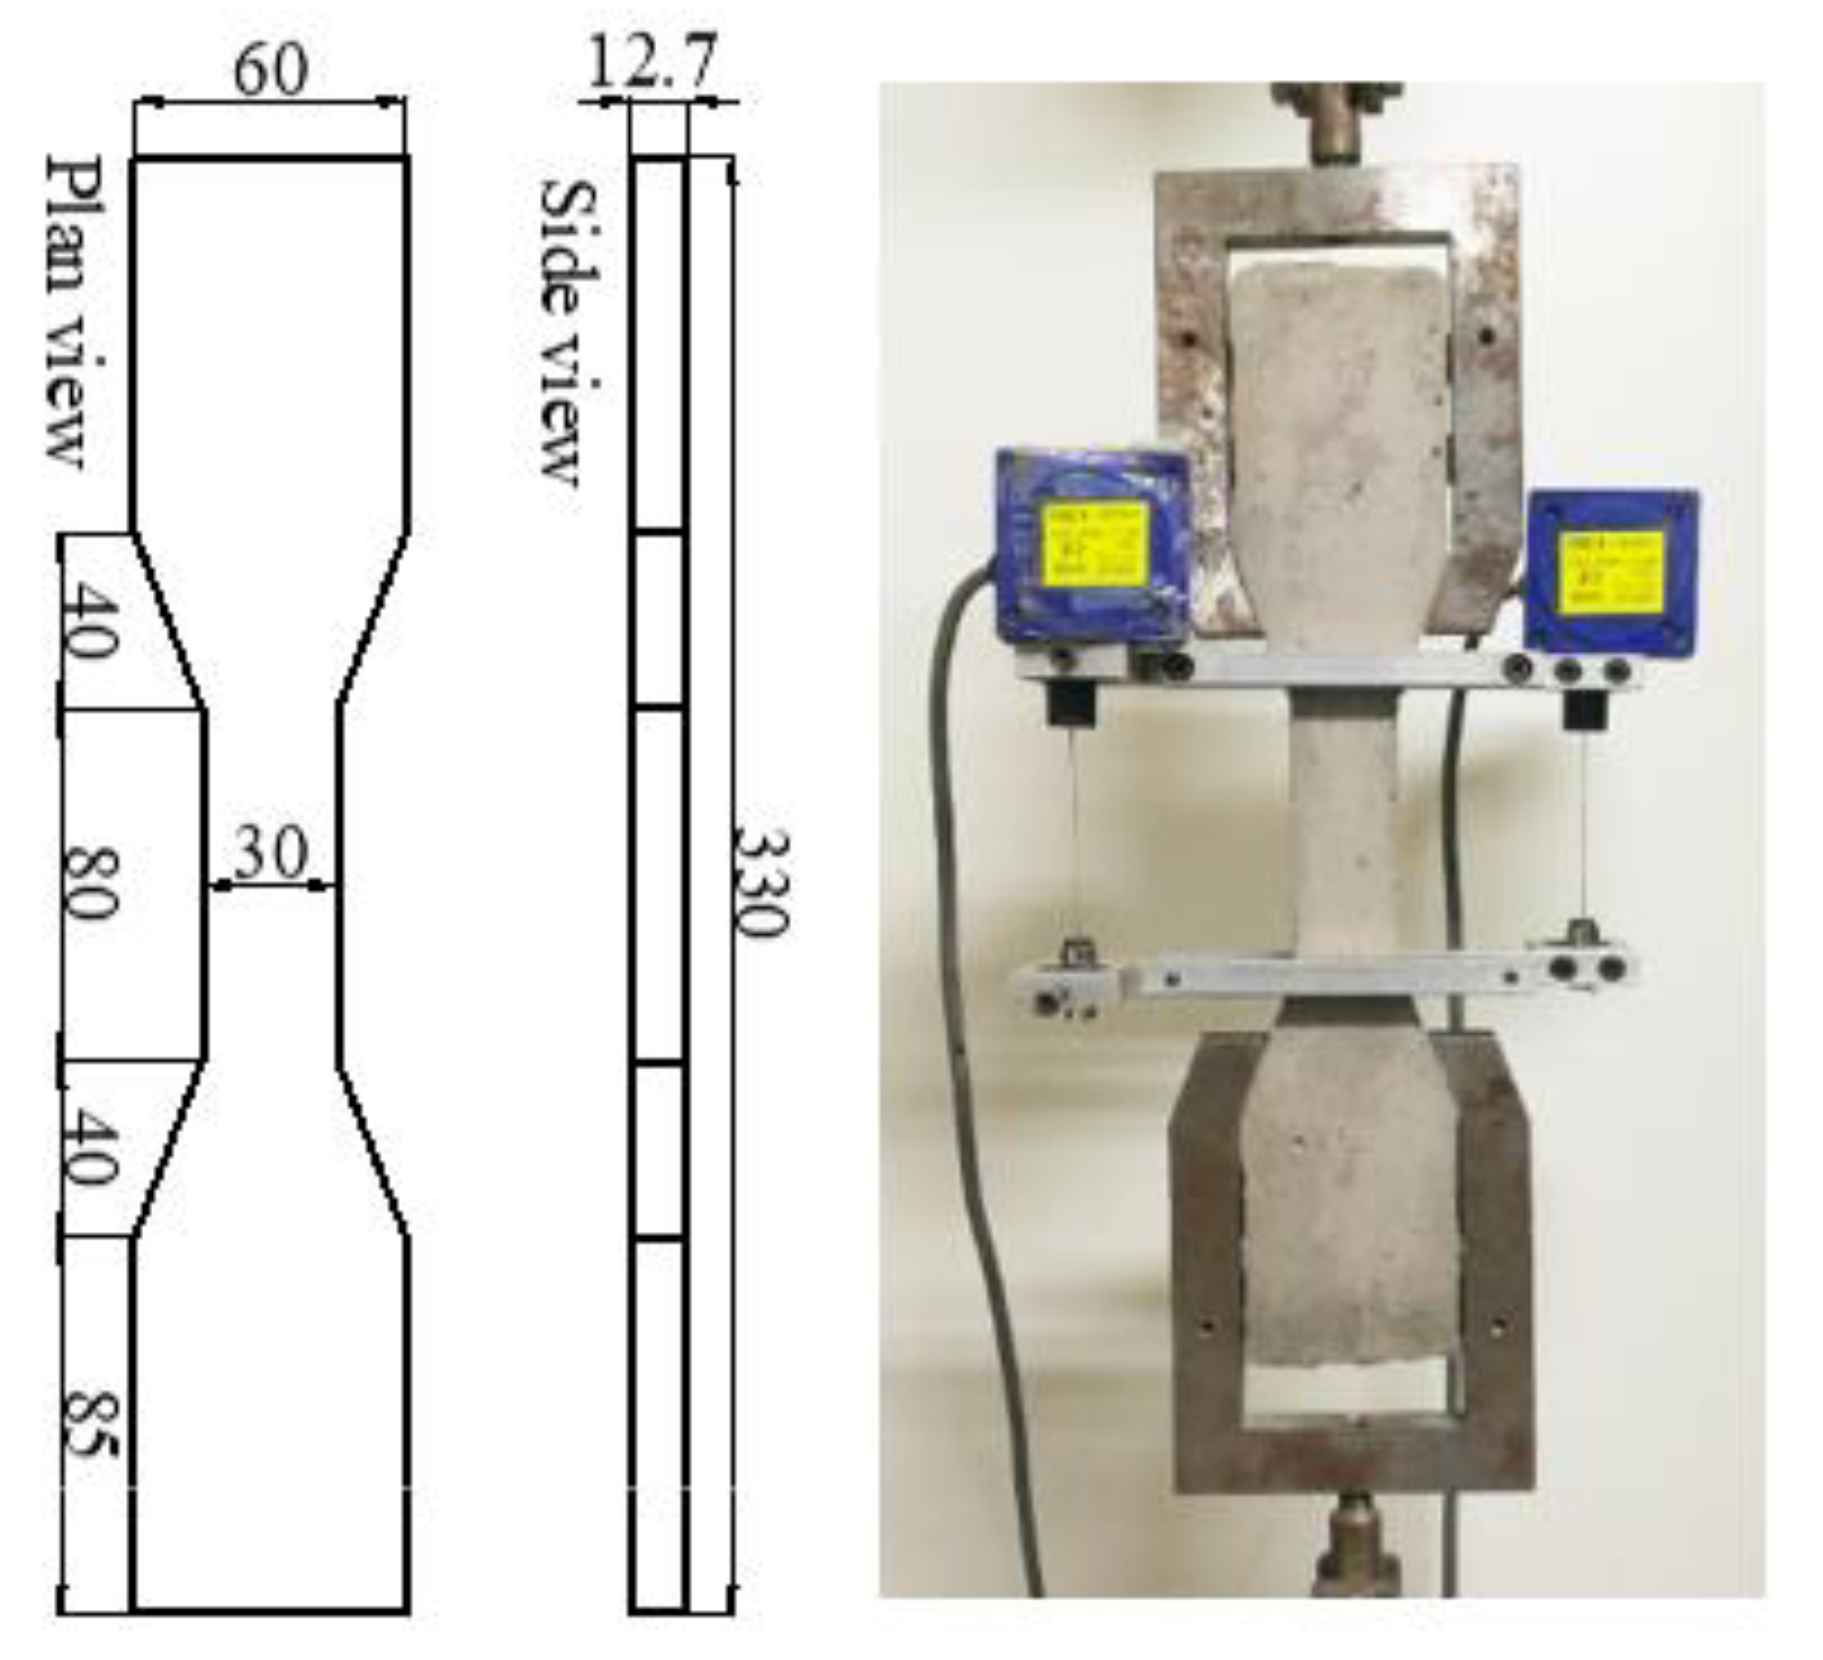
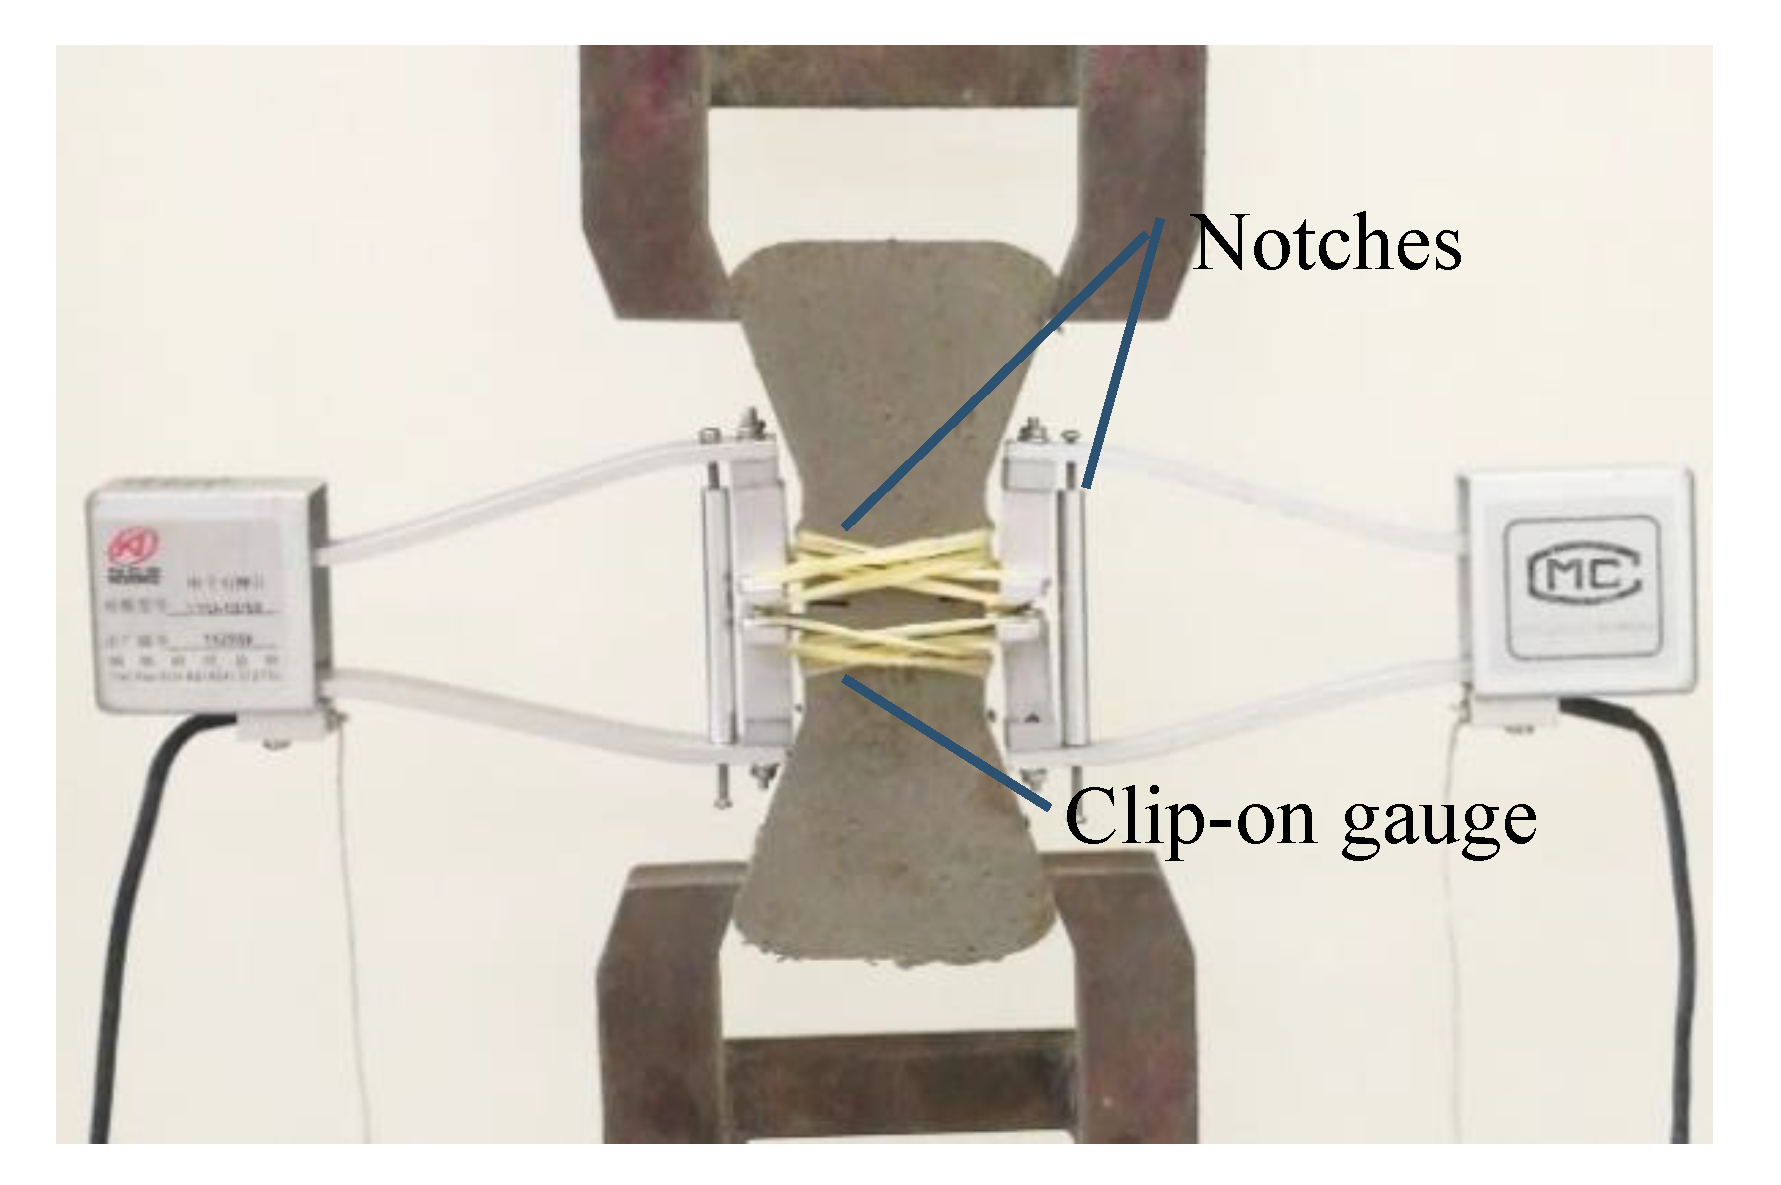
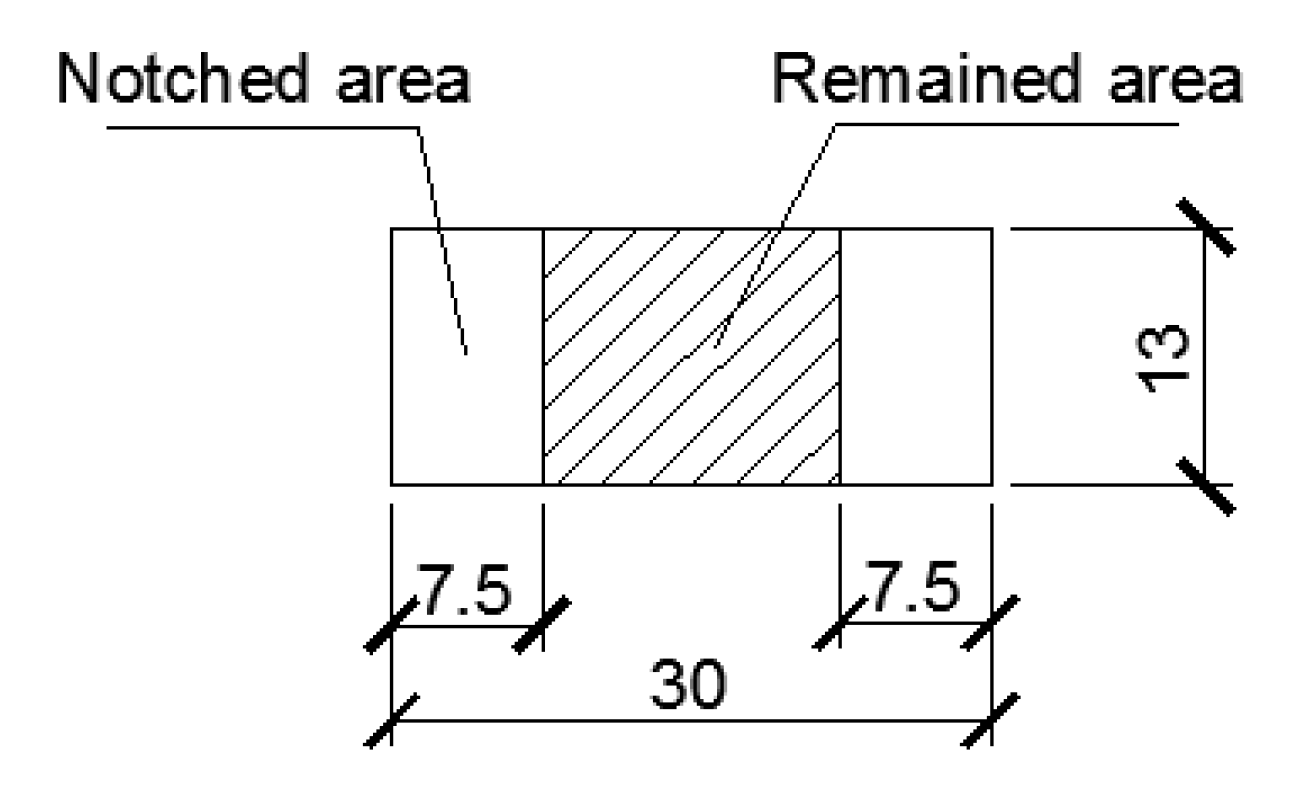
2.3. Mechanical Properties Tests
3. Results and Discussions
3.1. Tensile Behavior
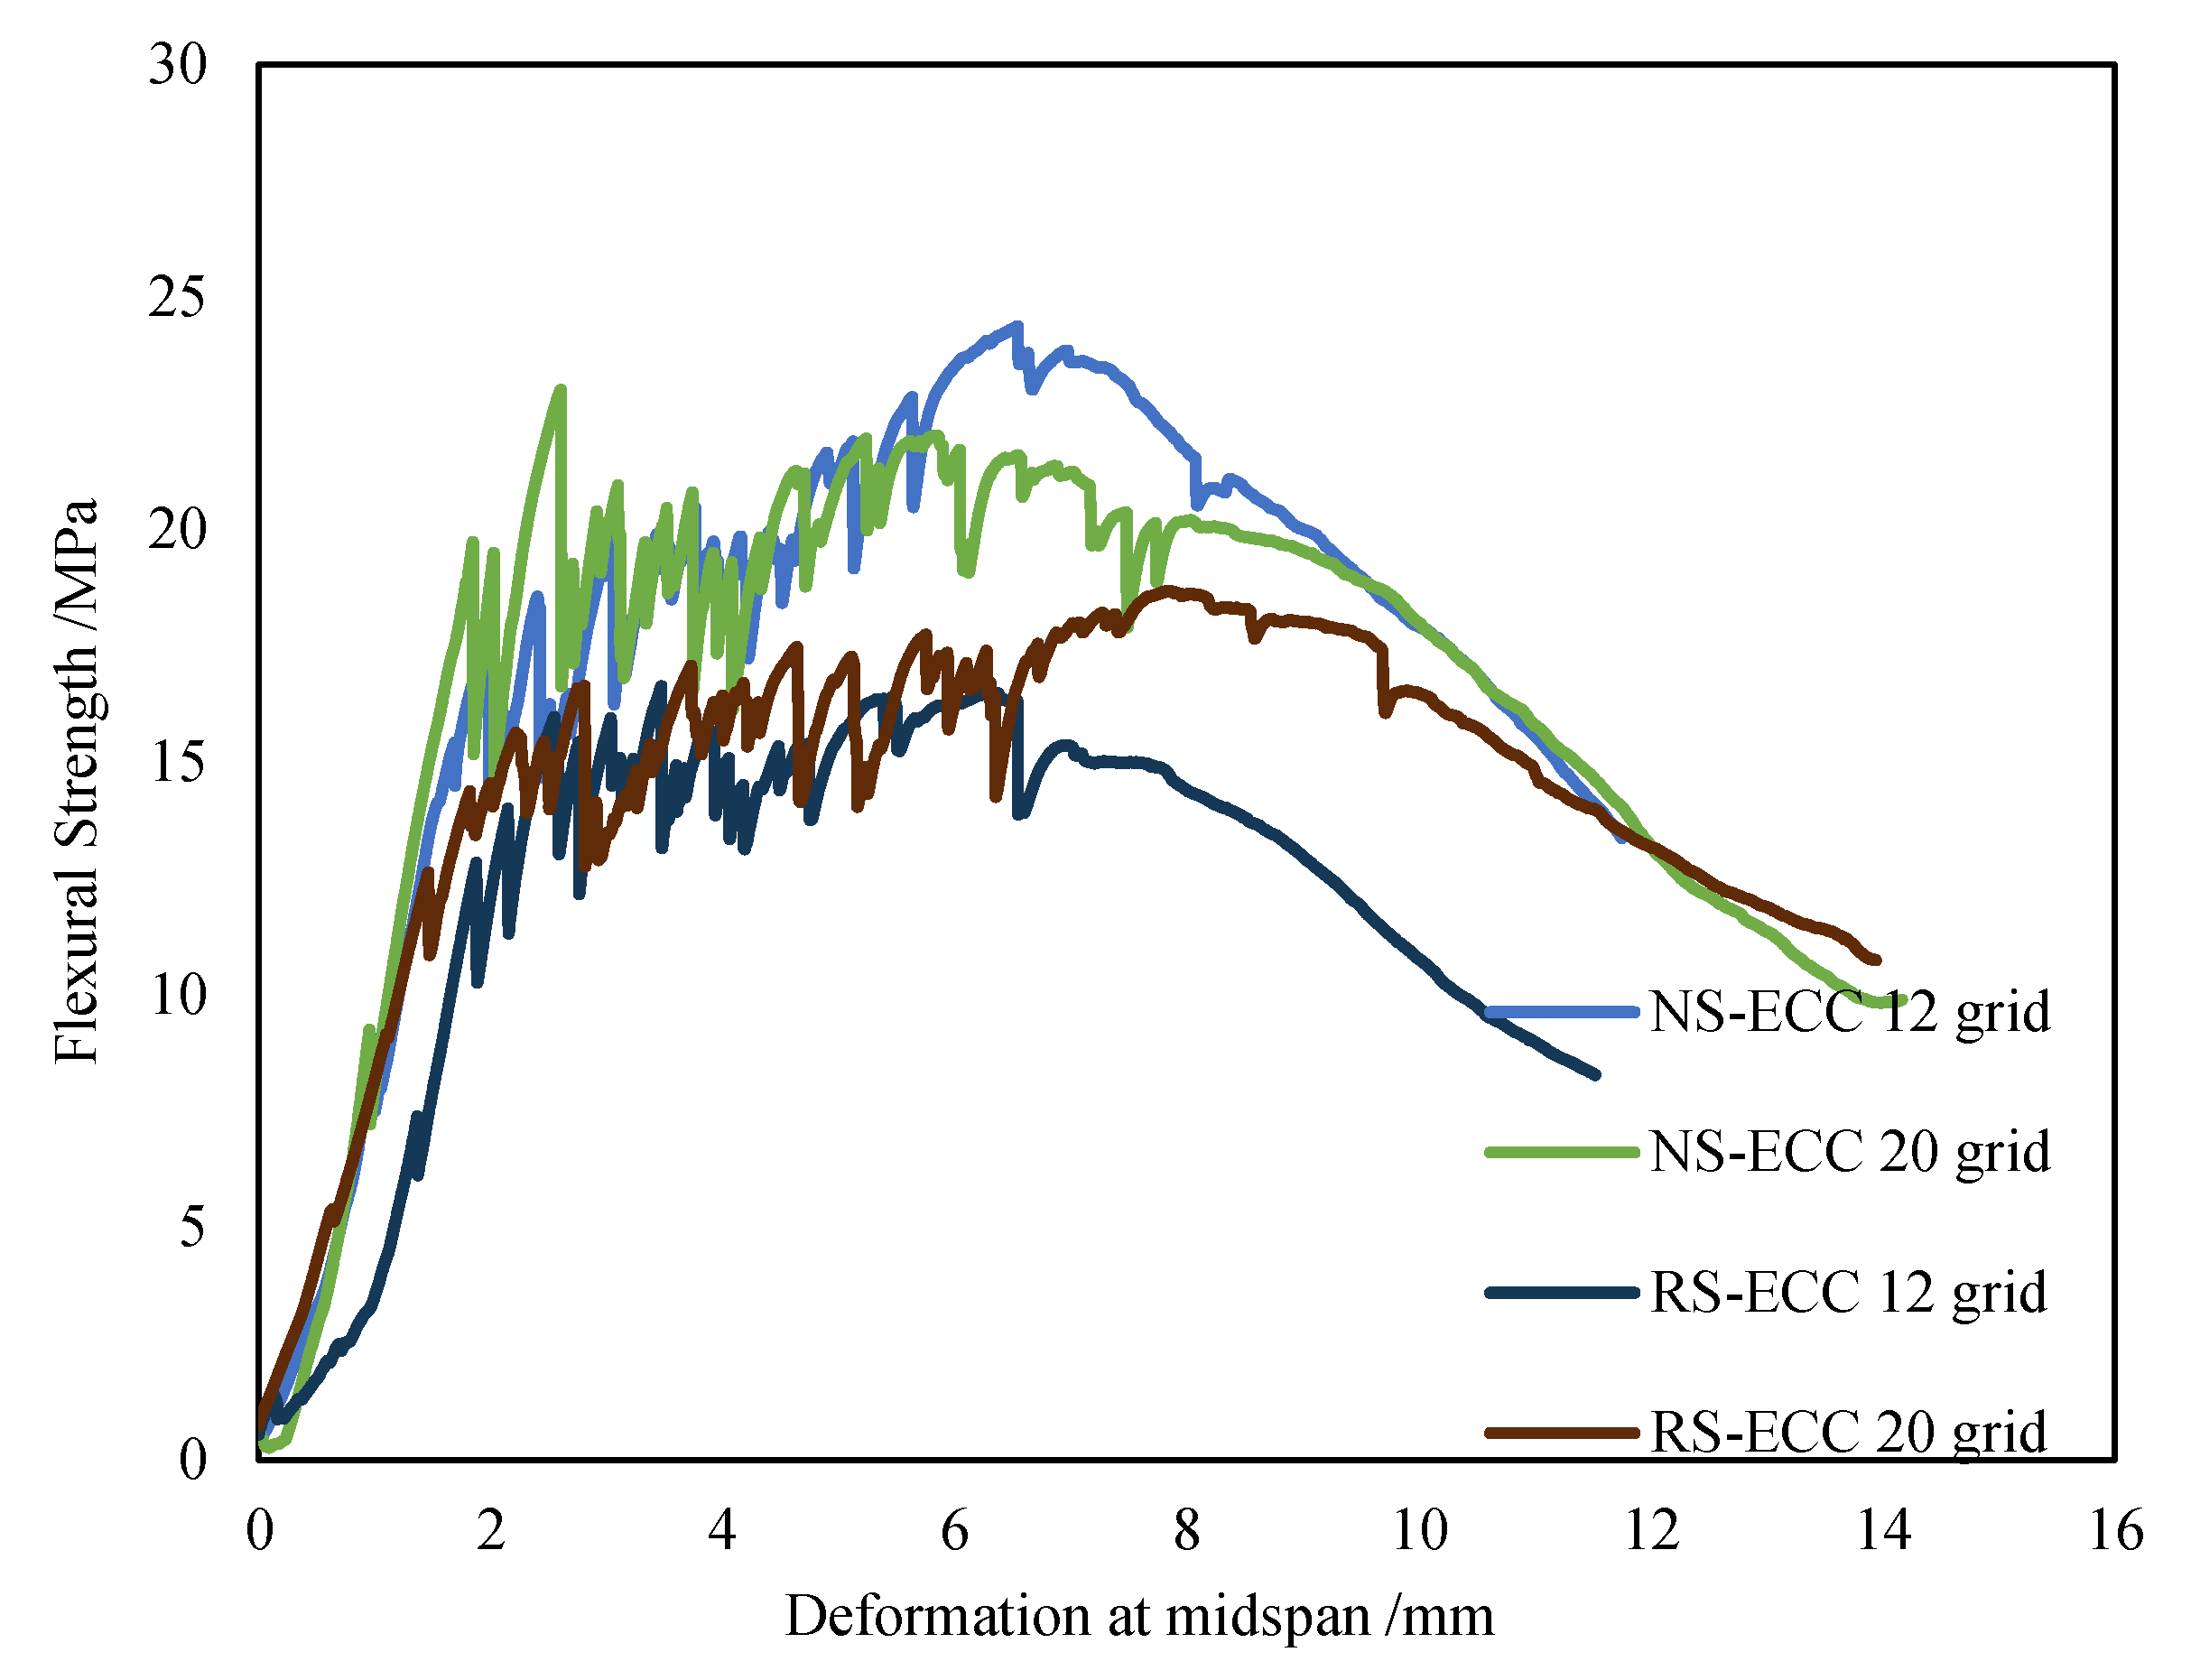
3.2. Compressive and Bending Properties
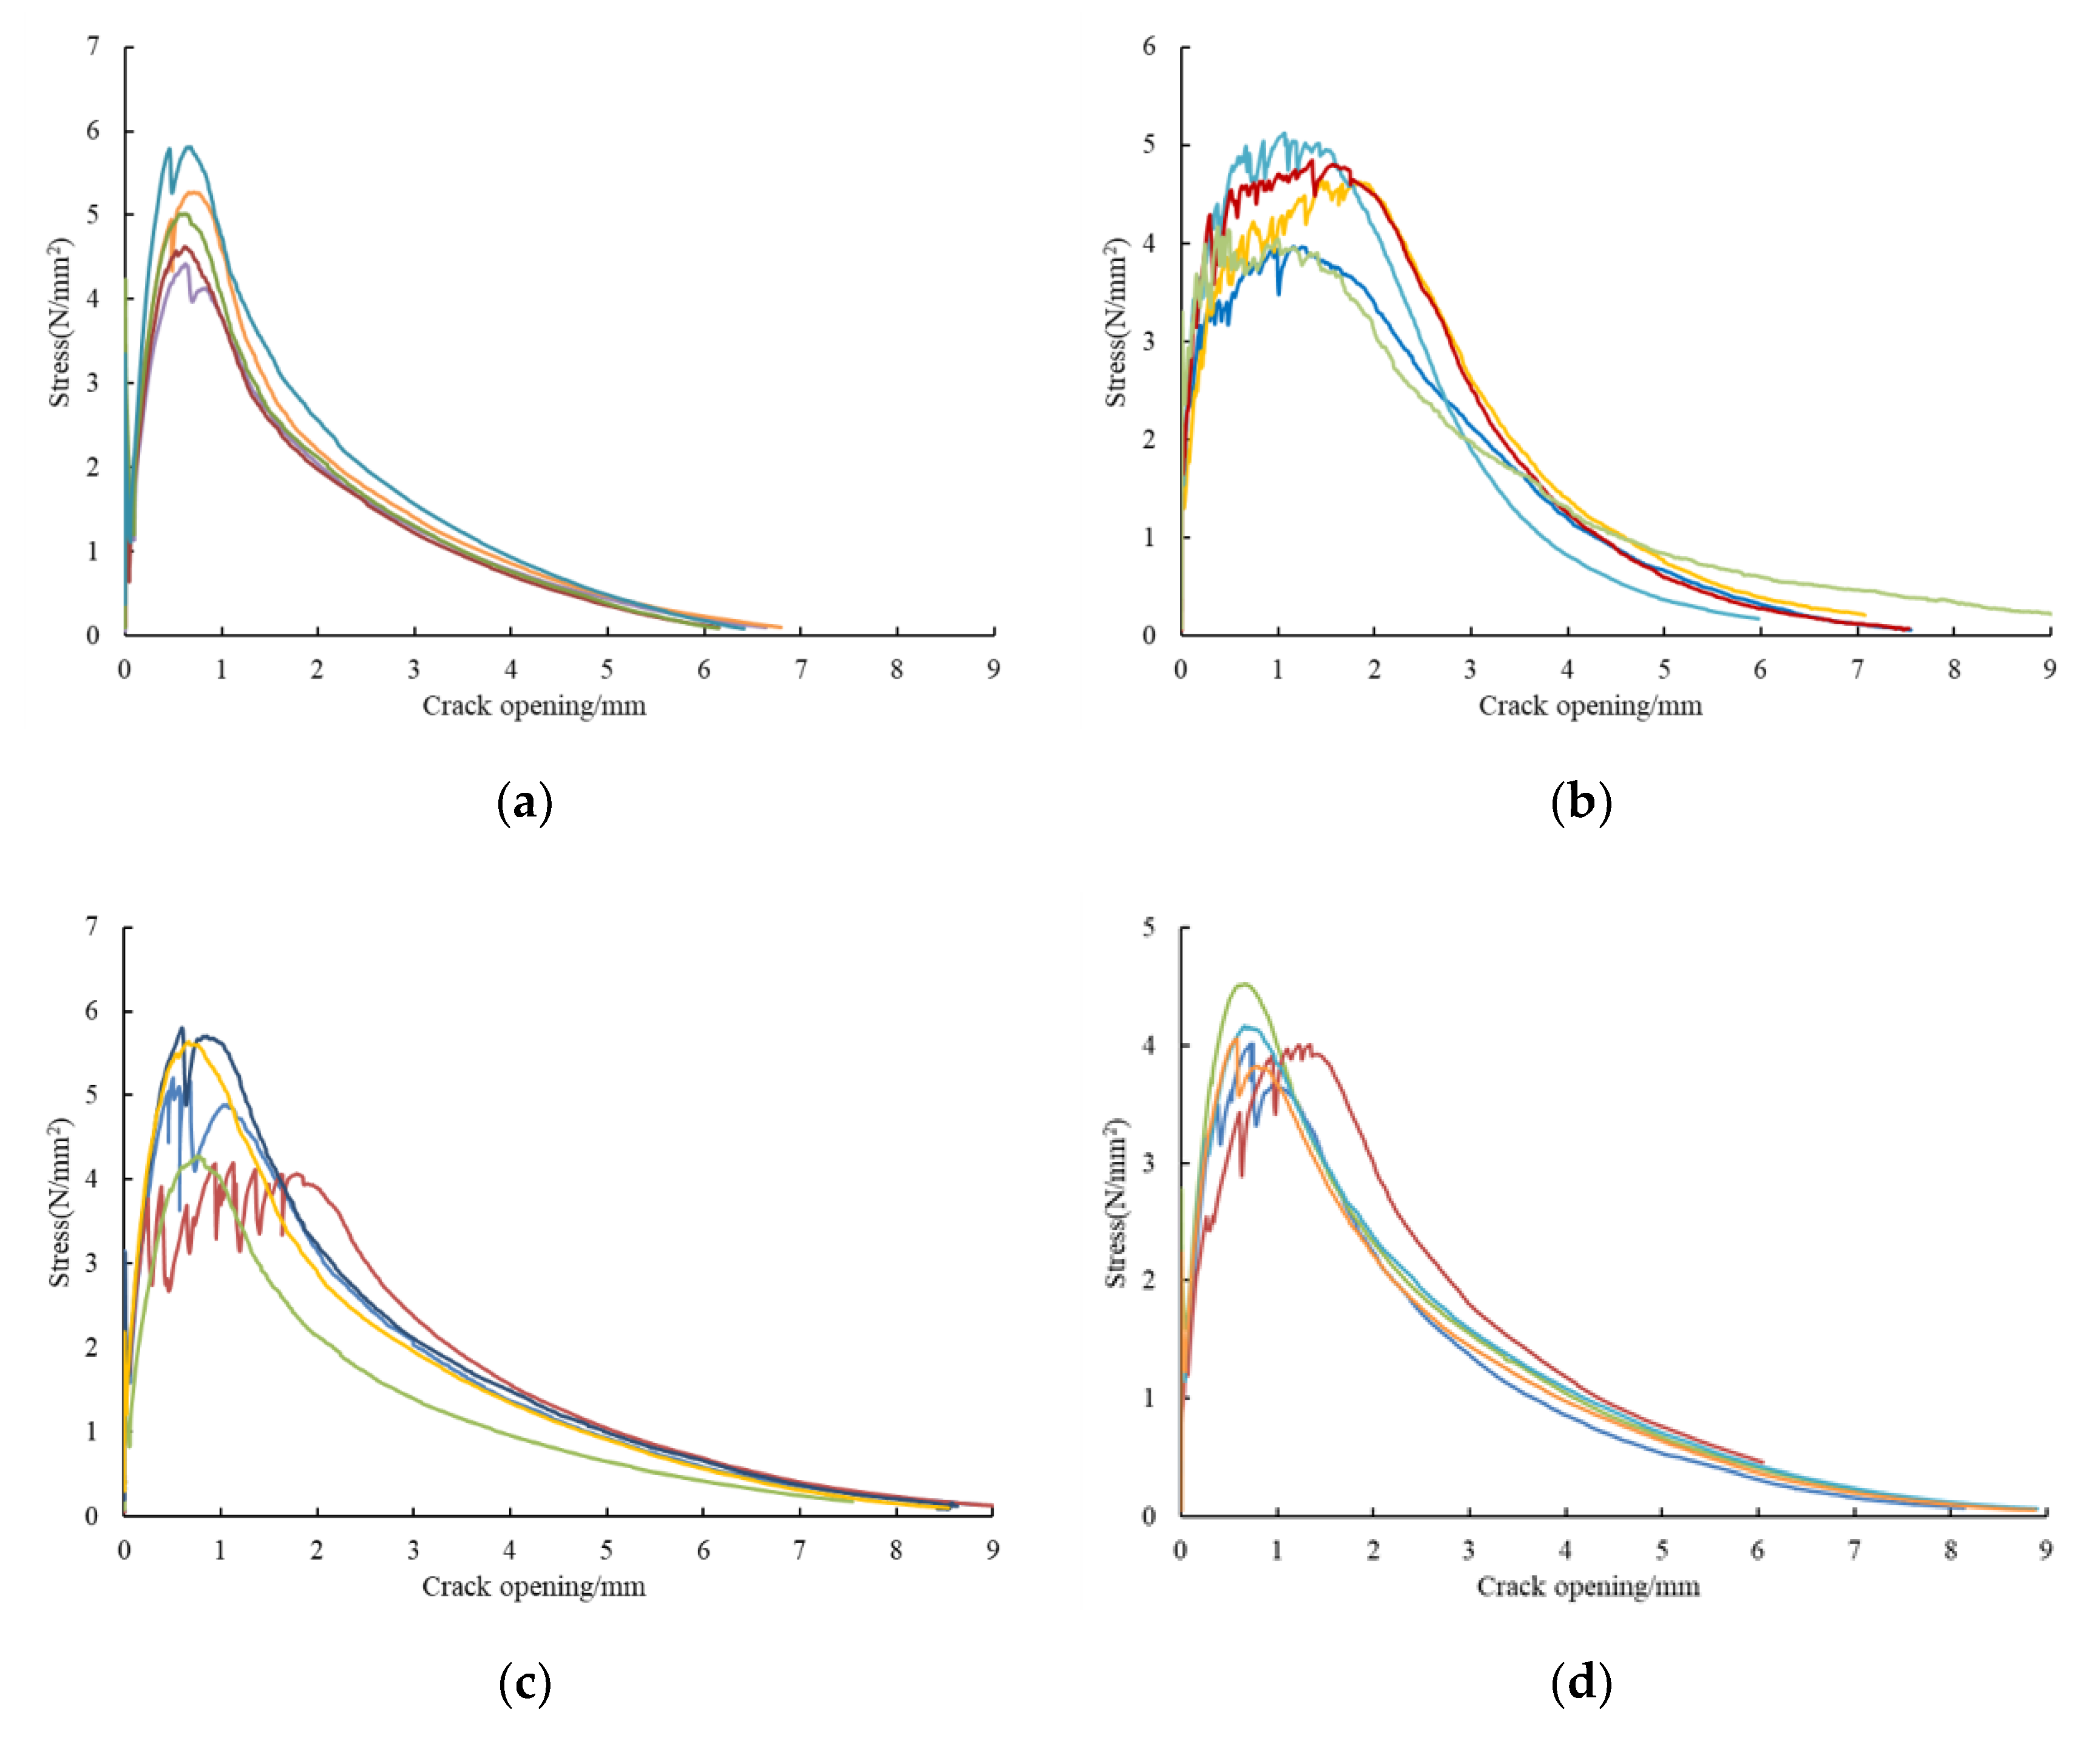
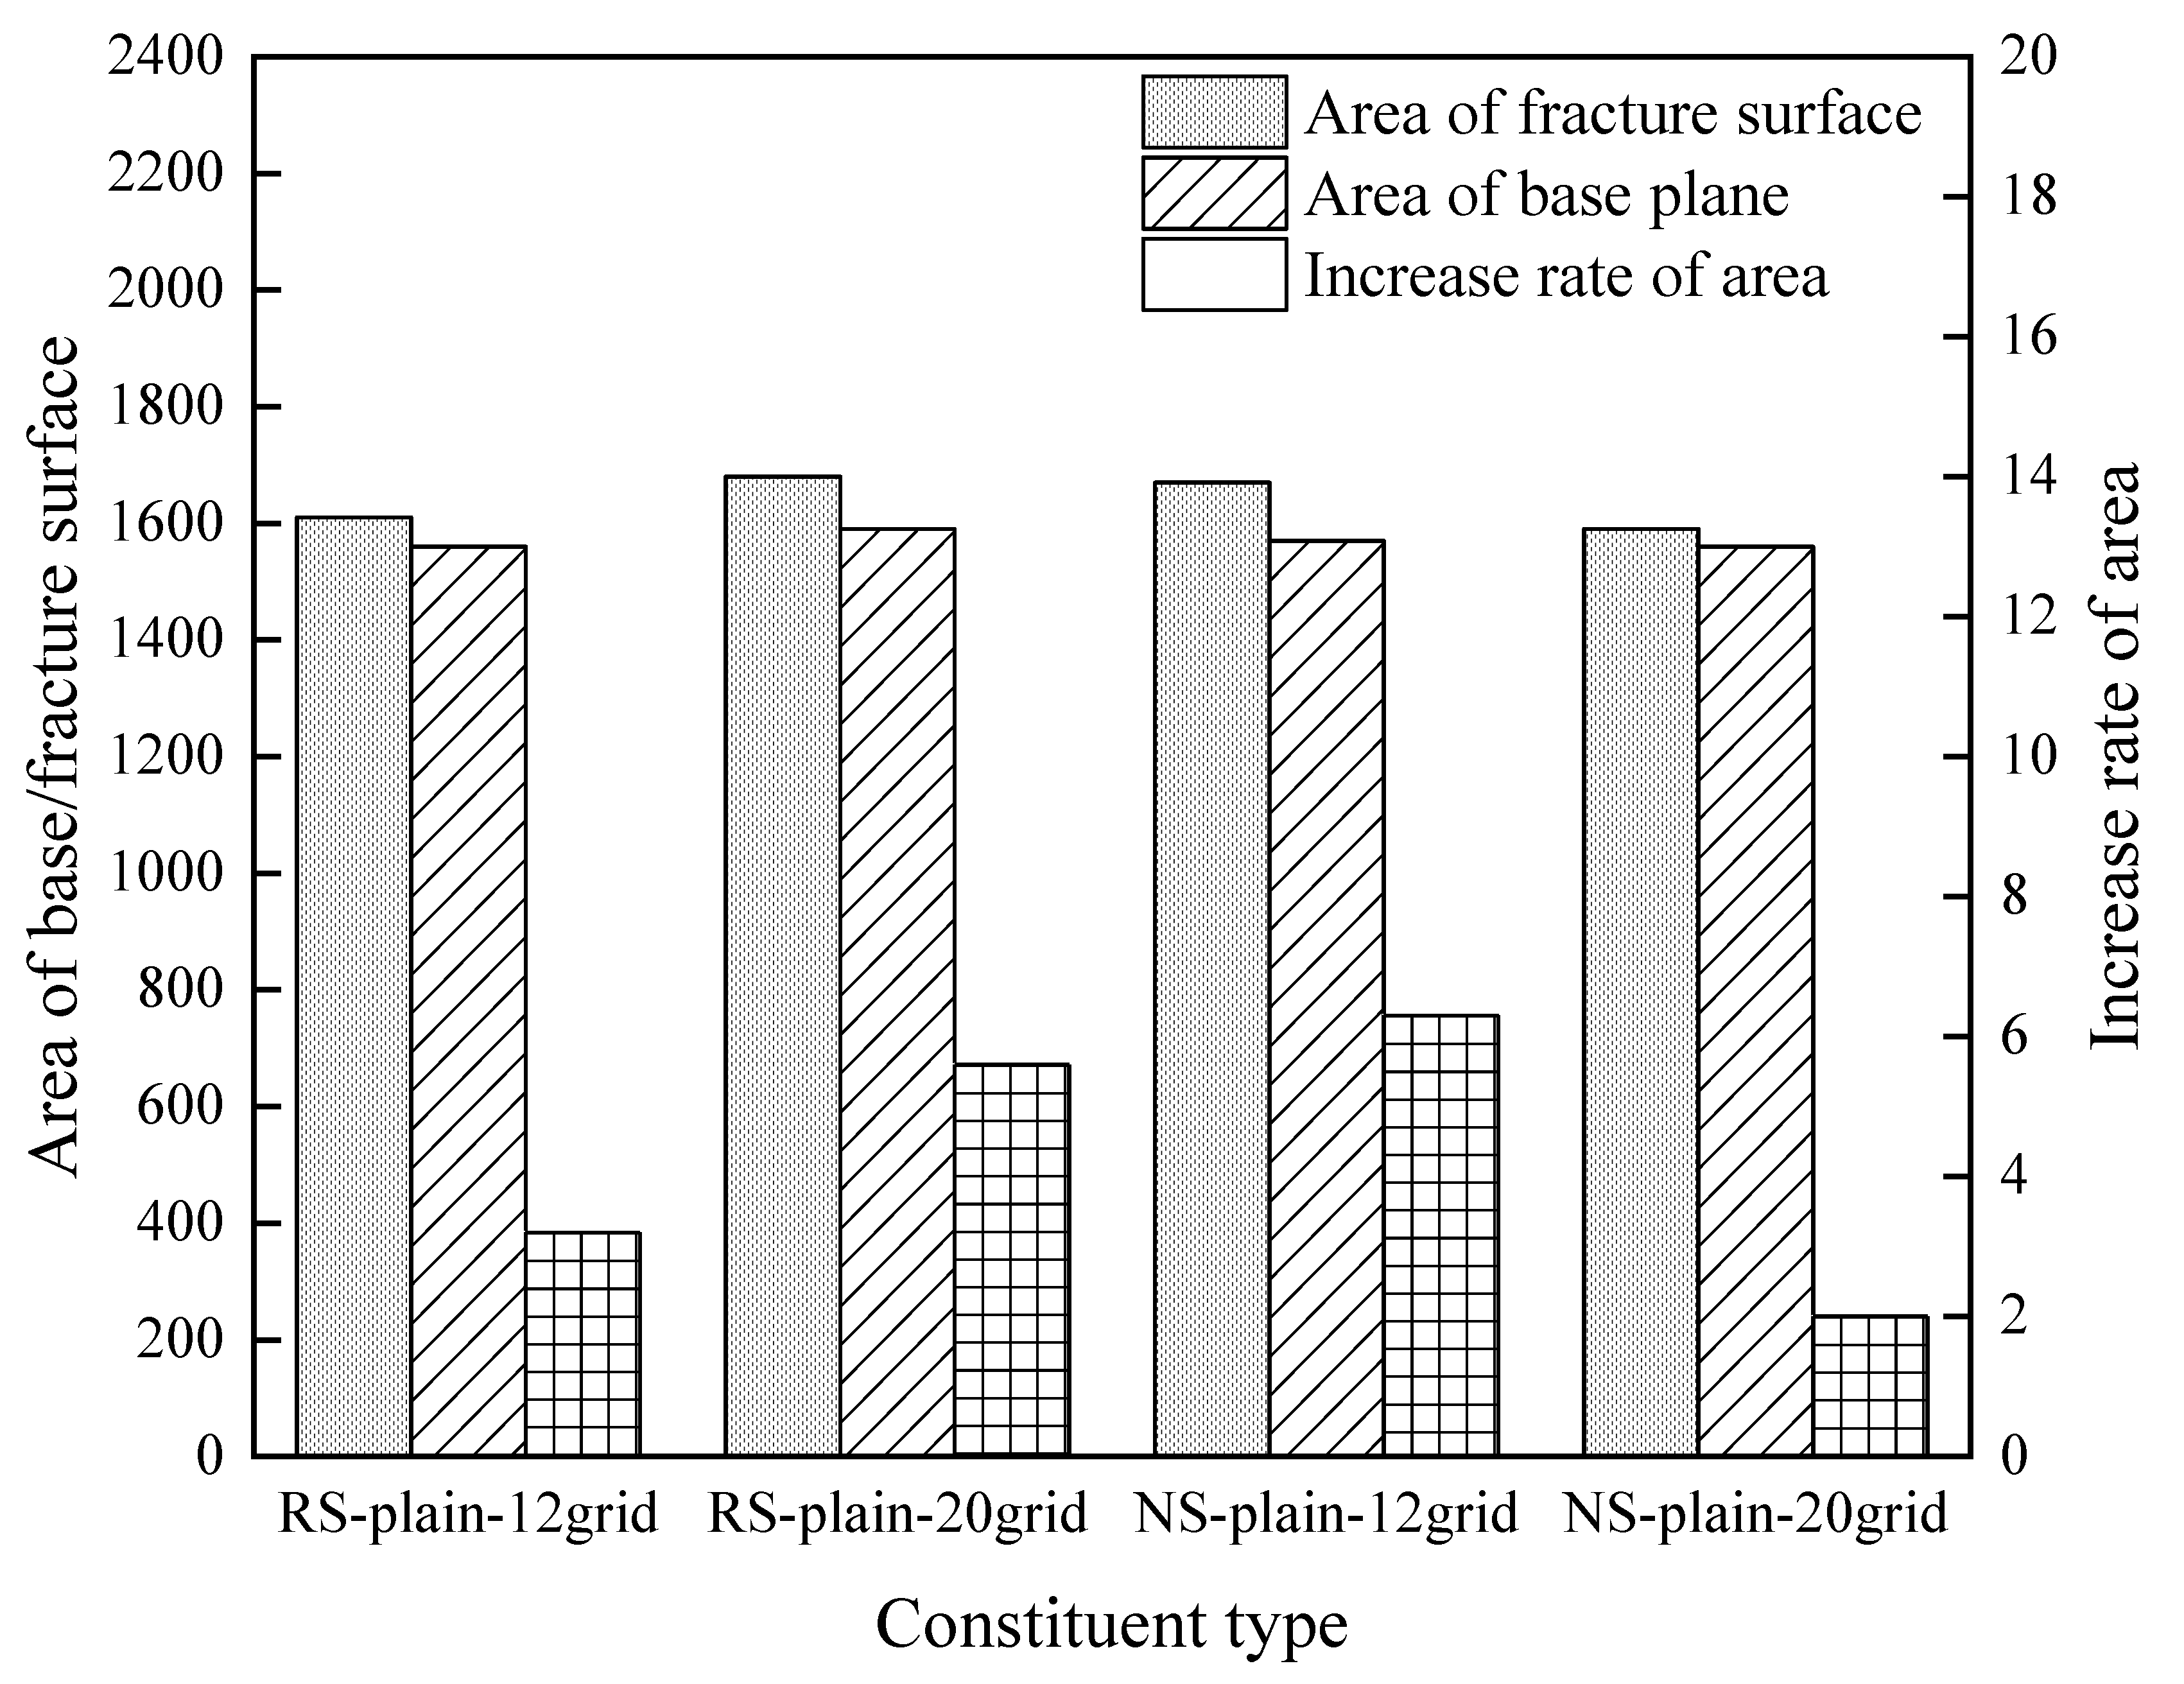
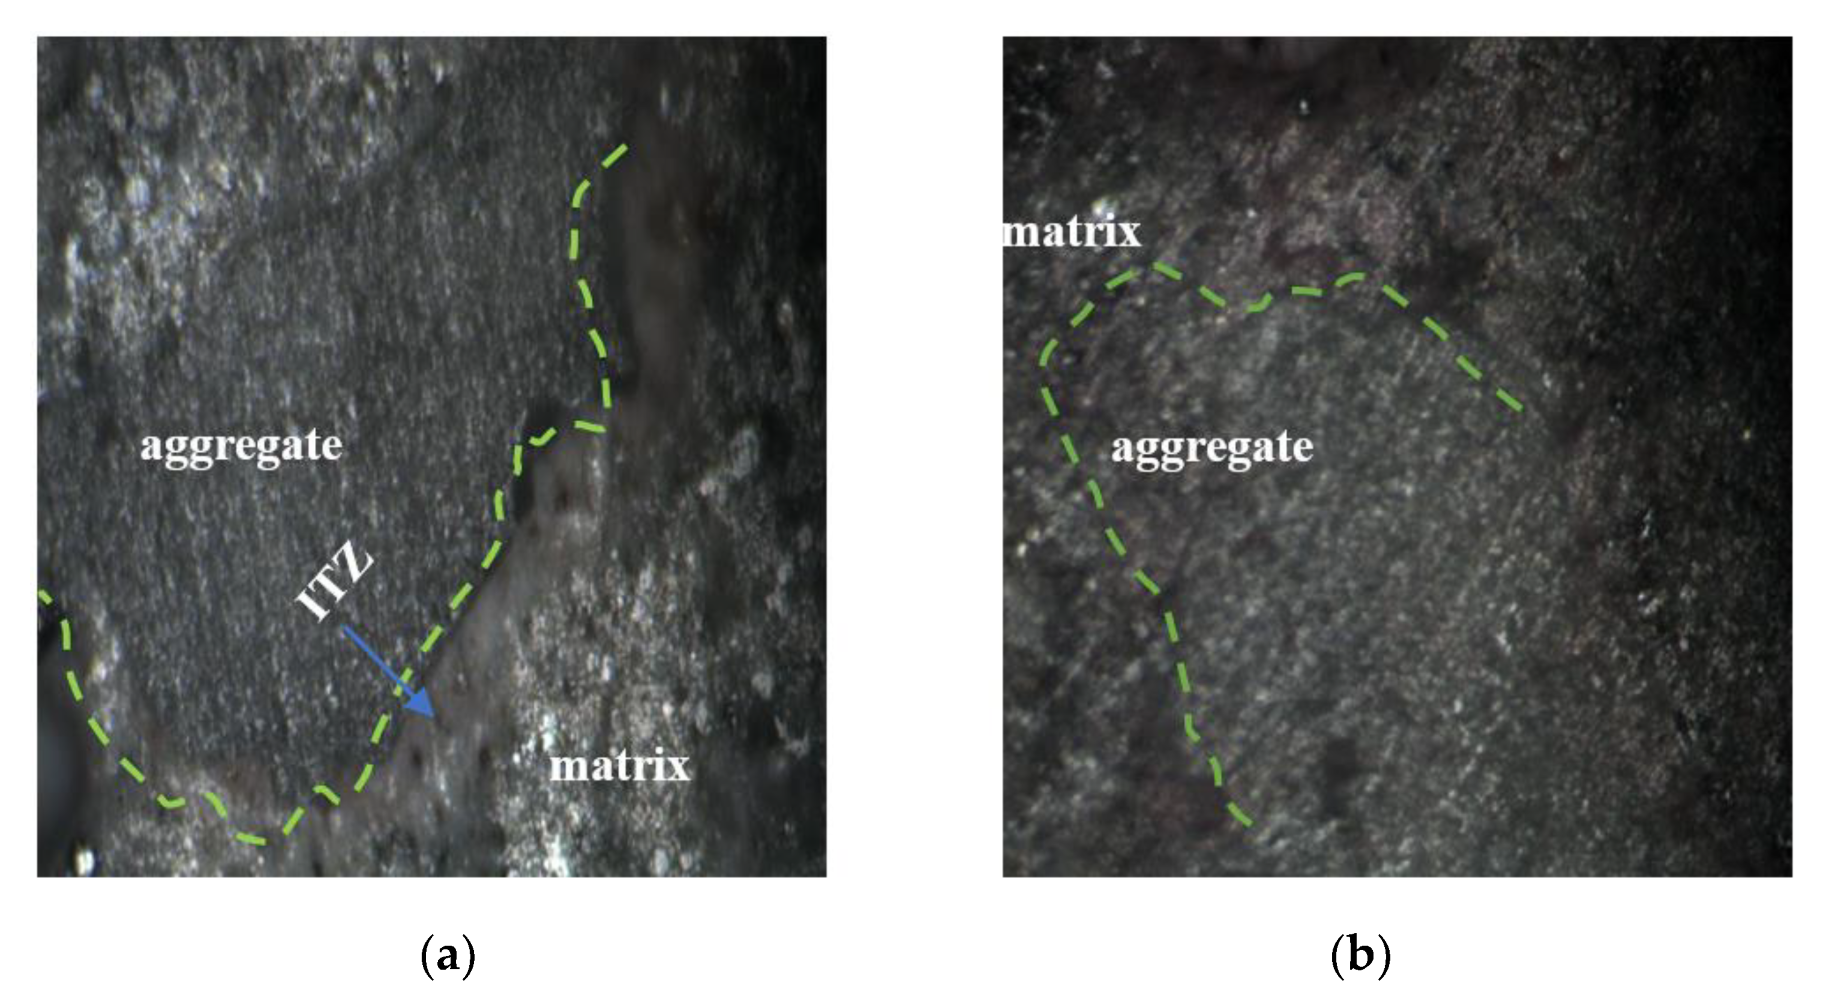
3.3. Discussion on the Effect of RS Replacement at the Meso-Scale
4. Conclusions
- (1)
- The ECC with RS showed excellent tensile ductility with a tensile strain of 7%, which is greater than that of the ECC with NS. Furthermore, the incorporation of RS into ECC maintained the same tensile strength as that of NS-ECC.
- (2)
- The compressive and flexural strengths of ECC were over 50 and 20 MPa. The addition of RS did not cause a significant loss of compressive and flexural strength, compared with that of ECC with NS.
- (3)
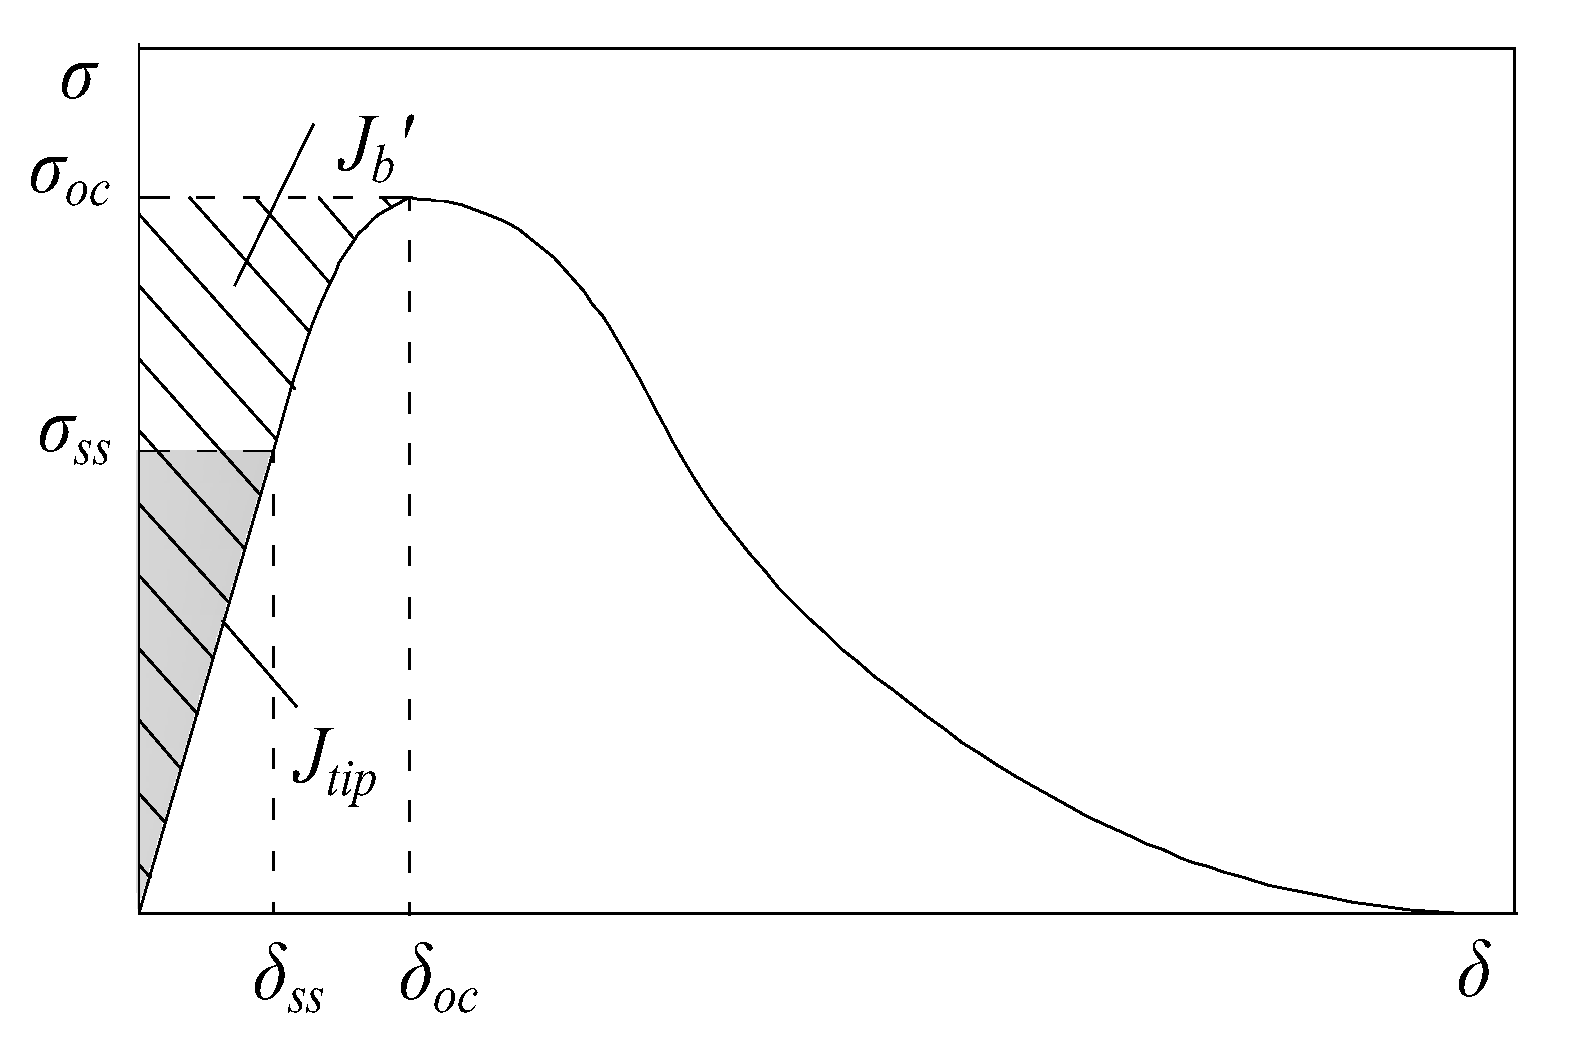
- The addition of RS decreased the matrix toughness and kept the fiber-bridging capacity constant. The pseudo-strain-hardening (PSH) of RS-ECC showed the highest value, which could benefit tensile ductility. The main reason for this was that the old residual mortar around the RS increased the gap of elastic modulus between the sand and ITZ, which decreased the matrix toughness and improved the tensile ductility.
Author Contributions
Funding
Conflicts of Interest
References
- Xiao, J.Z.; Qiang, C.B.; Nanni, A.; Zhang, K.J. Use of sea-sand and seawater in concrete construction: Current status and future opportunities. Constr. Build. Mater. 2017, 155, 1101–1111. [Google Scholar] [CrossRef]
- Reyes-sánchezi, J.A.; Tenza-Abril, A.J.; Verdu, F.; Perales, J.A.R. Predicting modulus of elasticity of recycled aggregate concrete using nonlinear mathematical models. Int. J. Comp. Meth. Exp. Meas. 2018, 6, 703–715. [Google Scholar] [CrossRef]
- Monteiro, P.J.M.; Miller, S.A.; Horvath, A. Towards sustainable concrete. Nat. Mater. 2017, 16, 698. [Google Scholar] [CrossRef] [PubMed]
- Bourguiba, A.; Ghorbel, E.; Cristofol, L.; Dhaoui, W. Effects of recycled sand on the properties and durability of polymer and cement based mortars. Constr. Build. Mater. 2017, 153, 44–54. [Google Scholar] [CrossRef]
- Xiao, J.Z.; Ma, Z.M.; Ding, T. Reclamation chain of waste concrete: A case study of shanghai. Waste Manag. 2015, 48, 334–343. [Google Scholar] [CrossRef] [PubMed]
- Rahal, K. Mechanical properties of concrete with recycled coarse aggregate. Build. Environ. 2007, 42, 407–415. [Google Scholar] [CrossRef]
- Corinaldesi, V. Mechanical and elastic behavior of concretes made of recycled-concrete coarse aggregates. Constr. Build. Mater. 2010, 24, 1616–1620. [Google Scholar] [CrossRef]
- Pedro, D.J.; de Brito, J.; Evangelista, L. Influence of the use of recycled concrete aggregates from different sources on structural concrete. Constr. Build. Mater. 2014, 71, 141–151. [Google Scholar] [CrossRef]
- Ferro, G.A.; Spoto, C.; Tulliani, J.M.; Restuccia, L. Mortar made of recycled sand from C&D. Procedia Eng. 2015, 109, 240–247. [Google Scholar]
- Khatib, J.M. Properties of concrete incorporating fine recycled aggregate. Cem. Concr. Res. 2005, 35, 763–769. [Google Scholar] [CrossRef]
- Evangelista, L.; de Brito, J. Mechanical behaviour of concrete made with fine recycled concrete aggregates. Cem. Concr. Compos. 2007, 29, 397–401. [Google Scholar] [CrossRef]
- Khoshkenari, A.G.; Shafigh, P.; Moghimi, M.; Mahmud, H.B. The role of 0–2 mm fine recycled concrete aggregate on the compressive and splitting tensile strengths of recycled concrete aggregate concrete. Mater. Des. 2014, 64, 345–354. [Google Scholar] [CrossRef]
- Pereira, P.; Evangelista, L.; de Brito, J. The effect of superplasticisers on theworkability and compressive strength of concrete made with fine recycledconcrete aggregates. Constr. Build. Mater. 2012, 28, 722–729. [Google Scholar] [CrossRef]
- Fan, C.; Huang, R.; Hwang, H.; Chao, S. Properties of concrete incorporating fine recycled aggregates from crushed concrete wastes. Constr. Build. Mater. 2016, 112, 708–715. [Google Scholar] [CrossRef]
- Carro-López, D.; Gónzález-Fonteboa, F.; Martínez, A.; Gónzález, T.; de Brito, J.; Varela-Puga, F. Proportioning, microstructure and fresh properties of self-compacting concrete with recycled sand. Procedia Eng. 2017, 171, 645–657. [Google Scholar] [CrossRef]
- Yu, K.; Mcgee, W.; Ng, T.Y.; Zhu, H.; Li, V.C. 3D-printable engineered cementitious composites (3DP-ECC): Fresh and hardened properties. Cem. Concr. Res. 2021, 143, 106388. [Google Scholar] [CrossRef]
- Ye, J.; Cui, C.; Yu, J.; Yu, K.; Xiao, J. Fresh and anisotropic-mechanical properties of 3D printable ultra-high ductile concrete with crumb rubber. Compos. Part B Eng. 2021, 211, 108639. [Google Scholar] [CrossRef]
- Liao, Q.; Su, Y.; Yu, J.; Yu, K. Torsional behavior of BFRP bars reinforced engineered cementitious composites beams without stirrup. Eng. Struct. 2022, 268, 114748. [Google Scholar] [CrossRef]
- Liao, Q.; Su, Y.; Yu, J.; Yu, K. Compression-shear performance and failure criteria of seawater sea-sand engineered cementitious composites with polyethylene fibers. Constr. Build. Mater. 2022, 345, 128386. [Google Scholar] [CrossRef]
- Li, V.C. Engineered cementitious composites-tailored composites through micromechanical modelling. In Fiber Reinforced Concrete: Present and the Future; Canadian Society for Civil Engineering: Montreal, QC, Canada, 1998; pp. 64–97. [Google Scholar]
- Cai, Z.; Liu, F.; Yu, J.; Yu, K.; Tian, L. Development of ultra-high ductility engineered cementitious composites as a novel and resilient fireproof coating. Constr. Build. Mater. 2021, 288, 123090. [Google Scholar] [CrossRef]
- Sahmaran, M.; Li, M.; Li, V.C. Transport Properties of Engineered Cementitious Composites under Chloride Exposure. ACI Mater. J. 2007, 104, 303–310. [Google Scholar]
- Qian, S.Z.; Li, V.C. Headed Anchor/Engineered Cementitious Composites (ECC) Pullout Behavior. J. Adv. Concr. Technol. 2011, 9, 339–351. [Google Scholar] [CrossRef][Green Version]
- Qian, S.Z.; Li, V.C.; Zhang, H.; Keoleian, G.A. Life cycle analysis of pavement overlays made with Engineered Cementitious Composites. Cem. Concr. Compos. 2013, 35, 78–88. [Google Scholar] [CrossRef]
- Dong, Z.; Tan, H.; Yu, J.; Liu, F. A feasibility study on Engineered cementitious Composites mixed with coarse aggregate. Constr. Build. Mater. 2022, 350, 128587. [Google Scholar] [CrossRef]
- Sahmaran, M.; Lachemi, M.; Li, V.C. Assessing the Durability of Engineered Cementitious Composites Under Freezing and Thawing Cycles. J. ASTM Int. 2009, 6, 102406–102419. [Google Scholar]
- Kanda, T.; Li, V.C. New micromechanics design theory for pseudo strain hardening cementitious composite. ASCE J. Eng. Mech. 1999, 125, 373–381. [Google Scholar] [CrossRef]
- Wang, S.; Li, V.C. Tailoring of pre-existing flaws in ECC matrix for saturated strain hardening. In Proceedings of the Fifth International Conference on Fracture Mechanics of Concrete and Concrete Structures, Vail, CO, USA, 12–16 April 2004; pp. 1005–1012. [Google Scholar]
- Zhang, Z.G.; Qian, S.Z.; Ma, H. Investigating mechanical properties and self-healing behavior of micro-cracked ECC with different volume of fly ash. Constr. Build. Mater. 2014, 52, 17–23. [Google Scholar] [CrossRef]
- Zhang, Z.G.; Ma, H.; Qian, S.Z. Investigation on Properties of ECC Incorporating Crumb Rubber of Different Sizes. J. Adv. Concr. Technol. 2015, 13, 241–251. [Google Scholar] [CrossRef]
- Zhang, Z.G.; Zhang, Q.; Qian, S.Z.; Li, V.C. Low E-Modulus Early Strength Engineered Cementitious Composites Material Development for Ultrathin Whitetopping Overlay. Transp. Res. Rec. J. Transp. Res. Board 2015, 2481, 41–47. [Google Scholar] [CrossRef]
- Lepech, M.D.; Li, V.C. Application of ECC for bridge deck link slabs. Mater. Struct. 2009, 42, 1185–1195. [Google Scholar] [CrossRef]
- Sahmaran, M.; Yücel, H.E.; Demirhan, S.; Arık, M.T.; Li, V.C. Combined Effect of Aggregate and Mineral Admixtures on Tensile Ductility of Engineered Cementitious Composites. ACI Mater. J. 2009, 109, 11. [Google Scholar]
- Xu, S.; Reinhardt, H.W. Determination of double-K criterion for crack propagation in quasi-brittle fracture, Part II: Analytical evaluating and practical measuring methods for three-point bending notched beams. Int. J. Fract. 1999, 98, 151–177. [Google Scholar] [CrossRef]
- Yang, Y.Z.; Yao, Y.; Zhu, Y. Effects of Gradation of Sand on the Mechanical Properties of Engineered Cementitious Composites. Adv. Mater. Res. 2011, 250, 374–378. [Google Scholar] [CrossRef]
- Chen, B.; Li, J. Effect of aggregate on the fracture behavior of high strength concrete. Constr. Build. Mater. 2004, 18, 585–590. [Google Scholar] [CrossRef]
- Li, Y.; Li, J.Q. Relationship between fracture area and tensile strength of cement matrix with supplementary cementitious materials. Constr. Build. Mater. 2015, 79, 223–228. [Google Scholar] [CrossRef]
- Li, W.; Xiao, J.; Sun, Z.; Kawashima, S.; Shah, S.P. Interfacial transition zones in recycled aggregate concrete with different mixing approaches. Constr. Build. Mater. 2012, 35, 1045–1055. [Google Scholar] [CrossRef]
- Ollivier, J.P.; Maso, J.C.; Bourdette, B. Interfacial transition zone in concrete. Adv. Cem. Based Mater. 1995, 2, 30–38. [Google Scholar] [CrossRef]
- Bremner, T.W.; Holm, T.A. Elastic Compatibility and the Behavior of Concrete. J. Proc. 1986, 83, 244–250. [Google Scholar]


| Mixture ID | PE Fiber (g) | Cement (g) | Fly Ash (g) | NS (g) | RS (g) | Water (g) | HRWR (g) |
|---|---|---|---|---|---|---|---|
| RS-ECC-20 grid | 20 | 628 | 754 | 0 | 502 | 387 | 1.8 |
| RS-ECC-12 grid | 20 | 628 | 754 | 502 | 0 | 387 | 1.0 |
| NS-ECC-20 grid | 20 | 628 | 754 | 0 | 502 | 387 | 1.8 |
| NS-ECC-12 grid | 20 | 628 | 754 | 502 | 0 | 387 | 1.0 |
| Ingredients | Fly Ash | Recycled Sand | |
|---|---|---|---|
| Chemical composition (%) | Na2O | 0.58 | 0.86 |
| MgO | 0.90 | 2.26 | |
| Al2O3 | 23.9 | 12.0 | |
| SiO2 | 51.7 | 47.9 | |
| P2O5 | 0.40 | 0.29 | |
| SO3 | 0.91 | 1.41 | |
| K2O | 1.40 | 2.33 | |
| CaO | 7.65 | 18.7 | |
| TiO2 | 1.19 | 0.82 | |
| MnO | 0.07 | 0.10 | |
| Fe2O3 | 5.22 | 6.53 | |
| Cl− | / | 0.06 | |
| Cr2O3 | / | 0.02 | |
| NiO | / | 0.01 | |
| CuO | / | 0.01 | |
| ZnO | / | 0.02 | |
| SrO | / | 0.03 | |
| ZrO2 | / | 0.02 | |
| Diameter (μm) | Fiber Aspect Ratio | Nominal Strength (GPa) | Modulus (GPa) | Rupture Elongation (%) | Density (g/cm3) | Melting Point (°C) |
|---|---|---|---|---|---|---|
| 25 | 720 | 2.9 | 116 | 2.42 | 0.97 | 150 |
| Mixture ID | RS-ECC-12 Grid | NS-ECC-12 Grid | RS-ECC-20 Grid | NS-ECC-20 Grid |
|---|---|---|---|---|
| Uniaxial tension test | 12 | 12 | 12 | 12 |
| Uniaxial compression test | 6 | 6 | 6 | 6 |
| Uniaxial compression test (mixture without fiber) | 6 | 6 | 6 | 6 |
| Single crack tension test | 6 | 6 | 6 | 6 |
| Three-point bending test | 3 | 3 | 3 | 3 |
| Three-point bending test (mixture without fiber) | 3 | 3 | 3 | 3 |
| Fracture toughness test (mixture without fiber) | 3 | 3 | 3 | 3 |
| Mixture ID | Crack Number (80 mm) | Crack Width (μm) | Crack Spacing (mm) |
|---|---|---|---|
| RS-ECC-20 grid | 44 | 117 | 1.93 |
| RS-ECC-12 grid | 37 | 119 | 2.16 |
| NS-ECC-20 grid | 29 | 125 | 2.69 |
| NS-ECC-12 grid | 26 | 145 | 3.03 |
| Mixture ID | First Cracking Stress (N/mm2) | Cracking Strain (%) | Peak Tensile Stress (N/mm2) | Strain at Peak Stress (%) | Peak Tensile Stress/First Cracking Stress | Strain at 85% of the Peak Stress (%) |
|---|---|---|---|---|---|---|
| Normal ECC | 1.68 | 0.02 | 4.27 | 4.76 | 2.54 | 7.22 |
| RS-ECC-20 grid | 2.21 | 0.08 | 4.75 | 7.00 | 2.15 | 8.22 |
| RS-ECC-12 grid | 2.03 | 0.07 | 4.18 | 5.52 | 2.06 | 6.73 |
| NS-ECC-20 grid | 1.97 | 0.03 | 3.96 | 4.64 | 2.01 | 5.32 |
| NS-ECC-12 grid | 1.88 | 0.02 | 3.86 | 4.78 | 2.05 | 5.88 |
| Mixture ID | Peak Compressive Strength (MPa) | Peak Flexural Strength (MPa) | Mid-Span Deformation at Peak Flexural Strength (mm) |
|---|---|---|---|
| RS-plain-20 grid | 35.91 | 7.55 | / |
| RS-plain-12 grid | 42.50 | 7.43 | / |
| NS-plain-20 grid | 40.91 | 8.87 | / |
| NS-plain-12 grid | 38.66 | 8.86 | / |
| RS-ECC-20 grid | 54.86 | 21.10 | 7.37 |
| RS-ECC-12 grid | 53.65 | 20.65 | 4.45 |
| NS-ECC-20 grid | 74.73 | 24.87 | 3.65 |
| NS-ECC-12 grid | 52.88 | 24.40 | 5.89 |
| Mixture ID | Parameter | Average | Variance |
|---|---|---|---|
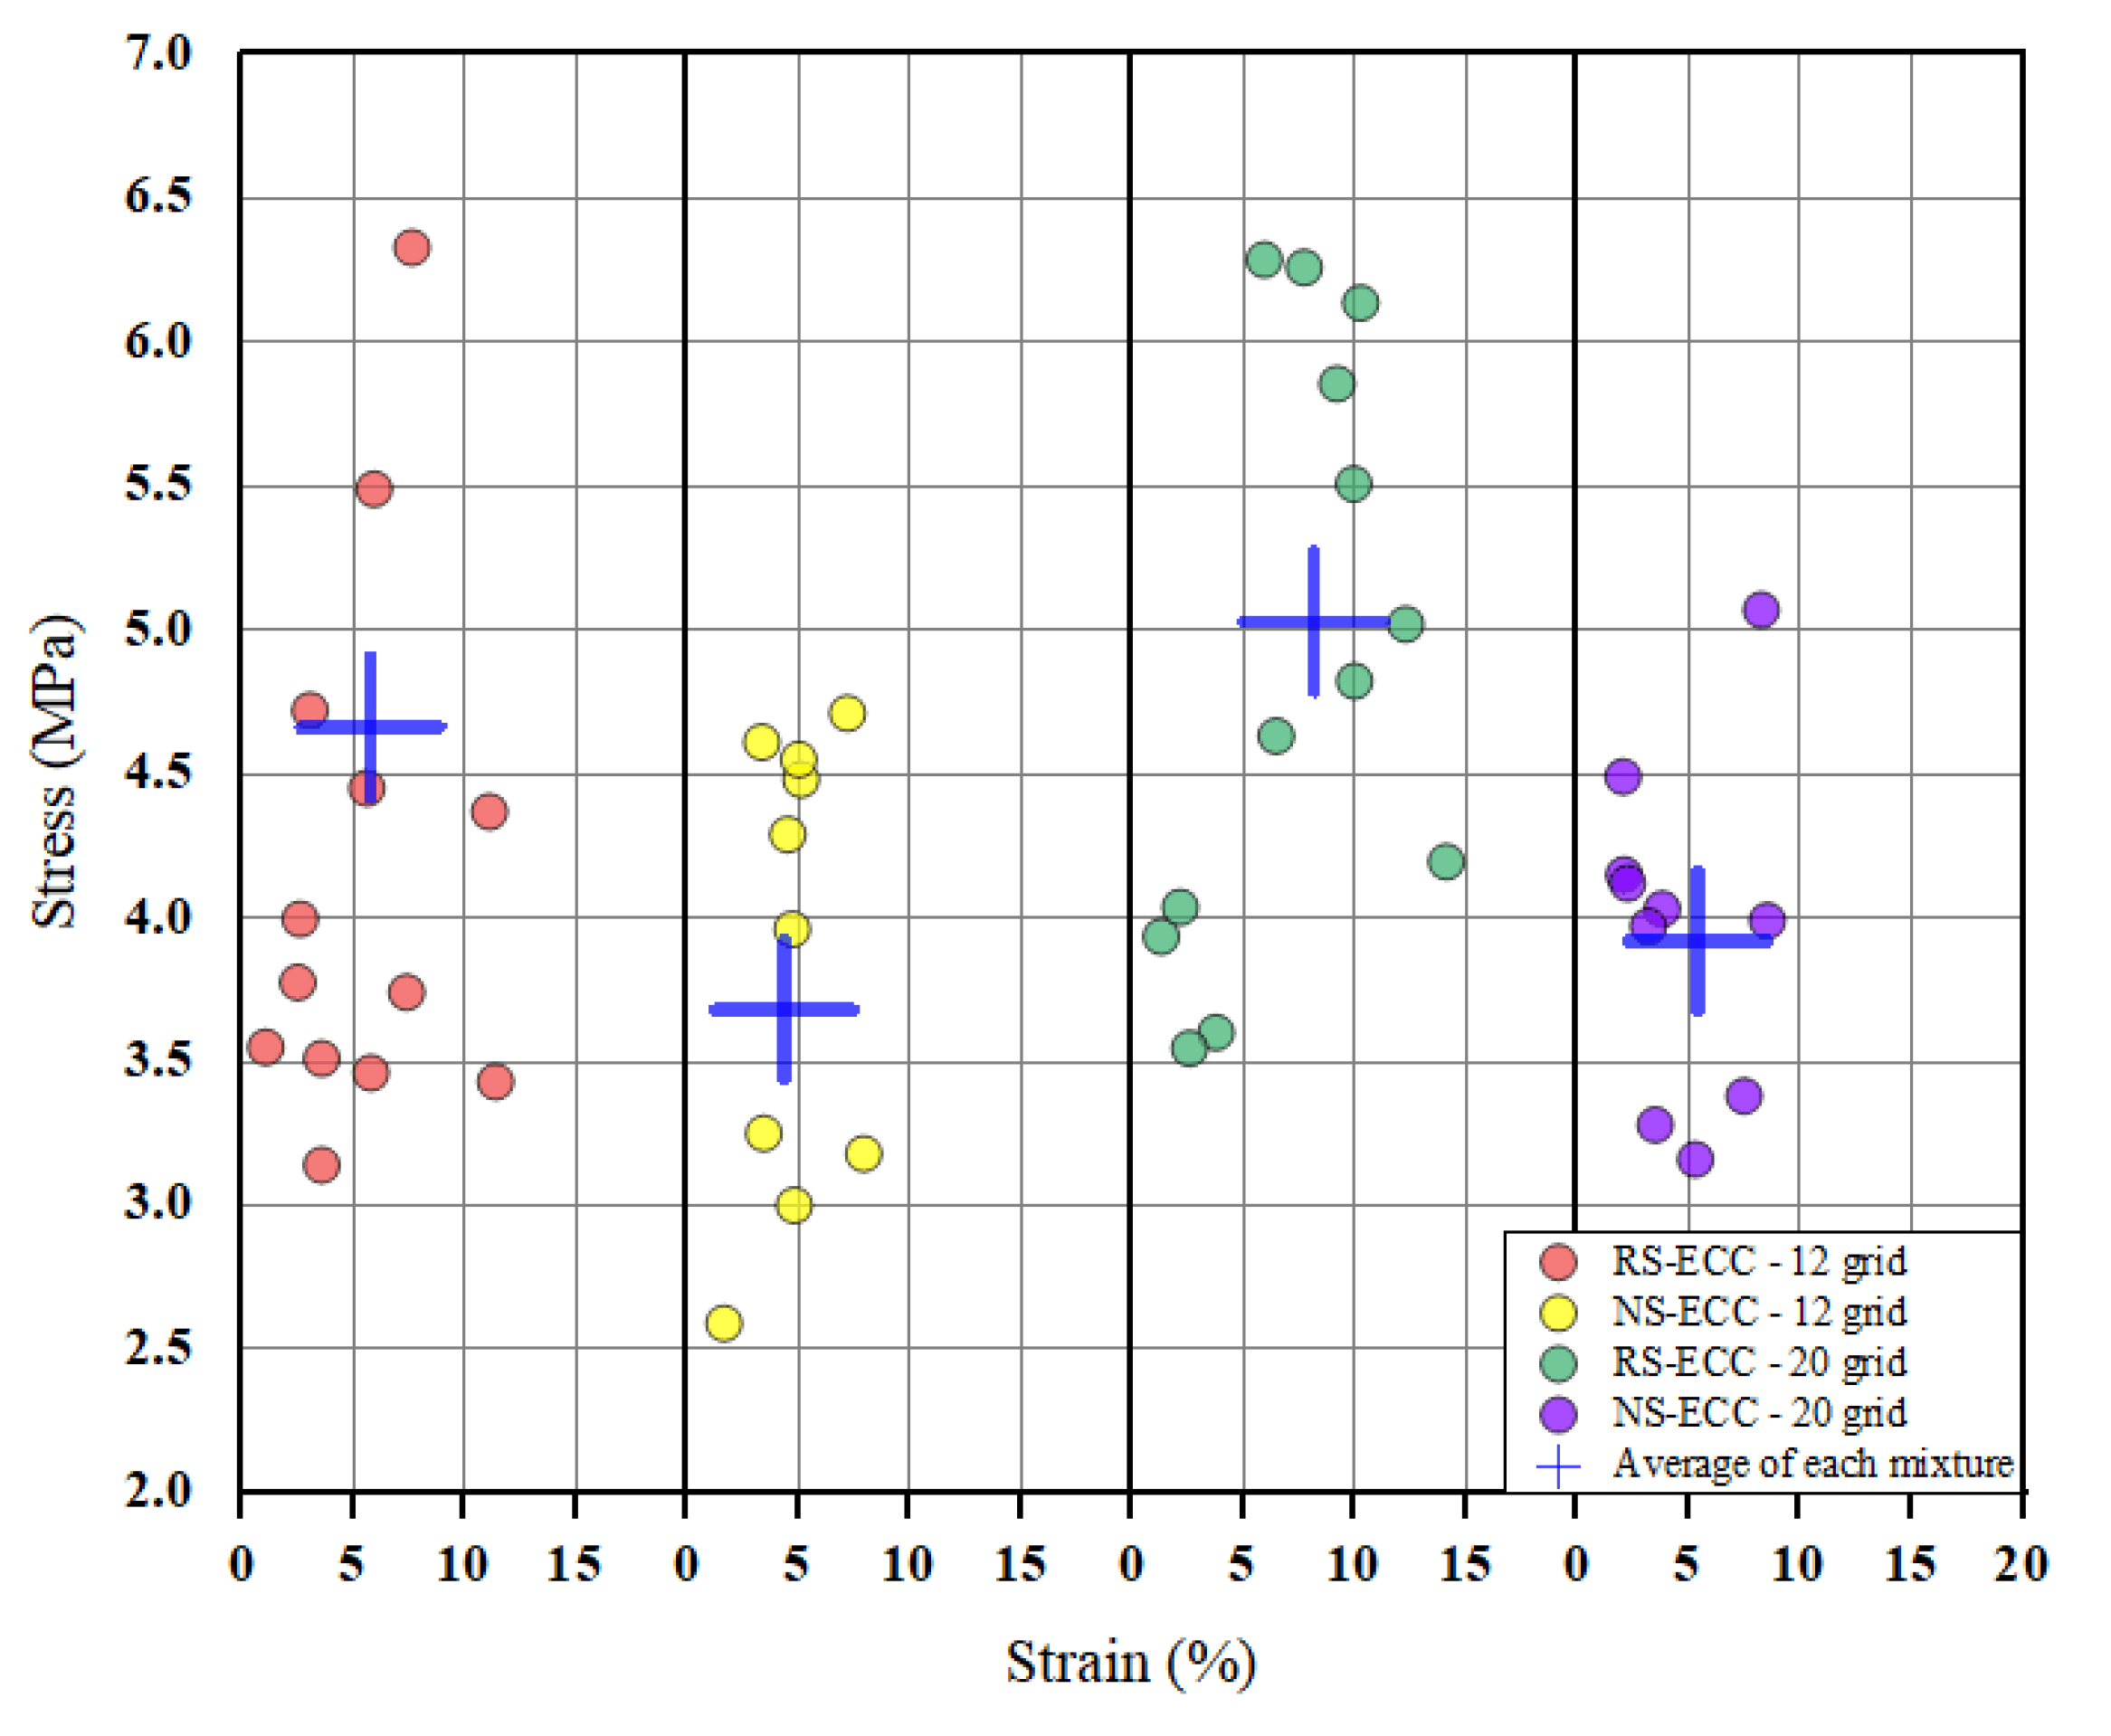
| RS-ECC-20 grid | σOC (Mpa) | 4.32 | 0.12 |
| δB (mm) | 0.81 | 0.07 | |
| RS-ECC-12 grid | σOC (Mpa) | 5.02 | 0.45 |
| δB (mm) | 0.73 | 0.05 | |
| NS-ECC-20 grid | σOC (Mpa) | 4.55 | 0.18 |
| δB (mm) | 1.08 | 0.14 | |
| NS-ECC-12 grid | σOC (Mpa) | 5.03 | 0.24 |
| δB (mm) | 0.65 | 0.00 |
| Mixture ID | Specimen | Mass (kg) | Peak Load FQ (kN) | Fracture Toughness KQ (MPa·m1/2) | Fracture Energy Jtip (J/m2) |
|---|---|---|---|---|---|
| RS-plain-20 grid | 1 | 2.02 | 0.55 | 0.43 | 11.44 |
| 2 | 2.10 | 0.44 | 0.34 | 7.29 | |
| 3 | 1.98 | 0.53 | 0.41 | 10.53 | |
| Average | 2.03 | 0.51 | 0.39 | 10.99 | |
| RS-plain-12 grid | 1 | 2.02 | 0.45 | 0.35 | 7.47 |
| 2 | 2.01 | 0.52 | 0.40 | 9.96 | |
| 3 | 1.98 | 0.45 | 0.35 | 7.44 | |
| Average | 2.00 | 0.52 | 0.36 | 8.29 | |
| NS-plain-20 grid | 1 | 2.06 | 0.63 | 0.50 | 14.92 |
| 2 | 2.15 | 0.67 | 0.52 | 16.92 | |
| 3 | 2.09 | 0.69 | 0.53 | 17.68 | |
| Average | 2.10 | 0.67 | 0.51 | 16.51 | |
| NS-plain-12 grid | 1 | 2.07 | 0.59 | 0.46 | 12.96 |
| 2 | 2.13 | 0.59 | 0.46 | 12.96 | |
| 3 | 2.10 | 0.62 | 0.48 | 14.27 | |
| Average | 2.10 | 0.60 | 0.47 | 13.40 |
| Mixture ID | Jb′ (J/m2) | Jtip (J/m2) | Jb′/Jtip (PSH) | εt (%) |
|---|---|---|---|---|
| RS-ECC-20 grid | 1552.15 | 10.99 | 141.23 | 8.22 |
| RS-ECC-12 grid | 1668.61 | 8.29 | 201.28 | 6.73 |
| NS-ECC-20 grid | 1597.55 | 16.51 | 96.76 | 5.32 |
| NS-ECC-12 grid | 1585.17 | 13.40 | 118.30 | 5.88 |
Publisher’s Note: MDPI stays neutral with regard to jurisdictional claims in published maps and institutional affiliations. |
© 2022 by the authors. Licensee MDPI, Basel, Switzerland. This article is an open access article distributed under the terms and conditions of the Creative Commons Attribution (CC BY) license (https://creativecommons.org/licenses/by/4.0/).
Share and Cite
Dong, Z.; Tan, Y.; Jian, X.; Yu, J.; Yu, K. The Effect of Recycled Sand on the Tensile Properties of Engineered Cementitious Composites. Sustainability 2022, 14, 13530. https://doi.org/10.3390/su142013530
Dong Z, Tan Y, Jian X, Yu J, Yu K. The Effect of Recycled Sand on the Tensile Properties of Engineered Cementitious Composites. Sustainability. 2022; 14(20):13530. https://doi.org/10.3390/su142013530
Chicago/Turabian StyleDong, Zhifu, Yan Tan, Xiangru Jian, Jiangtao Yu, and Kequan Yu. 2022. "The Effect of Recycled Sand on the Tensile Properties of Engineered Cementitious Composites" Sustainability 14, no. 20: 13530. https://doi.org/10.3390/su142013530
APA StyleDong, Z., Tan, Y., Jian, X., Yu, J., & Yu, K. (2022). The Effect of Recycled Sand on the Tensile Properties of Engineered Cementitious Composites. Sustainability, 14(20), 13530. https://doi.org/10.3390/su142013530