Abstract
Measurement While Drilling (MWD) is an in situ technique for the assessment of ground conditions. It records the drilling parameters of a drilling machine when its drill bit is penetrating into new geomaterials below the bottom of a drill hole. Its penetration rate along drill hole depth, however, has various random variations. Such random variations are inconsistent with the fact that the geomaterials in the ground have piece-wise homogeneity. Many methods have been adopted to filter and normalize the random variations in penetration rate for ground characterization. However, they have not completely resolved the issue and obtained the piece-wise homogeneous distribution of geomaterials in the ground. This paper uses the time-series algorithm of the Drilling Process Monitoring (DPM) technique to remove the random variations in MWD penetration rate. It further obtains the piece-wise constant variations in the newly addressed DPM penetration rate along the drill hole depth. With this algorithm, the DPM penetration rate is consistent with the fact that ground geomaterials have the property of piece-wise homogeneous distribution. Consequently, the piece-wise constant variations in DPM penetration rate can be used to characterize the strength variations in geomaterials along the drill hole depth to substantially upgrade the MWD technique for ground investigation.
1. Introduction
Measurement While Drilling (MWD) is an in situ technique for sub-surface investigation associated with drill hole production in mining engineering [1]. The MWD technique records the drilling parameters of a drilling machine when it is producing new holes in different mines [2]. The drilling machine directly applies both the shear and thrust force to its drill bit and completely crushes the geomaterial in front of the drill bit. As a result, a round hole with diameter of tens to hundreds of millimeters and a depth of several to thousands of meters can be found in soil and rock ground. The drilling parameters recorded by the MWD system can be used to qualify the rock mass and characterize geomaterial strength along the blast hole, which can guarantee the sustainability of the excavation in mines [3,4,5,6].
Segui and Higgins [7] classified the drilling parameters recorded with the MWD device into the following categories. The first category is the measured parameters, including thrust pressure, rotation speed, flushing pressure, pulldown force, and reflected vibration depth of the drill bit in a manner to yield real-time geomaterial properties [8]. The second category is the calculated parameters, including the penetration rate, torque pressure, and SE. The third category is the inferred parameters, including the blastability index (BI) and the comminution index (CI). Many researchers describe the strength of geomaterials along the drill hole using these MWD drilling parameters [9,10,11,12]. It should be noted that the penetration rate is the most important parameter for ground characteristics since it is directly related to the geomaterial strength against the drill bit action [7,13,14]. The change of the penetration rate along drill hole depth produced by MWD has always contained various random variations. Such random variations in the MWD penetration rate clearly violate the piece-wise homogenous or smoothly inhomogeneous distributions of the ground soil and rock materials.
Many attempts have been made to filter and normalize the random variations associated with the MWD penetration rate for accurate ground characterization, but they have been not so successful until now. As stated by Schunnesson [1], the random variations in MWD penetration rate are the major obstacle in analyzing MWD data. Spectral analysis and auto-correlation methods were used to detect the random variations. Digital filters such as moving average filter, median filter, and butterworth filter were also used to remove the unwanted random variations [15]. In particular, Schunnesson [1] suggested a method based on a step-wise normalization of raw drilling data to remove the random variations in penetration rate. He did not achieve a good correlation between penetration rate and standard geomaterial properties. Gui et al. [16,17,18] tried to filter and standardize the random variations in MWD penetration rate and to distinguish soil formation changes. However, they could not remove the abnormal random variations in the MWD penetration rate and could not establish a good correlation between the soil and the drill bit. Rai et al. [13] noted that due to the random variations, the penetration rate of the drill bit alone was incapable of detecting abrupt changes in ground conditions. Li et al. [19] stated that “At present, the most serious challenges and obstacles are accuracy and reliability in concluding the relations between rock properties and drilling data in MWD technologies.” Then, they concluded that “Consequently, drilling parameters are often lacking a discernible pattern. It is therefore difficult to use them for quantitative analysis. It is more difficult to estimate rock properties from drilling parameters quantitatively and precisely.” Eldert et al. [20] stated that the erroneous data are caused by the nature of the drilling process and that sensor errors must be removed by setting rounded filter limits. Katherine and Arman [21] trained a Gaussian process (GP) model to clean MWD data and identify the stratigraphic boundaries. However, some incorrect boundary identifications may occur due to noise in MWD data.
Yue et al. [22,23,24,25,26,27,28,29] found that the main reason for random variations in MWD penetration rate is caused by the preselected depth advancement increment method. The MWD penetration rate is equal to the preselected depth interval divided by the corresponding total drilling time. However, the total drilling time corresponding to each preselected depth interval contains the net drilling time and the non-drilling time for the auxiliary operations, such as adding and connecting drill rods. Due to this, extremely random variations and/or errors in the MWD penetration rate and other drilling parameters take place during the non-drilling time for auxiliary operations. In addition to that, the different preselected depth intervals are another factor that may result in different variations in the penetration rate even under the same ground conditions. Geomaterials at preselected depth intervals may have different properties and structures, resulting in random variations in penetration rate when encountering abrupt changes along the drill hole. For instance, the previous studies have the preselected depth advancement increments of 5 mm [16,30], 10 mm [31,32], 50 mm [2], and 100 mm [1].
This paper aims to address the random variations in MWD penetration rate with the DPM algorithm, and then determine the spatial distribution of geomaterial strength along the drill hole depth. The DPM algorithm used in this paper adopts the time-series algorithm to convert the actual MWD depth-series data (where the drilling parameters vary with drill hole depth) into DPM time-series data (where the drilling parameters vary with the total drilling time). Then, the net drilling process is obtained after the time for auxiliary operation is removed. The newly addressed penetration rate is calculated from the curve of the net drilling time versus drill bit depth, which exhibits piece-wise constant change along the drill bit depth. Consequently, the DPM penetration rate is consistent with the fact that the ground soil and rock materials have the property of piece-wise homogeneous distribution. On this basis, the variations in piece-wise homogeneity along the drill hole are further studied to obtain a classification of geomaterial strength.
2. The MWD Technique and Its Penetration Rate with Random Variations
2.1. Hydraulic Crawler Drilling Machine
The MWD data used to illustrate the process of the DPM algorithm was measured and recorded by an MWD system equipped with a hydraulic crawler drilling machine. The hydraulic crawler drilling machine was used to drill holes in soil and rock ground. It consists of two parts. One part is the self-propelled walking track part. It is composed of a propulsion device, dynamic hydraulic system, hydraulic tank, fuel tank, drill frame joint components, and control console. The second part is the drilling equipment part, composed of drill frame, power head, reel assembly, and holder assembly. The hydraulic crawler drilling machine has a very low sound emission level due to its sound-absorbing material and oil heat exchangers. Thus, the overall noise and vibration levels can be reduced significantly during drilling.
2.2. MWD Penetration Rate and Its Random Variations with Depth
The MWD device was installed onto a hydraulic crawler drilling machine. It has an LVDT transducer located at the top of the drilling mast to measure the power head forward and backward movement, and electrical sensors attached to the rotation head of the drill bit to measure the two liquid pressures in the relevant pipes as well as the rotation speed of the drill rod. The two liquid pressures are used to apply the thrust pressure and torque pressure to the drill bit via the connected drill rods. Consequently, the drill bit can break and remove the soil and rock at the bottom of the drill hole. The MWD device can output the data of the drilling parameters along the hole depth. An example is shown in Figure 1.
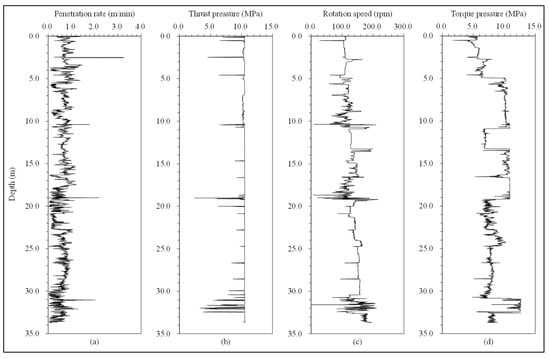
Figure 1.
MWD data of the (a) penetration rate calculated by preselected method, (b) thrust pressure recorded by thrust pressure transducer, (c) rotation speed recorded by rotation transducer, and (d) torque pressure recorded by torque transducer with respect to drill hole depth.
Specifically, Figure 1a shows the changes in the penetration rate with the drill hole depth. Figure 1b–d shows the changes in thrust pressure, rotation speed, and torque pressure along the drill hole depth, respectively. The MWD data analysis software generally calculates the penetration rate from the time divided by preselecting the depth advance increment. The penetration rate, , obtained from MWD technique is calculated by Equation (1) [33]:
where represents the average value of the penetration rate in a preselected depth sampling interval with the -th sampling time. The subscript , and is the last sampling time for penetrating at the completion of a drill hole. is the preselected depth sampling interval, equal to around 2 cm in this paper. is the measured total time corresponding to the process of drilling at preselected depth sampling intervals.
2.3. Random Variations in MWD Data with Depth
The typical output data in Figure 1 show a high level of random variation in the penetration rate (Figure 1a), with a lower level of random variation in torque pressure (Figure 1d) and rotation speed (Figure 1c), and even lower in thrust pressure (Figure 1b). Random variations are the main reason that the industry has merely scratched the surface of the MWD technique. In this paper, we use the coefficient of variation (CV) to illustrate the random variation (dispersion) of the drilling parameter. The CV is defined to show the dispersion of variations relative to the population mean on different interval scales; its value is equal to the ratio of the standard deviation to the mean value. The higher the CV, the greater the level of random variation (dispersion).
Penetration rate is a significant performance parameter when using MWD drilling parameters for ground characteristics. Figure 1a shows the variations in penetration rate with drill hole depth. Such variations exhibit an extremely random manner. The penetration rate has a mean value of 0.567 m/min along the hole depth of 33.707 m. Its standard deviation is 0.300 m/min. The CV of the standard deviation over the mean value is 53.0%. This CV value is extremely high, representing a high level of extremely random variation in the penetration rate.
Figure 1b shows variations in the corresponding thrust pressure along the drill hole depth. The thrust pressure is almost constant along the depth, except when it becomes small at some point. The thrust pressure has a mean value of 10.382 MPa along the hole depth. Its standard deviation is 0.654 MPa. The CV of standard deviation over the mean value is only 6.3%. This CV is extremely small, representing a very low level of random variation in the thrust pressure.
Figure 1c shows variations in the corresponding rotation speed along the drill hole depth. In general, the rotation speed slowly and almost linearly increases as the depth increases, except for rapid changes at some points. The rotation speed of the drill bit has a mean value of 132.720 rpm (round per minute) along the hole depth. Its standard deviation is 24.291 rpm. The CV of the standard deviation over the mean value is 18.3%. This CV value is medium, representing a low level of random variation at this rotation speed.
Figure 1d shows variations in the corresponding torque pressure along the drill hole depth. In general, the main change trend of the torque pressure shows a step function shape as the depth increases. The torque pressure of the drill bit has a mean value of 8.514 MPa along the entire hole depth. Its standard deviation is 1.894 MPa. The CV of the standard deviation over the mean value is 22.2%. This CV value is high but much lower than the CV value of the penetration rate. Furthermore, if the step function is used in the statistical analysis, the CV value can be reduced dramatically. In other words, the torque pressure also shows minimal random variation.
The above evaluation has shown that MWD penetration rate along the depth has much greater variation than those of the thrust pressure, the rotation speed, and the torque pressure of the drill bit. The penetration rate is a measure of the geomaterial strength against and resisting the drill bit loading. For a homogeneous geomaterial, the penetration rate should and/or must be constant if the applied bit loading is constant. Since the applied thrust pressure, torque pressure, and rotation speed show a lower level of variation, the greater level of random variation in the MWD penetration rate violates and is inconsistent with the fact that geomaterials usually have the property of piece-wise homogeneity in the ground. Consequently, the many random variations in the MWD penetration rate must be examined for determining their causes, removing them, and obtaining the true penetration rate. The true penetration rate is highly related to the resistance capability of the geomaterials against the drill bit loading [33]. The higher the geomaterial’s resistance capability, the lower the true penetration rate. The higher the geomaterial’s level of homogeneity, the more constant the true penetration.
3. Addressing Random Variations in MWD Penetration Rate with the DPM Algorithm
3.1. The DPM Method
Yue et al. [22,23] and Yue [24] invented and developed the Drilling Process Monitor (DPM) method. DPM employs a real time-series data analysis algorithm to determine and analyze the true penetration rate and drilling parameters. Consequently, the DPM data can be used accurately, effectively, and objectively to examine and characterize geomaterial strength and discontinuous spatial distribution along the drill hole depth. The algorithm takes the monitored full drilling process and determines the net drilling process for the drill bit purely penetrating into new geomaterials at the bottom of the drill hole, separated from the other operations in the time series. The net drilling process in the time series can be used to characterize the soil and rock geometrical profiles and assign zones. For example, Chen et al. [24] and Chen and Yue [26] distinguished the relatively weak zones and determined the weathering grades of rock mass using the DPM drilling parameters. Li et al. [19] indicated that the DPM technique can identify each type of drilling operation in a real time series and is helpful in identifying the net drilling process and improves the calculation precision without hampering the production operations. Wang et al. [27] further analyzed the digital DPM data and concluded that the DPM technique can upgrade the ordinary drilling machine to become a common ground investigation tool. Wang et al. [14] established regression models of drilling parameters and specific energy and prediction models of uniaxial compressive strength based on DPM parameters, with both showing good results. This paper uses the DPM algorithm to overcome the strong random variation problem associated with MWD penetration rate.
3.2. Replotting MWD Data with the DPM Algorithm
Using the DPM algorithm, the MWD data in Figure 1 have been re-plotted in Figure 2. Figure 2a shows the advancement of the drill bit depth with the drilling time and is a replotting of the variations in the penetration rate with the drill bit depth in Figure 1a. The plots shown in Figure 2b–d are the same as those of Figure 1b–d, respectively. The bit advancement depth at the sampling time can be expressed in Equation (2).
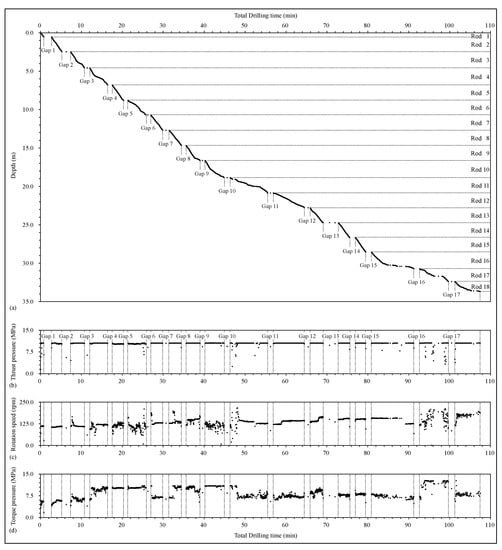
Figure 2.
Further analysis of MWD data with the DPM algorithm using (a) depth, (b) thrust pressure, (c) rotation speed and (d) torque pressure vary with total drilling time (dot plots).
Forward movements during penetration up to a point in time are equal to the sampling depth where the drill bit is penetrating the ground in the hole at the same net time. In this case, the sampling depth is a summation of the sampling depth at the last sampling time and the sampling interval . can be calculated with Equation (3).
where = 0.
From Figure 2a, it can be observed that the advancement of the drill bit depth with the drilling time has seventeen disconnected horizontal segments or gaps (). They could be the depths where adding of a new drill rod took place. The depth intervals between any two adjacent gaps are about 2 m, which is consistent with the constant length of the drill rods. This result demonstrates that the operators added eighteen drill rods (each one 2 m long, added one by one) to form this drill hole.
3.3. Removing the Gaps in the Curve of Bit Depth versus Drilling Time
The seventeen gaps in Figure 2a do not represent the net drilling process of the bit advancing into new geomaterials in the ground below the hole. Therefore, they have to be removed to obtain the curve of bit depth with pure drilling time. For the advancement of each drill rod in Figure 2a, its drilling time can be divided into two parts. One is the pure drilling time and the second is the part of the time for adding and/or connecting drill rods (). To obtain the pure drilling process, each of the time processes () has to be removed, and each of the pure time processes has to be connected directly. Accordingly, the pure drilling process of the eighteen drill rods can be identified and isolated accurately. This elimination of the time process of adding/connecting drill rods can reduce the source of some random variations in the MWD penetration rate. The random variations in thrust pressure, rotation speed, and torque pressure during the auxiliary operation of adding/connecting drill rods () are removed.
In summary, the original total time in Figure 1a and Figure 2a for completing the drill hole of 33.707 along with the eighteen drill rods is 107.661 min. The original total time includes 74.174 min for the pure advancement of the drill bit into new geomaterials and 33.487 min for the auxiliary operation of adding and connecting the eighteen drill rods.
3.4. DPM Penetration Rate from Linear Zone Analysis
After having eliminated the auxiliary operation time () associated with the MWD data, the advancement of the drill bit depth with the pure or net drilling time can be plotted (Figure 3). It can be clearly observed from Figure 3 that the curve of the drill bit depth with the net drilling time consists of many linear segments. Each linear segment has one almost constant gradient or slope. This slope can represent the constant penetration rate of a homogeneous geomaterial zone [22,23,24,25,26,27,28]. For each linear segment in the curve, the constant gradient or penetration rate can be calculated using least squares regression analysis with Equations (4) and (5) [22]:
where and are two constant coefficients. Specially, is the gradient of the curve and equal to the constant (true) penetration rate for each homogeneous zone. is the depth from the regression analysis at the net drilling time for a linear segment, where the subscript . In addition, is the coefficient of linear correlation. The coefficient for eighteen linear correlation estimations are all larger than 0.99. It can be concluded that there is a very clear linear relationship between drill bit depth and net drilling time of each zone.
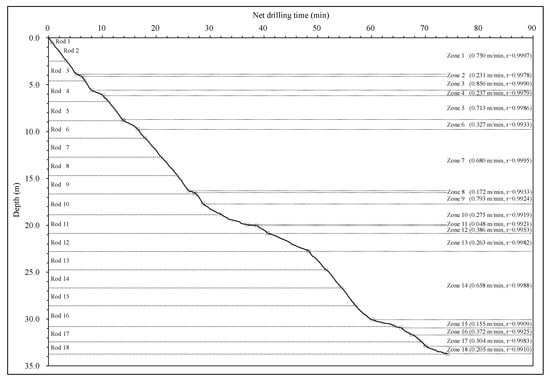
Figure 3.
Curve of drill bit depth versus net drilling time for homogeneous geomaterial zones with constant penetration rates.
The results of linear regression analysis are also presented in Table 1. A total of eighteen homogeneous geomaterial zones can be identified, with thickness ranging from 0.103 m to 7.299 m. Each homogeneous zone has a constant penetration rate, changing from 0.048 m/min to 0.856 m/min.

Table 1.
Summary of statistical results for DPM penetration rate and MWD penetration rate.
3.5. Comparison between MWD and DPM Penetration Rates
Figure 4 and Table 1 compare the MWD penetration rate and the DPM penetration rate. Figure 4a shows that the MWD penetration rate has strong random variations with depth. Figure 4c shows that the DPM penetration rate has step function-shaped variations, i.e., piece-wise constant penetration rates with depth. Such a piece-wise constant penetration rate with depth is consistent with the fact of piece-wise homogeneity of geomaterials in the ground. Figure 4b shows the mean MWD penetration rate for each of the eighteen linear zones along the depth, which can differ from that of the DPM penetration rate for that zone. Figure 4d shows their percentage differences using Equation (6).
where is the penetration rate calculated by the DPM algorithm for that zone. is the mean value of MWD penetration rate for each zone.
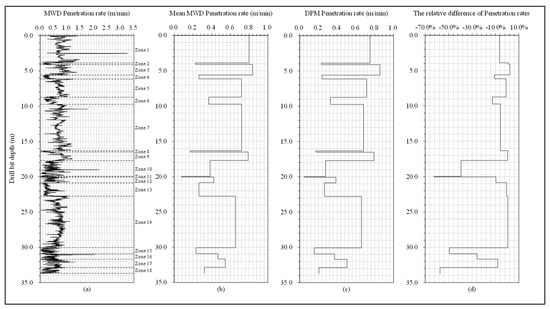
Figure 4.
Variations in (a) MWD penetration rate calculated by preselected method, (b) Mean MWD penetration rate based on zoning results, (c) DPM penetration rate based on DPM algorithm and (d) the relative difference between MWD and DPM penetration rate along the drill hole depth.
The Table 1 shows that the higher the coefficient of variation, the greater the random variation (dispersion), and the greater the random variation, the larger the absolute relative difference between DPM and MWD penetration rates. We take the absolute largest difference in zone 11 and the absolute smallest difference in zone 3 as examples to illustrate the observation. It is obvious that the coefficient of variation for MWD penetration rate in zone 11 (with −62.5% difference) is much higher than zone 3 (with 2.3% difference). This directly results in the absolute relative difference of penetration rate in zone 11 (with 62.5% absolute % difference) being much larger than zone 3 (with 2.3% absolute % difference).
3.6. Reason for the Difference between MWD and DPM Penetration Rates in Each Zone
Figure 5a shows the MWD method and Figure 5b shows the DPM method for zone 3 (with 2.3% difference). The mean MWD penetration rate for zone 3 is 0.836 m/min, a coefficient of variation of 25.8%. The DPM penetration rate is 0.856 m/min, with a coefficient of linear correlation of 0.9990. The level of random variation in the MWD penetration rate is relatively low, and the DPM penetration rate is constant. Hence, the absolute relative difference of penetration rates is low (with 2.3% absolute % difference).
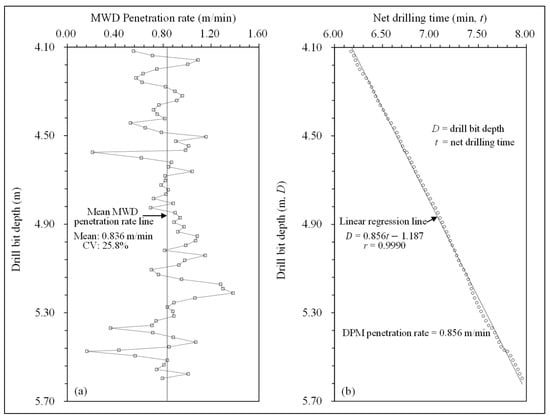
Figure 5.
Comparison of the very different algorithms for (a) MWD penetration rate calculated by preselected method and (b) DPM penetration rate based on DPM algorithm for zone 3.
Figure 6a shows the MWD method and Figure 6b shows the DPM method for zone 11 (with −62.5% difference). The mean MWD penetration rate for zone 11 is 0.078 m/min, with a coefficient of variation of 64.9%. The DPM penetration rate is 0.048 m/min, with a coefficient of linear correlation of 0.9921. The level of random variation in the MWD penetration rate is high, and the DPM penetration rate is constant. Hence, the absolute relative difference of penetration rates is large (with 62.5% absolute % difference).
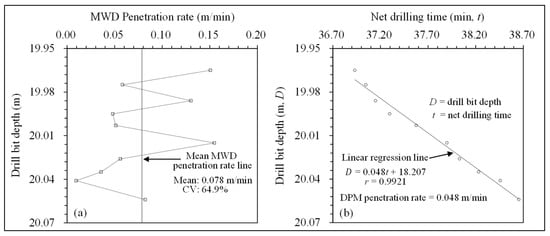
Figure 6.
Comparison of the very different algorithms for (a) MWD penetration rate calculated by preselected method and (b) DPM penetration rate based on DPM algorithm for zone 11.
It is evident that the MWD method defines the penetration rate as the preselected advancement depth interval over the used total time for this amount of bit advancement. It can be considered as an instant penetration rate (or a differentiation method). Any minor variation in the depth interval or the used total time can cause the penetration rate to change greatly. The DPM penetration rate is defined as the slope or gradient of the curve of the bit advancement depth versus the net drilling time. Thus, it is an integration method and can eliminate the minor variations in the depth advancement and the drilling time. Hence, the DPM algorithm can solve and eliminate the high level of random variation in the MWD penetration rate. The random variation in the MWD penetration rate is due to the fact that the drilling machine always has a high level of random vibration during the drilling process. Such vibration is the main source of the high level of random variation in the MWD penetration rate.
4. Further Statistical Analyses and Results for Random Variations in MWD Data
Using the eighteen homogeneous zones from Figure 3 and Figure 4, further statistical analyses of the homogeneous zone thickness, the DPM penetration rate, the MWD penetration rate, thrust pressure, rotation speed, and torque pressure were conducted. The results are listed in Table 1 and Table 2. The following are some of our findings:

Table 2.
Summary of statistical results of three drilling parameters for constant penetration zones.
The thicknesses of homogeneous geomaterial zones determined by the DPM algorithm range from 0.103 m to 7.299 m. Their medium value is 2.591 m. Their mean value is 3.696 m. The standard deviation is 2.616 m. The CV of standard deviation over the mean value of zone thickness is 70.8%. Thus, the ground condition has a considerable level of variation in terms of homogeneous geomaterial zones and their thicknesses along the depth from 0 to 33.707 m.
The values of the DPM penetration rates of the eighteen linear zones vary from 0.048 m/min to 0.856 m/min. The medium value is 0.658 m/min. The mean value is 0.535 m/min. The standard deviation is 0.219 m/min. The CV of the standard deviation over the mean value is 40.9%. Thus, the ground geomaterial has a considerable level of variation in strength along the drill hole of 33.707 m deep.
The DPM penetration rate has been determined from the linear regression in Equations (4) and (5) for each of the eighteen linear zones. The coefficients of the eighteen linear correlations are between 0.9909 and 0.9997. The medium value, mean value, and standard deviation are 0.9986, 0.9971, and 0.0031, respectively. The CV of the standard deviation over the mean value of the coefficients of the eighteen linear correlations is extremely small, equal to 0.3%. The closer the coefficient of linear correlation to the unit (1), the greater the linear correlation for the depth versus net time. Hence, the DPM penetration rate is a constant value for each identified linear zone and represents a homogeneous zone in resisting the bit drilling power.
The mean value of the MWD penetration rate for each of the eighteen homogeneous zones varies between 0.078 m/min and 0.836 m/min. The CV of the mean value over the standard deviation for the MWD penetration rate for each zone varies between 25.2% and 83.5%. Such a high CV further demonstrates the random variations in MWD penetration rate in each of the homogeneous geomaterial zones. Furthermore, the relative difference between the constant DPM penetration rate and the mean MWD penetration rate for each of the eighteen zones varies from −62.5% to 2.3% (Figure 4d). Such a high relative difference in the two penetration rates also demonstrates that the MWD penetration rate has high variations. Such a high level of random variation is mainly caused by the MWD algorithm since each zone has constant resistance to the drilling power.
The mean value of the thrust pressure for each of the eighteen homogeneous zones varies from 9.743 MPa and 10.528 MPa. The CV of the mean value over the standard deviation for the thrust pressure of each zone varies between 0.1% and 13.4%. These data indicate that the thrust pressure is almost constant for each of the eighteen zones.
The mean value of the rotation speed for each of the eighteen homogeneous zones varies from 106.285 rpm to 175.831 rpm. The CV of the mean value over the standard deviation for the rotation speed of each zone varies between 1.9% and 21.9%. These data indicate that the rotation speed is relatively constant for each of the eighteen zones.
The mean value of the torque pressure for each of the eighteen homogeneous zones varies from 5.722 MPa to 12.263 MPa. The CV of the mean value over the standard deviation for the torque pressure of each zone varies between 1.9% and 28.6%. These data indicate that the torque pressure is also relatively constant for each of the eighteen zones.
In total, the CVs for DPM penetration rate, thrust pressure, rotation speed, and torque pressure are 40.9%, 1.6%, 12.8%, and 17.6%, respectively. Compared with the statistical analysis results of original data in Section 2.3, the CVs of the original MWD data are 53.0%, 6.3%, 18.3%, and 22.2% for MWD penetration rate, thrust pressure, rotation speed, and torque pressure, respectively. The random variations are greatly eliminated, and the remaining variations are highly related to the variations in geomaterial strength along the drill hole. The above data analyses show that the DPM algorithm can be applied to the MWD data to resolve the high level of random variation in MWD penetration rate.
5. Using the DPM Algorithm to Profile Geomaterial Strength along the Drill Bit Depth
Deere [34] first proposed Rock Quality Designation (RQD) as a quantitative index for rock quality classification. Cores taken from rock samples are invariably in sticks unless the rock has no joints or fractures. RQD is determined as the sum of core sticks over 100 mm, expressed as a percentage of the total length of core drilled. The MWD data after addressing the random variation by the DPM algorithm can be studied in a similar way to RQD [27]. We first arrange the DPM penetration rate based on the zoning result from the minimum value to the maximum value, and accumulate the corresponding thicknesses with the penetration rate less than a given value. ( ( … ( where . Then, the RQD(VDPM) can be defined as the percentage of the cumulative thickness () corresponding to the DPM penetration rate in a given range over the entire drill bit depth. The Equation is shown below.
where . is equal to 33.707 m in this paper.
In Figure 7, values of DPM penetration rate versus the percentage of DPM thickness with the penetration rate less than a given value are plotted. The vertical axis in Figure 7 stands for the RQD(VDPM) with the DPM penetration rate equal to or less than a given DPM penetration rate along the horizontal axis. Based on its variation pattern, the curve can be divided into the following three strength zones as the DPM penetration rate increases along the horizontal axis. Zone I, with a DPM penetration rate between 0 m/min and 0.263 m/min, is defined as a low DPM penetration rate. Zone II, with a DPM penetration rate between 0.263 m/min and 0.658 m/min, is defined as a medium DPM penetration rate. Zone III, with a DPM penetration rate between 0.658 m/min and 0.856 m/min, is defined as a high DPM penetration rate.
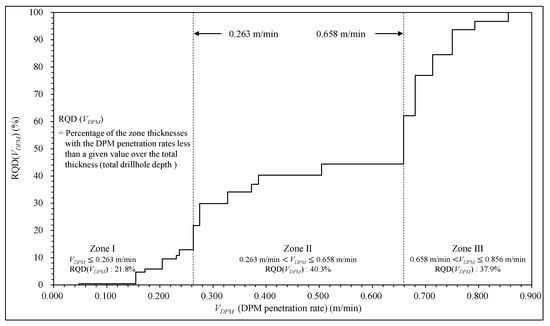
Figure 7.
The curve of RQD(VDPM) with respect to constant penetration rates of homogeneous strength zones.
According to the results from literature reviews and the British and European Standard, the smaller the constant penetration rate, the harder the homogeneous geomaterial zone [22,23,24,25,26,27,28,33,35]. We can conclude that the geomaterial strength of Zone I is generally the largest, followed by Zone II, and the smallest in Zone III. The three dividing RQD(VDPM) values are 21.8%, 40.3%, and 37.9%, respectively, representing the thickness geometry for each strength zone.
6. Conclusions
In this paper, the actual MWD data are used to illustrate the random variation issue, and this issue has been reasonably addressed and eliminated with the DPM algorithm. The results show that the MWD data can contain parts of the operation process of connecting and adding new drill rods. This sub-process of adding rods can be eliminated. The time series data of the pure drilling process with the net drilling time can be obtained. The curve of the bit advancement depth with the net drilling time contains a series of almost linear segments. Each linear segment of the curve has a constant slope or gradient representing its constant penetration rate. When the same drilling rig and drill bit are used to drill a layer of homogeneous material, the penetration rate obtained for this layer is constant. Therefore, each linear segment represents a homogeneous material zone with constant resistance to drill bit loading. The DPM penetration rate exhibits the piece-wise constant change (or step function-shaped change) along the drill hole depth. In total, the variation in constant penetration rate in terms of the strength profile has eighteen zones along the drill bit depth. The smaller the constant penetration rate, the harder the homogeneous geomaterial zone. This result is consistent with the orderly layered and segmented homogeneous law of the geomaterial, which characterizes the relative strength variation in geomaterials along the drill hole depth.
Author Contributions
Conceptualization, S.W. and Z.Q.Y.; methodology, S.W. and Z.Q.Y.; software, S.W.; validation, S.W., X.W., and Z.Q.Y.; formal analysis, S.W., X.W., and Z.Q.Y.; writing—original draft preparation, S.W.; writing—review and editing, S.W. and Z.Q.Y.; All authors have read and agreed to the published version of the manuscript.
Funding
This research was funded by grants from the Research Grant Council of the Hong Kong Special Administrative Region, PR China (Project Nos. HKU 17207518 and R5037-18). The authors also thank CCCC Second Harbour Engineering Company Ltd. for the MWD data.
Institutional Review Board Statement
Not applicable.
Informed Consent Statement
Not applicable.
Data Availability Statement
Available upon request.
Conflicts of Interest
The authors declare no conflict of interest.
References
- Schunnesson, H. Rock characterisation using percussive drilling. Int. J. Rock Mech. Min. Sci. 1998, 35, 711–725. [Google Scholar] [CrossRef]
- Peck, J.; Vynne, J.F. Current status and future trends of monitoring technology for drills. In Proceedings of the International Mining Geology Conference, Kalgoorlie, Australia, 1 May 1993; pp. 311–325. [Google Scholar]
- Ghosh, R.; Schunnesson, H.; Kumar, U. Evaluation of Rock Mass Characteristics Using Measurement While Drilling in Boliden Minerals Aitik Copper Mine, Sweden. In Mine Planning and Equipment Selection, Proceedings of the 22nd MPES Conference, Dresden, Germany, 14–19 October 2013; Springer: Cham, Switzerland, 2014; pp. 81–91. [Google Scholar] [CrossRef]
- Qin, D.D.; Wang, X.F.; Zhang, D.S.; Guan, W.M.; Zhang, L.; Xu, M.T. Occurrence Characteristic and Mining Technology of Ultra-thick Coal Seam in Xinjiang, China. Sustainability 2019, 11, 6470. [Google Scholar] [CrossRef]
- Leung, R.; Scheding, S. Automated coal seam detection using a modulated specific energy measure in a monitor-while-drilling context. Int. J. Rock Mech. Min. Sci. 2015, 75, 196–209. [Google Scholar] [CrossRef]
- Navarro, J.; Sanchidrian, J.A.; Segarra, P.; Castedo, R.; Costamagna, E.; López, L.M. Detection of potential overbreak zones in tunnel blasting from MWD data. Tunn. Undergr. Space Technol. 2018, 82, 504–516. [Google Scholar] [CrossRef]
- Segui, J.B.; Higgins, M. Blast Design Using Measurement While Drilling Parameters. Fragblast 2002, 6, 287–299. [Google Scholar] [CrossRef]
- Smith, B. Improvements in Blast Fragmentation Using Measurement While Drilling Parameters. Fragblast 2002, 6, 301–310. [Google Scholar] [CrossRef]
- Teale, R. The concept of specific energy in rock drilling. Int. J. Rock Mech. Min. Sci. 1965, 2, 57–73. [Google Scholar] [CrossRef]
- Tsoutrelis, C.E. Determination of the compressive strength of rock in situ or in test blocks using a diamond drill. Int. J. Rock Mech. Min. Sci. 1969, 6, 311–321. [Google Scholar] [CrossRef]
- Leighton, J.C. Development of a Correlation between Rotary Drill Performance and Controlled Blasting Powder Factors. Ph.D. Thesis, University of British Columbia, Vancouver, BC, Canada, 1982. Volume 75, pp. 67–73. [Google Scholar]
- Sugawara, J.; Yue, Z.Q.; Tham, L.G.; Law, K.T.; Lee, C.F. Weathered rock characterization using drilling parameters. Can. Geotech. J. 2003, 40, 661–668. [Google Scholar] [CrossRef]
- Rai, P.; Schunesson, H.; Lindqvist, P.-A.; Kumar, U. An Overview on Measurement-While-Drilling Technique and its Scope in Excavation Industry. J. Inst. Eng. 2014, 96, 57–66. [Google Scholar] [CrossRef]
- Wang, S.F.; Tang, Y.; Cao, R.L.; Zhou, Z.L.; Cai, X. Regressive and Big-Data-Based Analyses of Rock Drillability Based on Drilling Process Monitoring (DPM) Parameters. Mathematics 2022, 10, 628. [Google Scholar] [CrossRef]
- Santamarina, J.C.; Fratta, D. Introduction to Discrete Signals and Inverse Problems in Civil Engineering; ASCE Press: Reston, VA, USA, 1998. [Google Scholar]
- Gui, M.W.; Soga, K.; Bolton, M.D.; Hamelin, J.P. Instrumented Borehole Drilling for Subsurface Investigation. J. Geotech. Geoenviron. Eng. 2002, 128, 283–291. [Google Scholar] [CrossRef]
- Gui, M.W.; Hamelin, J.P. Development of an instrumented borehole drilling system for ground investigation. Electron. J. Geotech. Eng. 2004, 9, 350. [Google Scholar]
- Gui, M.W. The Basics of Noise Detection and Filtering for Borehole Drilling Data. Open Civ. Eng. J. 2008, 2, 113–120. [Google Scholar] [CrossRef]
- Li, Z.; Itakura, K.I.; Ma, Y. Survey of measurement-while-drilling technology for small-diameter drilling machines. Electron. J. Geotech. Eng. 2014, 19, 10267–10282. [Google Scholar]
- van Eldert, J.; Schunnesson, H.; Johansson, D.; Saiang, D. Application of Measurement While Drilling Technology to Predict Rock Mass Quality and Rock Support for Tunnelling. Rock Mech. Rock Eng. 2020, 53, 1349–1358. [Google Scholar] [CrossRef]
- Silversides, K.L.; Melkumyan, A. Boundary identification and surface updates using MWD. Math. Geosci. 2021, 53, 1047–1071. [Google Scholar] [CrossRef]
- Yue, Z.Q.; Lee, C.F.; Law, K.T.; Tham, L.G.; Sugawara, J. Use of HKU drilling process monitor in slope stabilization. Chin. J. Rock Mech. Eng. 2002, 21, 1685–1690. [Google Scholar]
- Yue, Z.Q.; Lee, C.F.; Law, K.T.; Tham, L.G. Automatic monitoring of rotary-percussive drilling for ground characterization—Illustrated by a case example in Hong Kong. Int. J. Rock Mech. Min. Sci. 2004, 41, 573–612. [Google Scholar] [CrossRef]
- Yue, Z.Q. Drilling process monitoring for refining and upgrading rock mass quality classification methods. Chin. J. Rock Mech. Eng. 2014, 33, 1977–1996. [Google Scholar]
- Chen, J.; Gao, W.; Yue, Z.Q. Case study of drilling process monitoring from two adjacent holes with Two drills. In Proceedings of the 42nd U.S. Rock Mechanics Symposium (USRMS), San Francisco, CA, USA, 29 June–2 July 2008. [Google Scholar]
- Chen, J.; Yue, Z.Q. Ground characterization using breaking-action-based zoning analysis of rotary-percussive instrumented drilling. Int. J. Rock Mech. Min. Sci. 2015, 75, 33–43. [Google Scholar] [CrossRef]
- Wang, X.F.; Zhang, M.S.; Yue, Z.Q. In-situ digital profiling of soil to rock strength from drilling process monitoring of 200 m deep drillhole in loess ground. Int. J. Rock Mech. Min. Sci. 2021, 142, 104739. [Google Scholar] [CrossRef]
- Wang, X.F.; Peng, P.; Shan, Z.G.; Yue, Z.Q. In situ strength profiles along two adjacent vertical drillholes from digitalization of hydraulic rotary drilling. J. Rock Mech. Geotech. Eng. 2022. In Press. [Google Scholar] [CrossRef]
- Wu, S.Y.; Yue, Z.Q. Time Series Method for Analyzing MWD Data in Evaluation of Ground Conditions. Int. J. Rock Mech. Min. Sci. 2022. under review. Available online: https://papers.ssrn.com/sol3/papers.cfm?abstract_id=4229731 (accessed on 26 September 2022).
- Pfister, P. Recording drilling parameters in ground engineering. Int. J. Rock Mech. Min. Sci. 1985, 18, 16–21. [Google Scholar]
- Fortunati, F.; Pellegrino, G. The use of electronics in the management of site investigation and soil improvement works: Principles and applications, Geotechnical Site Characterization. In Proceedings of the First International Conference on Site Characterization (ISC98), Atlanta, GA, USA, 19–22 April 1998; pp. 359–364. [Google Scholar]
- Garassino, A.; Schinelli, M. Detection of cavities by monitored borehole dirlling (TMD). In Proceedings of the First International Conference on Site Characterization (ISC98), Atlanta, GA, USA, 19–22 April 1998; pp. 365–370. [Google Scholar]
- EN ISO 22476-15; Geotechnical Investigation and Testing—Field Testing. Part 15: Measuring While Drilling. CEN (European Committee for Standardization): Brussels, Belgium, 2016; p. 45.
- Deere, D.U. Technical description of rock cores for engineering purpose. Rock Mech. Eng. Geol. 1964, 1, 17–22. [Google Scholar]
- Patel, A. Characterization of cavities in rocks using drilling parameters. Int. J. Rock Mech. Min. Sci. 2013, 63, 122–130. [Google Scholar] [CrossRef]
Publisher’s Note: MDPI stays neutral with regard to jurisdictional claims in published maps and institutional affiliations. |
© 2022 by the authors. Licensee MDPI, Basel, Switzerland. This article is an open access article distributed under the terms and conditions of the Creative Commons Attribution (CC BY) license (https://creativecommons.org/licenses/by/4.0/).