Article

A Multi-Attribute Decision Support System for Allocation of Humanitarian Cluster Resources Based on Decision Makers’ Perspective

1
School of Business, London South Bank University, London SE1 0AA, UK
2
Cranfield School of Management, Cranfield University, Cranfield MK43 0AL, UK
*
Author to whom correspondence should be addressed.
Sustainability 2022, 14(20), 13423; https://doi.org/10.3390/su142013423
Submission received: 14 September 2022 / Revised: 3 October 2022 / Accepted: 11 October 2022 / Published: 18 October 2022

Abstract

:
The rush of the humanitarian suppliers into the disaster area proved to be counter-productive. To reduce this proliferation problem, the present research is designed to provide a technique for supplier ranking/selection in disaster response using the principles of utility theory. A resource allocation problem is solved using optimisation based on decision maker’s preferences. Due to the lack of real-time data in the first 72 h after the disaster strike, a Decision Support System (DSS) framework called EDIS is introduced to employ secondary historical data from disaster response in four humanitarian clusters (WASH: Water, Sanitation and Hygiene, Nutrition, Health, and Shelter) to estimate the demand of the affected population. A methodology based on multi-attribute decision-making (MADM), Analytical Hierarchy processing (AHP) and Multi-attribute utility theory (MAUT) provides the following results. First a need estimation technique is put forward to estimate minimum standard requirements for disaster response. Second, a method for optimization of the humanitarian partners selection is provided based on the resources they have available during the response phase. Third, an estimate of resource allocation is provided based on the preferences of the decision makers. This method does not require real-time data from the aftermath of the disasters and provides the need estimation, partner selection and resource allocation based on historical data before the MIRA report is released.

1. Introduction

The overall aim of the disaster relief operation is to ensure the survival and health of the maximum possible number of victims [1,2]. This operation is required to benefit the affected community’s development and reduce the vulnerability of the population to future hazards. In the days and weeks immediately following a disaster, the basic relief supplies and services are provided free of charge to save and preserve human lives. This enables families to meet their basic needs for medical and health care, shelter, clothing, water, and food. However, the problem is in the early hours after the disaster strike, there is no official estimate of these needs. The first official UN report of preliminary Multi-Cluster/Sector Initial Rapid Assessment (MIRA) is released three days after the disaster strikes. This present problems as some quick decisions and actions need to be taken in the absence of detailed assessments and lack of appropriate Decision Support Systems (DSS) which may lead to loss of lives amongst others. For example, during the UK flood in 2014, even though good warning systems were in place [3], the lack of decision-making tools, led to the death of seven people and the destruction of 1700 homes. It is critical to understand that these negative effects happened in the presence of the exact knowledge of where and when the storm/flood would strike, in a developed country with a sufficient budget for prevention. Therefore, the lack of DSS in developing countries would be far more devastating. Like other decision-making problems with human elements, the preferences of decision makers also play a role in this resource allocation under uncertainty. The objective of this research is to provide a DSS for partner selection/ranking using only the data available before the release of MIRA report to reduce the partners’ proliferation problem. So, this research addresses two questions: First to what extent is possible to estimate the resources required for humanitarian response operation in the absence of MIRA report within the first three days. Second to what extent is possible to optimise the resource allocation decisions within humanitarian response operation considering the preferences of the decision makers.
The preferences become important when you note that decision makers in disaster affected area, operate based on their background, beliefs, experience, and political views. For example, in some areas where the conflicts are an issue, some decision makers are reluctant towards the use of military relief supplies. Some decision makers due to experience might prefer government or NGO, International or local suppliers, UN or voluntary resources, and so on. To answer the above questions, this research aims to develop a DSS which could optimise the allocation of resources prior to the release of MIRA report and based on the decision makers’ preferences. The DSS includes a framework for need assessment of the affected population to enhance the need-based resource allocation through decision makers’ preferences. In this process, various humanitarian guidelines and official reports were used to argue that it is possible to outline minimum standard requirements for each disaster type and based on the affected countries’ socio-economic characteristics. This estimates a list of requirements in disaster situation for affected population with priorities. This list can be the basis for need-based resource estimates. The estimates then are used to optimize the allocation of the resources available by humanitarian suppliers based on the principles of utility theory and resource-dependency theory. The agent-based optimisation technique which is where all DSS methods above overlap, are in general based on the principles of decision theory Neumann-Morgenstern in the 40s. This allows agents to select decision criteria, evaluate, and compare the options and act upon them. This can be viewed as combination of Utility theory and Probability theory [4]. Decision-making in a disaster situation, in particular fits well within both utility and probability as it is a decision scenario under uncertainty. The literature in this ilk are mainly divided in two branches; Rational choice and Expected utility (EU) and Behavioural and Prospect theory [5]. The former has arisen from mathematical literature, and provides clear formulations, whereas the latter is more practice-based and tries to show the controversies in the Expected utility theory [6]. This research is not an attempt to focus on the challenges facing Utility theory or study how and why decision makers decide the way, they do. The research focused on Utility theory to maximise the preferences of the decision makers who decide based on the reasons out of scope of this research. In fact, the investigation into the reasoning behind their preferences can be the subject of further studies on Prospect theory by other scholars.
This research provides a technique for supplier ranking/selection in disaster response by analysing the archival data, and decision support tools. Using Linear programming optimisation, Analytical Hierarchy processing (AHP) and Multi-attribute utility theory (MAUT) a DSS is developed based on secondary data. The DSS includes Phase1-ESTIMATION of the need in four humanitarian clusters (WASH, Nutrition, Health and Shelter). This will be the basis for estimating the demand of the affected population. Phase 2-OPTIMISATION selects the set of suppliers (and their resources) based on the decision maker’ preferences. Using the AHP technique, a matrix of hypothetical decision makers’ preferences is built and used to find the value of each supplier in the eye of the decision maker. The Significance of EDIS is that despite using numerical data, it does not require data gathering at the time of the disaster and uses historic data. EDIS can be complementary to existing methods for task allocation and scheduling techniques in disaster management, as a quicker data feed. This research also provides an insight into decision-making to reduce the uncertainty based on the principles of resource- dependency theory and through collaboration, as the most suitable group of suppliers are selected to share their resources based on the optimisation technique using the principles of the utility theory. Methodological contribution is a design to simulate the decision-making under uncertainty by taking into account the opinion of human agents (decision maker). It also uses mathematical optimisation in addition to the opinion of human agents, which integrates the heuristic and mathematical approaches of decision-making. It also bridge the gap in needs prioritisation by providing numerical priorities. Practical contribution is that by providing a range of it enables the decision maker to decide based on their budget limitations and personal preferences. It also gives different humanitarian organisations the chance to customise the model using their own database if required.
The structure of the paper is organised as follows. We present a literature review followed by an elaboration of data sources. The method is then outlined where input and output are provided. The results section expands on input/output and provides details of the optimization through AHP. The process of collecting the preferences of the decision makers through a questionnaire is outlined and then the ranking of the suppliers through MAUT is provided. The discussion outlines the answers to the research questions, elaborates the contribution and then presents the limitations and the future research directions.

2. Literature Review

The present research addresses the partner proliferation problem in disaster response networks as one of the most recurring problems in humanitarian operations. The existing experiences of failure in disaster management operations in large-scale disasters, signals the necessity to investigate an effective disaster relief management, which is successful in minimising the negative effects of the disasters [7] specifically with the focus on reducing the problem of partner proliferation. Due to counterproductive effects of this phenomenon on the whole disaster relief operation, the quality of response is damaged [8]. The proliferation of actors is induced due to the extreme requirements of the disaster which forces to mobilise and recover all the available sources [9] and therefore all available partners are encouraged to participate.
The negative effect of this reactionary response [10] is twofold. First, the mandatory growth in the relief budget in the public sector (UN, Red Cross and governments) as well as the fund raising by the private sector (such as NGOs) exceeds the absorption capacity of an overstretched humanitarian industry. This pushes the inexperienced actors including the public image seeking companies into activities outside their area of expertise [11,12]. This situation leads to the oversupply of uncoordinated and inexperienced partners [13]. This rush of all available partners creates a range of partners from competent and incompetent, reputable and disreputable, opportunistic and committed, well-established and just-formed in addition to individuals, tourists and also companies which aim to generate a favourable public image, to increase their long-term profit. They enter the disaster-effected area in a chaotic pattern and cause the proliferation problem 
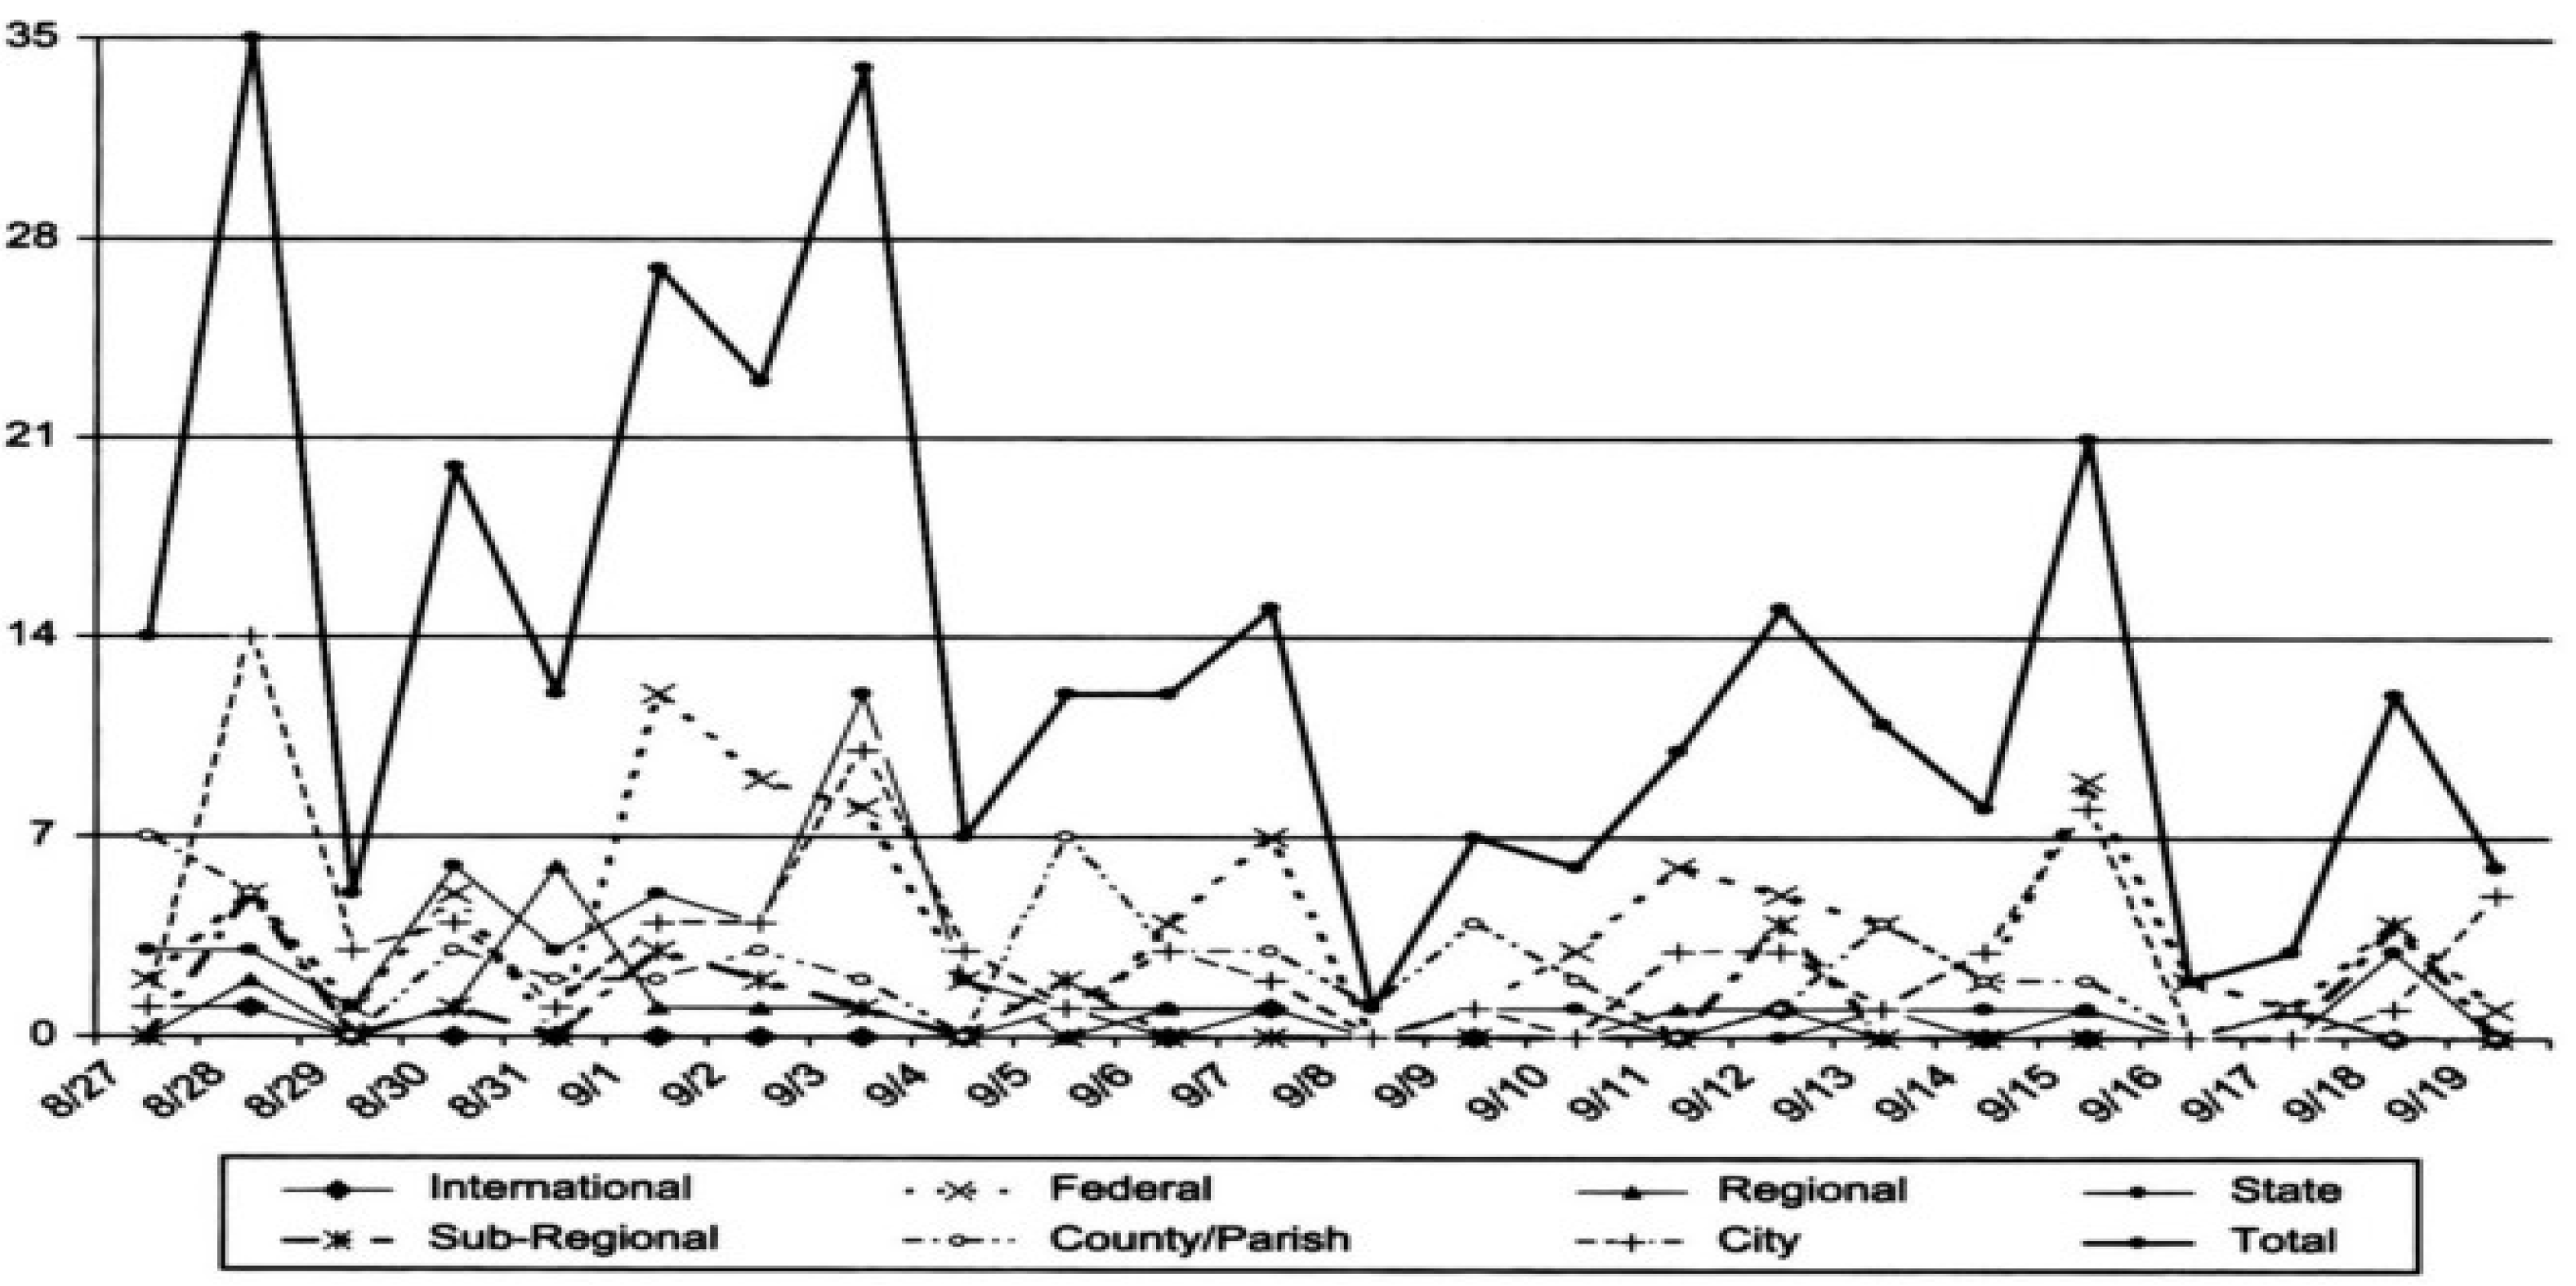
Figure 1. This as mentioned before, results in the budget stretch leading to the oversupply of a range of heterogeneous uncoordinated and inexperienced partners [13].
Figure 1 shows the chaotic pattern of partners’ rushing into the affected area of Hurricane Katrina. This increases the load on the affected populations, local authorities, and coordination structures for information or services. It also increases the costs due to replicated offices and overheads, produces a counterproductive duplication and confusion of efforts, and leads to competition between agencies for donations, facilities, and publicity.
The second negative effect of proliferation is the increase in the risks of inappropriate aid, due to the time pressure of competition and the rush for publicity. This increases the risk to the quality of the response and reputation of the humanitarian community through the actions of inexperienced or irresponsible agencies and damages the quality of the responses [8]. The damage is enhanced by the fact that this wasted effort could be used instead to take advantage of the capabilities of the partners within the network and creates competition between the agencies over funding [11,14]. The study suggests that one of the reasons for failure in disaster relief network lies in the incompatibility of the disaster relief situation with the existing collaborative structures used for managing the response operation.
The uncertainty and the lack of information [15] together with damaged infrastructure [16] unequal and ineffective distribution of demand and supply and their respective fluctuations [9,17], unsteady flow of the financial resources obtained by fund-raising from occasional donors [18] all make the planning and long-term outlook almost impossible. Additionally, long-term approaches in practice are usually profit-based whilst in disaster situations the non-financial factors such as the time value of commodities are much greater than the costs associated [18,19], which make the conventional profit-based values less accurate. Therefore, due to the lack of control and information in disaster situations, the existing structures such as supply chains or project-based collaborations might fall short in practice because these structures require a certain amount of knowledge about the supply, demand, timing, costs, etc. which are generally unknown in disaster situations.
This research proposes restructuring the relief network to accommodate the characteristics of the disaster situation to work with the minimum data available and without much pre-planning. The negative impacts of proliferation can be reduced if the partners are carefully selected according to the requirements of each particular disaster to make sure the interaction between heterogeneous partners does not have a counterproductive effect. An efficient operation needs to be supported with a suitable selection of partners who work together efficiently and guarantee the success of collaboration. The current study builds upon empirical research carried out in the field of decision making in disaster response operations as a response to calls [20] stating that an optimal network structure to assist in resolution of disasters is yet to be developed.
Dealing with the proliferation problem in a disaster situation falls under the heading of Decision Support Systems (DSS) in disaster situation [10,21]. The current literature mostly utilises DSS borrowed from logistics or production management studies into the disaster decision. The resource allocations generally include criteria-based optimisations. This criteria could include tangible characteristics of the resources including their location [22,23], Facilities [24], price [25], time [26,27,28,29], due date [30,31,32,33]. These are based on a fully informed decision environment and are time consuming to calculate or use complicated software and database which might not be available at the time of the disaster.
For example, task and resource allocation based on request from the aid centres assuming the data are available and reliable with no mention of the gap between the disaster strike and the data release [34]. They also are mostly based on the established distribution centres and fail to consider the ad hoc centres. The similar research considers community-based DSSs which tests all variations of the aid team to find the best [35] this trial and error is time consuming and there is no guarantee that the teams keep their members, performance and dynamic.
Others investigate distribution of resources [36,37], scheduling of supply chain for the delivery of resources [38], using genetic algorithms [39] integer linear programming in [40] to minimize the transportation cost, reinforcement learning [41] or MCDM to enhance the operational effectiveness of humanitarian activities [42]. The relief urgency index [43] using time-varying demand, population density, vulnerable population, damage, and last delivery to improve the relief distribution, fails to include the weight and the scalability of above factors. Other tools include stochastic optimization techniques knowing the exact number of national resources [44], using Nash equilibrium [45,46].
Other DSS rely on characteristics of the suppliers instead of resources. This could include measurable characteristics of the suppliers such as their attributes [26,47,48,49], partners’ goal achievement probabilities [50] and performance indicators [51]. We argue that these criteria, although useful for planning and mitigation phases of disaster, are unsuitable for a disaster response due to the scarcity of data and time pressure associated with the disaster situation.
Additionally, regardless of the characteristics of the resources and/or suppliers, the decisions made by humans during disaster response, are highly affected by their preference. This has been addressed in few papers including risk preferences of decision makers [52], deep learning in resource prioritisation [53], mathematical models for resource optimisation based on community values in mitigation phase of disaster in few African countries [54], policy based resource optimisation for response [55]. The above criteria are often combined with mathematical optimisation techniques including AHP [56,57,58,59], Multi-attribute decision making under uncertain conditions [60,61,62,63,64,65], linear programming [10,66,67,68] and rule-based techniques [22], case-based reasoning [69] and spatial modelling of the resources [70]. It is noteworthy to mention this is a review of static models and dynamic models such as relief delivery models and route optimisations [71] or workflow modeling are not the focus of this research.
Based on the argument above, the research focuses on the partner selection in disaster situations as a solution to the partner proliferation problem. However, although a huge body of literature exist on the “how to restructure the selected partners”, these approaches face a serious problem of duplication of efforts and the counterproductive effect of the operations during the disaster response operation. The existing research on this area mainly focuses on preparation, mitigation, and recovery phases by suggesting various long-term collaborative structures such as supply chains [72,73,74,75]. The problem arises from the high state of uncertainty in the response phase due to the temporary and urgent nature of the aid required, and the chaotic nature of disaster strike. This uncertainty affects the available data required for planning [15], the stream of financial resources [18] and unknown and fluctuating, supply and demand [9,15,17]. Due to the scarcity of the date before the release of MIRA report, this article develop a decision making framework (EDIS) for selecting suitable partners by reviewing the records of natural onset disasters, which have happened worldwide since 1980, and their data are available in various humanitarian databases (Emdat.be, 2014; Munichre.com, 2014;ReliefWeb, 2014; Gdacs.org, 2014). EDIS ultimately deals with the proliferation problem by ranking and selecting the most suitable partners based on the principals of the Decision theory and Resource-based theory.
The significance of this research is that in addition to dealing with the primary problem of the research (proliferation problem), it provides a framework for estimation of the needs, and resource optimisation through the allocation of the resources to the needs during the disaster response operation. This framework is noteworthy because currently the first official report of the disaster effects is released 72 h after the disaster strikes leading to a three-day gap between the decisions about the distribution of aid, and obtaining information about the actual needs amongst the affected population. The EDIS framework in this sense is an attempt to cover this gap by using the data available at the time of the disaster striking. This characteristic is also helpful because when a disaster strikes in many areas the people who decide about the allocation of the resources, are not trained in the field of decision making or logistics. Instead, they happen to be in the disaster-affected area before experts arrive, and this framework could help them to make decisions using historic data and without the use of any complicated software, only excel sheets.

3. Data

Various scholars and humanitarian organisations categorise the criteria or requirements in the response operations. The preliminary review identified myriads of criteria [2,20,76,77,78,79]. The list of these criteria of requirements is presented in
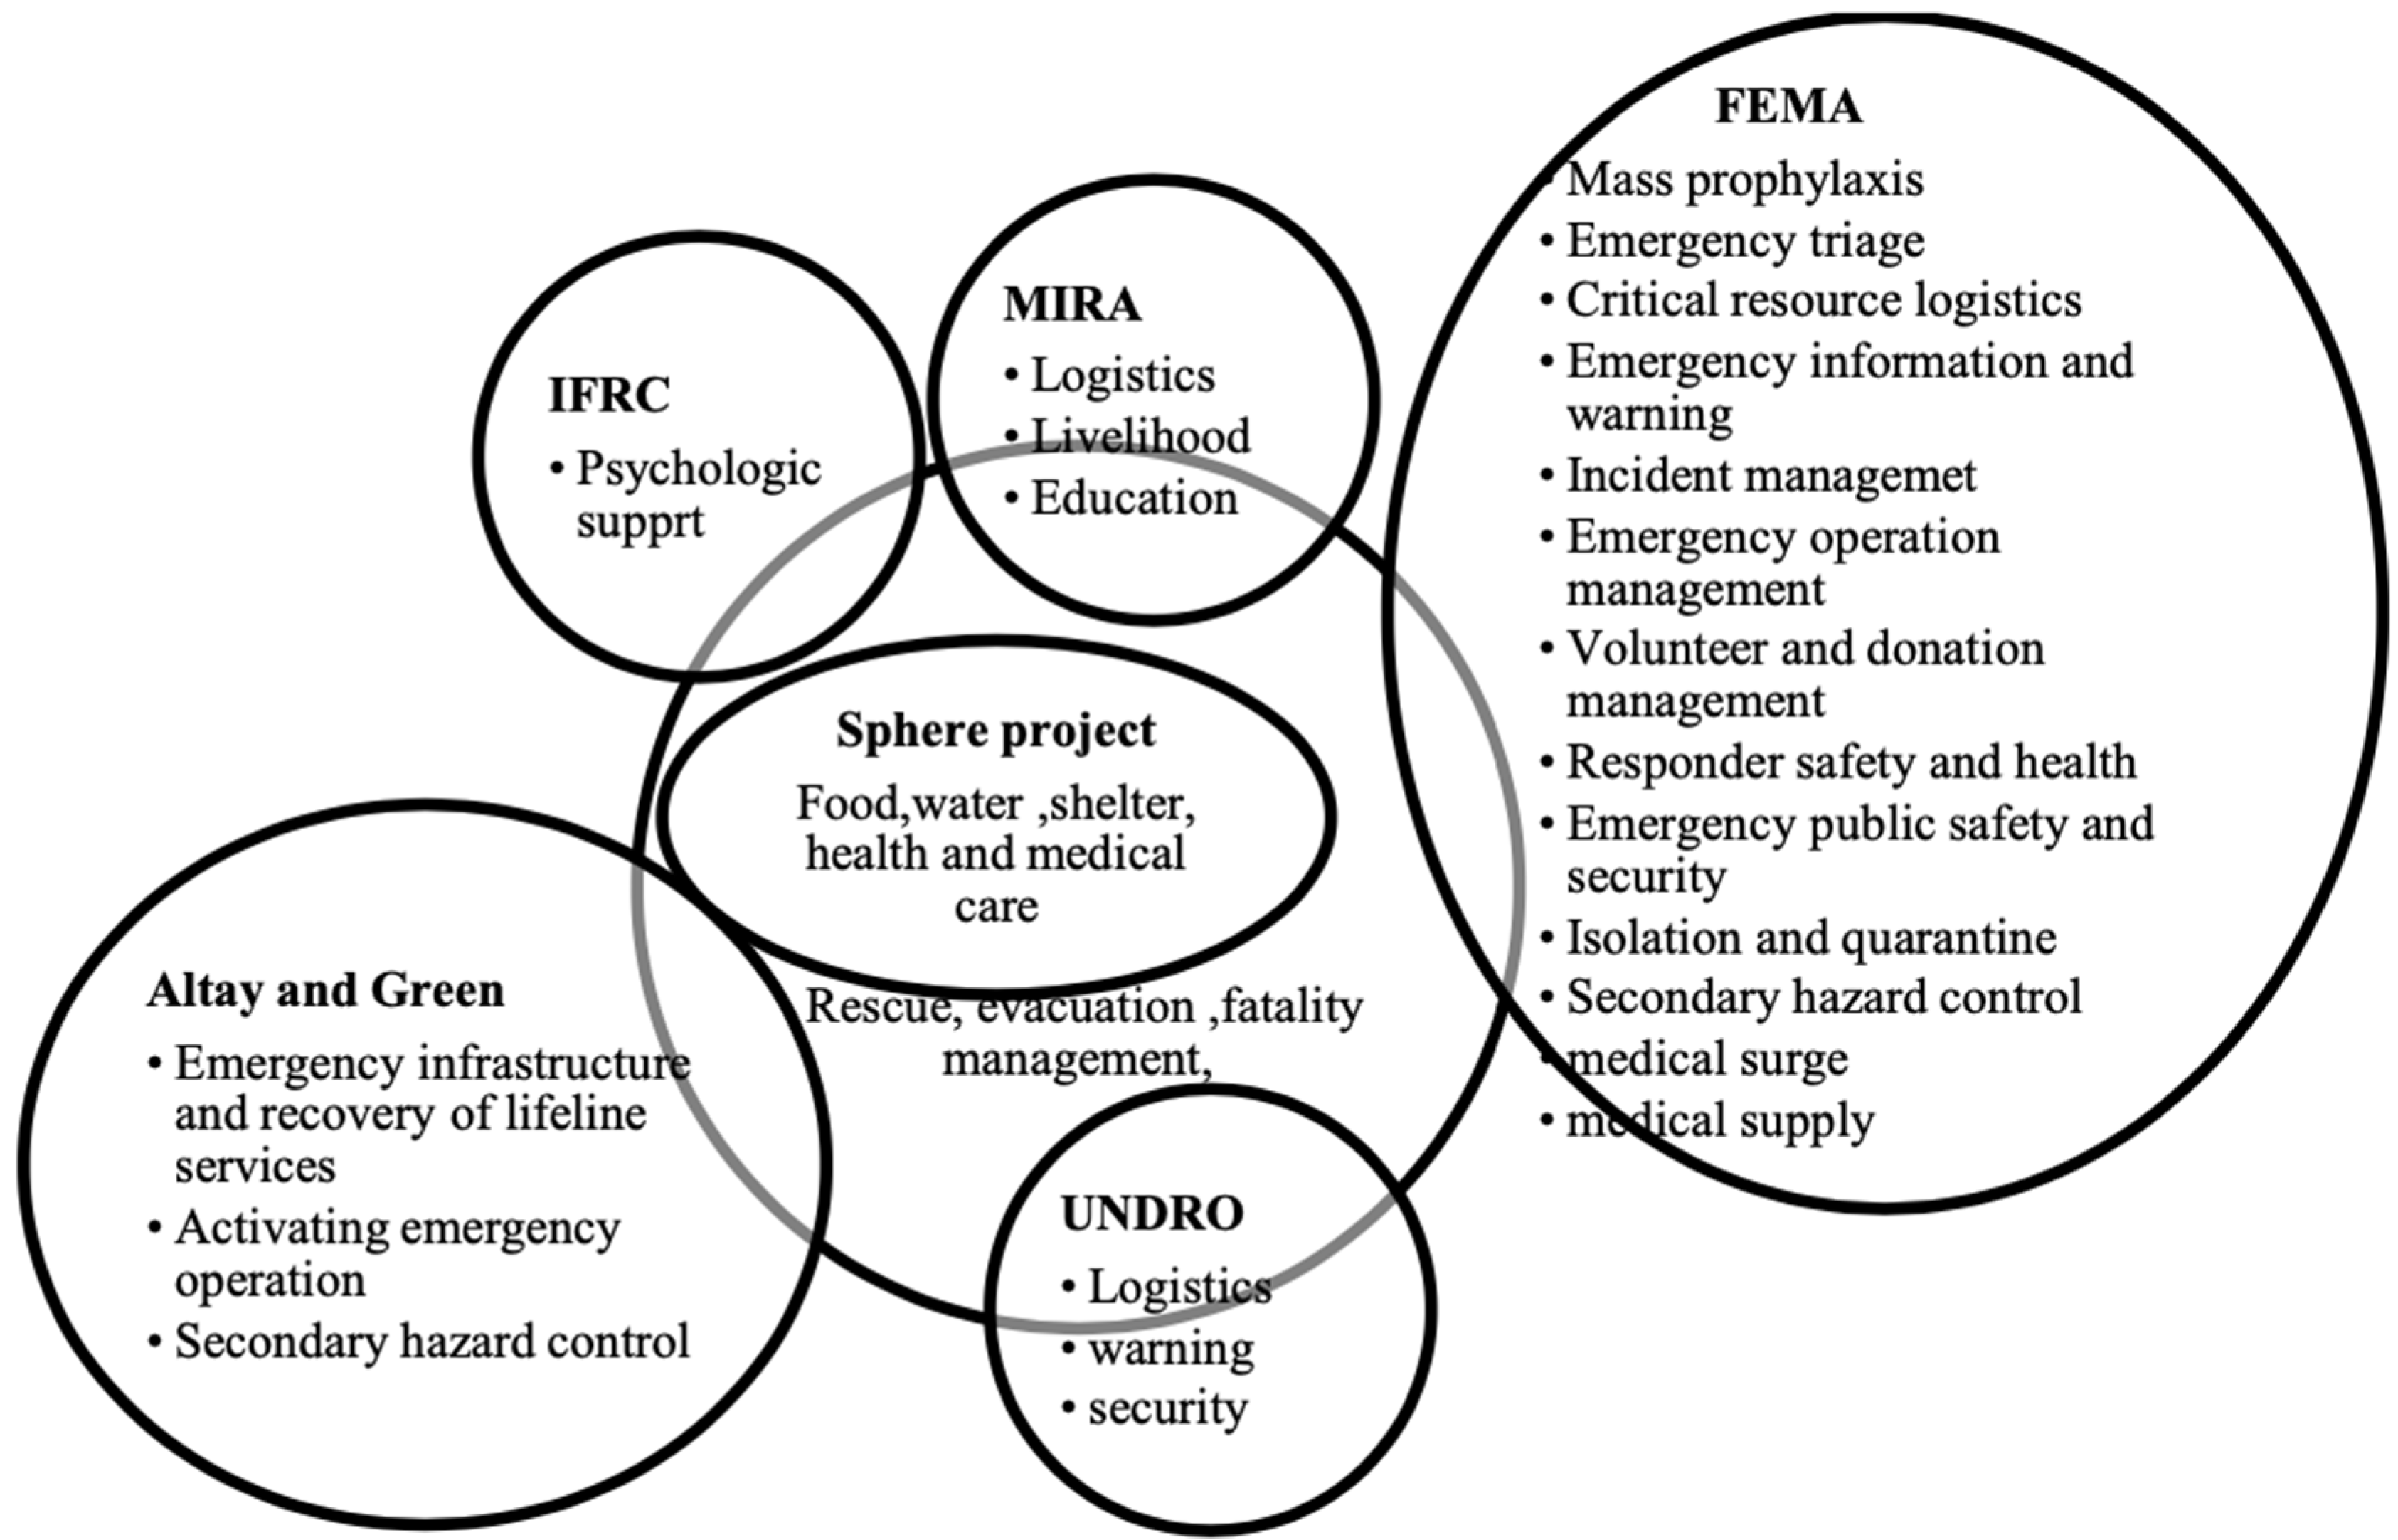
 Figure 2.
Figure 2 shows where these requirements overlap. The majority of the organisations emphasise on the importance of the key life-saving activities including food security and nutrition, shelter and settlement (including non-food items), water and sanitation and health actions. Additionally, except for one organisation [76] which focuses solely on saving the lives of the survivors, the rest of the sources agree that rescue, evacuation and fatality management, education and logistics are also important. Some criteria emphasise on the importance of secondary hazard control [20,79] whilst some criteria are only mentioned by one source only such as psychological support [78,80], warning and security [2], livelihood [81], emergency infrastructure and recovery of lifeline services and activating emergency operation [20], mass prophylaxis, emergency triage, critical resource logistics, emergency information and warning, incident management, emergency operation management, volunteer and donation management, responder safety and health, emergency public safety and security, isolation and quarantine, secondary hazard control, medical surge and medical supply [79]. To summarise, the key life-saving activities or mass care activities are shared by all above organisations and therefore are the focus of this study.
The minimum standards of needs for key life-saving activities is drawn from the previous practice in similar disasters, published by humanitarian organisations [2,20,76,77,78,79]. The significance of this method is that by knowing the number of affected population, and based on the minimum standard, the required units of aid for each disaster scenario can be calculated. This process in this article is called “need estimation”.
The data required for the estimation phase is collected from standard minimum requirements published in the following. This includes the internal reports and working papers from variety of government archives including Census Bureau, Department of Laboure, military, European Central Bank [82], Federal Emergency Management Agency [79], various bodies of UN [1,2,83,84], World Health Organisation [85,86], Global Health Council [80,87,88], Office for the Coordination of Humanitarian Affairs [81,89,90,91,92,93,94,95] and various foundations and associations including OXFAM [96], The Association for Healthcare Resource & Materials Management, Health Industry Group Purchasing Association, Health Industry Distribution Association [97], Sphere project [76], National Voluntary Organisations Active in Disaster [98] in addition to other reports [99,100,101]. Table 1 shows the literature used in developing the need assessment technique.
The resources in Table 1 were used to consolidate a need-based list of life-saving activities. This list was then categorized based on the humanitarian cluster system offered by Inter-Agency Standing Committee [77] to address the right of the affected population to receive the assistance required to live with dignity. This minimum standard requirement will be used in the first step of the methodology as described below.

The Effect of Type of Disaster on Need Estimation

The demand also may vary based on the type of the disaster because the type of disaster influences the extent of the effects. For example, earthquake causes the highest rate of death within different type of disasters. Additionally, some linguistic measures [76] shows that in an earthquake or high wind, food scarcity is not an issue, whilst it is quite probable in tsunami. For example, based on these data, it is unlikely that the affected population suffers from the food scarcity in the aftermath of earthquakes or winds, whilst it Is quite probable in after a tsunami. By adding to the effects of the different types of disasters, Table 2 is created. The following ranks are applied to the situation If Small = 1, Rare = 2, Few = 3, Moderate = 4, Many = 5, Common = 6, High = 7. It is noteworthy that the ranks need to be considered as priorities and not the actual numbers. Therefore, we started the priorities from 1 for simplification. It is possible to start it from any other number such as 0.57, 0.58, 0.59, or even start from 1000; 1100; 1200 as long as it makes it possible to show higher priorities. The result of this accumulation is summarised in Table 2 as ranked from 1–7, (1) being the lowest weight to (7) to the highest weight effect. The numbers are only representatives of weights and is not to be treated as actual numbers.
Table 2 shows that when earthquakes strike, fatality management, and medical mass care require the highest level of resources followed by food and shelter. Another conclusion is that after floods, the most required resources are shelter whilst after a flash flood and tsunami the highest priority is food cluster. Because the data set was void of information about the eruptions, the definition from [102] was used for this disaster type. It suggests that in eruptions the population displacement is often a consequence. Therefore, in general the eruption response prioritises are temporary shelter materials; safe water and basic sanitation; food supplies; and the short-term provision of basic health services and supplies. Using this data, decision makers could know roughly that when an earthquake strikes fatality management needs more participants than food supplying Suppliers. However, this rule does not indicate prioritising the population, and in applying this rule, it should always be taken into consideration that the live population has a higher priority. As a result, the mass care needs of the live population should be dealt with first before fatality management is put into place. This data is further used in combination to minimum standard requirement to estimate the needs as described as follows in the method.

4. Method

Decision-making methods suitable for a disaster network allocation, can be viewed as a multi-criteria decision-making problem [103]. Some scholars emphasize on the importance of DSS techniques in addressing specific disaster response problems [22,
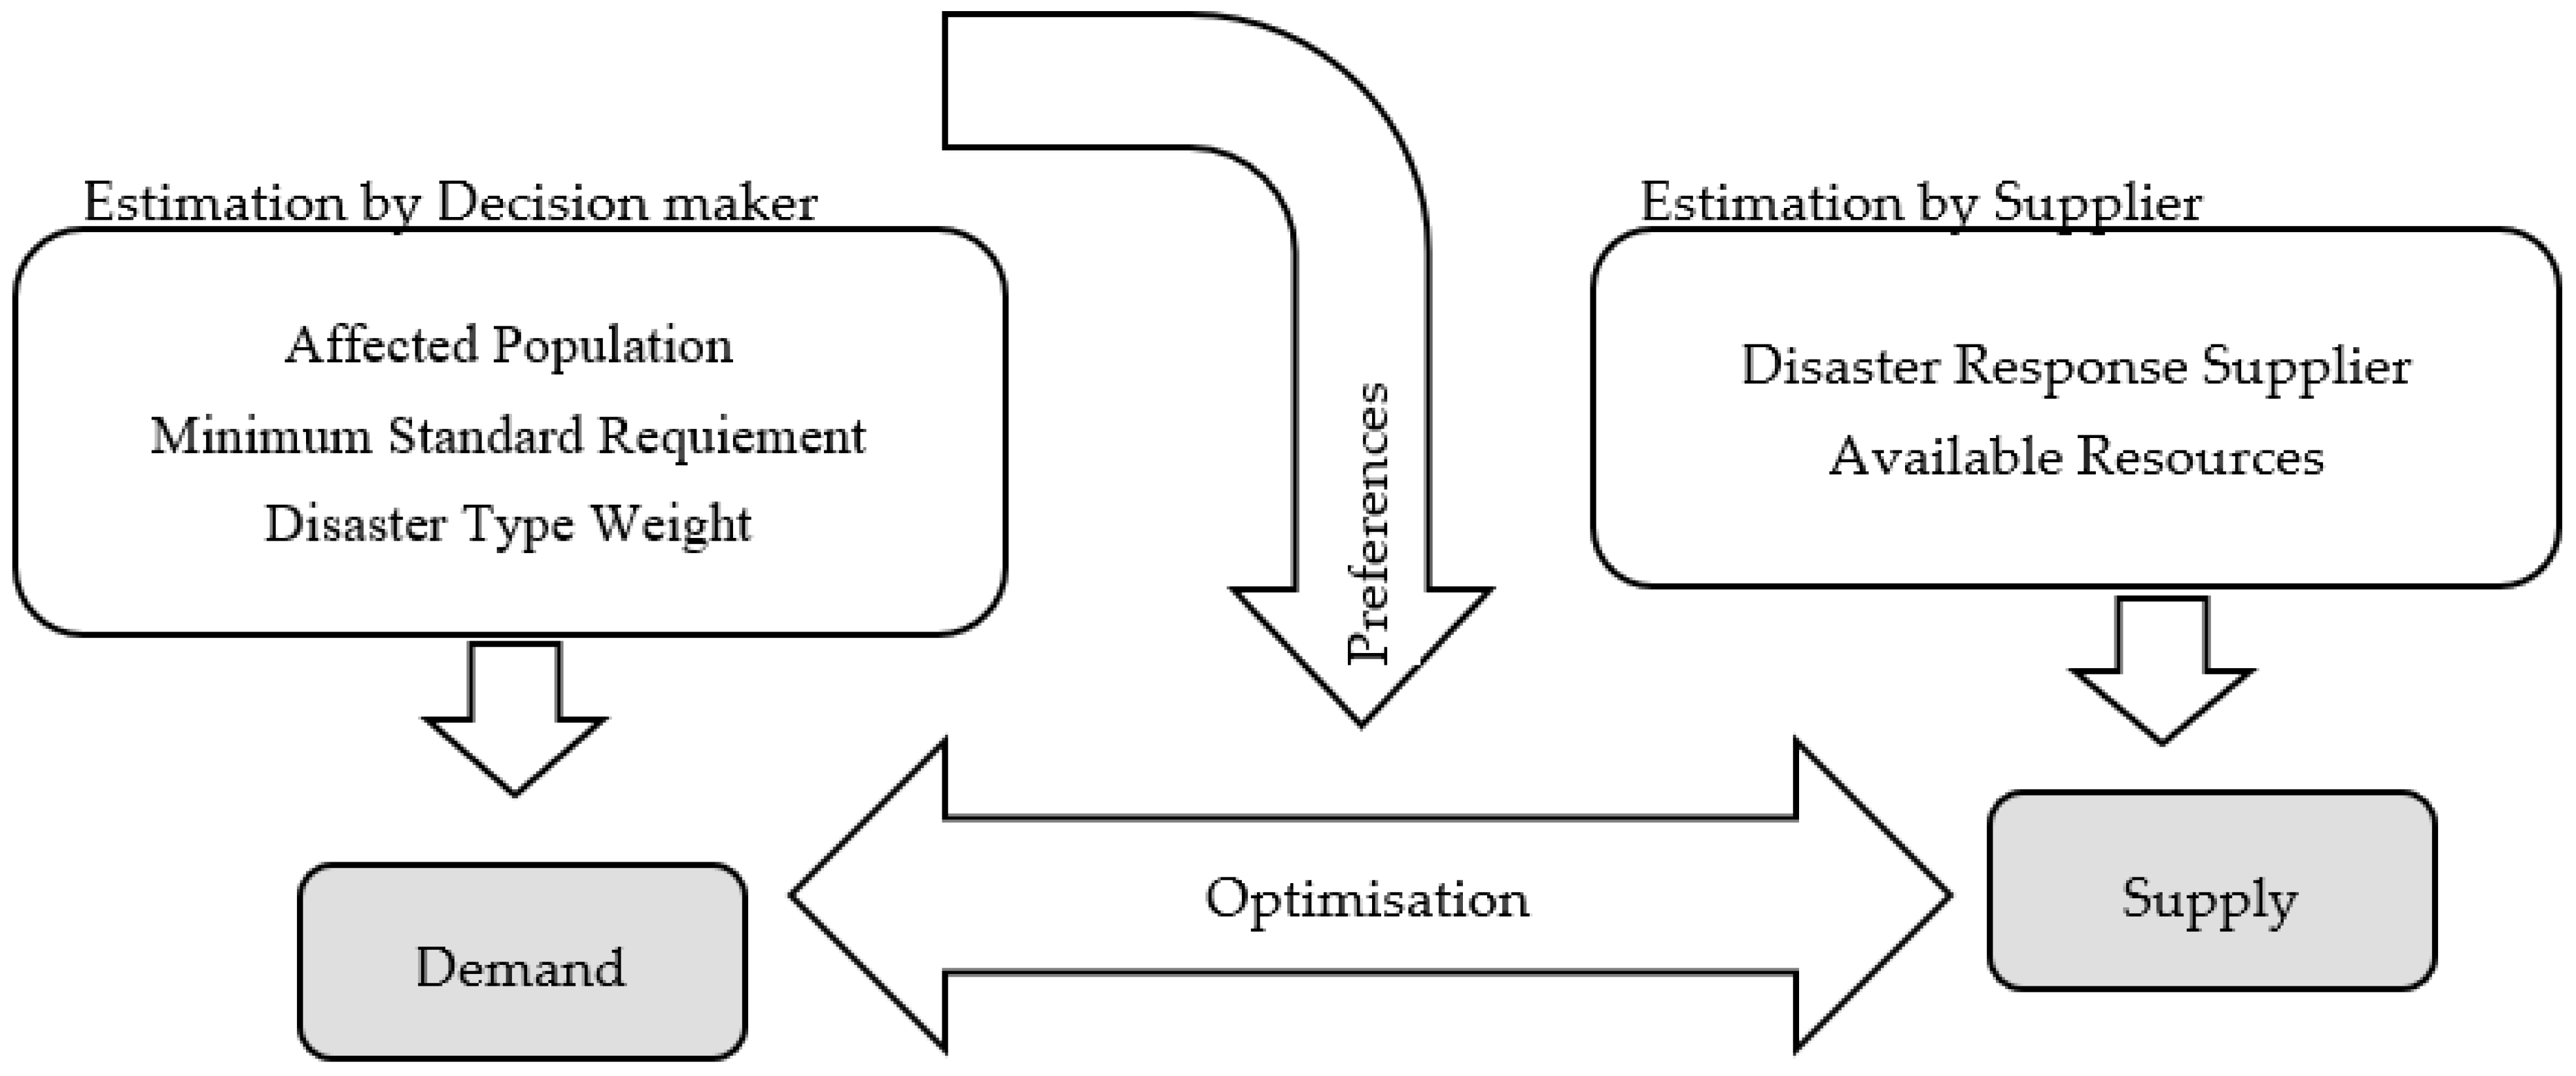
70]. The DSS designed for this research for allocation of the resources to the affected population is called EDIS (Estimating for DISaster response) Framework. EDIS follows two consecutive phases combining the existing decision techniques and determinants, suitable for the characteristics of the disaster response. The first step is “estimation” of the minimum resources required for the affected population and the second step is “optimisation” of these requirements by the decision makers as illustrated in Figure 3.
The principles of the resource-based view outlines that if the collaboration is to be successful it needs to focus on the resources, also based on the principles of the resource-dependency theory the companies collaborate in order to acquire critical resources and reduce uncertainty [104] which is the case in the disaster situation. The idea is to use the historic data about how many units of resources are required in similar situations in order to estimate the approximate needs. The rest would be an optimisation problem using the mathematical programming based on the principles of the utility theory. This insight outlines the design of the research to investigate two propositions.
This research addresses two questions: First to what extent is possible to estimate the resources required for humanitarian response operation in the absence of MIRA report within the first three days. Second to what extent is possible to optimise the resource allocation decisions within humanitarian response operation considering the preferences of the decision makers. This question is answered by a scenario-based decision making process to optimise the balance of available resources in possession of suppliers (supply) to the needs of the affected area (demand) as illustrated in Figure 3. The focus on this research are natural onset disasters or disasters with no-notice [22] such as eruption or earthquake.
This system categorises the minimum standard needs of affected population as Shelter, Nutrition, WASH (water and sanitation), and Health in 43 main needs. For simplicity and illustration purpose an example of the result of this accumulation is articulated in Table 3.
Table 3 accumulates data from different resources leads to an average number. For example, IFRC (Cited by WHO, pp. 48–49) states: “200 people/day 10–20 beds for overnight observation, Supplies to treat 30,000 people. For a month, per 12–14 h shift: 1 Doctor, 1 Pharmacist/Nurse, 1Curative/Community Health Nurse, 1 Midwife/Nurse, 2 General Technicians” from this statement, we can conclude that for 200 people/day we require a maximum of 20 beds, 1 doctor, 3 nurses and 2 other medical personnel and 1000 units of treatment supplies (30,000 for 30 days).
There are two points to keep in mind when looking at the above numbers. Minimum requirements for each cluster are expressed based on the person or household needs. A household is defined as a group of people who eat from a common pot, and share a common stake, interpreting and improving their socio-economic status from one generation to the next [105]. There are many options available for food as long as it provides the 2100 kcal required for each person [76] and complies with the cultural norms of the affected society. Additionally, the demand also may vary based on the type of the disaster.

Optimisation

For the optimisation of partner selection, a DSS is required that embeds the partner selection criteria for partner configuration. For the particular case of this research the decision methods used in literature were compared to identify the most suitable technique to be used in the research. A review shows a variety of hard methods (with quantitative and numerical values) and heuristic methods (with linguistic and quantitative values) in the decision-making field. As mentioned before the process of optimization in this research includes balancing the available suppliers’ resources (supply) to the needs of the affected area (demand). Therefore, a multi-criteria [53,106,107,108,109] resource based [55] DSS which accommodates the characteristics of the disaster response is required [103]. These characteristics may include the time pressure [24], big database [110] and multiple perspective of decision makers [111].Variety of hard methods (with quantitative and numerical values) and heuristic methods (with linguistic and quantitative values) in the decision-making field can be used. The suitability of them is assessed in Table 4.
Table 4 indicates the strength and weaknesses of each method. There is one specific group of hard or mathematical methods capable of accommodating numbers and quantitative values (as opposed to fuzzy or qualitative values) such as goal programming and integer programming [112]. These methods for the purpose of this research seem to be unsuitable because they formulate the problem in objective terms and fail to accommodate subjective attributes, here subjective preferences of decision makers. In addition, due to the high load of computation, these methods are not suitable for this research, a big dataset.
Another set of methods, which are vastly used in this area are evolutionary algorithms [107], however they become very slow when the number of selections arises and they might offer only a local optimal solution [67]. Additionally, the main drawback of all above methods is that they require a high level of specialised knowledge that is likely to be well beyond what possessed by disaster response decision makers. Alternatively, neural network analysis is suitable in disaster response networks for large data sets for training [53,113], however the quality of estimation in disaster situation under certainty is not trustworthy for training. Expert systems such as fuzzy logic are suitable for linguistically expressed expert’s experience for multi-criteria optimisation [114,115]. Because this method is based on drawing fuzzy based rules out of the series of data, and in the absence of data, the rules cannot be confidently drawn. Both fuzzy methods and neural networks are only as strong as their database, so in the absence of such a strong database the rule-based system may fail [116]. This is noteworthy to mention that there is no record of decision makers’ choices of suppliers in the disaster response in the literature despite a good record of disaster impacts in the literature.
Another group of methods, such as Multi-Attributive Decision-Making (MADM) as part of Multi-Attributive Utility Theory (MAUT) used for disaster response [65,109] also seems more suitable for optimization in this research. The reason is their capability of accommodating the non- certain preferences of decision makers, and linguistic expert’s opinion which are required for supplier selection. These may include Analytical Hierarchy Process (AHP), Analytical Network Process (ANP) and Technique for Order of Preference by Similarity to Ideal Solution (TOPSIS). MADM is a branch in the decision-making for choosing between a finite number of alternatives.
In the EDIS, we assume that the number of suppliers in disaster response is finite so it seems appropriate to use MADM. One of the weaknesses of MADM methods is the rank reversal problem [117], which means that result of the ranking (direction of maximising or minimising and the ranking method itself) differs with the quality of the information available and the set of criteria representing the reality. However, in the uncertain environment of the disaster response, the decision maker always has to settle for available or obtainable data. This is because of the time pressure [24] and the often destroyed infrastructure which makes it impossible to improve the quality of the data. Therefore, the low quality of the data is going to affect the result of their decision, no matter what decision-making method they choose. Thus, these methods still seem like good candidates. Within popular MADM methods ANP which is used for prioritization [118] is incapable of accommodating the subjective perspectives of decision makers [103], which is one of the elements of the optimisation model in EDIS.
Another option, Technique for Order Performance by Similarity to Ideal Solution (TOPSIS), is used for group decision-making under uncertainty of information in order to select suitable suppliers [58,119]. This method can rank alternatives regarding defined criteria by minimising their distance from a positive ideal solution and maximising their distance from the negative ideal solution. However, this method also is based on objective values and therefore it ignores the subjective decision maker preference required in our research.
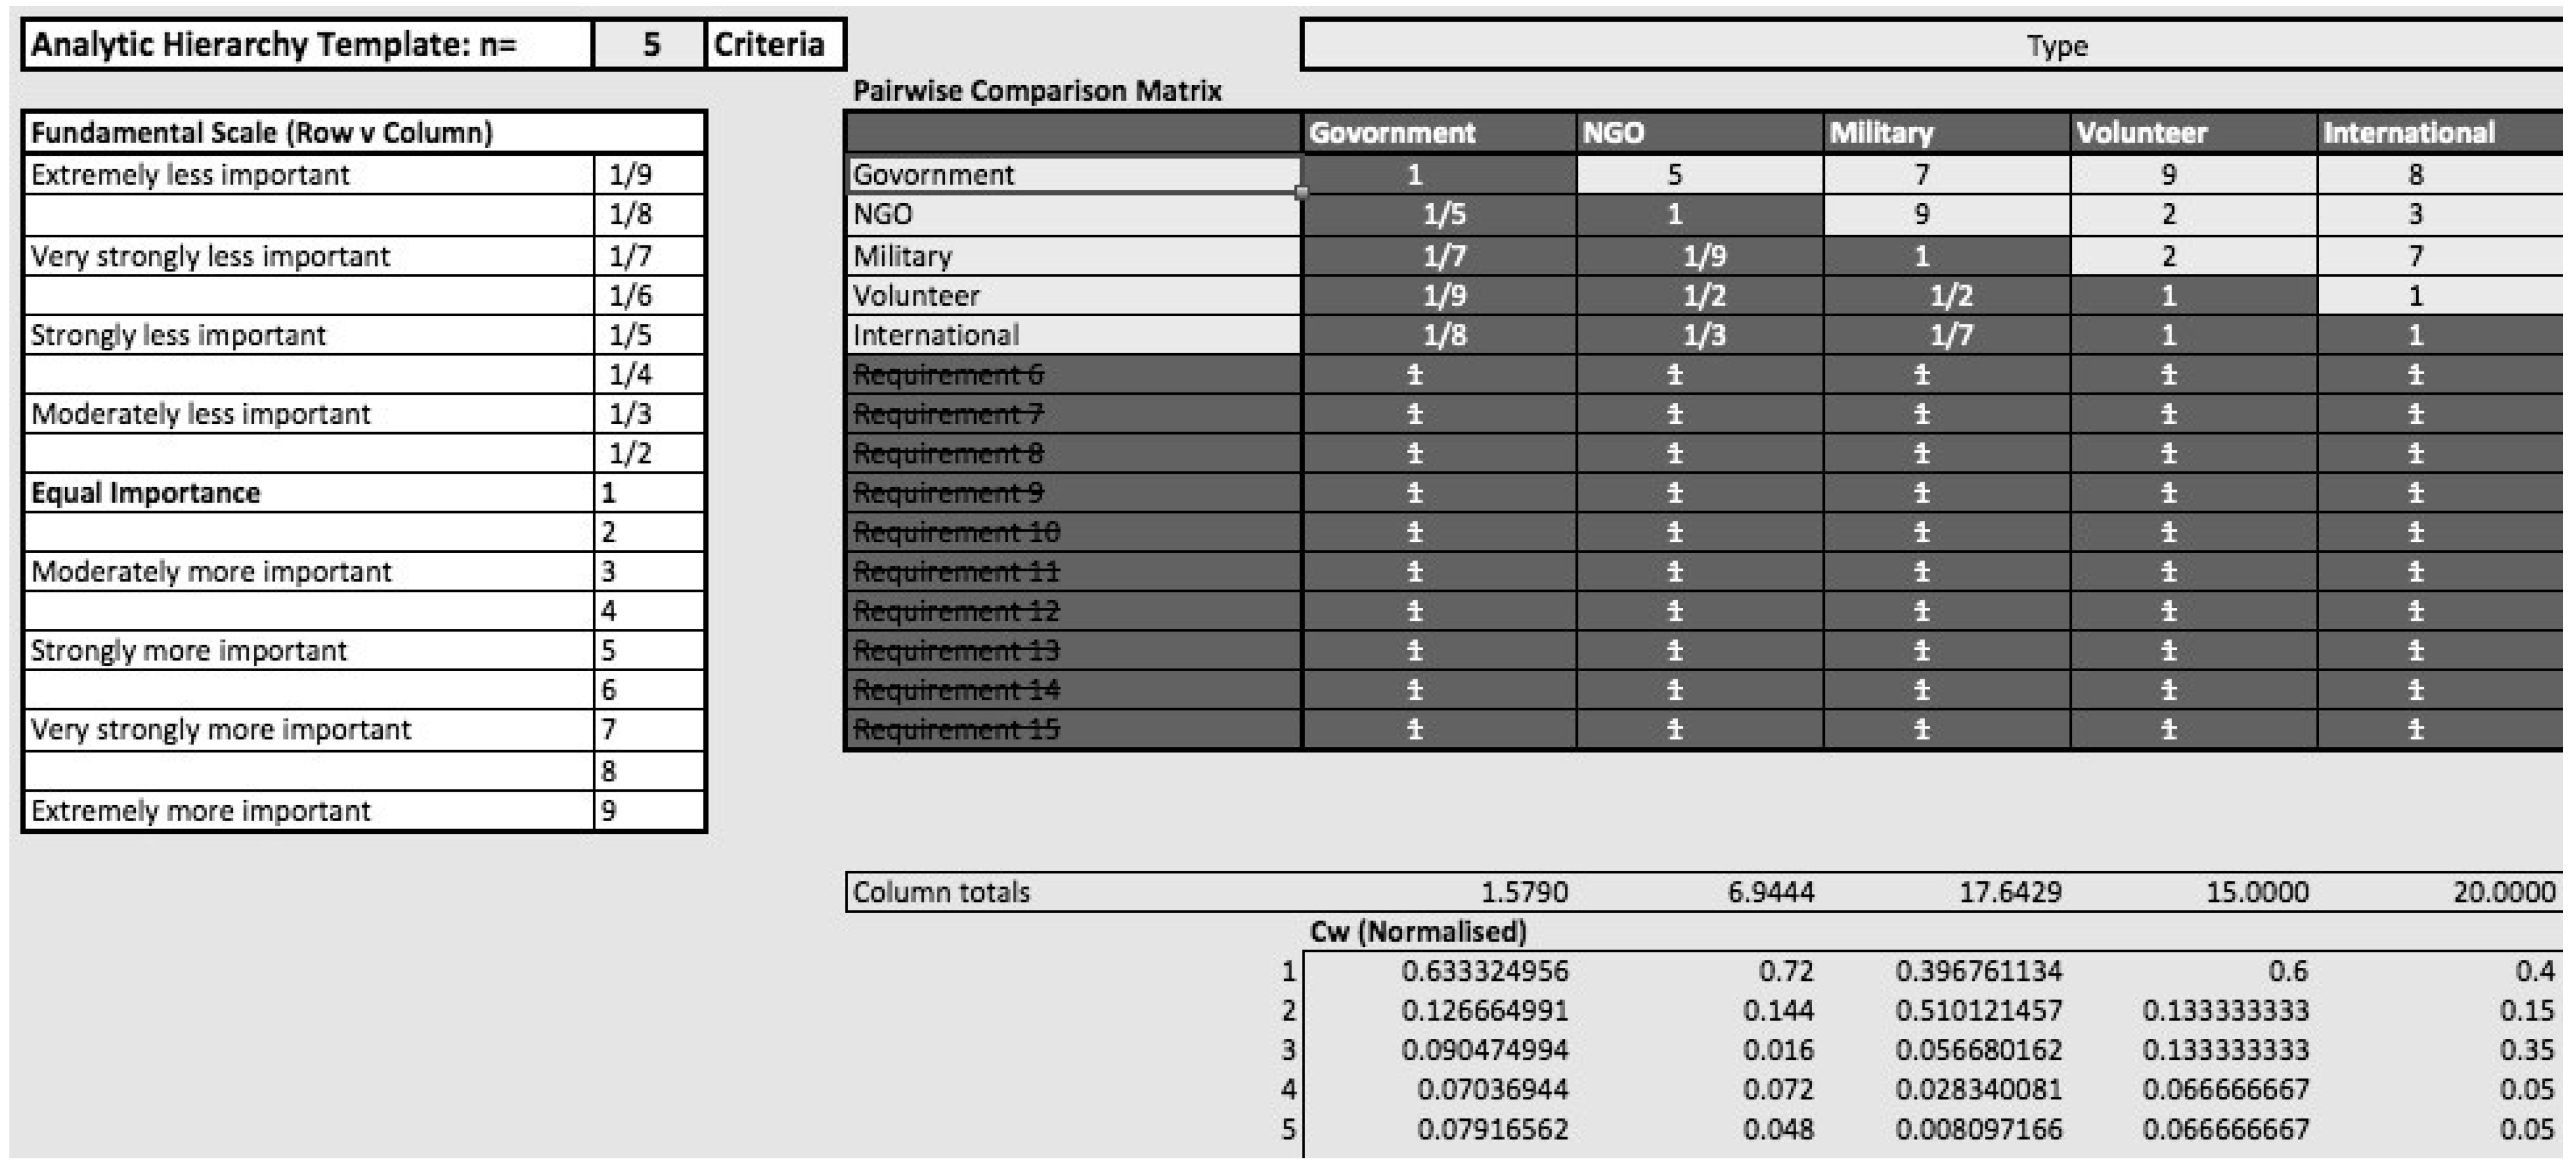
The most suitable option within MADM is AHP, which is used extensively in supplier selection [59,120,121,122]. This method is a good method for our research because unlike the other MADM methods mentioned above, it accommodates the subjective values, including the decision maker’s preferences. To summarise Table 4, due to time pressure inherent in disaster situation, a DSS methods with a high execution time such as evolutionary algorithms, which slows down towards the end, need to be avoided. They also require a high degree of technical mathematic understanding, which the average decision maker in disaster response network might not have.
Another characteristic of any DSS run by people is that their preferences may hugely influence the result. Thus, the methods in which the subjective preferences of decision maker are not accommodated should be excluded such as ANP or TOPSIS. For those reasons the final candidate for optimization here are AHP to rank the utility of disaster response suppliers based on the decision maker’s preferences to allocate the resources in demand by affected population to the resources offered by supplier. This selection is based on the resources the supplier has in accordance to the estimated needs for the respected disaster impact.

5. Results

The present research suggests two steps; the first step estimates the needs required for a particular disaster, based on minimum standard requirement for disaster. The second step is to optimize the resource allocation using the principles of utility theory by ranking the decision maker’s preferences and the disaster needs priorities into an AHP model. In summary the article provides an optimization technique between demand and supply of the disaster affected area. The results are classified based on the input and output demonstrated in Figure 2.

5.1. Input

The input is the demand estimated based on the affected population, minimum standard requirement, and the weight of the disaster type. The minimum requirements of life saving activities (Table 3) coupled with the weight of disaster type (Table 2) can provide an estimation for the required resources to address the humanitarian needs for that disaster type in that cluster. However, the socio-economic characteristics of the affected country can also influence the need estimation as discussed below.

5.1.1. Inputting the Effect of Socio-Economic Characteristics on Need Estimation

In addition, the economic characteristics of the affected regions could influence the priority of needs. Typically, the events that result in the highest numbers of fatalities are located in regions with increased risk and vulnerable populations. This is often compounded by limited infrastructure and poor integration of the health system into disaster preparedness, response, and recovery [86]. For example, more foreign medical care is required for a disaster, which strikes in Sub-Saharan Africa, than a disaster in the Middle East, due to the capabilities of medical infrastructure. Therefore, different levels of attention are required for various clusters in different types of disasters.
For example, after an earthquake, the food cluster in Japan and Philippines require different levels of attention, due to their different level of infrastructures. To address this issue the indicators of socioeconomic development have been included in the model. These indicators including lack of coping capability and susceptibility were drawn from the medical capabilities, and sanitation/nourishments of each country are annually calculated by the United Nation and published in the world risk report [123,124].
These indicators include the ‘coping capability’ indicators, which were calculated, based on (amongst other criteria) the number of physicians and hospital beds/per 10,000 inhabitants by UN. This indicator has been added to the model as weights, to signal the health cluster capability of the country. Furthermore, a ‘susceptibility’ indicator based on (amongst other criteria) access to the water sanitation and nourishment calculated by UN is also added to the model as a weight to signal the food and WASH cluster. These weights signal the criticality of the situation on a specific cluster in a particular country. It also provides an opportunity for comparison between different disasters as in Table 5.
Table 5 shows that by comparing the 2005 disaster in Pakistan with the 2011 disaster in New Zealand, without knowing any other information, including the type of disaster, we can tentatively claim that the health cluster (in terms of hospital beds and physicians) in Pakistan is almost two times less likely to cope with the disaster effects than New Zealand. The reason is that Pakistan’s lack of coping capability is 87.39% compared to New Zealand’s, which is 39.79%. The same principle can be used to interpret the susceptibility based on access to food and nourishment. It shows that Pakistan (38.84% susceptibility) is three times more likely to suffer from mal-nourishment, lack of water, and sanitation than New Zealand (with 16.19% susceptibility).
These numbers should also be considered as probabilities or risk factors and not actual numbers. They are only to be used for signalling what areas of needs should be prioritised. Combining the criteria affecting the needs in a disaster situation (including evidence from previous experiences, the type of disaster, and economic aspects of the affected region), the priority for each task can be calculated. Assume we must choose between disaster response clusters in both Pakistan and New Zealand at the same time. Based on the data in Table 3 the priorities would be shelter and fatality management in both counties because their priorities are higher than other clusters and equal to 200. The next priority is food and WASH for Pakistan (both 194 points for priority), followed by the Health cluster for Pakistan (87.39 points for priority), then food and WASH for New Zealand (80.95 points for priority), followed by the Health cluster for New Zealand (30.79). This data is obtainable and calculated without knowing any other information about the disaster including its type.

5.1.2. Estimating the Required Resources: An Example

The affected number for Pakistan earthquake 2005 is used for an example. The total of 75,000 injured and 2,800,000 displaced population are the basis for this calculation. There are few assumptions associated with this example. First, assuming there is an overlap between the injured and displaced population, and for that reason we then assumed that the injured only use the health cluster and water for patient needs and the rest are being used by the displaced. There are four prominent categories of needs, one for each humanitarian cluster including health, nutrition, WASH and shelter. Multiplying the needs for one person in Table 1 and estimated number of people in need of that particular help, would provide the total number of needs required for that cluster. So the need for each cluster is calculated as: [Total unit required for a cluster = Minimum standard requirement * estimated impact]. A sample of 21 needs for the illustrative purposes are distributed between four humanitarian clusters is presented in Table 6 combining the result of Table 2 and Table 5.
Table 6 is calculated based on the minimum standard requirement in Table 2. For example, in the health cluster the need for a doctor in Pakistan earthquake 2005, is 75,000 doctors or 16,605 L water/day. Additionally, the cluster priority column shows that the community is less likely to cope with shelter shortage than the other needs, so in allocating the resources, the shelter (200 cluster priority) needs to be prioritised slightly over nutrition and water (194 cluster priority) and then health needs (87 cluster priority). This is also confirmed by the number of displaced who would require shelter, water and food (2,800,000 people) as opposed to the number injured (75,000 people).

5.2. Output: The Optimized Set of Resources Available from Different Suppliers

By entering the preferences of the decision makers, their subjective views which can affect the decisions are taken into account. The supply is the optimised in terms of the ranks of suppliers who have resources available for the required response phase.

5.2.1. Building AHP Model Based on Decision Makers’ Preferences

Due to the subjective nature of decisions, different decision makers, provided with the same options and data, make different decisions, based on their preferences. In disaster situation when we have different suppliers, choosing between different suppliers and their resources is important to optimise the allocation of resources. A set of questionnaires are conducted from experts in disaster management field. The data collection process is described below.

Collecting Decision Maker’s Preferences

This questionnaire was provided to the participants which overall took three weeks to complete for 42 participants. The information about the research and invitation for participation was distributed amongst various organisations (Environment agency, Crisis departments of five different embassies, Business continuity departments of Munich RE, Barclays Bank and Lloyds bank, and individuals who had connections with humanitarian organisations including UN, UNISDR, UNICEF, World Vision, Caritas International, British Red Cross, American Red Cross, Save the children and various specialised forums and groups related to disaster management on LinkedIn (including Business Continuity and Disaster Recovery Professionals, Business Continuity Management & Risk, Business Continuity/Disaster Recovery Network, Disaster & Emergency Management, Disaster, Disaster, Disaster Management—Multi Hazard Risk Assessment, Disaster Researchers and Disaster Management Professionals, Disaster Risk Management Practitioners, Emergency Preparedness Consultants/Trainers Group, GWU Institute for Crisis, Disaster and Risk Management, Humanitarian & Disaster Response Technology Network, Innovations in Disaster Management and Emergency Response !,Natural disasters and natural hazards, Natural Hazards and Disaster Risk Management, Performance Management, Professionals in Emergency Management, World Conference on Disaster Management). 68 people initially expressed interest and were sent the questionnaire but at the end 42 filled questionnaires were returned.
The respondents are asked to identify in respect to each one, the criteria for partner selection which criterion is more important and how much more important on a scale of 1 to 9. This is the basis for questionnaire 1 (decision preference). These criteria include the type of partners (Government, NGO, Military, International organisations such as Red Cross and UN and volunteers), size, experience of the partners, their surge capacity (the ability to rapidly expand beyond normal capacity to meet the increased demand) and their cluster (WASH, nutrition, health, shelter). The first questionnaire is given to both groups of participants in order to identify their preferences. The goal, criteria, and sub-criteria considered in this questionnaire are articulated in Figure 4.
The first row in Figure 4 shows that the goal of this questionnaire is to define the characteristics of the desirable partners in the view of each decision maker. The second row gathers the data about the characteristics of the desired partner in terms of the following criteria: Type of the partner in respect of being governmental, NGO, International, Military or Volunteer organisation as sub criteria. Size of the partners based on ANLAP’s (2012) categories for humanitarian organisations, being Small (under 10 million USD expenditure), Medium (between 10–49 million USD expenditure), Big (between 50–99 million USD expenditure) and Very big (more than 100 million USD expenditure). Experience of the partners being Low (Under 5 disasters), Medium (Under 10 disasters), High (under 50 disasters) and Expert (more than 50 disasters). Partner’s surge capacity (the ability to rapidly expand beyond normal capacity to meet the increased demand) being None (0% of the total capacity), Low (under 10% of the total capacity), Medium (under 30% of the total capacity) and High (over 30% of the total capacity). Partner’s international expansion being Yes (expanded internationally such as UN), No (expanded only locally such as local charities). Partner’s ability to address the needs for humanitarian cluster being WASH, Nutrition, Health, and Shelter. So the numerical preferences for the above decision criteria being type, size, experience, surge capacity, expansion and cluster is collected through the questionnaire in Table 7.
The data gathered in this questionnaire was then used to calculate the preference weights using AHP. The preferences of the decision maker can be quantified using AHP. This is calculated by a set of pairwise comparison matrices where the verbal preference (e.g., extremely less/more important) is translated into numerical values (e.g., 1/9 to 9). The AHP weight calculated for these values can get values from zero to 1.0 or from 0% to 100% as shown in Figure 5.
Imagine we have a decision maker who prefers to be involved government organisation the most; in other words, if s/he wanted to decide based on the type of the organisation s/he would definitely choose the government over International organisations. A decision maker with the AHP values is calculated as the government had the highest value for this particular participant (60.8%) whilst the International organisations and volunteers had the lowest value (6.5%) as shown in Table 8.
For example, in Figure 5 the government had the highest value for this participant (60.8%) whilst the international organisations and volunteers had the lowest value (6.5%). In other words, if s/he wanted to decide based on the type of the organisation s/he would definitely choose the government over international organisations. This process gives a full set of preference for each unit of resource per partner, presented in Table 9.
Table 9 shows that the preference for doctors (a resource in the health cluster) for this participant is AHP = 0.98 or 9.8%; whilst s/he considered water (a resource in the WASH cluster) much more important (AHP = 0.58 or 58%). In addition, the AHP weight of each resource for each partner was calculated. For example, the water provided by Partner 4 had a higher preference (74%) than the water provided by partner 2 (49%) due to the preference this participant had towards the characteristics of these partners (including type, size, expansion and so on).

5.2.2. Calculating MAUT for Each Supplier

Based on the above priorities calculated by AHP, the MAUT produced for each supplier can be calculated as follows. Ui(x) is a single utility function or preference function associated with candidate i, which represents the utility values the decision maker attaches to each candidate and is obtained by using the AHP process. To aggregate the scores of each attribute in the MAUT process, the linear additive utility form is the frequently simplified assessment procedure as given by Equation (1)—Utility function of the candidates based on the available resources:
n
V(yi) = ∑rij.ui(x).
i = 1
where rij represents the resource j available to candidate i. The V(yi) will be the value of the candidate i because of the resource j they have available. The AHP weights calculated before then were used to calculate the utility of each resource as well as the utility of that resource for that partner Table 10.
For example, in Table 9 the utility of the water provided by Partner 1 is 15.30, whilst the utility of water for all the partners is 25.11. The total utility of all the resources that each partner holds can be calculated as the accumulated values of that partner’s utilities. For example, for these particular participants, the utility of partners can be calculated and be used to rank the partners as exhibited in Table 11.
Table 11 shows an example of the rankings of the partners based on this participant’s preferences. For example, Partner 5 is the most desirable partner with a utility of 1520. This also shows that the most desirable partners for these participants are small governmental entities. In addition, it seems that this participant does not value the experience or the surge capacity of the partners as critical requirements for a disaster response. Finally, the experts were asked to fill out the second questionnaire. An example of the accumulated data is exhibited in Table 12.
Table 12 shows that for example, in this scenario the total available resources N42 = Doctors, are 0.0372 for each 100 people. However, the number of required doctors is more than 0.515 for 100 people. Although due to the scarcity of this resource, and the fact that the decision maker needs all the helps s/he could get, it is still possible to rank the Suppliers based on the decision maker’s preference. As you see, the utility of the doctors that Supplier 2 can provide (0.133) is greater than the number doctors that Supplier 1 can provide (0.0112). In addition, as can be seen in this case the utility of the health cluster (0.103) is more than the other clusters. The utility of the shelter cluster is 0.099, whilst the utility of the nutrition is 0.017 and WASH is 0.0007. Therefore, if a decision maker must decide which need to prioritise, s/he should first consider choosing the Suppliers who can provide the doctors, nurses, etcetera, rather than the Suppliers who can provide, food, water, or shelter.

5.2.3. Ranking Suppliers Based on Their MAUT

To get a better understanding about how the Suppliers in different scenarios for different decision makers may differ, an example is presented in Table 13.
Table 13 shows the ranking of the Suppliers based on the highest utility to the lowest for this example. Based on the preferences of decision maker 2 and the needs predicted in scenario 1, Supplier 153 with a total utility of 1.13 is the best option followed by Supplier 41 with 1.09 utility, etc.

6. Discussion

The present research is designed to provide a technique for Supplier ranking/selection in disaster response. The research employs various techniques including analysing the archival data, and decision support tools including Linear programming optimisation, Analytical Hierarchy processing (AHP), Multi-attribute utility theory (MAUT) to develop several decision techniques based on secondary data. This research provides an approach to Supplier configuration in disaster situation in two phases. The ESTIMATION process answers the first research questions is “how to estimate the needs of the affected population at the time of the disaster strike?”. Using various resources, the minimum standard requirements for a disaster response in four humanitarian clusters (WASH, Nutrition, Health and Shelter) was defined. This estimation was used as the basis for estimating the demand of the affected population in disasters. This exceeds the use of minimum standard requirements provided by the Sphere project because it draws upon various sources to provide the data about the required units of medical help and nutrition.
This framework could also further be developed to provide data about fatality management, evacuation, and required well contamination teams. This also complements the existing literature on provide the priority of the disaster type, and tasks during each disaster type. Even though some linguistic priorities are practiced in the literature [76], the numerical priorities that can contribute to the quantification of the needs were missing. The priorities suggested in this research are required to be investigated further with the fuzzy logic analysis of the experts’ opinions regarding the priorities of each, task/need for each disaster type/country. However, this is another extensive research in its own merit and is out of scope of this research. The OPTIMISATION process answers the second question “how to optimise the selected set of suppliers (and their resources) based on the decision maker’ preferences. This is a framework for disaster response supplier selection using the principles of utility theory. In this step, the Suppliers are ranked based on their importance for hypothetical decision makers. Using the AHP technique, a matrix of hypothetical decision makers’ preferences is built and used to find the value of each Supplier in the eye of the decision maker. This step can be defined as a resource allocation problem with the target of optimising the utility of the response Suppliers’ set for each decision maker. The optimisation here is like a variety of supplier selections based on MCDM [125,126]. The variable which needs to be maximised is the utility of the suppliers in the eye of the agent (here the decision maker).
The EDIS can be complementary to the abundance of existing methods for task allocation and scheduling techniques [71,127,128] in disaster management, as a quicker data feed. Furthermore, the research shows that comparing to the existing decision models in humanitarian sector the EDIS could prevails the existing guideline based on highly specialised data in HAZUS [129] or highly subjective decision maker’s preferences in HISS [130] from The European Interagency Security Forum (IESF). In a sense, EDIS gives numerical estimations, and clearly expressed choices of suppliers whilst it is using simple available data. Contribution to theory is that it provides a unique insight into the growing body of research a part of decision-making under uncertainty where it is attempted to reduce the uncertainty by “gaining accumulated access” to other firms’ resources meaning that every member has access to the resources of all the other members. This is based on the principles of resource- dependency theory and through collaboration. Because the collaboration act in practice is no guarantee of a successful disaster response due to the interaction of contributors, the most suitable group of suppliers to accumulate and share their resources are selected based on the optimisation technique using the principles of the utility theory.
Methodological contribution is that this model provides a design to simulate the decision-making under uncertainty in the disaster situation by considering the opinion of human agents (decision maker). It also uses mathematical optimisation in addition to the opinion of human agents, which integrates the heuristic and mathematical approaches of decision-making. This also complements the existing literature by drawing upon various studies to provide the priority of the disaster type, and tasks during each disaster type. Even though some linguistic priorities are practiced in the literature (Sphere project, 2011), the numerical priorities that can contribute to the quantification of the needs were missing. Practical contribution is that by providing a range of it enables the decision maker to decide based on their budget limitations and personal preferences. It also gives different humanitarian organisations the chance to customise the model using their own database if required. The practical contribution of the article is the needs estimation tool. This framework uses various resources to articulate the minimum standard requirements for disaster response in four humanitarian charter clusters (WASH, Nutrition, Health, and Shelter).
The humanitarian organisations could use this tool to estimate the resources required to response to the needs of the affected population before the MIRA report is released. The significance is threefold. First, it is the first decision framework of its type that enables the decision maker to estimate the needs and select the partners using the data that are readily available for each country at the time of the disaster. Reliance on the available data at the time of the disaster, which are freely available to the public would reduce the cost of the data gathering, and the time required for collecting and analysing these data. Consequently, it speeds up the response time of the operation to the disaster by almost 72 h, which is vital at the time of the disaster. In addition, it is the only existing framework not limited to a certain type of disaster (although it just considers the five types of disasters) or geographical or chronological order. Another contribution is that the model has the capability of accommodating the socioeconomic characteristics of the affected population, which hugely influences the required aid in humanitarian response practices. The authors also believes that this model in long-term could facilitate establishing a centralised database for humanitarian response which is long overdue.

7. Limitations and Future Research Direction

The first limitation of this work is the lack of secondary data regarding the specific requirements of non-key-life-saving activities which led to the exclusion of them from the study. However, the principles of this research can be extrapolated to non-key life-saving activities when the data is available. However, data collection on this scale requires the cooperation of various humanitarian organisations including the UN, IFRC, and government related organisations, in addition to the private and public humanitarian organisations and charities (like the process in the sphere project) and is out with the scope of the current research. management, evacuation, and required well contamination teams.
Second, the priorities suggested in this research are required to be investigated further with the fuzzy logic analysis of the experts’ opinions regarding the priorities of each, task/need for each disaster type/country. However, this is out of scope of this research. Nevertheless, this research provides the preliminary basis for the further development of such framework.
The third limitation is that the EDIS model is based on two major assumptions. The first assumption is that a data base for humanitarian suppliers already exists. However, creating and maintaining such a database requires the cooperation of the international humanitarian bodies. The model cannot be fully tested before the creation of a standardised accredited database containing data on humanitarian suppliers, their selection criteria, and regular updates of the database. This project can be further discussed with international humanitarian entities with regard to the applicability of launching a universal initiative for gathering data and building a universal humanitarian database. The model is built upon secondary data from various sources amongst others in which the data varies from case to case. Therefore, the model is only as accurate as its data feed.
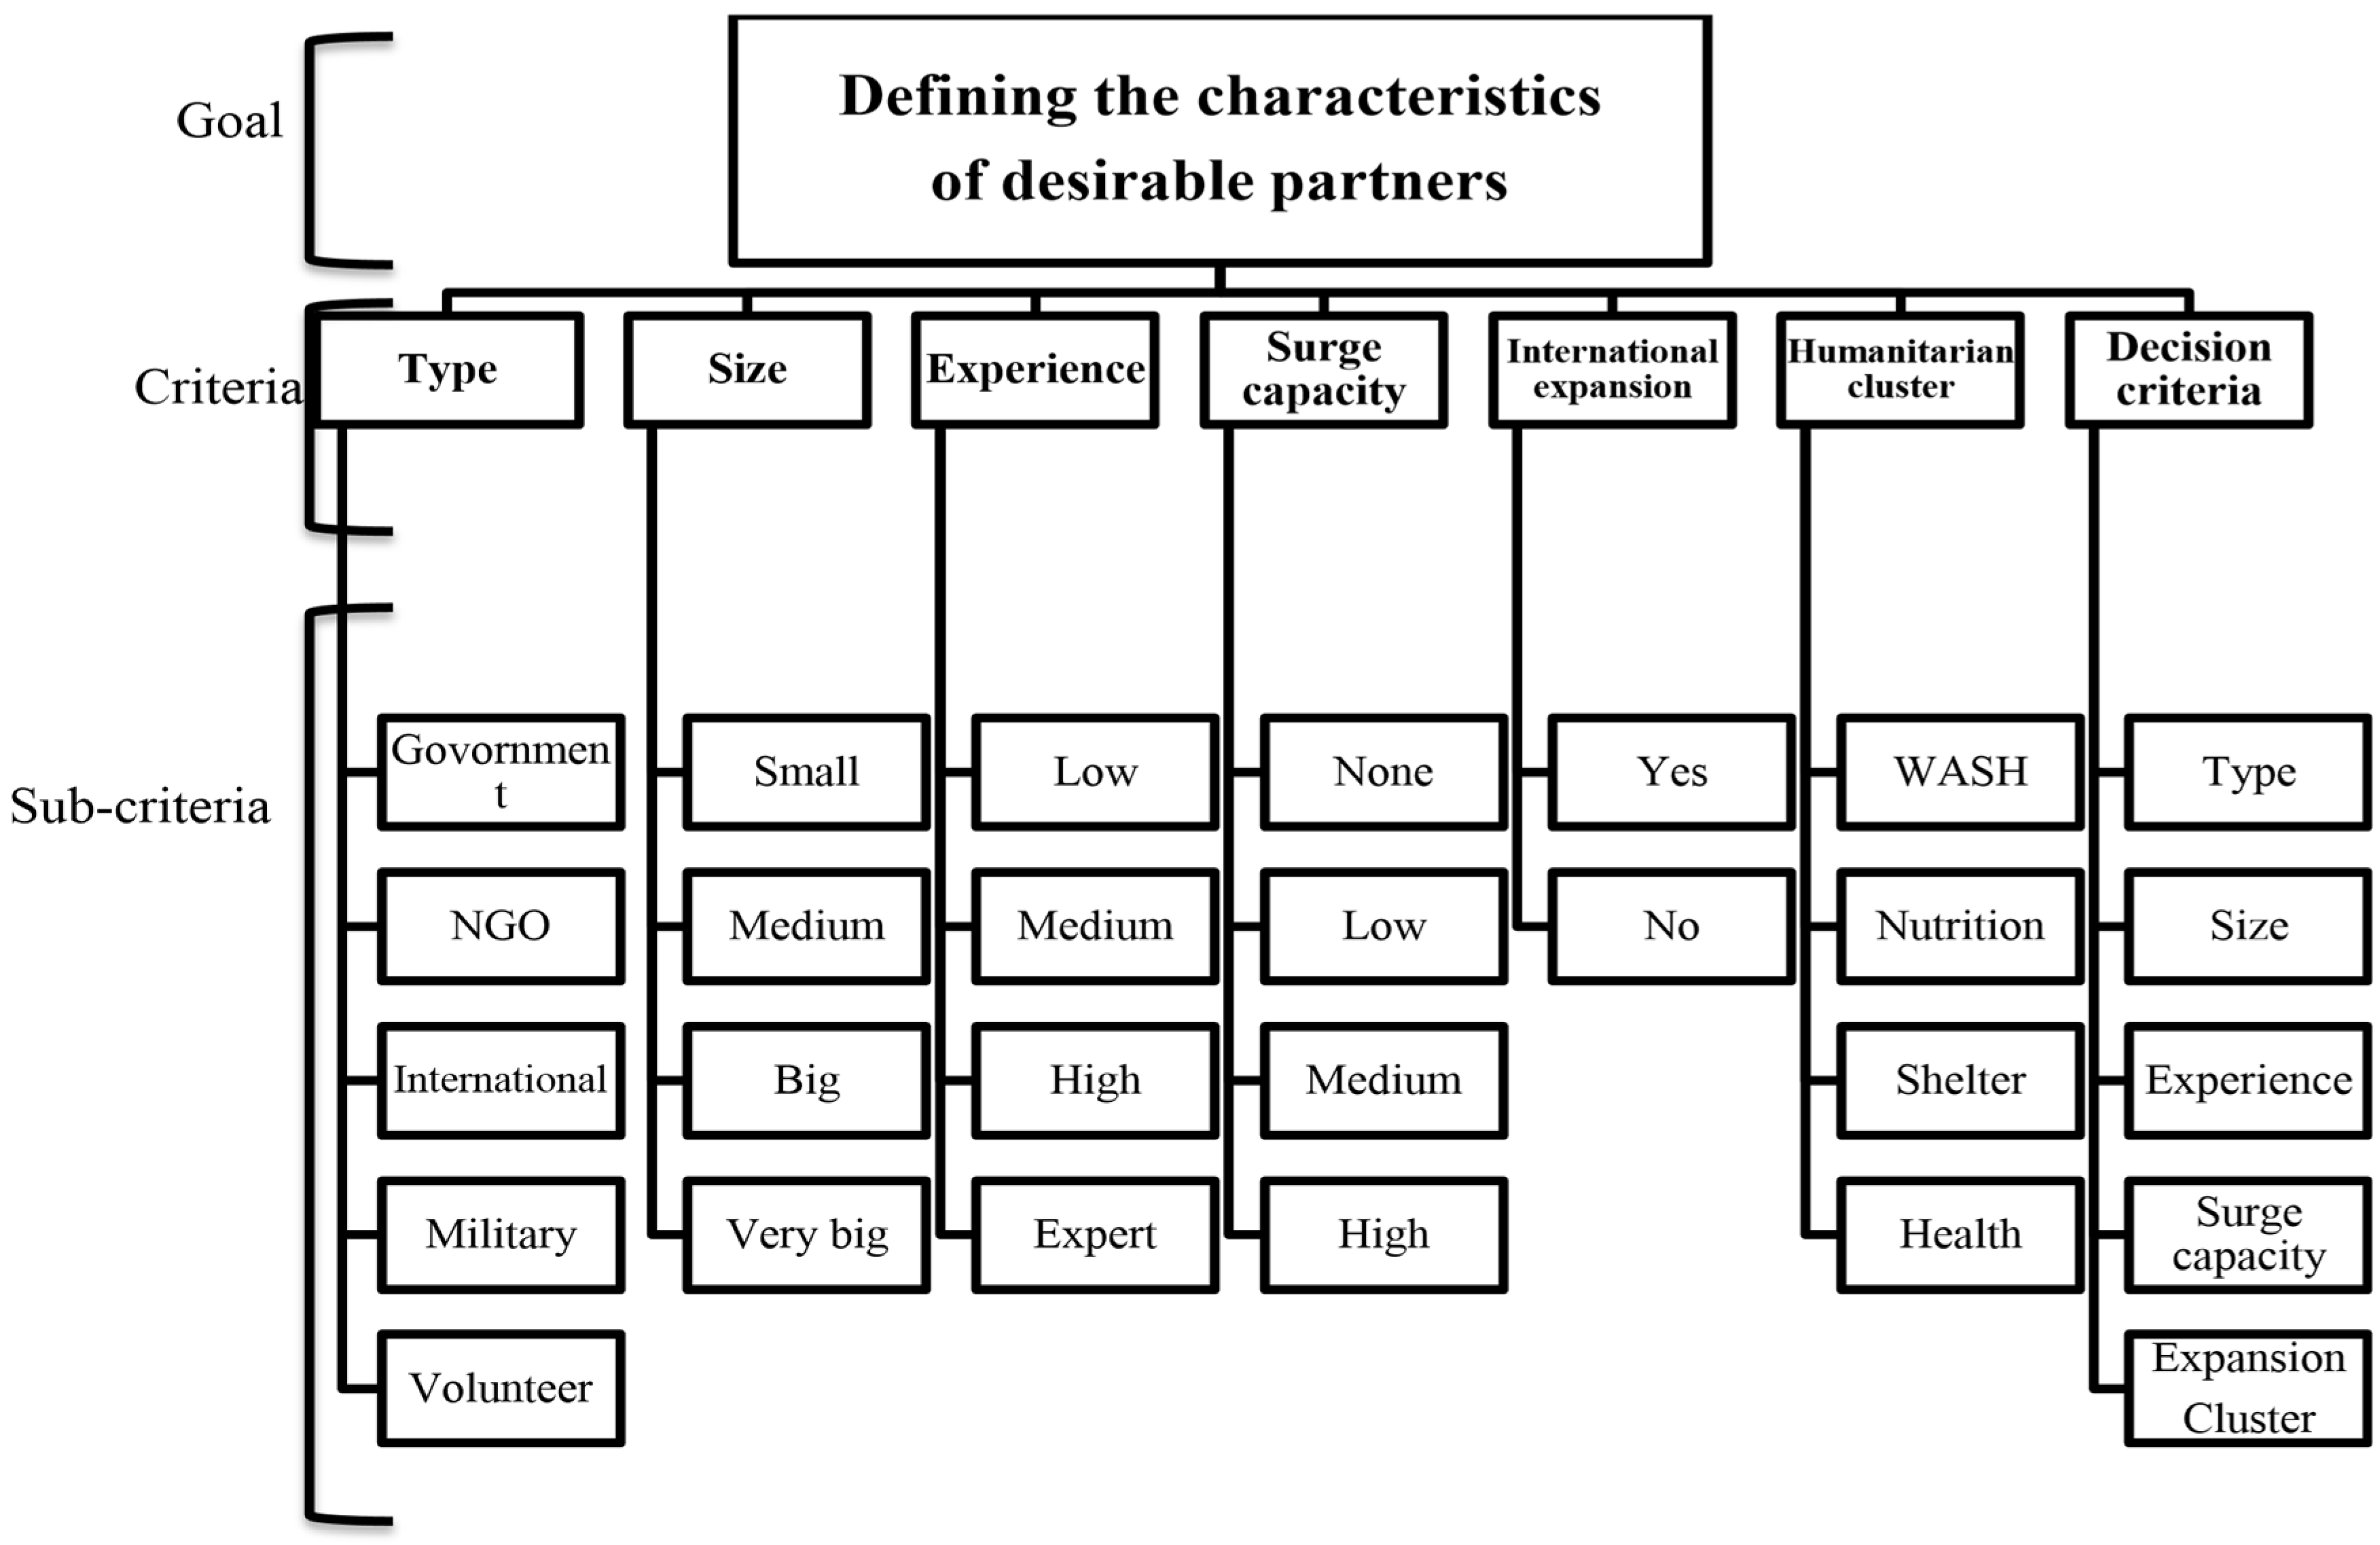
The fourth limitation is that the optimisation constraints in this model are just the resources, the optimisation could be improved if other constraints such as time and cost could be considered. This could also be improved if the tasks can be separately defined in detail, and then the task allocation and resources related to the allocated task of each supplier could be optimised. Although the contribution of the current study is its model, further empirical research is required to develop an extensive database for the potential humanitarian suppliers at the industry level. The future research direction could follow different paths. For example, the EDIS model is based on the resources-based optimisation, it considers the decision makers’ preference and characteristics in various other criteria such as experience, type, and size of the organisation, its surge capacity, and international expansion.
Further research is required to identify the actual non-resource based determinants of supplier selection in disaster response. Another suggestion is to provide a holistic research study involving all humanitarian actors to further identify and standardise the minimum requirements in a disaster response by considering the actual disaster type, and the geographical location and culture of each potential affected county. Another path could be the application of the EDIS model to various case studies and analyse the result and the areas of improvement. In addition, the EDIS model could be more accurately customised if it could analyse the data for each individual country, where it is possible to define exact scenarios for each disaster type, and the needs and suppliers required. This also may greatly improve the quality of estimations. The EDIS model is based on two major assumptions. The first assumption is that a pool of humanitarian partners already exists. However, creating and maintaining it requires the cooperation of the international humanitarian bodies.
The model cannot be fully tested before the creation of a standardised accredited database containing data on humanitarian partners, their selection criteria, and regular updates of the database. This project can be further discussed with international humanitarian entities with regard to the applicability of launching a universal initiative for gathering data and building a universal humanitarian database. Second, the model is built upon secondary data from various sources (Emdat.be, 2014, Munichre.com, 2014; ReliefWeb, 2013a; Gdacs.org, 2014), amongst others in which the data varies from case to case. Therefore, the model is only as accurate as its data feed. Although the contribution of the current study is its model, further empirical research is required to develop an extensive database for the potential humanitarian partners at the industry level.
The future research direction could follow different paths. For example, the EDIS model is based on the resources-based optimisation, it takes into account the decision makers’ preference and characteristics in various other criteria such as experience, type, and size of the organisation, its surge capacity, and international expansion. Further research is required to identify the actual non-resource-based determinants of partner selection in collaborative networks with the focus on disaster response. Another suggestion is to provide a holistic research study involving all humanitarian actors in order to further identify and standardise the minimum requirements in a disaster response by considering the actual disaster type, and the geographical location and culture of each potential affected county. Another path could be the application of the EDIS model to various case studies and analyse the result and the areas of improvement.

Author Contributions

Conceptualisation: S.R.; methodology: S.R.; validation: S.R.; formal analysis: S.R.; investigation: S.R.; resources: S.R.; writing—original draft preparation: S.R.; Writing—review and editing: E.A. and S.R.; visualitaion: S.R.; supervision: E.A.; project administration: S.R. All authors have read and agreed to the published version of the manuscript.

Funding

This research received no external funding.

Institutional Review Board Statement

The study was conducted in accordance with the Declaration of Helsinki, and approved by the Ethics Committee of Brunel University as part of a PhD dissertation approved in September 2014.

Informed Consent Statement

Informed consent was obtained from all subjects involved in the study.

Data Availability Statement

The data presented in this study are available on request from the corresponding author. The data are not publicly available due to privacy of the humanitarian participants.

Conflicts of Interest

The authors declare no conflict of interest.

References

  1. UNDRO. Shelter after Disaster; UNDRO: Geneva, Switzerland, 1982. [Google Scholar]
  2. UNDRO. An Overview of Disaster Management; UNDRO: Geneva, Switzerland, 1992. [Google Scholar]
  3. Environment Agency—What’s in Your Backyard? Available online: http://apps.environment-agency.gov.uk/wiyby/default.aspx (accessed on 15 February 2021).
  4. Russell, S.; Norvig, P. Artificial Intelligence: A Modern Approach. 1995. Available online: https://www.pearson.com/us/higher-education/program/Russell-Artificial-Intelligence-A-Modern-Approach-4th-Edition/PGM1263338.html (accessed on 29 April 2021).
  5. Tversky, A.; Kahneman, D. Judgment under Uncertainty: Heuristics and Biases. Science 1974, 185, 1124–1131. [Google Scholar] [CrossRef] [PubMed]
  6. Keykhah, M. The Shape of Uncertainty: Insurance Underwriting in the Face of Catastrophe Risk. Ph.D. Thesis, Oxford University, Oxford, UK, 2000. [Google Scholar]
  7. Moe, T.L.; Pathranarakul, P.; Kyne, D. An integrated approach to natural disaster management: Public project management and its critical success factors. Disaster Prev. Manag. Int. J. 2006, 15, 396–413. [Google Scholar] [CrossRef]
  8. Reinecke, I. International Disaster Response Law and the Coordination of International Organisations. ANU Undergrad. Res. J. 2010, 2, 143–163. [Google Scholar] [CrossRef]
  9. Tierney, K.; Trainor, J. Center Disaster; MCEER: Buffalo, NY, USA, 2004; pp. 157–172. [Google Scholar]
  10. Rolland, E.; Patterson, R.A.; Ward, K.; Dodin, B. Decision support for disaster management. Oper. Manag. Res. 2010, 3, 68–79. [Google Scholar] [CrossRef] [Green Version]
  11. Telford, J.; Cosgrave, H. Joint Evaluation of the International Response to the Indian Ocean Tsunami: Synthesis Report; Tsunami Evaluation Coalition (TEC): London, UK, 2006; ISBN 0 85003 807 3. [Google Scholar]
  12. Careem, M.; Silva, C.D.; Silva, R.D.; Raschidt, L.; Weerawarana, S. Sahana: Overview of a disaster management system. In Proceedings of the 2006 International Conference on Information and Automation, Shandong, China, 15–17 December 2006; pp. 361–366. [Google Scholar] [CrossRef]
  13. Inomata, T. Towards a United Nations Humanitarian Assistance Programme for Disaster Response and Reduction: Lessons Learned from the Indian Ocean Tsunami Disaster, Geneva. 2006. Available online: https://digitallibrary.un.org/record/601740 (accessed on 29 April 2021).
  14. Balcik, B.; Beamon, B.M.; Krejci, C.C.; Muramatsu, K.M.; Ramirez, M. Coordination in humanitarian relief chains: Practices, challenges and opportunities. Int. J. Prod. Econ. 2010, 126, 22–34. [Google Scholar] [CrossRef]
  15. Van Wassenhove, L.N. Humanitarian aid logistics: Supply chain management in high gear. J. Oper. Res. Soc. 2006, 57, 475–489. [Google Scholar] [CrossRef]
  16. Zhang, J.-H.; Li, J.; Liu, Z.-P. Multiple-resource and multiple-depot emergency response problem considering secondary disasters. Expert Syst. Appl. 2012, 39, 11066–11071. [Google Scholar] [CrossRef]
  17. Comfort, L.K. Crisis Management in Hindsight: Cognition, Communication, Coordination, and Control. Public Adm. Rev. 2007, 67, 189–197. [Google Scholar] [CrossRef]
  18. Oloruntoba, R.; Gray, R. Humanitarian aid: An agile supply chain? Supply Chain Manag. Int. J. 2006, 11, 115–120. [Google Scholar] [CrossRef]
  19. Pettit, S.; Beresford, A. Critical success factors in the context of humanitarian aid supply chains. Int. J. Phys. Distrib. Logist. Manag. 2009, 39, 450–468. [Google Scholar] [CrossRef]
  20. Altay, N.; Green, W.G., III. Interfaces with Other Disciplines OR/MS research in disaster operations management. Eur. J. Oper. Res. 2006, 175, 475–493. [Google Scholar] [CrossRef] [Green Version]
  21. Simpson, N.C.; Hancock, P.G. Fifty years of operational research and emergency response. J. Oper. Res. Soc. 2009, 60, S126–S139. [Google Scholar] [CrossRef]
  22. Sahebjamnia, N.; Torabi, S.A.; Mansouri, A. A hybrid decision support system for managing humanitarian relief chains. Decis. Support Syst. 2017, 95, 12–26. [Google Scholar] [CrossRef] [Green Version]
  23. Nappi, M.M.L.; Souza, J.C. Disaster management: Hierarchical structuring criteria for selection and location of temporary shelters. Nat. Hazards 2014, 75, 2421–2436. [Google Scholar] [CrossRef]
  24. Cavdur, F.; Sebatli, A. A decision support tool for allocating temporary-disaster-response facilities. Decis. Support Syst. 2019, 127, 113145. [Google Scholar] [CrossRef]
  25. Mikhailov, L. Fuzzy analytical approach to partnership selection in formation of virtual enterprises. Omega 2002, 30, 393–401. [Google Scholar] [CrossRef]
  26. Sarkis, J.; Talluri, S.; Gunasekaran, A. A strategic model for agile virtual enterprise partner selection. Int. J. Oper. Prod. Manag. 2007, 27, 1213–1234. [Google Scholar] [CrossRef]
  27. Huang, M.; Fan, C. Research on the Partner Selection of Virtual Enterprise Based on Self-adaptive Genetic Algorithm. In Proceedings of the Third International Conference on Intelligent Information Hiding and Multimedia Signal Processing (IIH-MSP 2007), Kaohsiung, Taiwan, 26–28 November 2007. [Google Scholar]
  28. Xiang, D.; Li, Q. Study on Partner Selection Method for Construction Supply Chain Using Tabu? Search Algorithm. In Proceedings of the 2012 International Conference on Information Management, Innovation Management and Industrial Engineering, Sanya, China, 20–21 October 2012; pp. 122–125. [Google Scholar]
  29. Mohamed, A.M.; Abdelsalam, H.M. Optimal Composition of Virtual Enterprises with Interval Cost Parameters. In Proceedings of the 2012 8th International Conference on Informatics and Systems (INFOS), Giza, Egypt, 14–16 May 2012. [Google Scholar]
  30. Zeng, Z.; Li, Y.; Li, S.; Zhu, W. A New Algorithm for Partner Selection in Virtual Enterprise. In Proceedings of the Sixth International Conference on Parallel and Distributed Computing Applications and Technologies (PDCAT’05), Dalian, China, 5–8 December 2005; pp. 884–886. [Google Scholar] [CrossRef]
  31. Zhan, J. A Novel Partner Selection Solution Based on the Clonal Selection Algorithm. In Proceedings of the 2008 International Conference on Information Management, Innovation Management and Industrial Engineering, Taipei, Taiwan, 19–21 December 2008; Volume 1, pp. 191–194. [Google Scholar] [CrossRef]
  32. Zhan, J. A Binary Ant Algorithm for Partner Selection Problem in the Virtual Enterprise. In Proceedings of the 2009 International Conference on E-Business and Information System Security, Wuhan, China, 23–24 May 2009; pp. 1–4. [Google Scholar] [CrossRef]
  33. Xiao, J.; Qi, F.; Li, Y. Gravitational chaotic search algorithm for partners selection with due date constraint in virtual enterprise. In Proceedings of the Fourth International Workshop on Advanced Computational Intelligence, Wuhan, China, 19–21 October 2011; pp. 138–142. [Google Scholar] [CrossRef]
  34. Jana, S.; Majumder, R.; Menon, P.P.; Ghose, D. Decision Support System (DSS) for Hierarchical Allocation of Resources and Tasks for Disaster Management. Oper. Res. Forum 2022, 3, 1–30. [Google Scholar] [CrossRef]
  35. Hashemipour, M.; Stuban, S.M.F.; Dever, J.R. A community-based disaster coordination framework for effective disaster preparedness and response. Aust. J. Emerg. Manag. 2017, 32, 41. [Google Scholar]
  36. Li, X.; Pu, W.; Zhao, X. Agent action diagram: Toward a model for emergency management system. Simul. Model. Pract. Theory 2019, 94, 66–99. [Google Scholar] [CrossRef]
  37. Wang, Z.; Zhang, J. Agent-based evaluation of humanitarian relief goods supply capability. Int. J. Disaster Risk Reduct. 2019, 36, 101105. [Google Scholar] [CrossRef]
  38. Othman, S.B.; Zgaya, H.; Dotoli, M.; Hammadi, S. Supply Chains. Control Eng. Pract. 2017, 59, 27–43. [Google Scholar] [CrossRef]
  39. Wang, F.; Pei, Z.; Dong, L.; Ma, J. Emergency Resource Allocation for Multi-Period Post-Disaster Using Multi-Objective Cellular Genetic Algorithm. IEEE Access 2020, 8, 82255–82265. [Google Scholar] [CrossRef]
  40. Faiz, T.I.; Vogiatzis, C.; Noor-E-Alam, M. A Column Generation Algorithm for Vehicle Scheduling and Routing Problems. Comput. Ind. Eng. 2019, 130, 222–236. [Google Scholar] [CrossRef] [Green Version]
  41. Sun, J.; Zhang, Z. A post-disaster resource allocation framework for improving resilience of interdependent infrastructure networks. Transp. Res. Part D Transp. Environ. 2020, 85, 102455. [Google Scholar] [CrossRef]
  42. Joshi, S.; Sharma, M.; Das, R.P.; Muduli, K.; Raut, R.; Narkhede, B.E.; Shee, H.; Misra, A. Assessing Effectiveness of Humanitarian Activities against COVID-19 Disruption: The Role of Blockchain-Enabled Digital Humanitarian Network (BT-DHN). Sustainability 2022, 14, 1904. [Google Scholar] [CrossRef]
  43. Das, R.; Hanaoka, S. An agent-based model for resource allocation during relief distribution. J. Humanit. Logist. Supply Chain Manag. 2014, 4, 265–285. [Google Scholar] [CrossRef]
  44. Doan, X.V.; Shaw, D. Resource allocation when planning for simultaneous disasters. Eur. J. Oper. Res. 2019, 274, 687–709. [Google Scholar] [CrossRef]
  45. Majumder, R.; Warier, R.R.; Ghose, D. Game-Theoretic Model Based Resource Allocation During Floods. arXiv 2021, arXiv:2112.01439. [Google Scholar]
  46. Nagurney, A.; Flores, E.A.; Soylu, C. A Generalized Nash Equilibrium Network Model for Post-Disaster Humanitarian Relief. Anna. Rev. CENIC Cienc. Biol. 2016, 152, 28. Available online: https://supernet.isenberg.umass.edu/articles/Generalized_Nash_Equilibrium_for_Disaster_Relief.pdf (accessed on 13 September 2022). [CrossRef]
  47. Yu, C.X.; Wong, T.N.; Wang, G. An agent-based negotiation model to support partner selection in a virtual enterprise. In Proceedings of the 40th International Conference on Computers & Indutrial Engineering, Awaji, Japan, 25–28 July 2010; pp. 1–6. [Google Scholar] [CrossRef] [Green Version]
  48. Zhang, Y.; Geng, Z. Simulation analysis based on Multi-Agent for partner selection of cooperative R&D in virtual enterprise. In Proceedings of the 2010 Sixth International Conference on Natural Computation, Yantai, China, 10–12 August 2010; pp. 2940–2943. [Google Scholar] [CrossRef]
  49. Yang, F.; Lin, P.-G.; Xu, R.-Z. An Emergency-Driven Virtual Organization Model for Emergency Management Based on Ontology. In Proceedings of the 2008 4th International Conference on Wireless Communications, Networking and Mobile Computing, Dalian, China, 12–14 October 2008; pp. 1–4. [Google Scholar] [CrossRef]
  50. Mun, J.; Shin, M.; Jung, M. A goal-oriented trust model for virtual organization creation. J. Intell. Manuf. 2009, 22, 345–354. [Google Scholar] [CrossRef]
  51. Baldo, F.; Rabelo, R.J.; Vallejos, R. A framework for selecting performance indicators for virtual organisation partners’ search and selection. Int. J. Prod. Res. 2009, 47, 4737–4755. [Google Scholar] [CrossRef]
  52. Schätter, F.; Hansen, O.; Wiens, M.; Schultmann, F. A decision support methodology for a disaster-caused business continuity management. Decis. Support Syst. 2019, 118, 10–20. [Google Scholar] [CrossRef]
  53. Chaudhuri, N.; Bose, I. Exploring the role of deep neural networks for post-disaster decision support. Decis. Support Syst. 2020, 130, 113234. [Google Scholar] [CrossRef]
  54. Chacko, J.; Rees, L.P.; Zobel, C.W.; Rakes, T.R.; Russell, R.S.; Ragsdale, C.T. Decision support for long-range, community-based planning to mitigate against and recover from potential multiple disasters. Decis. Support Syst. 2016, 87, 13–25. [Google Scholar] [CrossRef] [Green Version]
  55. Arora, H.; Raghu, T.; Vinze, A. Resource allocation for demand surge mitigation during disaster response. Decis. Support Syst. 2010, 50, 304–315. [Google Scholar] [CrossRef]
  56. Lin, C.-W.R.; Chen, H.-Y.S. A fuzzy strategic alliance selection framework for supply chain partnering under limited evaluation resources. Comput. Ind. 2004, 55, 159–179. [Google Scholar] [CrossRef]
  57. Li, X.; Wang, J.; Yu, Y. An Optimal Partner Selection Approach Based on Prospect Theory. In Proceedings of the 2008 IEEE Symposium on Advanced Management of Information for Globalized Enterprises (AMIGE), Tianjin, China, 28–29 September 2008; pp. 1–5. [Google Scholar] [CrossRef]
  58. Erkayman, B.; Gundogar, E.; Yılmaz, A. An Integrated Fuzzy Approach for Strategic Alliance Partner Selection in Third-Party Logistics. Sci. World J. 2012, 2012, 486306. [Google Scholar] [CrossRef] [Green Version]
  59. Kara, S.S.; Ayadi, O.; Cheikhrouhou, N. An Extensive Group Decision Methodology for Alliance Partner Selection Problem in Collaborative Networked Organisations. Int. J. Appl. Logist. 2012, 3, 1–19. [Google Scholar] [CrossRef]
  60. Lavrac, N.; Ljubic, P.; Urbancic, T.; Papa, G.; Jermol, M.; Bollhalter, S. Trust Modeling for Networked Organizations Using Reputation and Collaboration Estimates. IEEE Trans. Syst. Man Cybern. Part C Appl. Rev. 2008, 37, 429–439. [Google Scholar] [CrossRef] [Green Version]
  61. Chang, M.-S.; Tseng, Y.-L.; Chen, J.-W. A scenario planning approach for the flood emergency logistics preparation problem under uncertainty. Transp. Res. Part E Logist. Transp. Rev. 2007, 43, 737–754. [Google Scholar] [CrossRef]
  62. Wu, C.; Barnes, D.; Rosenberg, D.; Luo, X. An analytic network process-mixed integer multi-objective programming model for partner selection in agile supply chains. Prod. Plan. Control 2009, 20, 254–275. [Google Scholar] [CrossRef]
  63. Zhao, L.; Fu, J.L. Game Analysis on Reputation Signals Restricting the Adverse Selection from Alliance Partners. In Proceedings of the 2011 IEEE International Conference on Grey Systems and Intelligent Services, Nanjing, China, 15–18 September 2011; pp. 163–165. [Google Scholar]
  64. Kannan, D.; Khodaverdi, R.; Olfat, L.; Jafarian, A.; Diabat, A. Integrated fuzzy multi criteria decision making method and multi-objective programming approach for supplier selection and order allocation in a green supply chain. J. Clean. Prod. 2013, 47, 355–367. [Google Scholar] [CrossRef]
  65. Peng, Y.; Zhang, Y.; Tang, Y.; Li, S. An incident information management framework based on data integration, data mining, and multi-criteria decision making. Decis. Support Syst. 2011, 51, 316–327. [Google Scholar] [CrossRef]
  66. Ustun, O.; Demirtas, E.A. An integrated multi-objective decision-making process for multi-period lot-sizing with supplier selection. Omega 2008, 36, 509–521. [Google Scholar] [CrossRef]
  67. Jarimo, T.; Salo, A. Multicriteria Partner Selection in Virtual Organizations With Transportation Costs and Other Network Interdependencies. IEEE Trans. Syst. Man Cybern. Part C Appl. Rev. 2008, 39, 124–129. [Google Scholar] [CrossRef]
  68. Mircea, I.; Şerban, R.; Todose, D. Linear programming models applied in selection of partners in a virtual organization. In Proceedings of the 4th International Conference of ASECU–Development: Cooperation and Competitiveness, Bucharest, Romania, 22–24 May 2008; pp. 22–24. [Google Scholar]
  69. Amailef, K.; Lu, J. Ontology-supported case-based reasoning approach for intelligent m-Government emergency response services. Decis. Support Syst. 2013, 55, 79–97. [Google Scholar] [CrossRef]
  70. Keenan, P.B.; Jankowski, P. Spatial Decision Support Systems: Three decades on. Decis. Support Syst. 2018, 116, 64–76. [Google Scholar] [CrossRef]
  71. Özdamar, L.; Ekinci, E.; Küçükyazici, B. Emergency Logistics Planning in Natural Disasters. Ann. Oper. Res. 2004, 129, 217–245. [Google Scholar] [CrossRef]
  72. Maon, F.; Lindgreen, A.; Vanhamme, J. Developing supply chains in disaster relief operations through cross-sector socially oriented collaborations: A theoretical model. Supply Chain Manag. Int. J. 2009, 14, 149–164. [Google Scholar] [CrossRef]
  73. Eßig, M.; Tandler, S. Disaster Response Supply Chain Management (SCM): Integration of Humanitarian and Defence Logistics by Means of SCM. In Economic Impacts of Crisis Response Operations—An Underestimated Factor in External Engagement; Landesverteidigungsakademie (LVAk)/Institut für Friedenssicherung und Konfliktmanagement (IFK): Vienna, Austria, 2009; pp. 283–310. [Google Scholar]
  74. Tatham, P.; Spens, K. Towards a humanitarian logistics knowledge management system. Disaster Prev. Manag. Int. J. 2011, 20, 6–26. [Google Scholar] [CrossRef] [Green Version]
  75. Wu, C.; Barnes, D. A dynamic feedback model for partner selection in agile supply chains. Int. J. Oper. Prod. Manag. 2012, 32, 79–103. [Google Scholar] [CrossRef]
  76. van Zutphen, T.; Damerell, J. Sphereproject, Humanitarian Charter and Minimum Standards in Humanitarian Response. 2011. Available online: www.practicalactionpublishing.org/sphere (accessed on 15 February 2016).
  77. IASC. Cluster Approach (IASC)—UNHCR|Emergency Handbook. Available online: https://emergency.unhcr.org/entry/41813/cluster-approach-iasc (accessed on 15 February 2021).
  78. van Andrew Collins, A.; Maunder, N.; McNabb, M. World Disaster Report, Geneva. 2009. Available online: https://reliefweb.int/report/world/world-disasters-report-2009-focus-early-warning-early-action (accessed on 15 February 2016).
  79. U.S. Department of Homeland Security. Target Capabilities List; U.S. Department of Homeland Security: Washington, DC, USA, 2007.
  80. IFRC. IFRC Shelter Kit; IFRC: Geneva, Switzerland, 2009. [Google Scholar]
  81. OCHA. Multi/Cluster-Sector Initial & Rapid Assessment (MIRA) Community Level Assessment; OCHA: New York, NY, USA, 2013; pp. 1–26. [Google Scholar]
  82. ECB. A Case Study: Joint Needs Assessment after the West Sumatra Earthquake; ECB: Frankfurt, Germany, 2009; pp. 1–7. [Google Scholar]
  83. UNICEF. Emergency Handbook; UNICEF: New York, NY, USA, 2005. [Google Scholar]
  84. IFRC; UN-HABITAT; UNHCR. Shelter Project 2010. Available online: https://reliefweb.int/report/world/shelter-projects-2010 (accessed on 15 February 2021).
  85. World Health Organisation. Classification and Minimum Standards for Foreign Medical Teams in Sudden Onset; World Health Organisation: Geneva, Switzerland, 2013; Available online: https://www.who.int/publications/i/item/classification-and-minimum-standards-for-foreign-medical-teams-in-sudden-onset-of-disasters (accessed on 15 February 2021).
  86. World Health Organization. SpringerReference; World Health Organisation: Geneva, Switzerland, 2012. [Google Scholar] [CrossRef]
  87. GHC. Global Health Cluster Partners’ Survey; GHC: Glasgow, UK, 2012; pp. 1–30. [Google Scholar]
  88. IFRC. Disaster Emergency Needs Assessment; IFRC: Geneva, Switzerland, 2000. [Google Scholar]
  89. OCHA. Multi-Sect tor Initial Rapid Assessmment (MIIRA) Report Pakistan Floods; OCHA: New York, NY, USA, 2012. [Google Scholar]
  90. OCHA. Central African Republic Multi-Cluster/Sector Initial Rapid Assessment; OCHA: New York, NY, USA, 2014. [Google Scholar]
  91. OCHA. Joint Rapid Damage and Needs Assessment Report; OCHA: New York, NY, USA, 2013. [Google Scholar]
  92. OCHA. Multi-Sector Initial Rapid Assessment for Pakistan (MIRA) In Preparedness for Disasters and Emergencies A Joint Initiative between Government & the Humanitarian Community; OCHA: New York, NY, USA, 2012. [Google Scholar]
  93. OCHA. MIRA Multi-Cluster/Sector Initial Rapid Assessment Philippines Typhoon Haiyan; OCHA: New York, NY, USA, 2013. [Google Scholar]
  94. OCHA. Inter-Agency Initial Rapid Needs Assessment Preliminary Report; OCHA: New York, NY, USA, 2013. [Google Scholar]
  95. OCHA. The Philippines Second-Phase Multi Cluster Rapid Needs Assessment for Tropical Storm Washi (Sendong); OCHA: New York, NY, USA, 2012; pp. 17–19. [Google Scholar]
  96. OXFAM. SYLHET Phase 1 Rapid Emergency Assessment; OXFAM: Oxford, UK, 2012. [Google Scholar]
  97. Association for Healthcare Resource and Materials Management; The Health Industry Distributors Association; The Health Industry Group Purchasing Association. Medical-Surgical Supply Formulary by Disaster Scenario. Available online: https://www.kyha.com/assets/docs/PreparednessDocs/disasterformulary.pdf (accessed on 15 February 2021).
  98. VOAD. National Voluntary Organizations Active in Disaster. 2011. Available online: https://www.nvoad.org/ (accessed on 15 February 2021).
  99. Hartwell-Naguib, S.; Roberts, N. Winter Floods 2013/14. 2014. Available online: https://researchbriefings.files.parliament.uk/documents/SN06809/SN06809.pdf (accessed on 15 February 2021).
  100. Morgan, O.W.; Sribanditmongkol, P.; Perera, C.; Sulasmi, Y.; Van Alphen, D.; Sondorp, E. Mass Fatality Management following the South Asian Tsunami Disaster: Case Studies in Thailand, Indonesia, and Sri Lanka. PLoS Med. 2006, 3, e195. [Google Scholar] [CrossRef] [Green Version]
  101. Tabbara, L. Emergency Relief Logistics: Evaluation of Disaster Response Models Based on Asian Tsunami Logistics Response. In Based on Asian Tsunami Logistics Response. 2008. Available online: http://driverspack.org/download/agile-framework-rmcproject (accessed on 15 February 2021).
  102. IFRC/ICRC Emergency Items Catalogue|Shelter Cluster, (n.d.). Available online: https://www.sheltercluster.org/working-group-nfi-practices/documents/ifrcicrc-emergency-items-catalogue (accessed on 15 February 2021).
  103. Crispim, J.A.; De Sousa, J.P. Partner selection in virtual enterprises: A multi-criteria decision support approach. Int. J. Prod. Res. 2009, 47, 4791–4812. [Google Scholar] [CrossRef] [Green Version]
  104. Barringer, B.R.; Harrison, J.S. Walking a Tightrope: Creating Value Through Interorganizational Relationships. J. Manag. 2000, 26, 367–403. [Google Scholar] [CrossRef]
  105. Baas, S.R.; Battista, S.; Federica, J. Disaster Risk Management Systems Analysis, PreventionWeb, Rome. 2008. Available online: https://www.preventionweb.net/publication/disaster-risk-management-systems-analysis-guide-book (accessed on 15 February 2021).
  106. Fuqing, Z.; Yi, H.; Dongmei, Y. A multi-objective optimization model of the partner selection problem in a virtual enterprise and its solution with genetic algorithms. Int. J. Adv. Manuf. Technol. 2005, 28, 1246–1253. [Google Scholar] [CrossRef]
  107. Zhao, J.; Jiao, L.; Xia, S.; Fernandes, V.B.; Yevseyeva, I.; Zhou, Y.; Emmerich, M.T. Multiobjective sparse ensemble learning by means of evolutionary algorithms. Decis. Support Syst. 2018, 111, 86–100. [Google Scholar] [CrossRef]
  108. Lee, J.; Bharosa, N.; Yang, J.; Janssen, M.; Rao, H. Group value and intention to use—A study of multi-agency disaster management information systems for public safety. Decis. Support Syst. 2011, 50, 404–414. [Google Scholar] [CrossRef]
  109. Petkov, D.; Petkova, O.; Andrew, T.; Nepal, T. Mixing Multiple Criteria Decision Making with soft systems thinking techniques for decision support in complex situations. Decis. Support Syst. 2007, 43, 1615–1629. [Google Scholar] [CrossRef]
  110. Fertier, A.; Barthe-Delanoë, A.-M.; Montarnal, A.; Truptil, S.; Bénaben, F. A new emergency decision support system: The automatic interpretation and contextualisation of events to model a crisis situation in real-time. Decis. Support Syst. 2020, 133, 113260. [Google Scholar] [CrossRef]
  111. Hall, D.; Guo, Y.; Davis, R.A.; Cegielski, C. Extending Unbounded Systems Thinking with agent-oriented modeling: Conceptualizing a multiple perspective decision-making support system. Decis. Support Syst. 2005, 41, 279–295. [Google Scholar] [CrossRef]
  112. Talluri, S.; Baker, C. A quantitative framework for designing efficient business process alliances. In Proceedings of the International Conference on Engineering and Technology Management, Managing Virtual Enterprises: A Convergence of Communications, Computing, and Energy Technologies (IEMC 96), Vancouver, BC, USA, 18–20 August 1996; pp. 656–661. [Google Scholar] [CrossRef]
  113. Qiu, J.; Wang, Z.; Ye, X.; Liu, L.; Dong, L. Modeling method of cascading crisis events based on merging Bayesian Network. Decis. Support Syst. 2014, 62, 94–105. [Google Scholar] [CrossRef]
  114. Gardašević-Filipović, M.Z.Š. Multicriteria Optimization in a Fuzzy Environment: The fuzzy analytic hierarchy, Yugosl. J. Oper. Res. 2010, 20, 71–85. [Google Scholar]
  115. Hasani, S.; El-Haddadeh, R.; Aktas, E. A disaster severity assessment decision support tool for reducing the risk of failure in response operations. In Risk Analysis IX; Wessex Institute of Technology: Southampton, UK, 2014. [Google Scholar] [CrossRef] [Green Version]
  116. Hans, C. Supporting partner identification for virtual organisations in manufacturing. J. Manuf. Technol. Manag. 2008, 19, 497–513. [Google Scholar] [CrossRef]
  117. Hodgett, R.E. Multi-Criteria Decision-Making in Whole Process Design. Ph.D. Thesis, Newcastle University, Newcastle upon Tyne, UK, 2013. [Google Scholar]
  118. Verdecho, M.-J.; Alfaro-Saiz, J.-J.; Rodriguez-Rodriguez, R. Prioritization and management of inter-enterprise collaborative performance. Decis. Support Syst. 2012, 53, 142–153. [Google Scholar] [CrossRef] [Green Version]
  119. Liao, C.-N.; Kao, H.-P. An integrated fuzzy TOPSIS and MCGP approach to supplier selection in supply chain management. Expert Syst. Appl. 2011, 38, 10803–10811. [Google Scholar] [CrossRef]
  120. Zolghadri, M.; Amrani, A.; Zouggar, S.; Girard, P. Power assessment as a high-level partner selection criterion for new product development projects. Int. J. Comput. Integr. Manuf. 2011, 24, 312–327. [Google Scholar] [CrossRef] [Green Version]
  121. Badea, A.; Prostean, G.; Goncalves, G.; Allaoui, H. Assessing Risk Factors in Collaborative Supply Chain with the Analytic Hierarchy Process (AHP). Procedia Soc. Behav. Sci. 2014, 124, 114–123. [Google Scholar] [CrossRef] [Green Version]
  122. Shuai, J.-J. A Fuzzy MCDM Partnership Selection Model—Case of the IC Design House. In Proceedings of the 2009 Fourth International Conference on Innovative Computing, Information and Control (ICICIC), Kaohsiung, Taiwan, 7–9 December 2009; pp. 1452–1455. [Google Scholar] [CrossRef]
  123. Unu-ehs, WorldRisk Report. 2011. Available online: https://reliefweb.int/report/world/worldriskreport-2011-can-disaster-be-prevented (accessed on 27 January 2021).
  124. OCHA. WorldRiskReport 2012: Environmental Degradation Increases Disaster Risk Worldwide. 2012. Available online: https://reliefweb.int/report/world/world-risk-report-2012-environmental-degradation-increases-disaster-risk-worldwide (accessed on 27 January 2021).
  125. Fiedrich, F.; Gehbauer, F.; Rickers, U. Optimized resource allocation for emergency response after earthquake disasters. Saf. Sci. 2000, 35, 41–57. [Google Scholar] [CrossRef]
  126. Nourjou, R.; Hatayama, M.; Tatano, H. Introduction to spatially distributed intelligent assistant agents for coordination of human-agent teams’ actions. In Proceedings of the 2011 IEEE International Symposium on Safety, Security, and Rescue Robotics, Kyoto, Japan, 1–5 November 2011; pp. 251–258. [Google Scholar] [CrossRef]
  127. Kangas, M. Creative and playful learning: Learning through game co-creation and games in a playful learning environment. Think. Ski. Creat. 2010, 5, 1–15. [Google Scholar] [CrossRef]
  128. Zografos, K.G.; Androutsopoulos, K.N. A decision support system for instegrated hazardous materials routing and emergency response decisions. Transp. Res. Part C Emerg. Technol. 2008, 16, 684–703. [Google Scholar] [CrossRef]
  129. Schneider, P.J.; Schauer, B.A. HAZUS—Its Development and Its Future. Nat. Hazards Rev. 2006, 7, 40–44. [Google Scholar] [CrossRef]
  130. Available online: https://gisf.ngo/wp-content/uploads/2014/09/0158-World-Vision-2008-HISS-CAM-flowchart.pdf (accessed on 17 February 2021).
Figure 1. Partner’s entry pattern into the affected area of Hurricane Katrina. Source: Comfort (2007).
Sustainability 14 13423 g001
Figure 2. The requirements of the disaster affected area.
Sustainability 14 13423 g002
Figure 3. Inputs and outputs of the paper.
Sustainability 14 13423 g003
Figure 4. Components of the questionnaire about the selection decision.
Sustainability 14 13423 g004
Figure 5. A snapshot of the process of calculating AHP preference.
Sustainability 14 13423 g005
Table 1. Data sources for needs-assessment.
Title of the ReportPublisher
A Case Study: Joint Needs Assessment after the West Sumatra EarthquakeECB (2009)
Global Health Cluster Partners’ surveyGHC. (2012),
Winter floods 2013/14Hartwell-naguib and Roberts (2014)
Disaster emergency needs assessmentIFRC (2000)
IFRC shelter kitIFRC (2009a)
World disaster reportIFRC (2009b)
Mass fatality management following the South Asian tsunami disaster: case studies in Thailand, Indonesia, and Sri LankaMorgan et al. (2006)
Multi/cluster-sector initial and rapid assessment (MIRA) Community level assessmentOCHA (n.d)
MIRA report—Pakistan FloodsOCHA (2012a)
MIRA report -In preparedness for disasters and emergencies A joint initiative between Government and the humanitarian communityOCHA (2012b)
MIRA Report Pakistan FloodsOCHA (2012c)
The Philippines second-phase MIRA report for tropical storm WASHI (Sending)OCHA (2012d)
Inter-agency initial rapid needs assessment preliminary report, (October).OCHA (2013a)
Joint Rapid Damage and Needs Assessment Report,OCHA (2013b)
MIRA report Philippines typhoon Haiyan.OCHA (2013c)
Central African republic multi-cluster/sector initial rapid assessmentOCHA (2014)
Sylhet phase 1 rapid emergency assessmentOXFAM (2012)
Emergency Relief Logistics: Evaluation of Disaster Response Models Based on Asian Tsunami Logistics Response.Patrice (2008)
Target capabilities listU.S department of homeland security (2007)
Medical-surgical supply formulary by disaster scenario.AHRMM and HIDA and HIGPA (n.d.)
The sphere projectSphere project (2011)
Shelter after disasterUNDRO (1982)
An Overview of Disaster Management.UNDRO (1992)
Shelter projectUNHCR (2010)
Emergency handbookUNICEF (2005)
National voluntary organisations active in disasterVOAD (2011)
Management of dead bodies after disastersWHO (2011)
Classification and minimum standards for foreign medical teams in sudden onsetWHO (2013)
Table 2. Weights of the effects in various types of disasters.
EffectClusterComplex EmergencyEarthquakeHigh WindFloodTsunamiEruption
DeathsFatality management55335Varies *
Severe injuriesHealth ClusterVaries *54334
Increased risk of communicable diseasesWASH cluster7Varies *1Varies *Varies *5
Food scarcityFood cluster622Varies *65
Major population displacementsShelter cluster6226Varies *6
* The word “varies” is transferred from its original [76] and implies that the different records and scholars never agreed on a number on the specific disasters.
Table 3. The examples of minimum requirements for life saving activities.
Humanitarian ClusterSpecificationPer PersonPer Household
WASHTransportation containers (10–20 L)N/a1
Storage containers (10–20 L)N/a1
Blankets1
Total basic water needs7.5–15 L/day
Patients60 L/day
Open wells1/400
Toilets1/50 people
NutritionSalt, iodised edible11
Fish, canned, sardines, vegetable oil, 150 g21
Pasta, durum wheat meal11
Rice, white, long grain, irri6/211
Oil, rapeseed11
Beans, white, small11
Shelter and settlementTarpaulins (4 m × 6 m) 1
Ropes (30 m) 1
Saws 1
Roding, small and largo nail (1/2 kg each) 1
Shovels 1
Hoe 1
Machete 1
Health clusterDoctors4.57100
Nurses5.9100
Others6100
Table 4. Criteria suitable for disaster response DSS.
MethodAccommodating Preference Subjective ValuesRank Reversal ProblemAccommodate the Interaction of Subjective Expert AdviseOnly Offers Local OptimalDifficult for Average UserRequire Strong Data Set
AHPYESYES
ANP YESYES
Heuristic algorithms NO
Evolutionary Algorithm NO
Fuzzy logic NO
Neural network NO
TOPSIS
Mathematical programming NO
Table 5. Comparing two different disasters with their weights.
YearOriginCluster WeightLack of Coping CapabilitySusceptibilityCluster Weight for EarthquakeCluster Priority
2005PakistanFOOD 38.845=38.84 × 5 = 194.2
WASH 38.845=38.84 × 5 = 194.2
Health87.39 Varies87.39
Shelter 2=100 × 2 = 200
Other (Fatality) 2=100 × 2 = 200
2011New ZealandFOOD 16.195=16.19 × 5 = 80.95
WASH 16.195=16.19 × 5 = 80.95
Health39.79 Varies39.79
Shelter 2=100 × 2 = 200
Other (Fatality) 2=100 × 2 = 200
Table 6. Needs estimation for Pakistan earthquake 2005.
Humanitarian ClusterSpecificationPer PersonNumberEstimated NeedCluster Priority
WASHTransportation containers (10–20 L)0.22,800,000560,000194
Storage containers (10–20 L)0.22,800,000560,000194
Blankets12,800,0002,800,000194
Total basic water needs7.5–15 L/day2,800,00042,000,000194
Patients60 L/day75,0004,500,000194
Open wells1/4002,800,0007000194
Toilets1/50 people75,0001500194
NutritionSalt, iodised edible12,800,0002,800,000194
Fish, canned, sardines, veg oil, 150 g22,800,0005,600,000194
Pasta, durum wheat meal12,800,0002,800,000194
Rice, white, long grain, irri6/212,800,0002,800,000194
Oil, rapeseed12,800,0002,800,000194
Beans, white, small12,800,0002,800,000194
Shelter and settlementTarpaulins (4 m × 6 m)0.22,800,000560,000200
Ropes (30 m)0.22,800,000560,000200
Saws0.22,800,000560,000200
Roding, small and largo nail (1/2 kg each)0.22,800,000560,000200
Shovels0.22,800,000560,000200
Hoe0.22,800,000560,000200
Machete0.22,800,000560,000200
Health clusterDoctors0.045775,000342887.39
Nurses0.05975,000442587.39
Others0.0675,000450087.39
Table 7. Pairwise Comparison Questionnaire to elicit decision-maker’s preferences.
How Much More ImportantEqualHow Much Less Important
1Type of the partners
Government98765432123456789NGO
Government98765432123456789Military
Government98765432123456789International
Government98765432123456789Volunteers
NGO98765432123456789Military
NGO98765432123456789International
NGO98765432123456789Volunteers
Military98765432123456789International
Military98765432123456789Volunteers
Volunteer98765432123456789International
2Size of the partner
Small98765432123456789Medium
Small98765432123456789Big
Small98765432123456789Very big
Medium98765432123456789Big
Medium98765432123456789Very big
Big98765432123456789Very big
3Experience of the partners
Low98765432123456789Medium
Low98765432123456789High
Low98765432123456789Expert
Medium98765432123456789High
Medium98765432123456789Expert
High98765432123456789Expert
4Partner’s surge capacity
None98765432123456789Low
None98765432123456789Medium
None98765432123456789High
Low98765432123456789Medium
Low98765432123456789High
Medium98765432123456789High
5International expansion
Yes98765432123456789No
6Humanitarian cluster
WASH cluster98765432123456789Nutrition cluster
WASH cluster98765432123456789Shelter cluster
WASH cluster98765432123456789Health cluster
Nutrition cluster98765432123456789Shelter cluster
Nutrition cluster98765432123456789Health cluster
Shelter cluster98765432123456789Health cluster
7Decision criteria
Type98765432123456789Size
Type98765432123456789Experience
Type98765432123456789Surge capacity
Type98765432123456789International Expansion
Type98765432123456789Cluster
Size98765432123456789Experience
Size98765432123456789Surge capacity
Size98765432123456789International Expansion
Size98765432123456789Cluster
Experience98765432123456789Surge capacity
Experience98765432123456789International Expansion
Experience98765432123456789Cluster
Surge capacity98765432123456789International Expansion
Surge capacity98765432123456789Cluster
International Expansion98765432123456789Cluster
Table 8. Example: The preferences of one of the participants towards the type of the partners.
AHP
10.60860.80%
20.16816.80%
30.0949.40%
40.0656.50%
50.0656.50%
Table 9. Example of AHP for participant/unit of resource per partner.
ResourcesAHP WeightPartner 1Partner 2Partner 3Partner 4Partner 5
Total basic water needs0.584075340.463655880.499153680.602370360.74272320.6225768
Rice0.121901610.096769020.104177720.125719940.15501280.1299372
Tent0.72790170.57782940.62206840.75070180.9256160.775884
Doctors0.098222880.077972160.083941760.101299520.12490240.1046976
Table 10. An example of the utility for a participant.
ResourceUtilityPartner 1Partner 2Partner 3Partner 4Partner 5
Water25.11515.30142.92723.49213.36947.316
Rice4.1457.54810.0015.40615.34610.785
Tent67.69539.29214.30822.52171.27251.984
Doctors6.7784.8343.4426.0787.7448.899
Table 11. Example of partners ranked/participant’s preferences.
RankPartnerTotal UtilityTypeSizeExpansionExperienceSurge Capacity
1Partner 51520.572GovernmentSmallYesLowLow
2Partner 141371.679GovernmentSmallNoLowLow
3Partner 181354.951GovernmentSmallYesLowVery high
4Partner 121307.894GovernmentSmallYesHighHigh
5Partner 161164.387GovernmentMediumYesLowVery high
6Partner 61146.227NGOSmallNoVery highLow
7Partner 131052.240VolunteerSmallYesMediumLow
8Partner 31031.565VolunteerMediumYesHighHigh
9Partner 101030.562VolunteerSmallYesHighVery high
10Partner 91016.646GovernmentMediumNoHighVery high
Table 12. An example of the result of the optimise resource-based decision-making.
Resource NameResource CodeTotal ResourcesRequired ResourcesUtilitySupplier 1Supplier 2,Supplier 300
Transportation containerN120.5065221.40.00070.13240.11850.1087
Storage containersN2108.1904221.40.00070.14670.01470.2348
ToiletsN421.067311070.00070.04110.06750.0675
BlanketsN622.393711070.00070.02350.08950.0205
basic waterN16110.1125166050.00070.31550.24210.6309
Patient waterN171.4999664200.00070.00050.00620.0054
Open WellN1828.37494.4280.00070.06610.07170.117
FISH150 gN195573.12222.2140.000723.109830.446212.8388
RICE,N221074.4942221.40.00173.00796.2365.0621
SALT,N23107.6255221.40.00170.0440.63090.5722
PASTAN2754.8545221.40.00170.15410.27880.0734
OIL, rapeseedN29114.2209221.40.00170.24210.60160.4915
TarpaulinsN31109.3716442.80.00990.68230.49890.1687
Ropes (30 m)N3255.626666420.00990.12640.32330.1003
SawsN333.656211070.00990.01070.01930.0111
RodingN3421.323110.70.00990.08620.14420.1011
ShovelsN35232.228311070.00990.49060.81761.4122
HoesN3622.528611070.00990.05350.04160.11
MachetesN3721.660511070.00990.09810.09370.0937
DoctorsN420.03720.51150.01030.01120.01330.0038
NursesN4332.3130.87750.010325.368530.17512.6237
Table 13. An example of the Suppliers ranked based on MAUT.
Scenario1,
Decision Maker 2
Scenario 2,
Decision Maker 2
Scenario 1,
Decision Maker 1
Scenario 2,
Decision Maker 1
Supplier NumberMAUT rankSupplier NumberMAUT rankSupplier NumberMAUT rankSupplier NumberMAUT rank
1531.1327602119.145249410.6339222841.729715
411.0938211569.04018320.6276442111.718803
1031.0917992849.018674340.62647521.701977
491.087162578.9361341470.624786291.691246
341.0746192388.9211111880.6242582381.690334
891.059594438.817729890.619832591.683765
1471.045495298.8138281280.6188942211.665627
471.0424611328.809210490.6185271581.657653
2581.0415381588.6652701030.614152161.635905
21.038681478.611685640.605774571.628362
Publisher’s Note: MDPI stays neutral with regard to jurisdictional claims in published maps and institutional affiliations.

