
Feasibility Analysis of Biogas Production by Using GIS and Multicriteria Decision Aid Methods in the Central African Republic

Abstract
1. Introduction
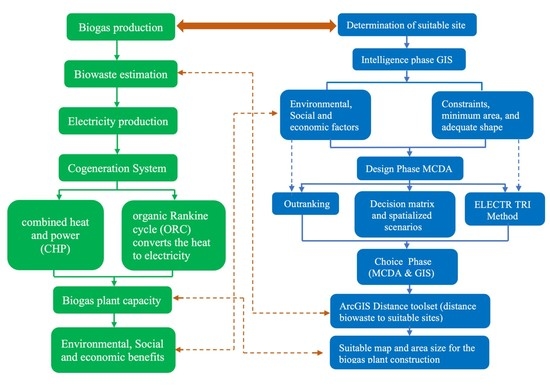
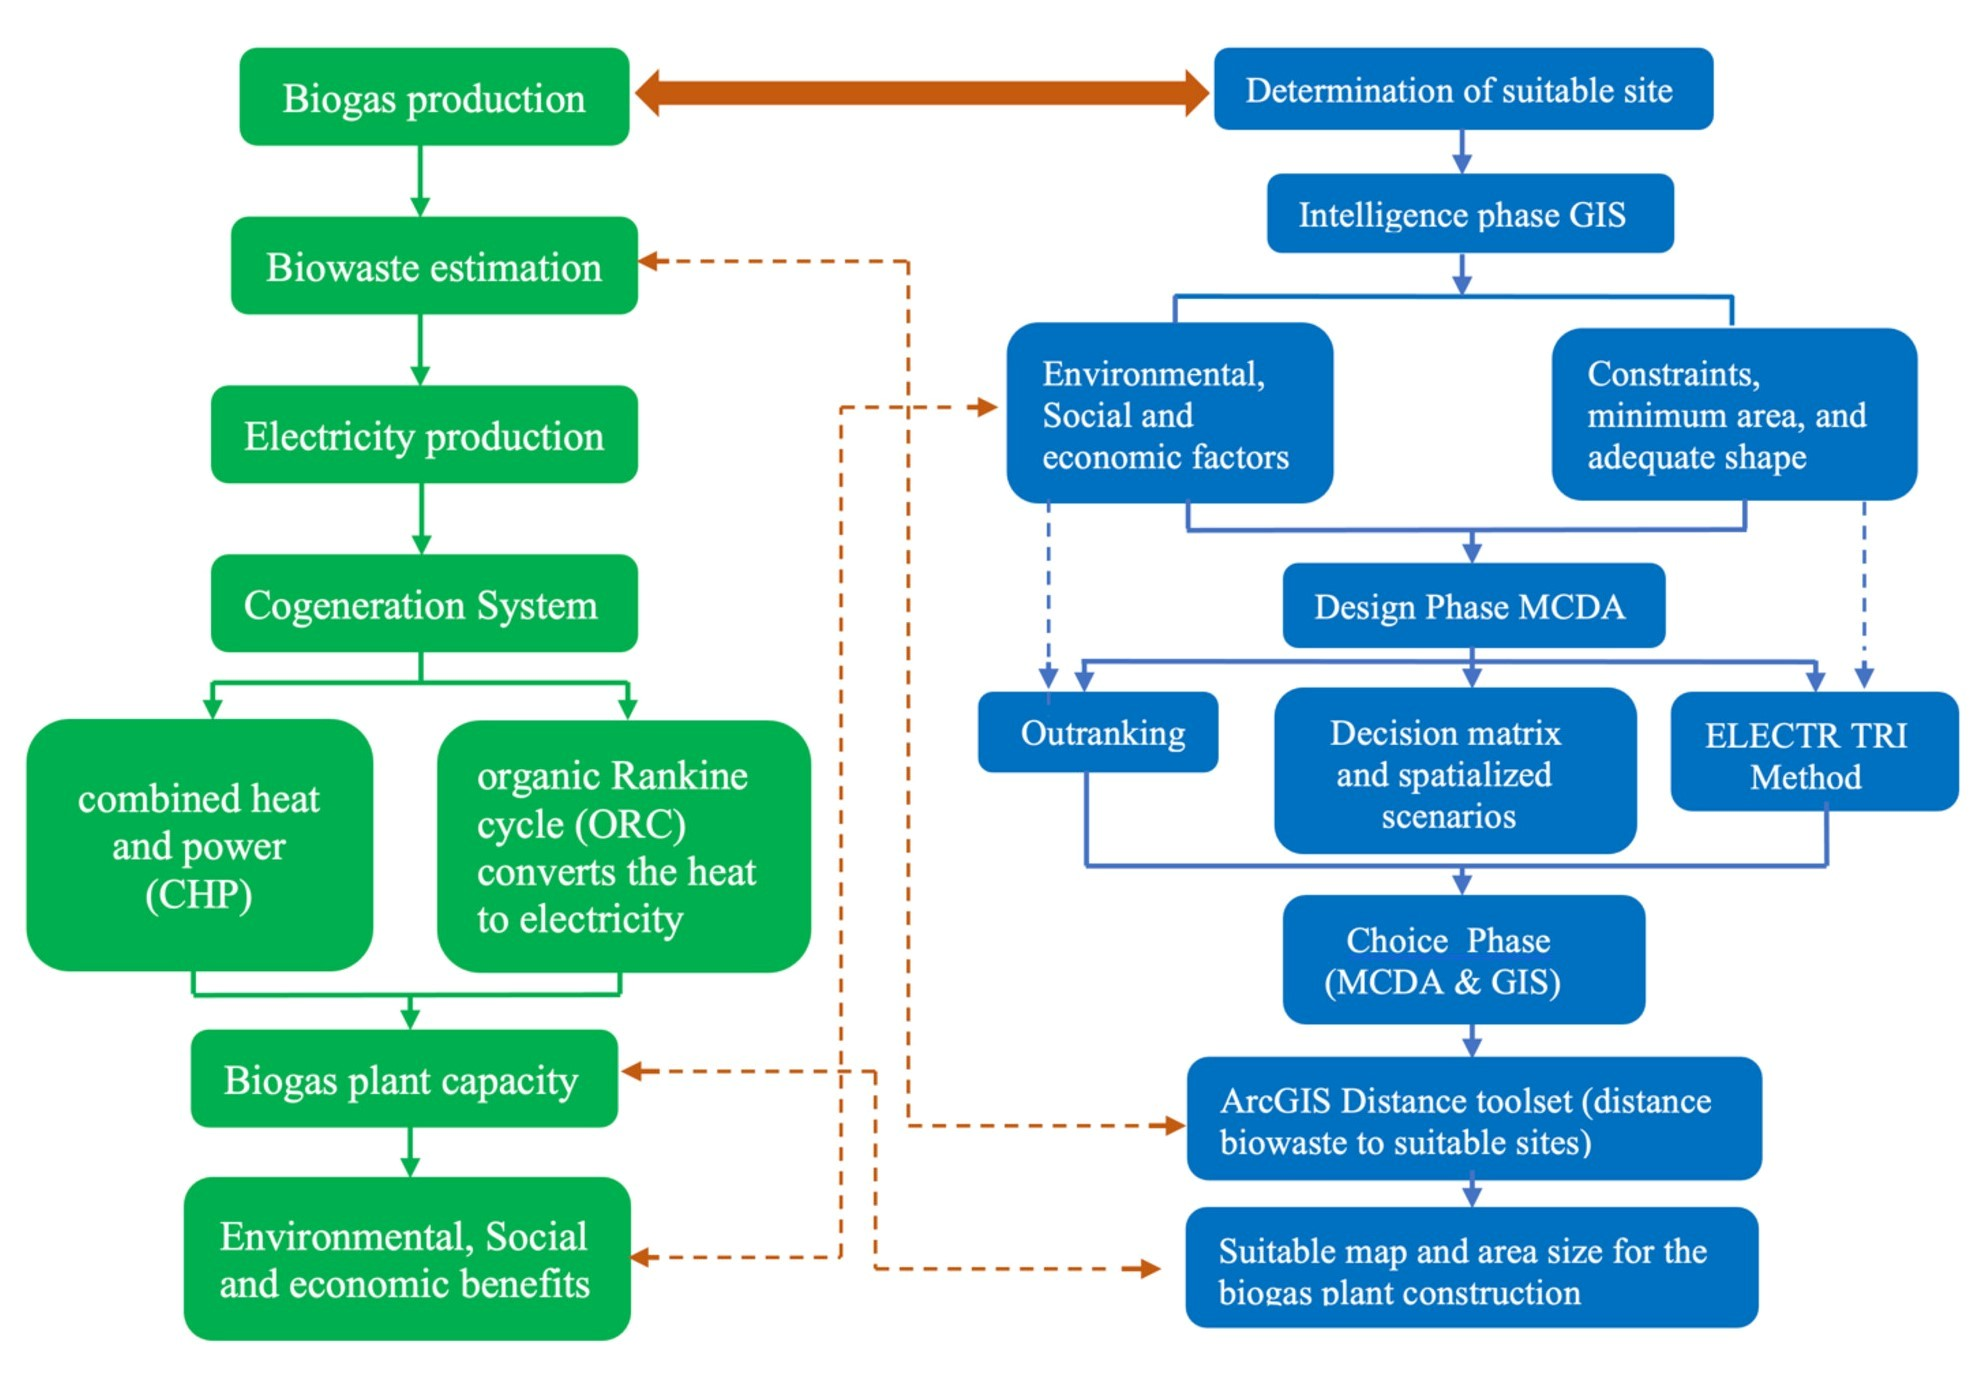
2. Methodology
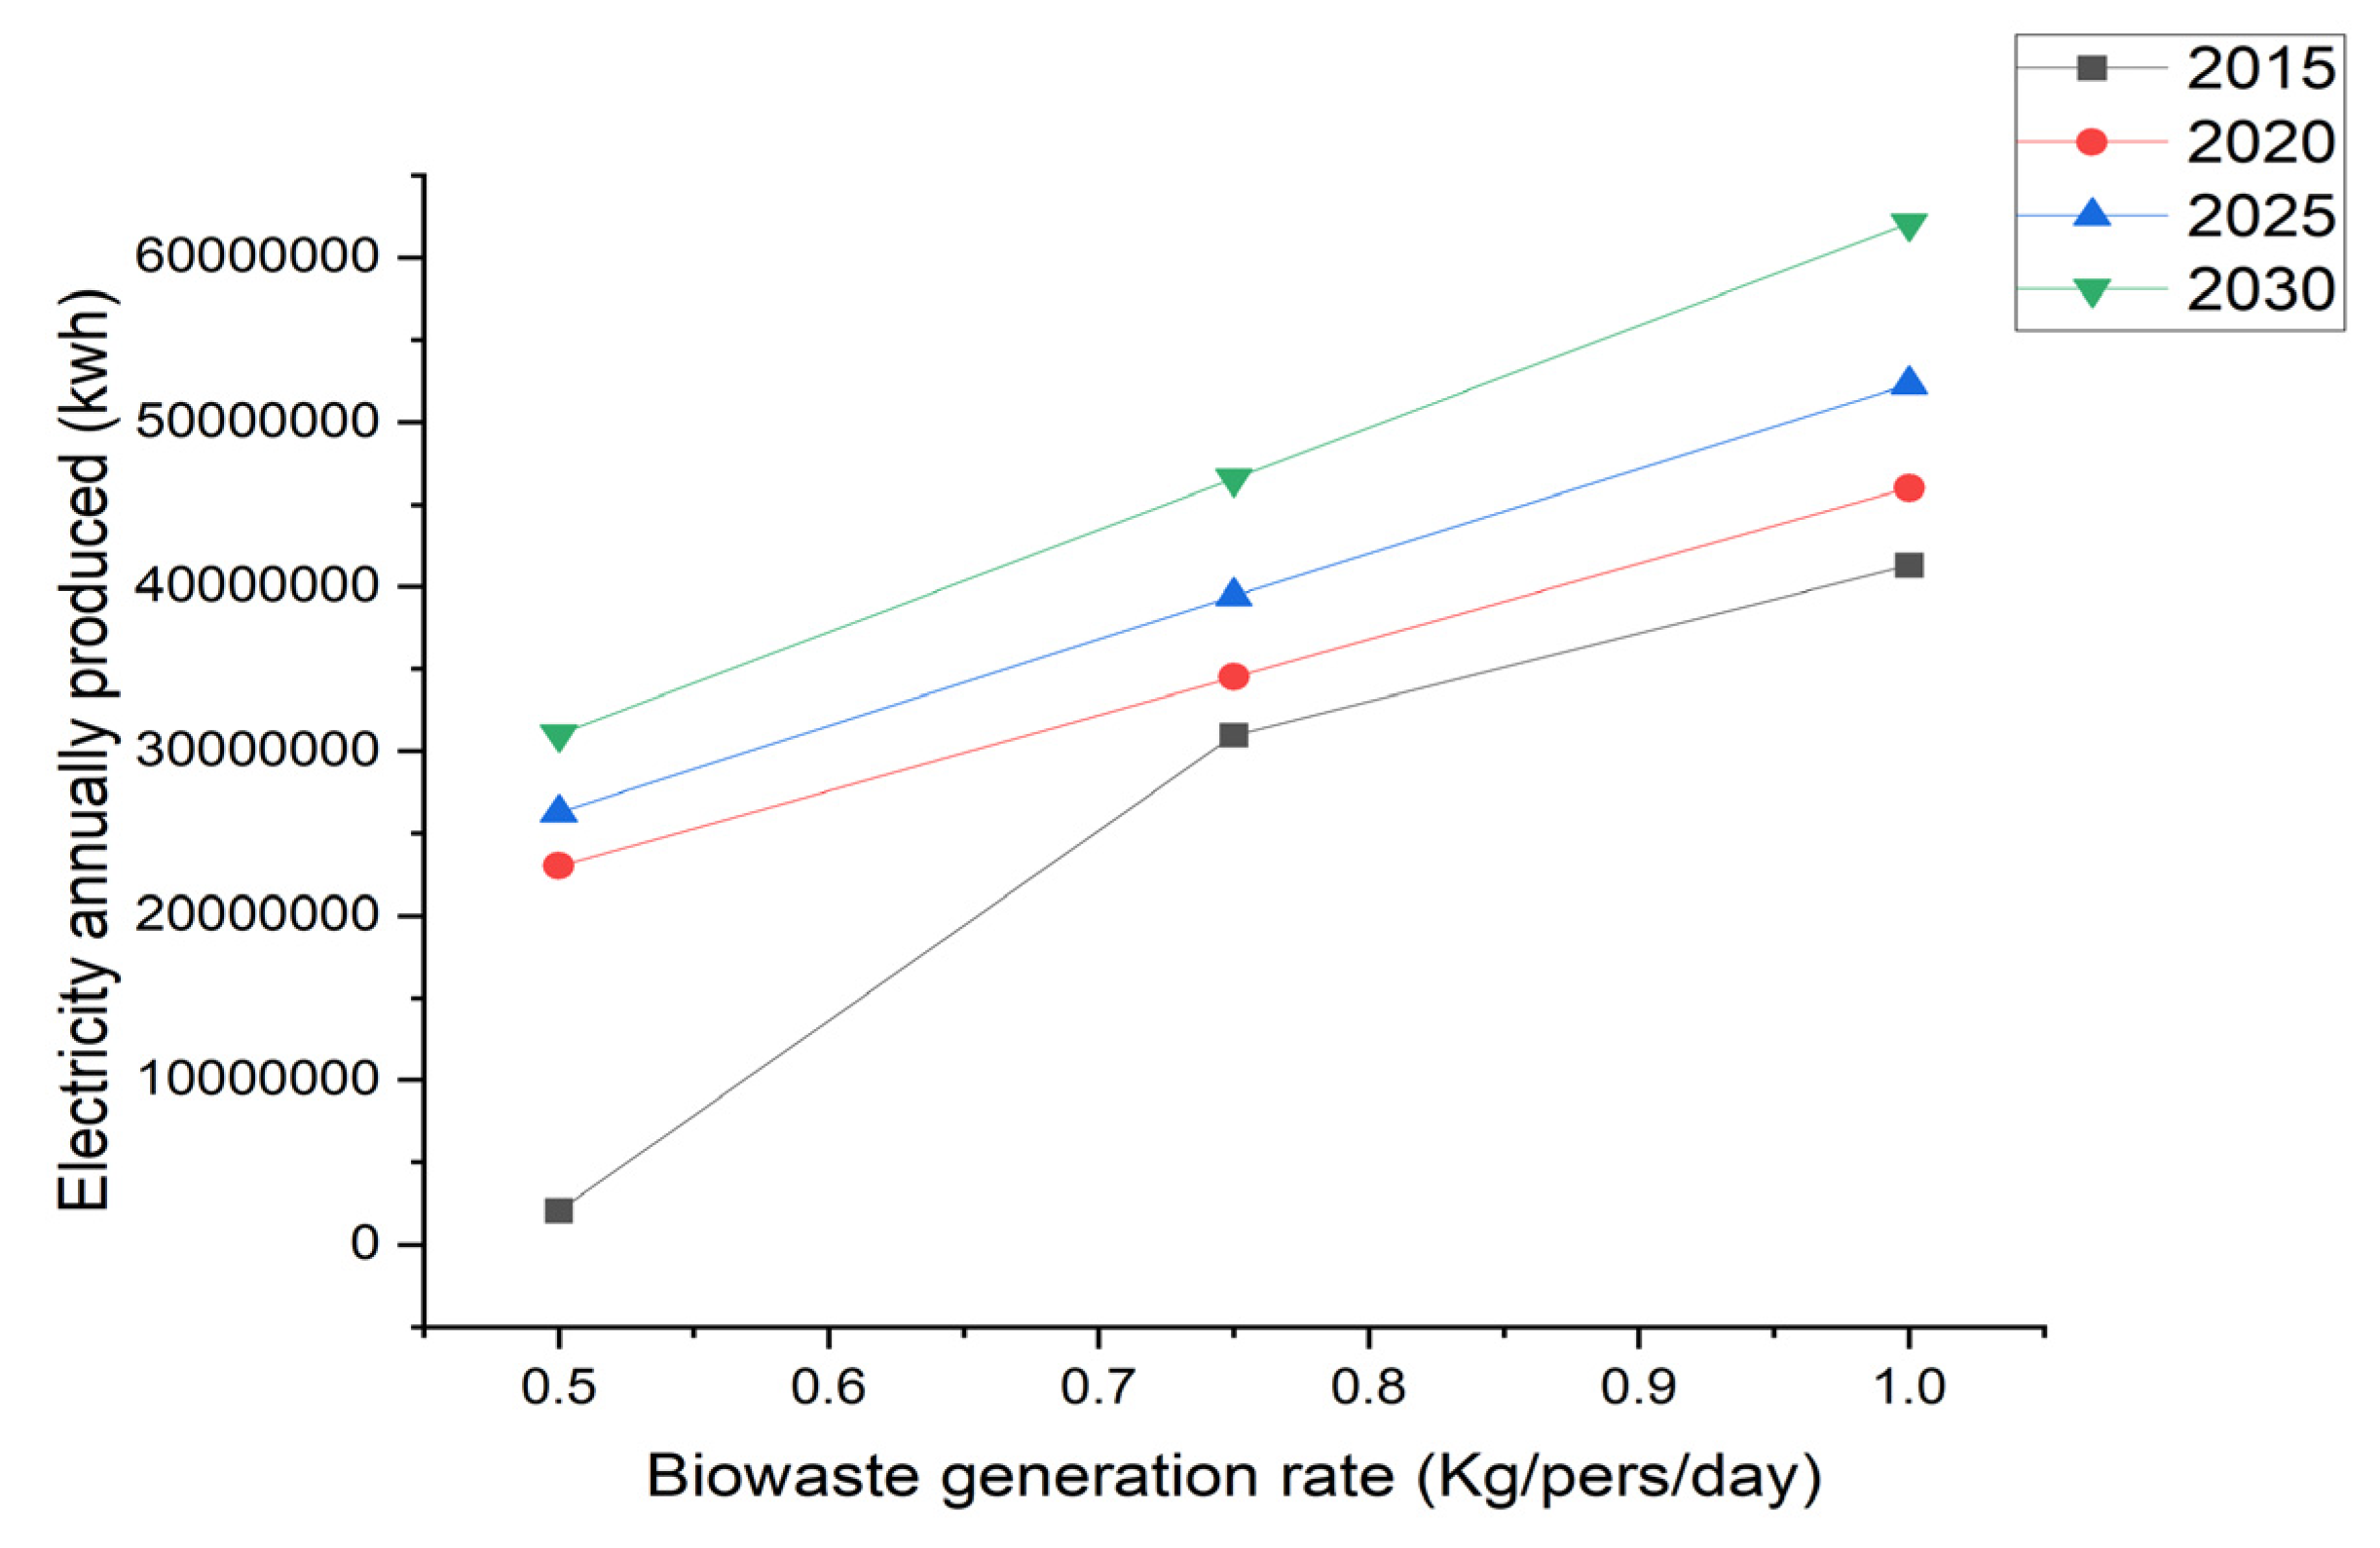
2.1. Estimation of Biowaste
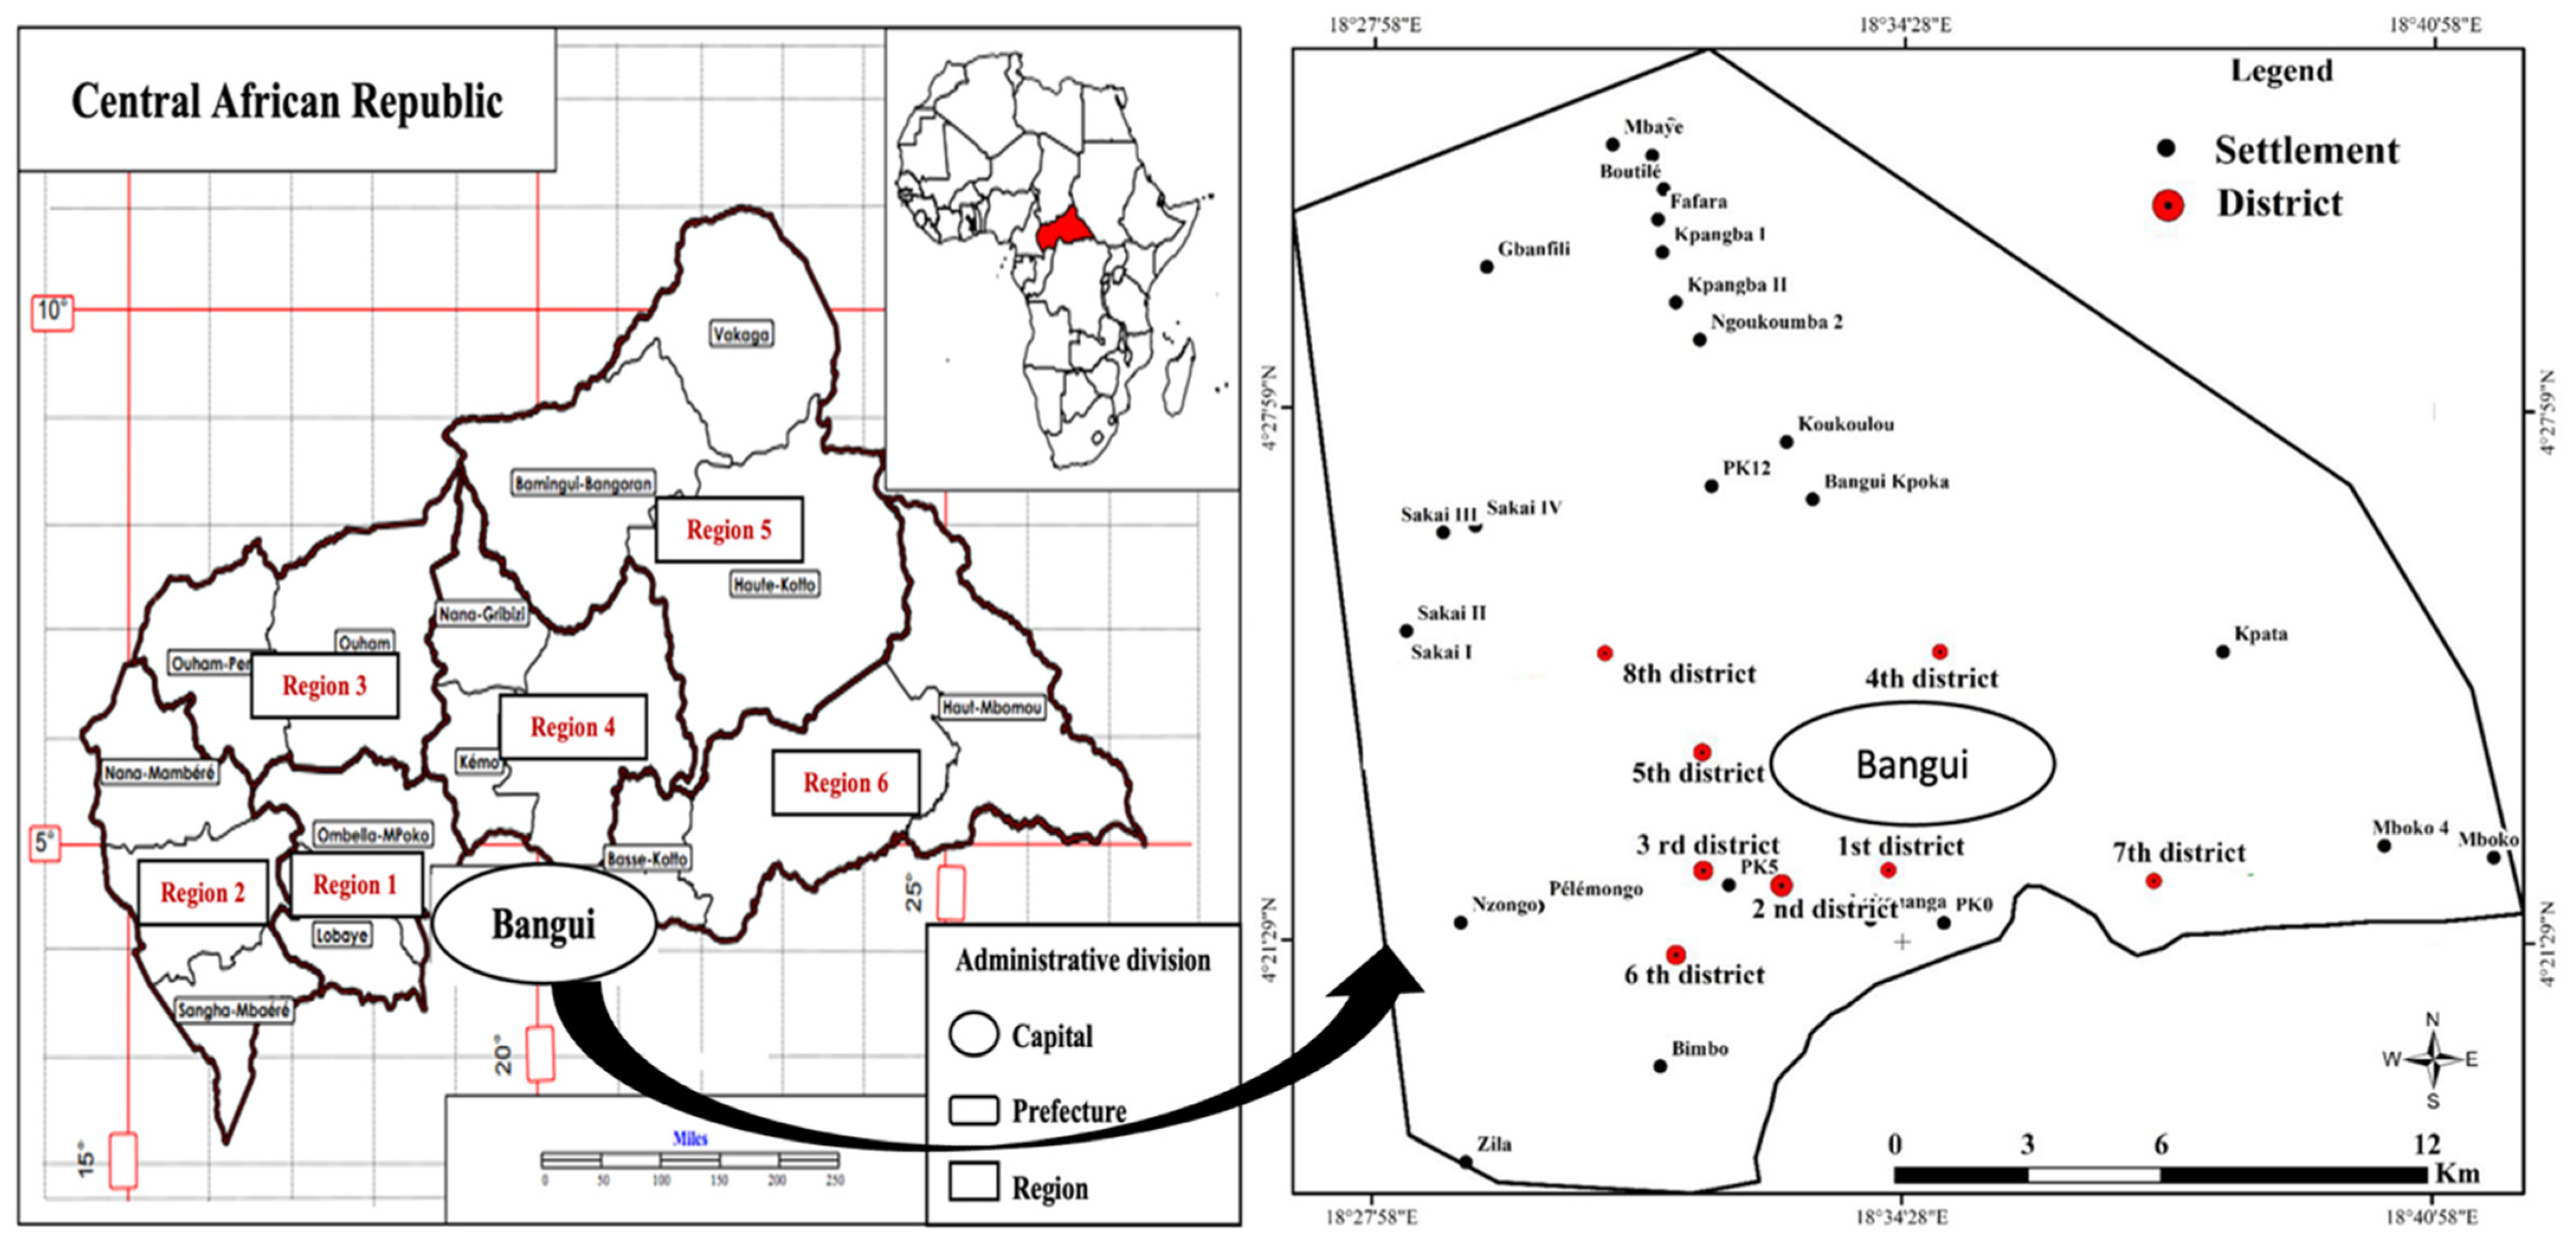
2.2. Constraints and Criteria
2.3. Outranking Method
2.3.1. Decision Matrix and Spatialized Scenarios
2.3.2. ELECTRE TRI Method
Decision-Maker’s Preferences of ELECTRE TRI
Iterative Application of ELECTRE TRI
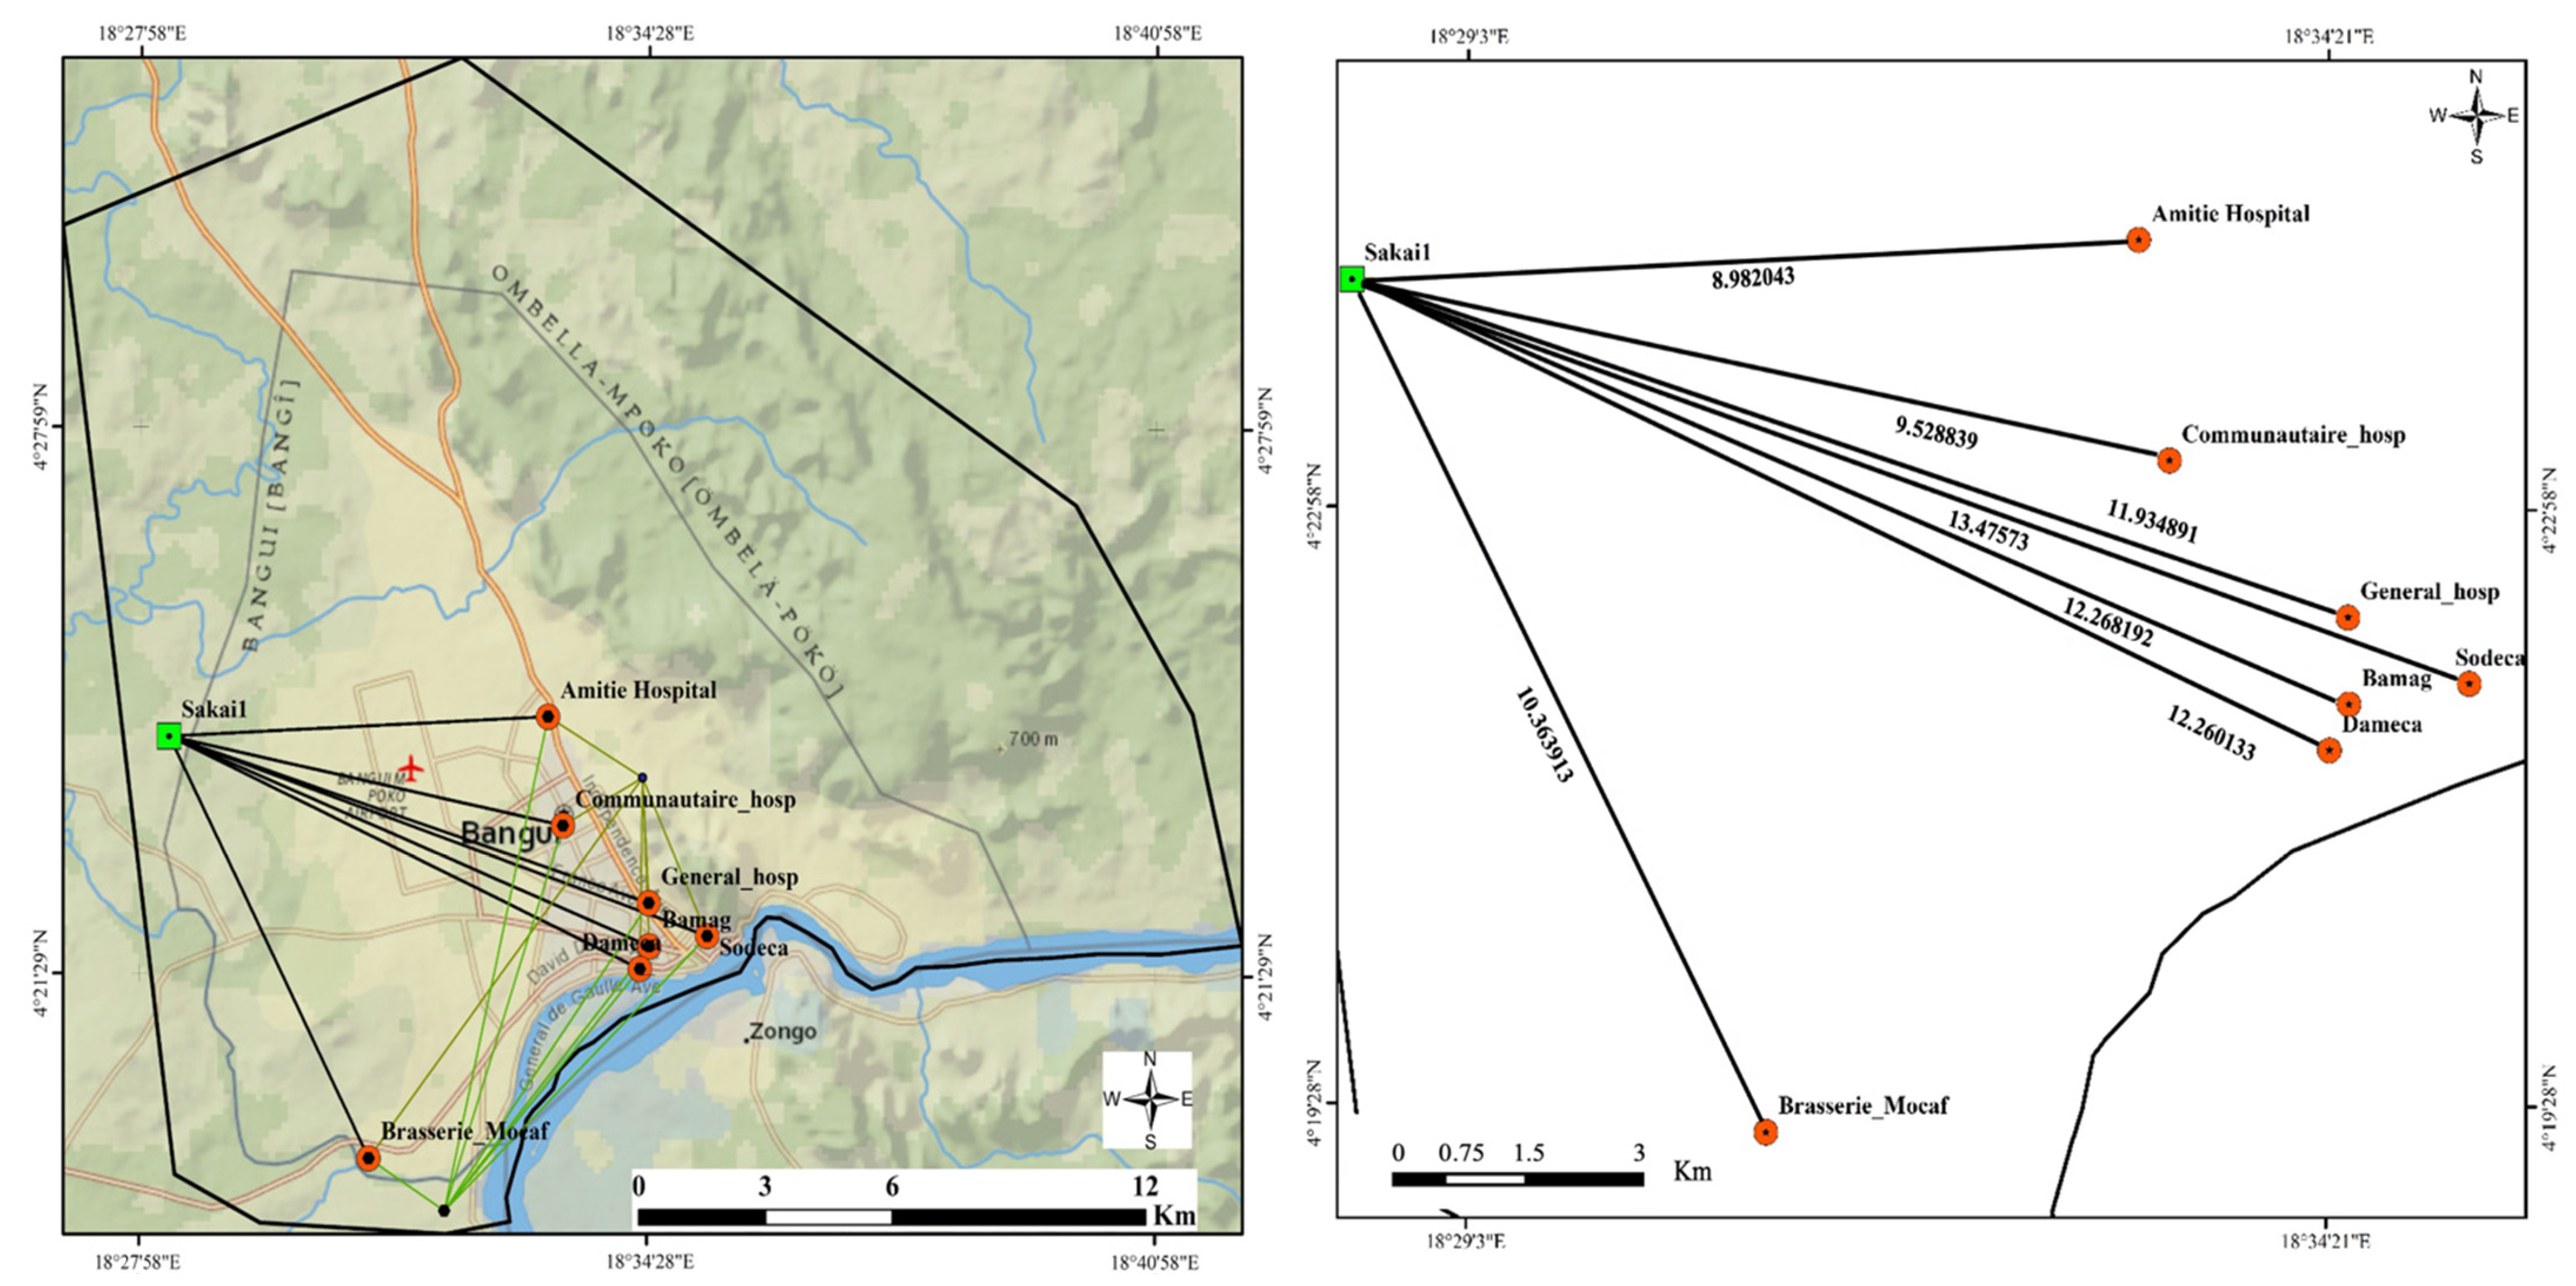
2.4. Determining the Distance to the Biowaste Centers
2.5. Biogas Production Capacity on the Site
2.5.1. Sizing Electricity and Heat Production Capacity by Cogeneration
2.5.2. Thermal Heat Converts into Electricity
3. Results and Discussion
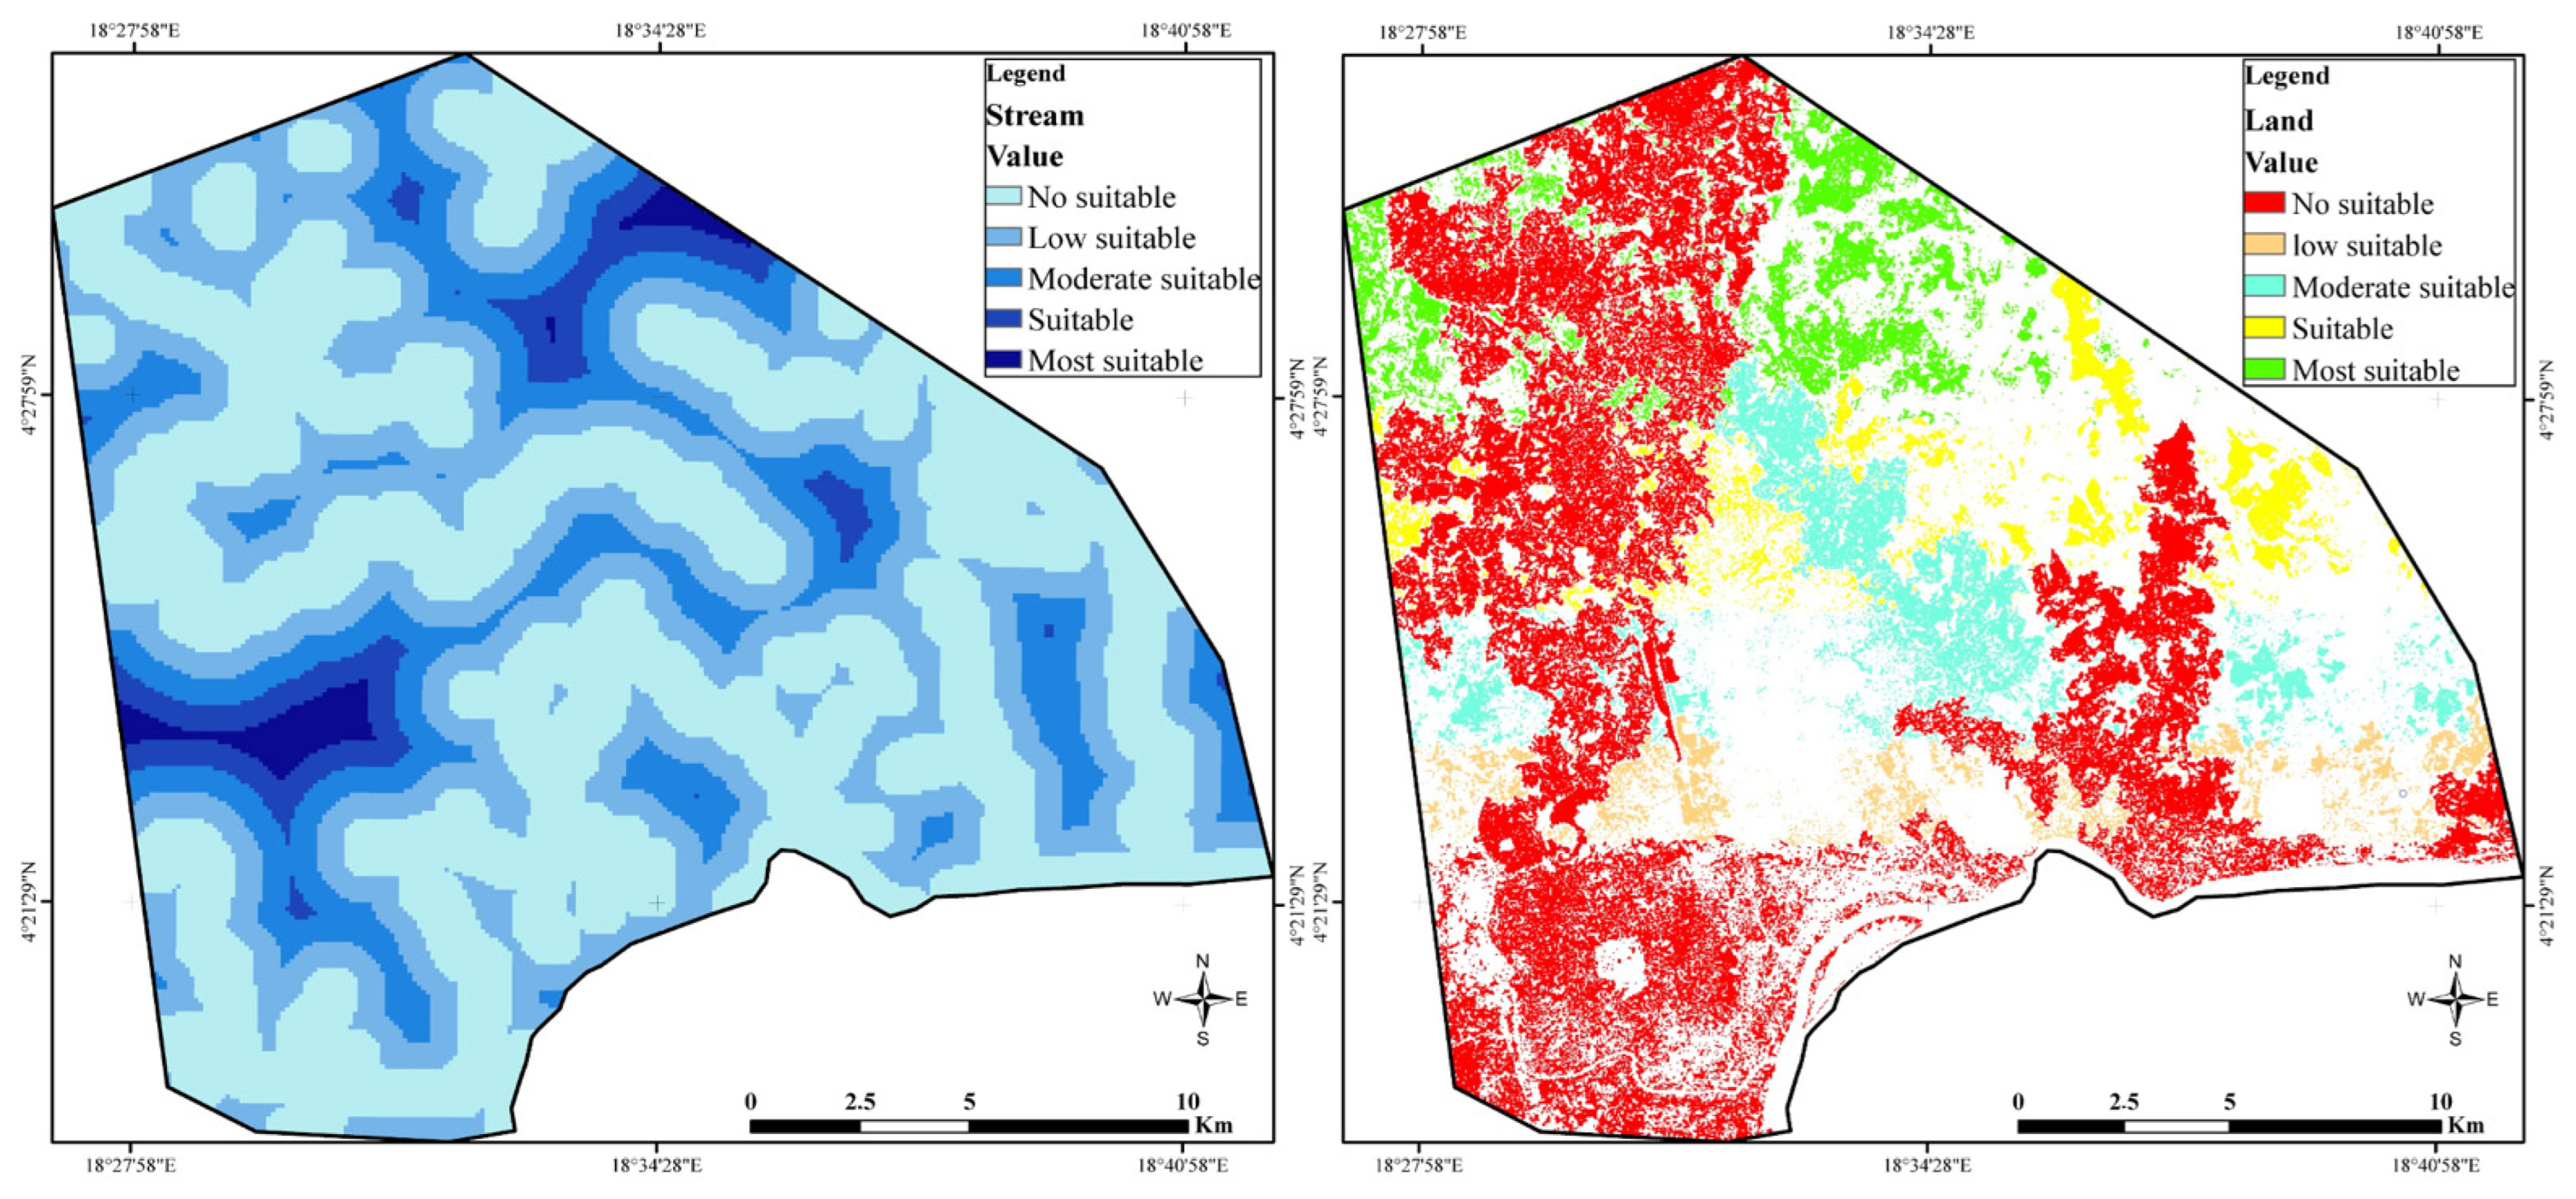
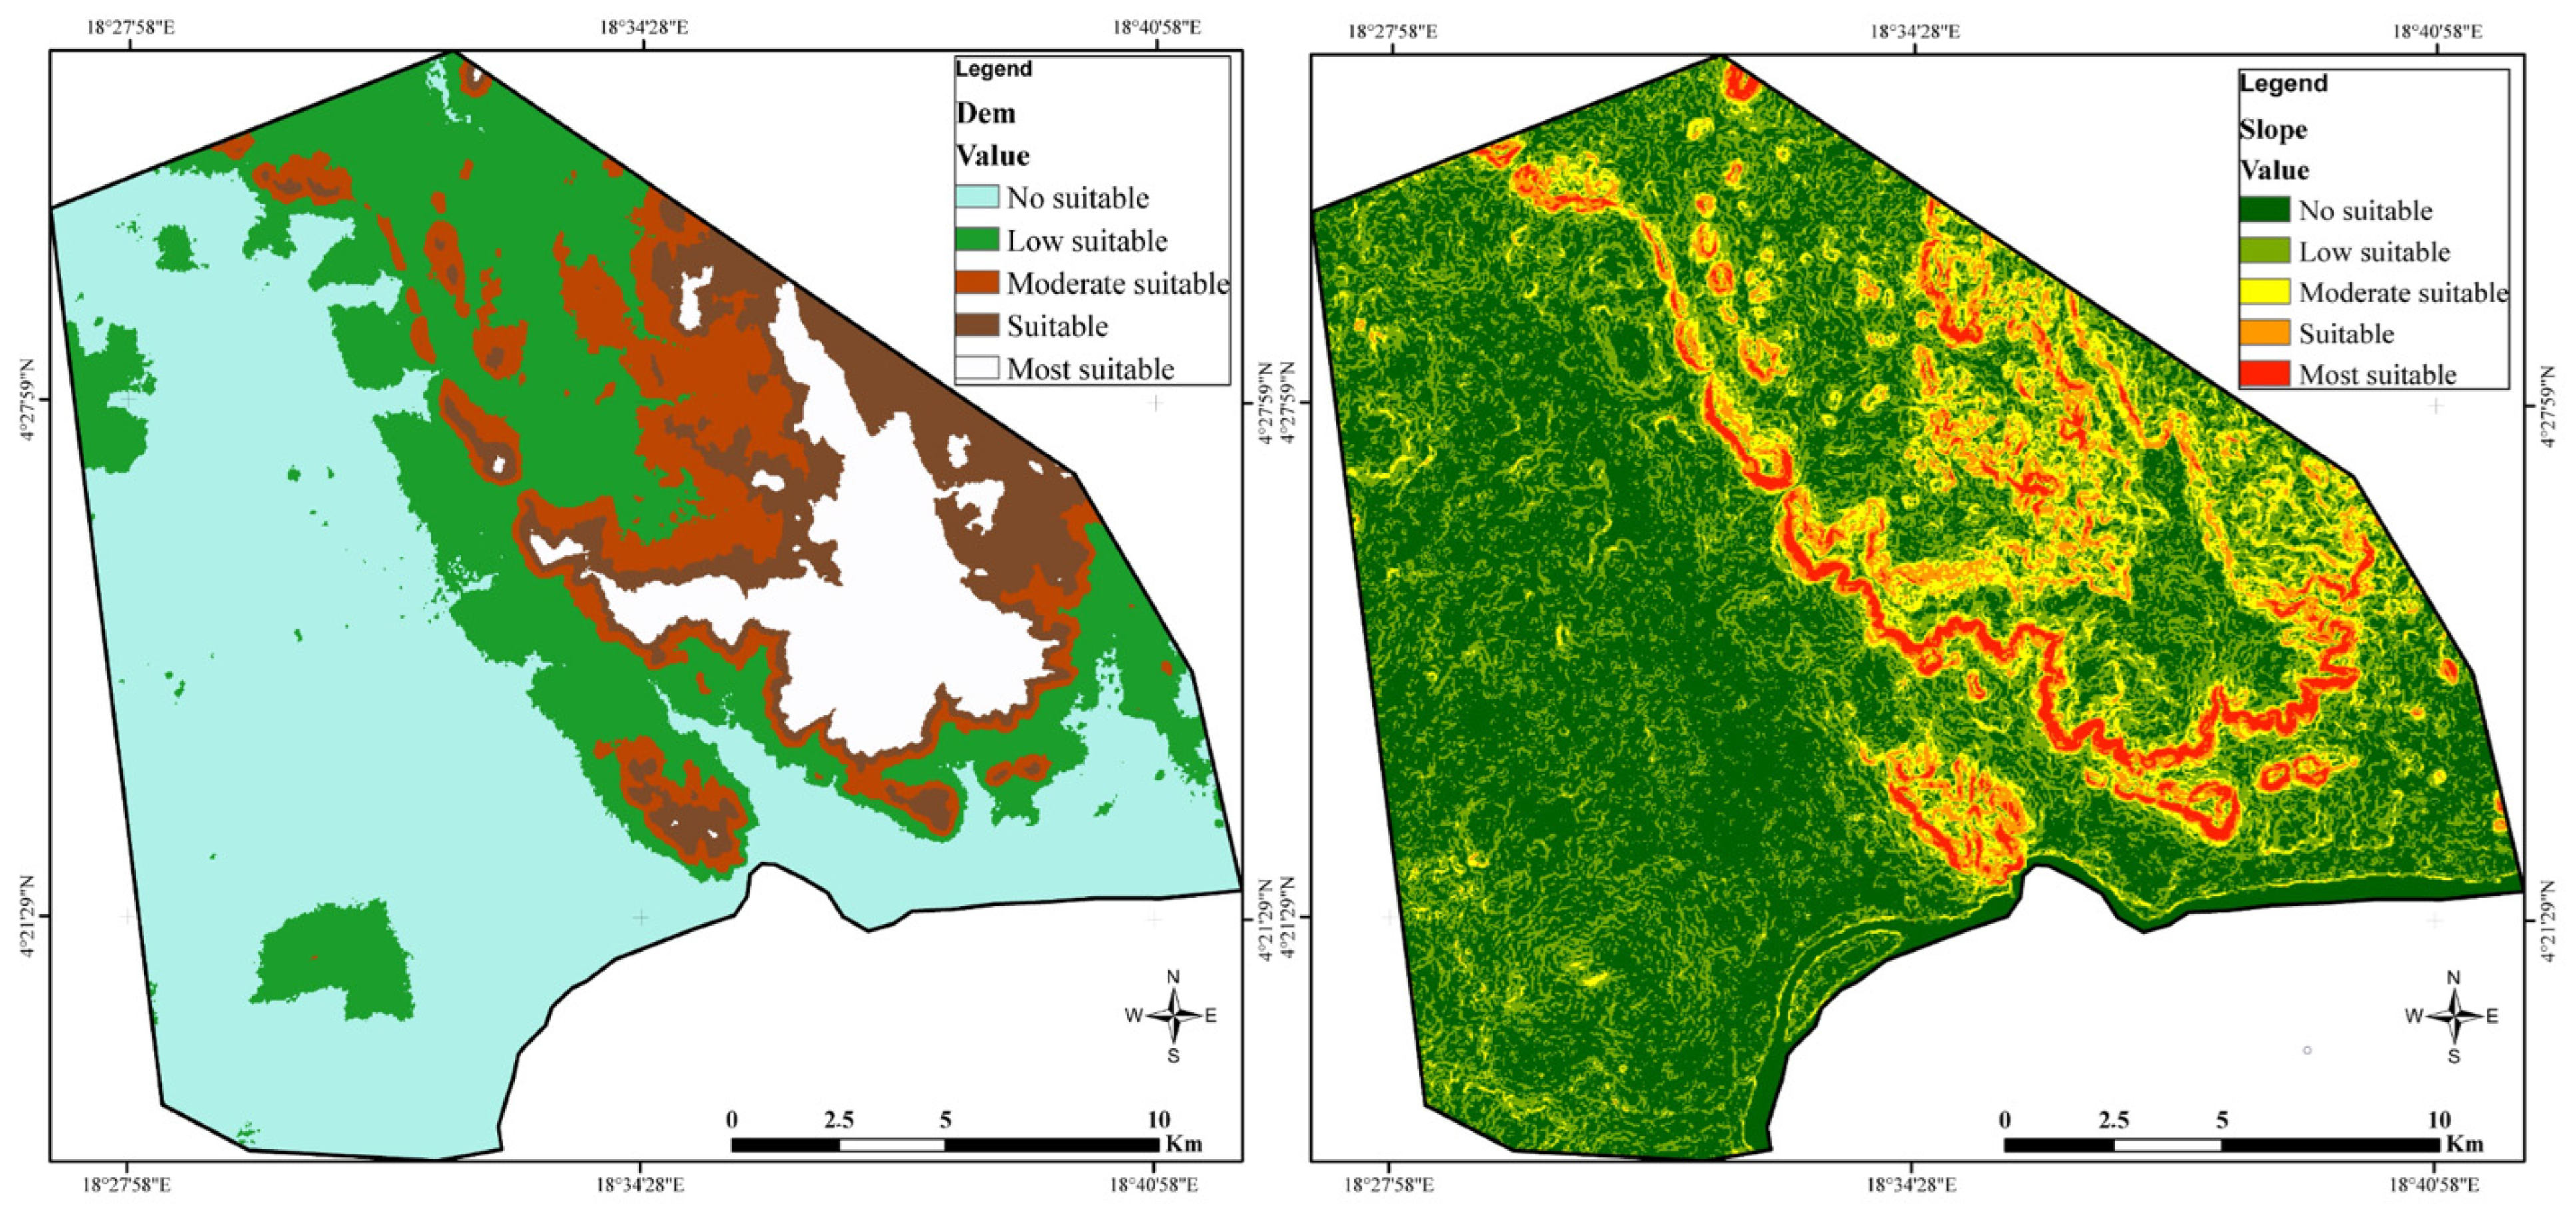
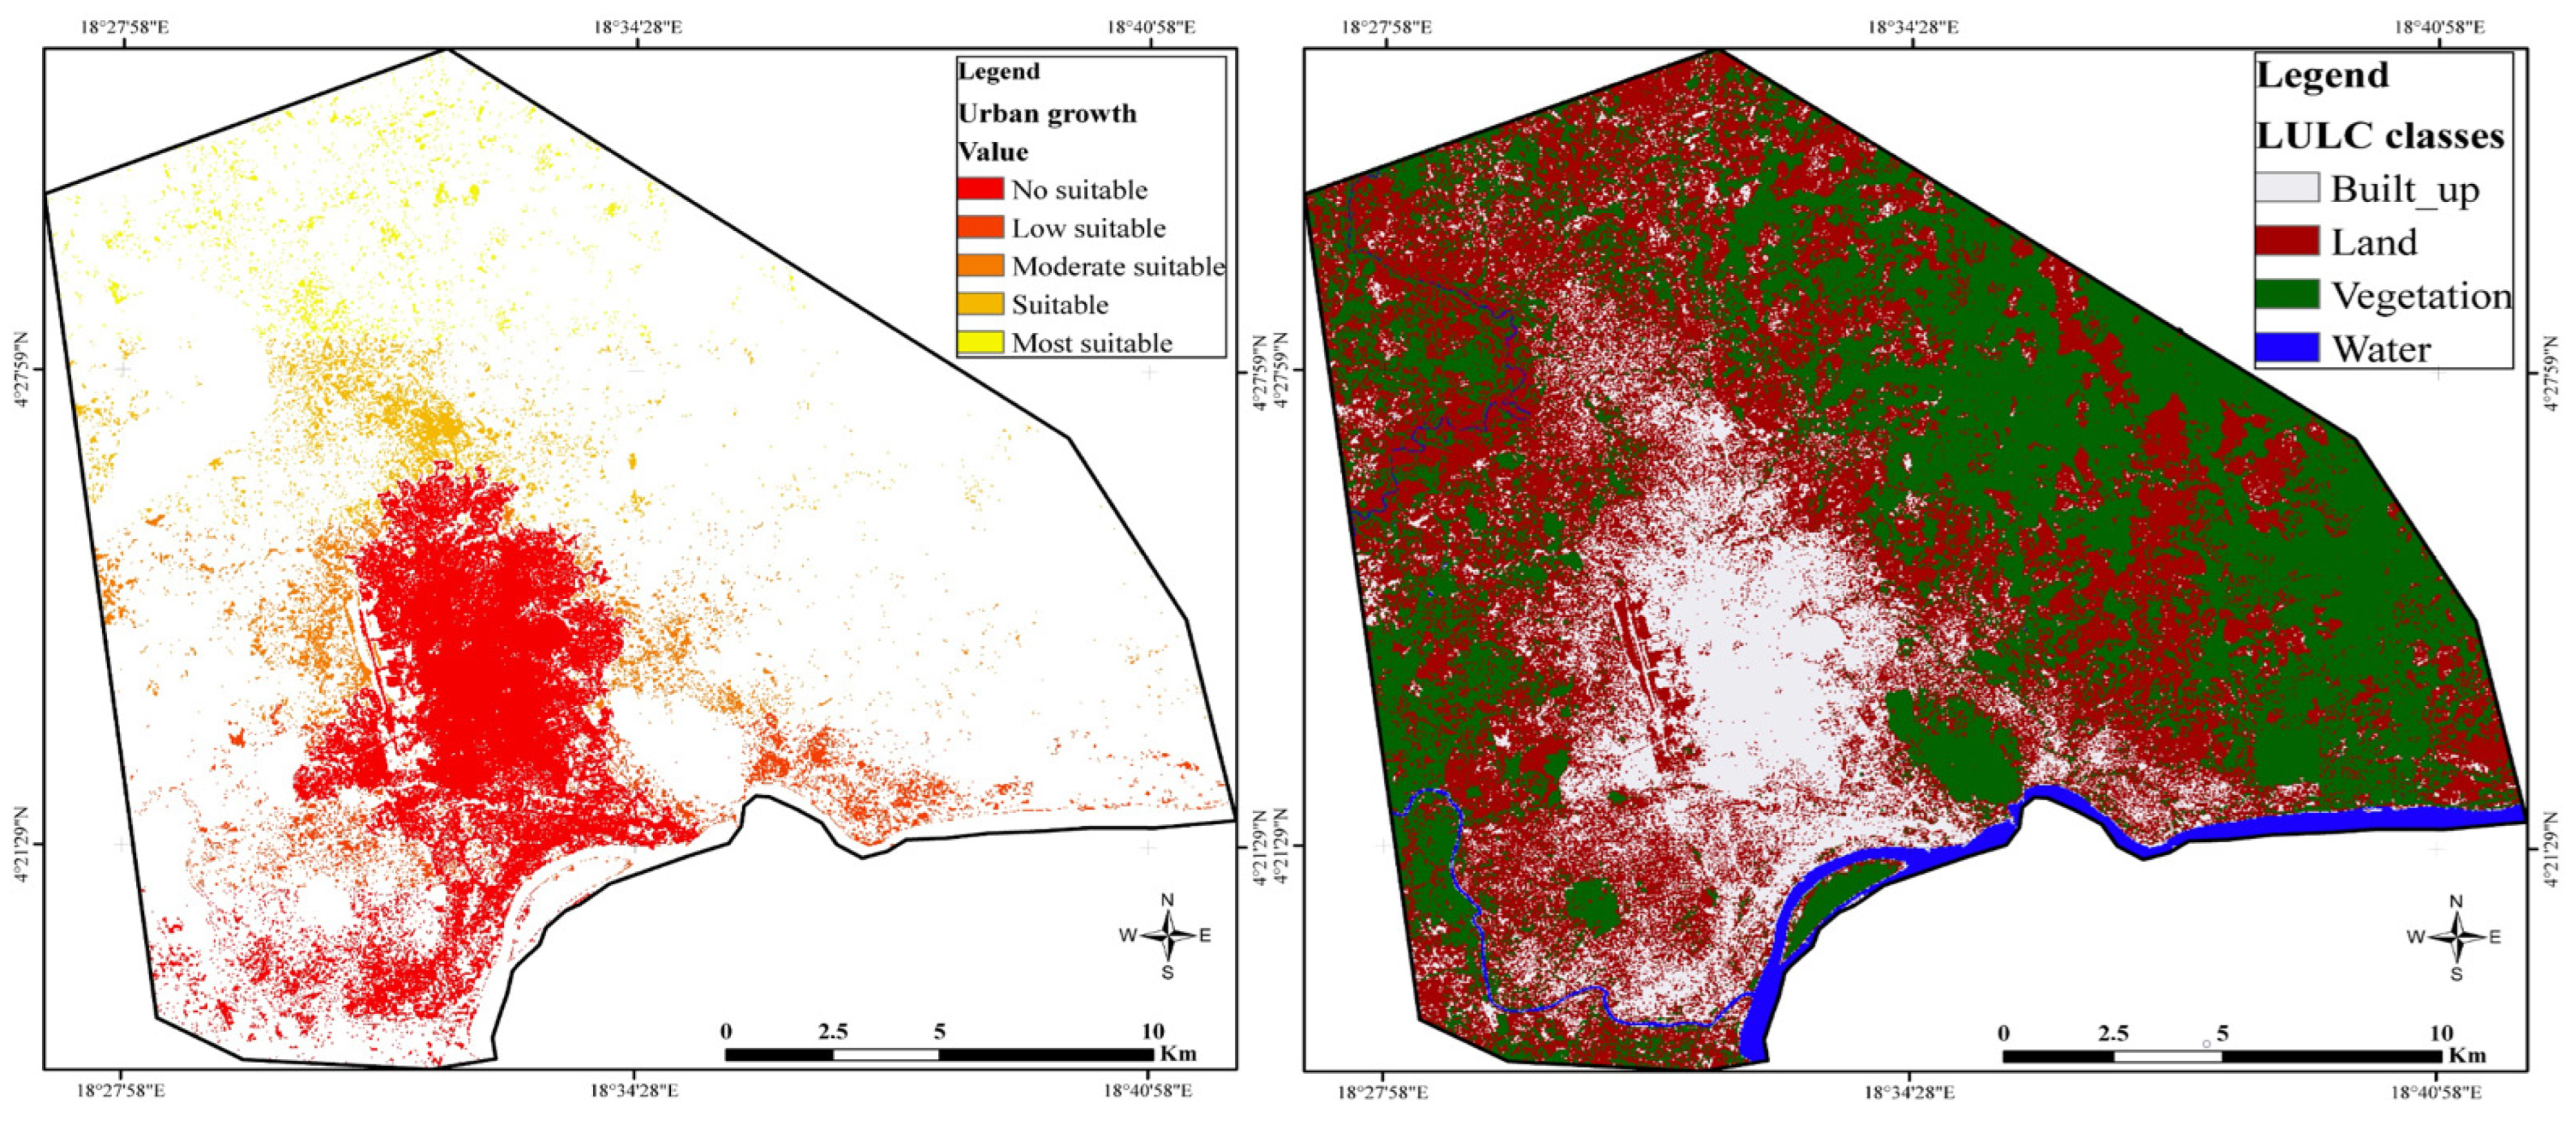
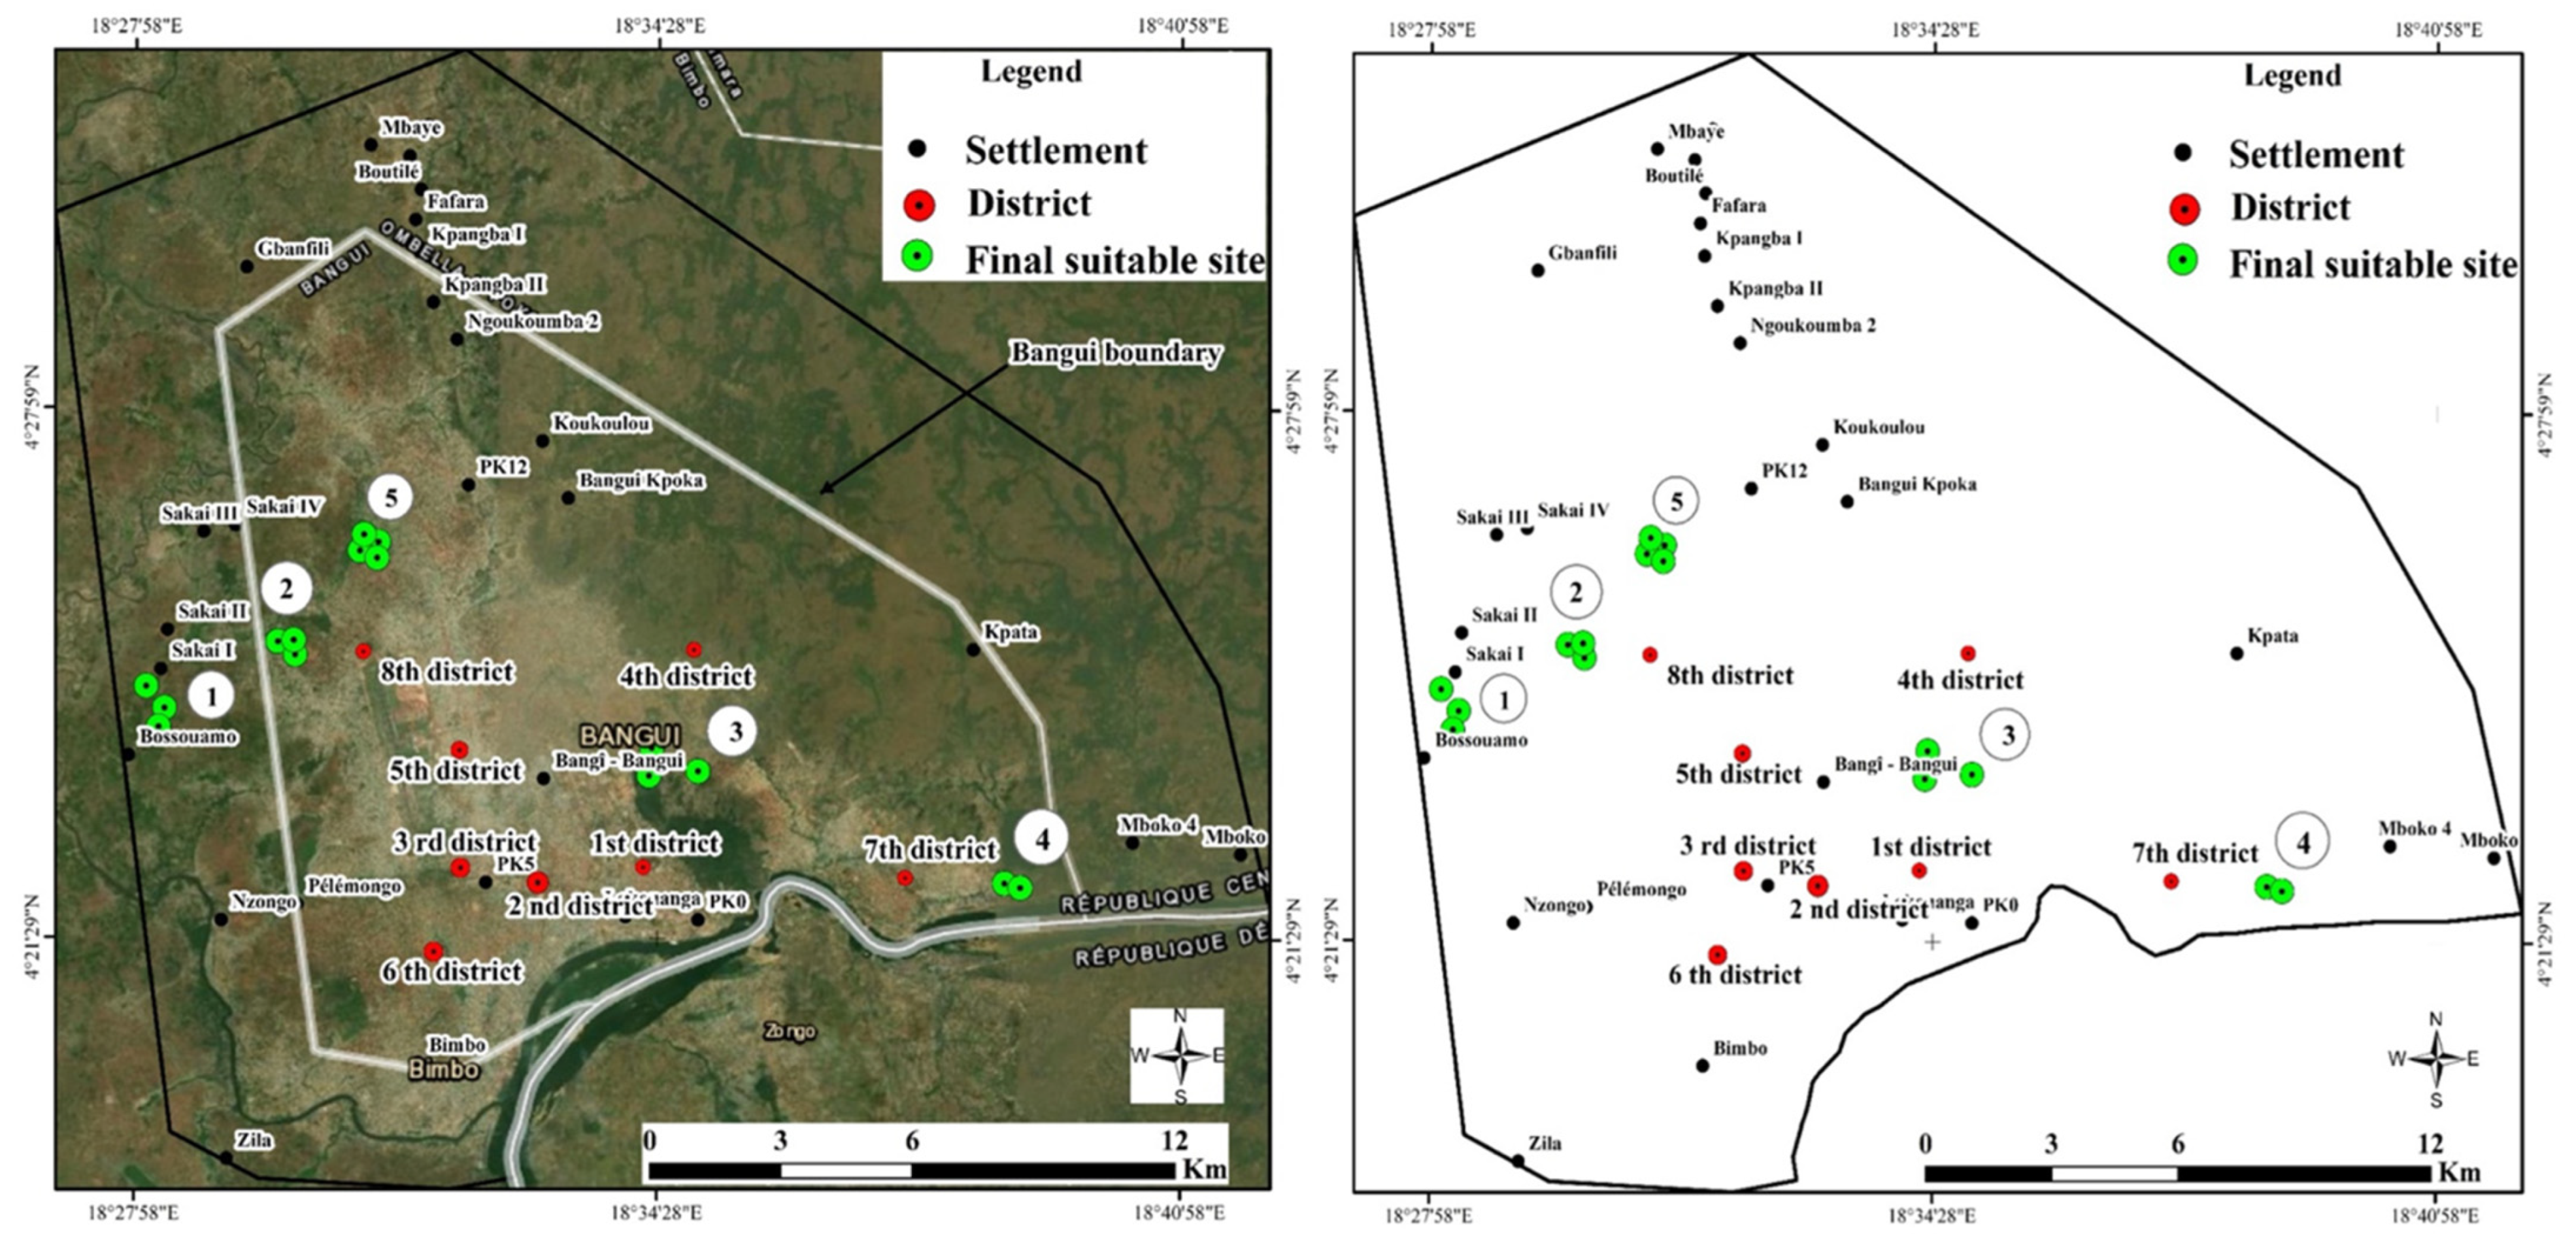
3.1. The Map Design of Suitable Area for the Biogas Plant
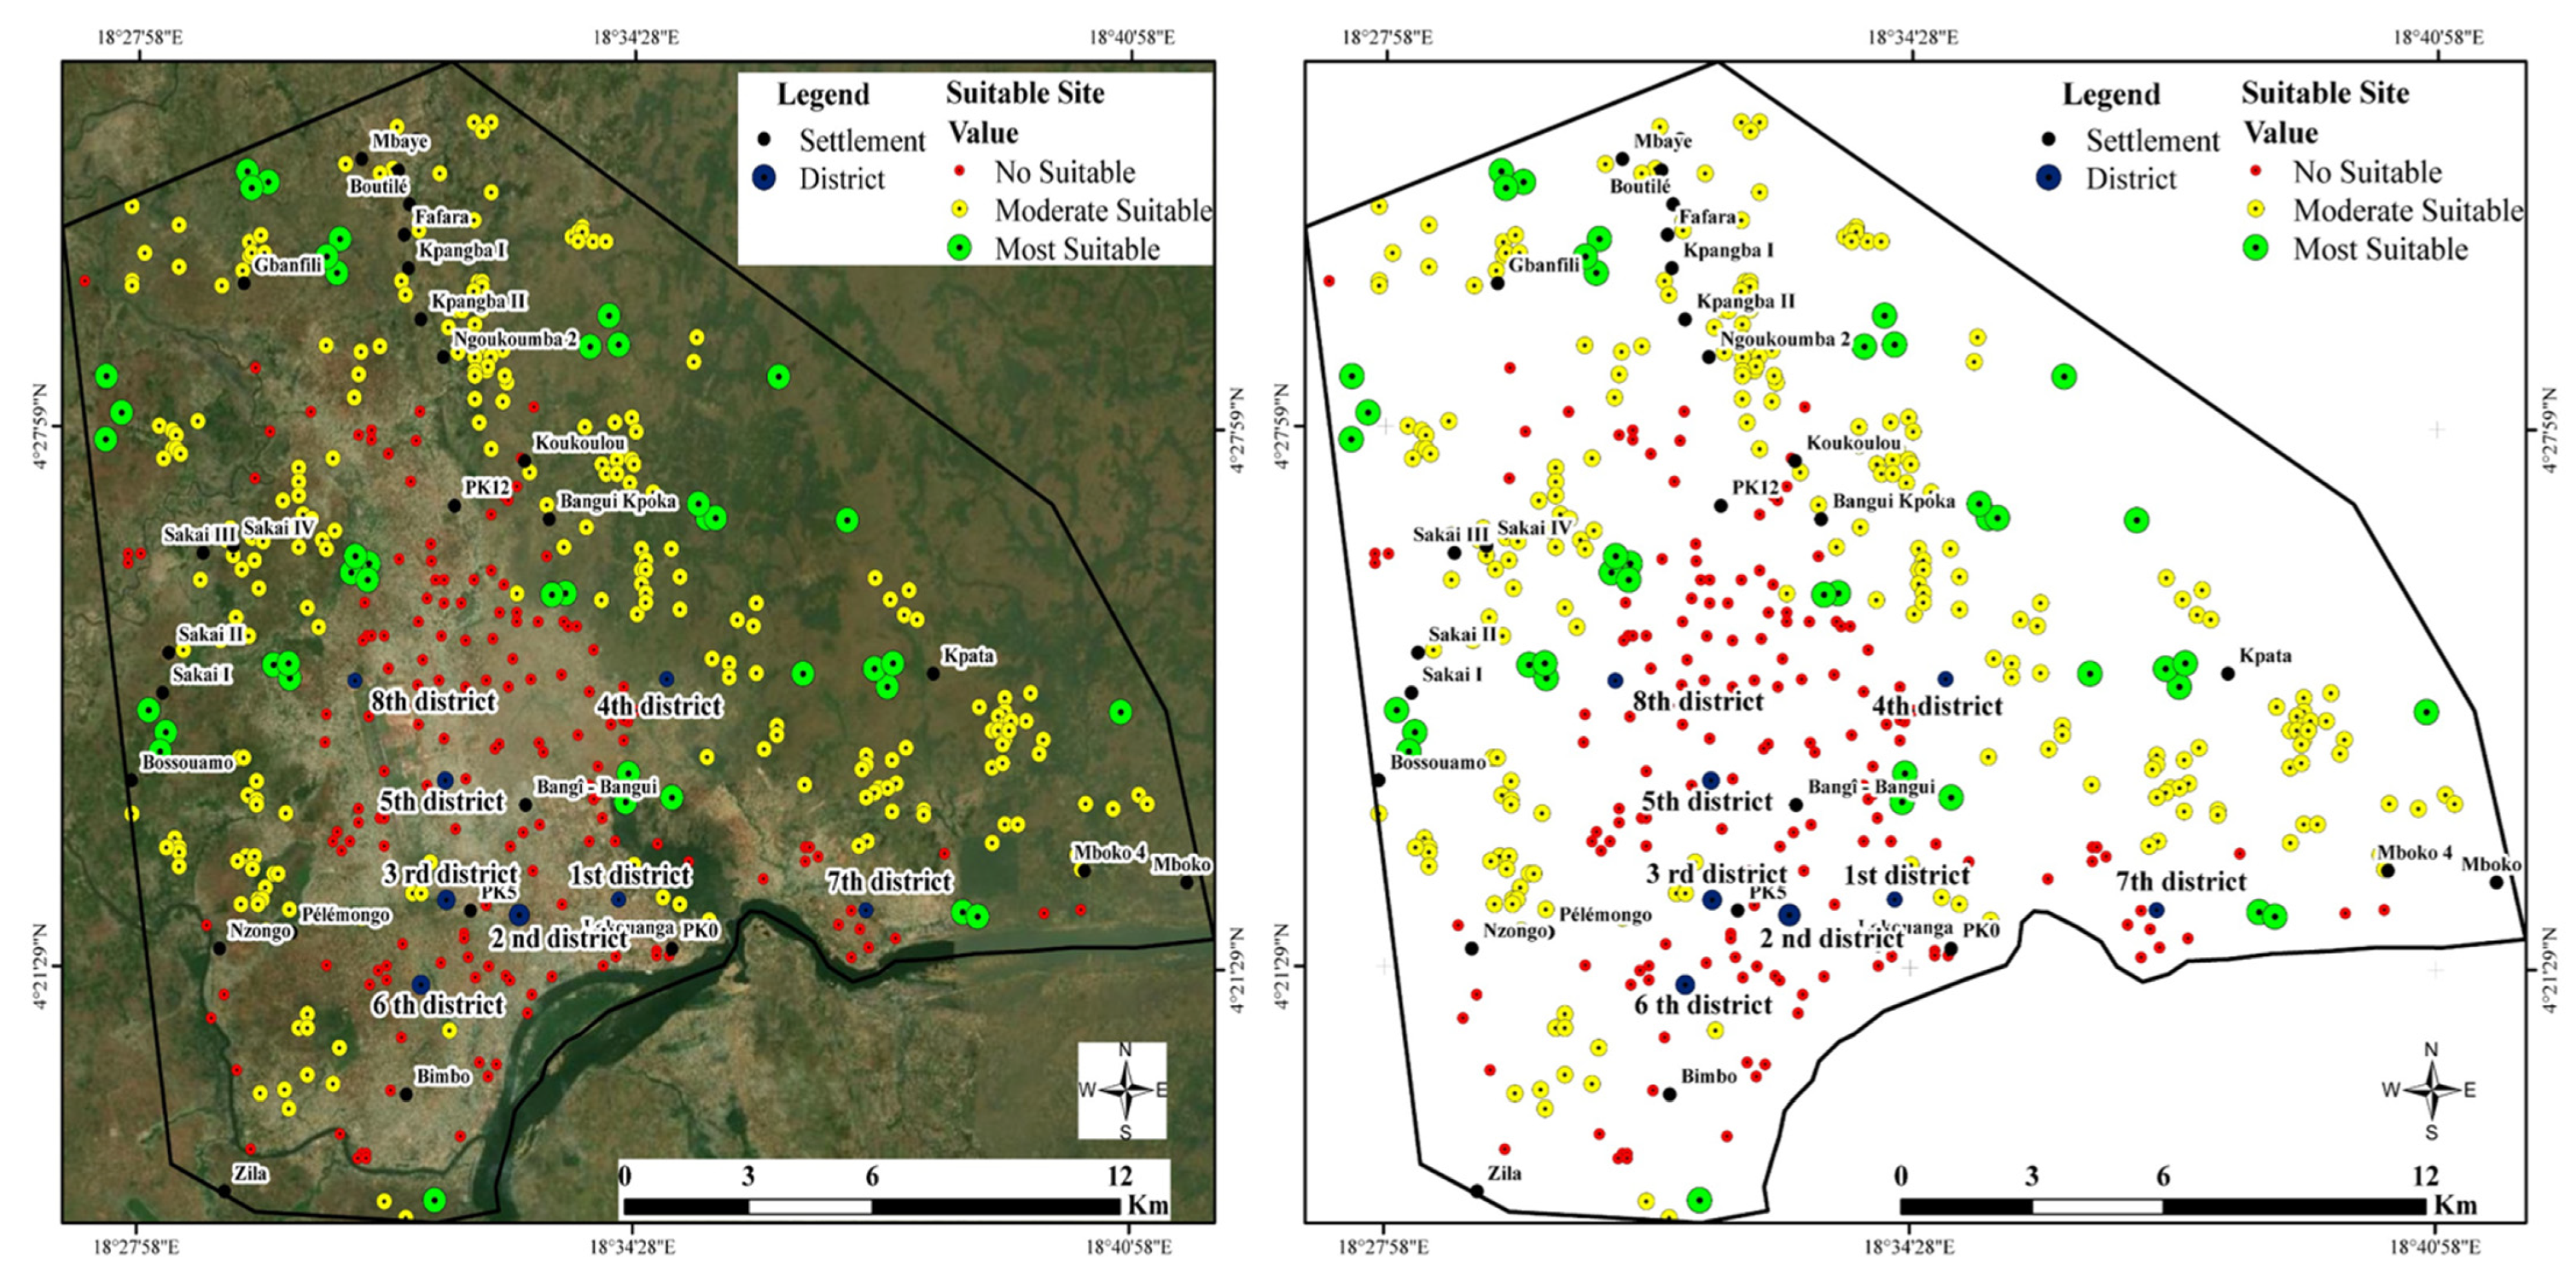
3.2. Determination of Suitable Points as Alternatives
3.3. Determination of Vector Grids as Alternatives
3.4. Biogas Plant Site Optimal Selection-Based Factors
3.5. Biogas Production and Valorization of This Site
3.5.1. Biogas Plant Operation
3.5.2. Environmental Benefits
3.6. Discussion
4. Conclusions
Author Contributions
Funding
Data Availability Statement
Acknowledgments
Conflicts of Interest
References
- Cecchi, F.; Cavinato, C. Anaerobic digestion of bio-waste: A mini-review focusing on territorial and environmental aspects. Waste Manag. Res. 2015, 33, 429–438. [Google Scholar] [CrossRef] [PubMed]
- Tricase, C.; Lombardi, M. State of the art and prospects of Italian biogas production from animal sewage: Technical-economic considerations. Renew. Energy 2009, 34, 477–485. [Google Scholar] [CrossRef]
- Weiland, P. Biogas production: Current state and perspectives. Appl. Microbiol. Biotechnol. 2010, 85, 849–860. [Google Scholar] [CrossRef]
- Domingo, J.L.; Rovira, J.; Vilavert, L.; Nadal, M.; Figueras, M.J.; Schuhmacher, M. Health risks for the population living in the vicinity of an Integrated Waste Management Facility: Screening environmental pollutants. Sci. Total Environ. 2015, 518, 363–370. [Google Scholar] [CrossRef] [PubMed]
- ISWA; UNEP; Wilson, D. Global Waste Management Outlook; International Solid Waste Association (ISWA); United Nations Environmental Programme (UNEP): Nairobi, Kenya, 2015. [Google Scholar]
- Nishio, N.; Nakashimada, Y. Recent development of anaerobic digestion processes for energy recovery from wastes. J. Biosci. Bioeng. 2007, 103, 105–112. [Google Scholar] [CrossRef] [PubMed]
- Yang, L.; Ge, X.; Wan, C.; Yu, F.; Li, Y. Progress and perspectives in converting biogas to transportation fuels. Renew. Sustain. Energy Rev. 2014, 40, 1133–1152. [Google Scholar] [CrossRef]
- Tambone, F.; Terruzzi, L.; Scaglia, B.; Adani, F. Composting of the solid fraction of digestate derived from pig slurry: Biological processes and compost properties. Waste Manag. 2015, 35, 55–61. [Google Scholar] [CrossRef]
- Ma, J.; Scott, N.R.; DeGloria, S.D.; Lembo, A.J. Siting analysis of farm-based centralized anaerobic digester systems for distributed generation using GIS. Biomass Bioenergy 2005, 28, 591–600. [Google Scholar] [CrossRef]
- Şener, B.; Süzen, M.L.; Doyuran, V. Landfill site selection by using geographic information systems. Environ. Geol. 2006, 49, 376–388. [Google Scholar] [CrossRef]
- Malczewski, J. GIS-based multicriteria decision analysis: A survey of the literature. Int. J. Geogr. Inf. Sci. 2006, 20, 703–726. [Google Scholar] [CrossRef]
- Jankowski, P. Integrating geographical information systems and multiple criteria decision-making methods. Int. J. Geogr. Inf. Syst. 1995, 9, 251–273. [Google Scholar] [CrossRef]
- Jankowski, P.; Richard, L. Integration of GIS-based suitability analysis and multicriteria evaluation in a spatial decision support system for route selection. Environ. Plan. B Plan. Des. 1994, 21, 323–340. [Google Scholar] [CrossRef]
- Church, R.L. Geographical information systems and location science. Comput. Oper. Res. 2002, 29, 541–562. [Google Scholar] [CrossRef]
- Malczewski, J. GIS and Multicriteria Decision Analysis; John Wiley & Sons: Hoboken, NJ, USA, 1999. [Google Scholar]
- U.N. Department of Economic and Social Affairs. Population Division (2018) World Urbanization Prospect: The 2018 Revision; ST/ESA/SER. A/366; U.N. Department of Economic and Social Affairs: New York, NY, USA, 2011. [Google Scholar]
- Silva, S.; Alçada-Almeida, L.; Dias, L.C. Biogas plants site selection integrating Multicriteria Decision Aid methods and GIS techniques: A case study in a Portuguese region. Biomass Bioenergy 2014, 71, 58–68. [Google Scholar] [CrossRef]
- Van der Werff, H.; Van der Meer, F. Shape-based classification of spectrally identical objects. ISPRS J. Photogramm. Remote Sens. 2008, 63, 251–258. [Google Scholar] [CrossRef]
- Chakhar, S.; Mousseau, V. GIS-based multicriteria spatial modeling generic framework. Int. J. Geogr. Inf. Sci. 2008, 22, 1159–1196. [Google Scholar] [CrossRef]
- Madlener, R.; Antunes, C.H.; Dias, L.C. Assessing the performance of biogas plants with multicriteria and data envelopment analysis. Eur. J. Oper. Res. 2009, 197, 1084–1094. [Google Scholar] [CrossRef]
- Yu, W. ELECTRE TRI (Aspects Méthodologiques et Manuel D’utilisation); Université de Paris-Dauphine—LAMSADE: Paris, France, 1992. [Google Scholar]
- Greco, S.; Figueira, J.; Ehrgott, M. Multiple Criteria Decision Analysis; Springer: Berlin/Heidelberg, Germany, 2016; Volume 37. [Google Scholar]
- Figueira, J.R.; Greco, S.; Roy, B.; Słowiński, R. ELECTRE methods: Main features and recent developments. In Handbook of Multicriteria Analysis; Springer: Berlin/Heidelberg, Germany, 2010; pp. 51–89. [Google Scholar]
- Couturier, C.; Berger, S.; Herault, I.; Meiffren, I. Anaerobic Digestion of Urban Sludge: Situation, State of the Art; Agence de l’Eau Adour Garonne: Toulouse, France, 2001. [Google Scholar]
- Couturier, C. Techniques of Power Production from Biogas and Syngas: Extended Abstract (Techniques de Production D’electricite a Partir de Biogaz et de Gaz de Synthese: Rapport Final+ Synthese); Solagro: Toulouse, France, 2009. [Google Scholar]
- La, D. Étude de la Filière de Valorisation des Boues par la Méthanisation Contexte; ENSEEIHT: Toulouse, France. Available online: http://dlibrary.univ-boumerdes.dz:8080/handle/123456789/9046 (accessed on 3 July 2022).
- Krou, N.M.B.; Baba, G.; Akpaki, O. Estimation of the Amount of Electrical Energy Available from the Biogas Produced at the Faecal Sludge Treatment Plant in the City of Sokodé. TH Wildau Eng. Nat. Sci. Proc. 2021, 1. [Google Scholar] [CrossRef]
- Nas, B.; Cay, T.; Iscan, F.; Berktay, A. Selection of MSW landfill site for Konya, Turkey using GIS and multi-criteria evaluation. Environ. Monit. Assess. 2010, 160, 491–500. [Google Scholar] [CrossRef]
- Jafari, S.; Zaredar, N. Land Suitability Analysis using Multi AttributeDecision Making Approach. Int. J. Environ. Sci. Dev. 2010, 1, 441. [Google Scholar] [CrossRef]
- Passuello, A.; Cadiach, O.; Perez, Y.; Schuhmacher, M. A spatial multicriteria decision making tool to define the best agricultural areas for sewage sludge amendment. Environ. Int. 2012, 38, 1–9. [Google Scholar] [CrossRef] [PubMed]
- Ferretti, V.; Pomarico, S. Integrated sustainability assessments: A spatial multicriteria evaluation for siting a waste incinerator plant in the Province of Torino (Italy). Environ. Dev. Sustain. 2012, 14, 843–867. [Google Scholar] [CrossRef]
- Sánchez-Lozano, J.M.; Teruel-Solano, J.; Soto-Elvira, P.L.; García-Cascales, M.S. Geographical Information Systems (GIS) and Multi-Criteria Decision Making (MCDM) methods for the evaluation of solar farms locations: Case study in south-eastern Spain. Renew. Sustain. Energy Rev. 2013, 24, 544–556. [Google Scholar] [CrossRef]
- Van Dael, M.; Van Passel, S.; Pelkmans, L.; Guisson, R.; Swinnen, G.; Schreurs, E. Determining potential locations for biomass valorization using a macro screening approach. Biomass Bioenergy 2012, 45, 175–186. [Google Scholar] [CrossRef]
- Aydin, N.Y.; Kentel, E.; Duzgun, H.S. GIS-based site selection methodology for hybrid renewable energy systems: A case study from western Turkey. Energy Convers. Manag. 2013, 70, 90–106. [Google Scholar] [CrossRef]
- Wang, X.; Yan, R.; Zhao, Y.; Cheng, S.; Han, Y.; Yang, S.; Cai, D.; Mang, H.P.; Li, Z. Biogas standard system in China. Renew. Energy 2020, 157, 1265–1273. [Google Scholar] [CrossRef]
- Paturska, A.; Repele, M.; Bazbauers, G. Economic assessment of biomethane supply system based on natural gas infrastructure. Energy Procedia 2015, 72, 71–78. [Google Scholar] [CrossRef]


| Population | Year | 2015 | 2020 | 2025 | 2030 | ||||
|---|---|---|---|---|---|---|---|---|---|
| Bangui | 798,000 a | 889,000 a | 1,016,000 a | 1,200,000 a | |||||
| Waste Amount | Generation rate | Tw | Ow | Tw | Ow | Tw | Ow | Tw | Ow |
| 0.50 Kg/person/day | 399,000 | 239,400 | 444,500 | 266,700 | 508,000 | 304,800 | 600,000 | 360,000 | |
| 0.75 Kg/person/day | 598,500 | 359,100 | 666,750 | 400,050 | 762,000 | 457,200 | 900,000 | 540,000 | |
| 1.00 Kg/person/day | 798,000 | 478,800 | 889,000 | 533,400 | 1,016,000 | 609,600 | 1,200,000 | 720,000 | |
| Biomass | tTS/yr | tww/yr | Estimated GWh (% of Total) |
|---|---|---|---|
| Municipal biowaste | 8200 | 24,500 | 24 |
| Industrial biowaste | 4000 | 8500 | 11 |
| Municipal WWTP sludge | 15,000 | 70,000 | 28 |
| Manure | 54,300 | 327,400 | 103 |
| Grass silage | 201,414 | 584,630 | 601 |
| Straw | 119,200 | 140,223 | 250 |
| Agricultural waste and side products 1 | 6800 | 47,563 | 24 |
| Total | 408,914 | 1,202,816 | 1041 |
| Slope | Dem | River | School | Land | Major Road | Local Road | Urban Growth | |
|---|---|---|---|---|---|---|---|---|
| Slope | 1 | 1.0 | 0.50 | 0.14 | 0.33 | 0.20 | 1 | 0.11 |
| Dem | 1 | 1 | 0.33 | 0.50 | 0.33 | 0.20 | 3 | 0.11 |
| River | 2 | 3 | 1 | 3 | 4 | 6 | 3 | 7 |
| School | 7 | 2 | 0.33 | 1 | 3 | 5 | 5 | 1 |
| Land | 3 | 3 | 0.25 | 0.33 | 1 | 0.33 | 0.33 | 0.14 |
| Major road | 5 | 5 | 0.16 | 0.20 | 3 | 1 | 1 | 1 |
| Local road | 1 | 0.33 | 0.33 | 0.20 | 3 | 1 | 1 | 0.11 |
| Urban growth | 9 | 9 | 0.14 | 1 | 7 | 1 | 9 | 1 |
| Type | Name | Factors | Objectives |
|---|---|---|---|
| Environmental | C 1 | Distance to the National Agricultural Reserve | Maximize |
| C 2 | Distance to the river (hydrographic network) | Maximize | |
| C 3 | Occupation and land use (qualitative assessment of adequacy) | Maximize | |
| C 4 | Agricultural soils (qualitative assessment of adequacy) | Maximize | |
| Economic | C 5 | Slope (in %) | Minimize |
| C 6 | Distance to major, national, or local roads. | Maximize | |
| C 7 | Distance to the municipal roads and paths | Minimize | |
| Social and safety | C 8 | Distance to school, industrial, commercial, and infrastructure | Maximize |
| C 9 | Distance to the urban growth (built-up areas) | Maximize |
| C1 | C2 | C3 | C4 | C5 | C6 | C7 | C8 | C9 | |
|---|---|---|---|---|---|---|---|---|---|
| b1 | 210 | 360 | 4 | 5 | 7 | 260 | 160 | 610 | 610 |
| b2 | 0 | 210 | 3 | 3 | 13 | 160 | 260 | 410 | 410 |
| qj | 25 | 60 | 0 | 0 | 3 | 30 | 30 | 60 | 60 |
| pj | 45 | 110 | 2 | 2 | 5 | 60 | 60 | 110 | 110 |
| vj | 210 | 210 | 3 | 4 | 10 | 160 | 360 | 410 | 410 |
| kj | 0.20 | 0.20 | 0.10 | 0.20 | 0.20 | 0.10 | 0.10 | 0.20 | 0.20 |
| Locality | X | Y | Area (km2) |
|---|---|---|---|
| Site (1) Sakai I | 219,049.284292 | 487,862.563174 | 3.58623 |
| 219,468.309417 | 487,372.962217 | ||
| 219,329.221672 | 486,949.507225 | ||
| Site (2) Sakai II | 222,077.644435 | 488,870.528475 | 2.68432 |
| 222,474.520229 | 488,572.87163 | ||
| 222,441.447246 | 488,903.601458 | ||
| Site (3) 4th district | 230,676.619966 | 486,456.20073 | 2.63325 |
| 230,610.474001 | 485,827.814056 | ||
| 231,734.955416 | 485,927.033005 | ||
| Site (2) 7th district | 238,779.500755 | 483,380.413328 | 2.41951 |
| 239,143.303566 | 483,281.19438 | ||
| Site (5) Sakai IV | 224,392.753232 | 491,119.491307 | 1.92323 |
| 223,962.804455 | 490,921.05341 | ||
| 224,062.023404 | 491,284.856221 | ||
| 224,359.680249 | 490,755.688496 |
| Locality | Area (km2) | Distance of Biowaste Centers to the Suitable Sites (km2) | ||||||
|---|---|---|---|---|---|---|---|---|
| MOCAF | DAMECA | BAMAG | SODECA | General Hosp | Communautaire Hosp | Amitie Hosp | ||
| Sakai I | 3.58623 | 1,036,391 | 1,226,013 | 1,226,819 | 1,347,573 | 1,193,489 | 9,528,839 | 8,982,043 |
| Sakai II | 2.68432 | 10,929,756 | 10,792,304 | 10,677,917 | 11,716,538 | 10,158,262 | 7,555,027 | 6,452,295 |
| 4th district | 2.63325 | 10,542 | 4187 | 3693 | 3792 | 2751 | 2157 | 2608 |
| 7th district | 2.41951 | 15,811,091 | 858,745 | 8,320,406 | 6,938,459 | 8,327,419 | 10,567,197 | 11,617,289 |
| Sakai IV | 1.92323 | 12,776,391 | 10,913,891 | 10,666,627 | 11,443,348 | 9,956,352 | 7,329,586 | 5,458,734 |
| Characteristic | Production |
|---|---|
| Electricity produced (Equation (1)) | 6,461,000 kWh |
| Electricity recovered (Equation (2)) | 6,137,950 kWh |
| Electricity produced in 1 h (Equation (3)) | 700.67 kWh |
| Electricity annual (Equation (4)) | 2,363,110.75 kWh |
| Thermal heat annual (Equation (5)) | 2,792,767.25 kWh |
| Electricity sells annual (Equation (6)) | 2,126,799.68 kWh |
| Thermal heat annual (Equation (7)) | 2,518,579.25 kWh |
| ORC turbine power (Equation (8)) | 20.09 kW |
| Thermal heat to electricity (Equation (9)) | 176,300.548 kW |
| Sum electricity (Equation (10)) | 2,303,100.23 kWh |
Publisher’s Note: MDPI stays neutral with regard to jurisdictional claims in published maps and institutional affiliations. |
© 2022 by the authors. Licensee MDPI, Basel, Switzerland. This article is an open access article distributed under the terms and conditions of the Creative Commons Attribution (CC BY) license (https://creativecommons.org/licenses/by/4.0/).
Share and Cite
Dima, F.A.F.J.; Li, Z.; Mang, H.-P.; Zhu, L. Feasibility Analysis of Biogas Production by Using GIS and Multicriteria Decision Aid Methods in the Central African Republic. Sustainability 2022, 14, 13418. https://doi.org/10.3390/su142013418
Dima FAFJ, Li Z, Mang H-P, Zhu L. Feasibility Analysis of Biogas Production by Using GIS and Multicriteria Decision Aid Methods in the Central African Republic. Sustainability. 2022; 14(20):13418. https://doi.org/10.3390/su142013418
Chicago/Turabian StyleDima, Francis Auguste Fleury Junior, Zifu Li, Heinz-Peter Mang, and Lixin Zhu. 2022. "Feasibility Analysis of Biogas Production by Using GIS and Multicriteria Decision Aid Methods in the Central African Republic" Sustainability 14, no. 20: 13418. https://doi.org/10.3390/su142013418
APA StyleDima, F. A. F. J., Li, Z., Mang, H.-P., & Zhu, L. (2022). Feasibility Analysis of Biogas Production by Using GIS and Multicriteria Decision Aid Methods in the Central African Republic. Sustainability, 14(20), 13418. https://doi.org/10.3390/su142013418