Article

Living on the Edge: Comparing the Quality of Life Transformation of Local Communities Induced by New Town Development in Different Peri-Urban Areas

1
Department of Urban and Regional Planning, Institut Teknologi Kalimantan, Jl. Soekarno-Hatta Km. 15, Karang Joang, Balikpapan 76127, Kalimantan Timur, Indonesia
2
Institute for Management Research, Department of Geography, Planning and Environment, Radboud University, Heyendaalseweg 141, 6525 AJ Nijmegen, The Netherlands
3
Study Program of Regional and Urban Planning, Institut Teknologi Nasional, Jl. PH.H. Mustofa No.23, Bandung 40124, Jawa Barat, Indonesia
*
Author to whom correspondence should be addressed.
Sustainability 2022, 14(20), 13435; https://doi.org/10.3390/su142013435
Submission received: 15 September 2022 / Revised: 10 October 2022 / Accepted: 13 October 2022 / Published: 18 October 2022

Abstract

:
Peri-urban development has both potential and consequences. It has consequences in terms of changes in the condition of livelihood assets and quality of life (QoL) of local communities, while it has benefits because it generates new urban activities. In theory, these impacts vary in significance for peri-urban with diverse characteristics. Therefore, this research aims to investigate and compare the impact of new town development on local communities in various peri-urban areas. Ample attention is given to two new town development projects: Metro Tanjung Bunga (MTB) in a coastal area and Kota Baru Parahyangan (KBP) in an inland area of Indonesia. There were 150 respondents involved from 13 kampungs (enclaves). The research begins with a qualitative descriptive analysis to determine the impact of development and continues with a t-test to validate and compare the magnitude of the impact in the two peri-urban areas. The findings show that the development of the new towns has resulted in a decrease in livelihood assets and community QoL levels. An intriguing finding also demonstrates that the two peri-urban areas have significantly different development impacts: coastal peri-urban communities experienced a more significant decrease in QoL than non-coastal peri-urban communities. This research would enrich the discussions about peri-urban transformation, effects of the process on local communities and sustainability of these effects in developing countries.

1. Introduction

Peri-urban development has rapidly increased throughout the past decades. Principally, peri-urban areas refer to rural areas that develop significantly due to urban expansion [1,2]. This phenomenon is marked not only by spatial transformation but also changes in these areas’ economic structure and shifts in people’s activities from agriculture to non-agriculture [3,4,5]. Chakrabarty and Abubakar [6,7] explain that the lack of long-term planning for several major cities, particularly in countries of the Global South, prevents these cities from containing the massive growth of the population alongside their activities. Additionally, peri-urbanisation is triggered by large-scale investment flows for resource exploitation [8] and the implementation of government policies to expand economic growth [9,10]. Since peri-urban areas are located in the transitional zone between urban and rural areas [1], they have unique and complex land use characteristics.
Globally, the characteristics of peri-urban areas demonstrate differences between those in developed and developing countries [4]. Peri-urban areas in developed countries are often linked to issues such as economic competition on a global scale, urban welfare, regionalisation processes and an increasingly urban population coupled with a decline in the rural population, while peri-urban areas in developing countries are more closely related to the urbanisation of the rural population and population growth [3]. Many studies about peri-urbanisation in developing countries indicate that urban expansion occurs in coastal, e.g., [11,12,13], and inland areas, e.g., [14,15], where local people rely on economic activities based on land resources, such as agriculture and fishery [16,17]. The expansion and manifestation of the development taking place in peri-urban areas can lead to shifting aspects of life for locals. This not only has implications for regional development benefits for these areas but also creates considerable challenges. According to the findings of Wu et al. [13] and Narain [18], the process of peri-urbanisation demonstrates differing impacts on locals living in different areas. Moreover, both coastal and non-coastal areas have different regional characteristics, which would give differing magnitudes of development impacts, even when the drivers are similar [2]. As noted by Zhen et al. [19], these implications encourage us to look at the differing impacts that can exist from different perspectives: in terms of responses, capability, livelihood and the shifting lifestyle of locals following the development [20].
As noted by UN-HABITAT [21], large-scale urban development mostly takes place in peri-urban areas, and 74% of these developments occur in such areas. The emergence of new town development as one of the large-scale forms of development in peri-urban areas is expected not only to become an alternative solution to reducing the gap between the city centre and peri-urban areas but also encourage regional economic growth, providing urban facilities, infrastructure and job opportunities. The International New Town Institute [22] notes that 60% of new towns are developed in the Global South, mostly in Asia and Africa. Scholars have categorised new towns based on various characteristics. In terms of economic self-containment [23,24,25], new towns can be dependent or independent. Typically, differing development focuses lead to different challenges, as found by Douglas Webster and Muller [8] and Guy and Henneberry [26].
In most cases, locals have experienced some challenges and consequences as a result of new town development [27,28]. It is not uncommon to see large-scale land development performed in the interests of one segment of the population (i.e., the elite) [29]. In the initial stage, the development evidently changes land and property rights, which are central assets of local communities [30,31,32,33]. The need for land forces locals to move to other locations [34,35] and affects their livelihoods, either temporarily or permanently [27]. Some researchers argue that large-scale development offering compensation for these assets has not managed to prevent people from becoming poor [27,36,37]. Along with the loss of assets, which are the sources of locals’ livelihoods, most people also experience socio-economic impacts [34,35] that can potentially affect the sustainability of their lives.
Fundamentally, sustainability can be linked to, or even be inseparable from, quality of life (QoL) because it represents the fulfilment and satisfaction of individuals’ or a community’s human needs. In terms of sustainability, QoL can explain to what extent individuals or a community can maintain and improve their capability to meet their daily needs [38]. Moreover, QoL can also serve as the basis for creating and maintaining sustainability through the implementation of development [39]. However, this has become a concern, since development generally occurs by exploiting environmental resources that could spoil people’s QoL and hamper the achievement of development objectives. Moreover, QoL can also reflect the degree of inclusiveness of development [40]. Through inclusive planning, the development is expected to guarantee that people would not lose the assets on which their livelihoods are based and reduce poverty [41].
Countless studies have discussed the consequences of peri-urban development, including large-scale projects such as new towns [28,37,42]. However, they provide limited evidence on the consequences of this kind of development for peri-urban areas with different characteristics [13], which should theoretically entail different responses and impacts [28,43]. Scholars, particularly those studying socio-economic development, have only partially focused on the impact of a development on community access to livelihood components—also known as capitals—such as financial capital, natural capital, social capital, human capital and physical capital. Capital, overall, is what makes up the QoL component, which reflects human needs [44]. The fulfilment and satisfaction of these components express the sustainability of life. Furthermore, only a few studies have attempted to capture the QoL of specific urban areas [18] and migrants [45]. Nonetheless, they have ignored the local community, which is the party most affected by peri-urban development [28].
Taking the aforementioned issues as the research gap and point of departure for the study, this research aims to investigate the extent to which there are differences in the livelihood assets and also QoL of the local communities living in two different peri-urban new town developments that have different geographic and socio-economic characteristics. It focuses on comparing the consequences of large-scale development in coastal and inland areas. This research is intended to contribute to ongoing discussions regarding peri-urban transformation and its consequences for local communities and the sustainability of their lives, especially in developing countries. This paper is structured into several steps. After this introduction, which provides the research background and explains the urgency and contribution of the paper, the next section provides a discussion of the peri-urban areas development in developing countries. This discussion is important to provide an understanding of new town development as the centre of activities in these areas and define QoL in social-economic development. Next, the data collection, evaluation and analysis techniques are discussed in the methods sections; in addition to the characteristics of the selected new towns and their communities and sampling techniques. Following is a description of the results in Section 4. In Section 5, the discussion is provided to reflect on the research findings and relate them to the literature review. This paper ends with conclusions and recommendations for further research in Section 6.

2. Literature Review

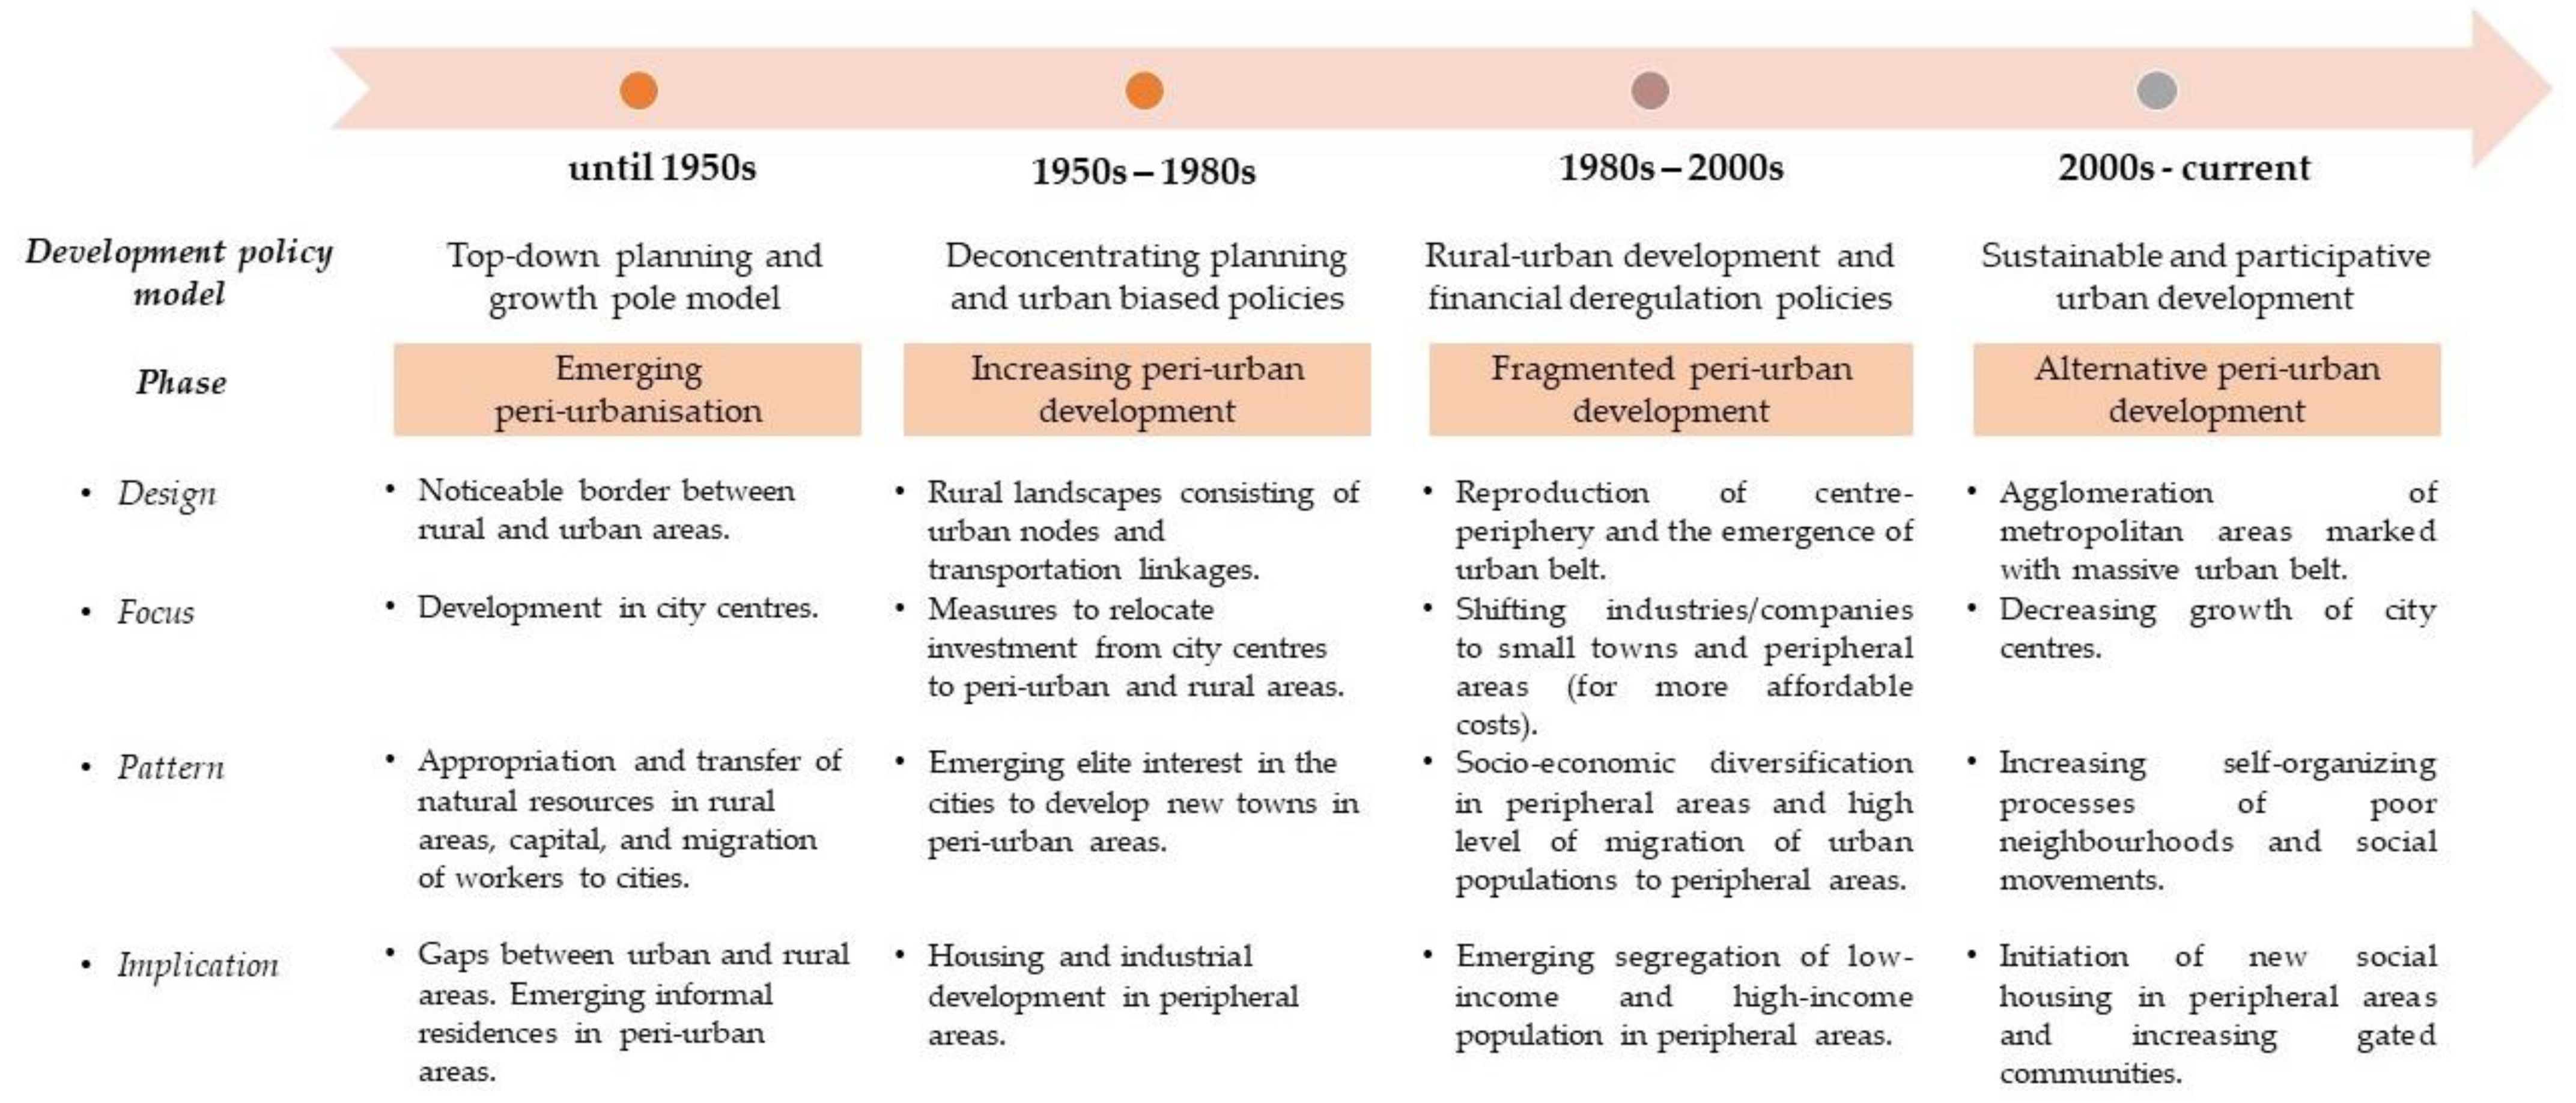
2.1. The Evolvement of Peri-Urban Areas in Developing Countries

In recent decades, several studies have implicitly and explicitly discussed peri-urban-related issues. Peripheral [46] and rural areas [47,48] have been conceptualised as transitional zones joining urban and rural areas [49]. Instead of defining such areas based on administrative boundaries, peri-urban areas are more reliably defined as functional areas that emphasise the connection and interaction between natural resources [50]. In many cases [2,4], peri-urban transformation processes have slowly taken place in terms of physical, economic and social aspects. Physically, these areas could be distinguished based on their settlement patterns, land use types, land values, population density, infrastructure supply and other factors [51]. Thus, several experts see these areas not only as places but also as processes [18,52,53].
Understanding peri-urban areas as both places and dynamic processes makes it possible to look at the development processes that occur in these areas over time [3]. This could provide an idea of the characteristics of peri-urban development, especially that which is widely taking place in the Global South. The dichotomy between rural and urban areas was around until the 1950s [48,54]. Back then, urban and rural characteristics were clearly seen [54]. However, along with globalisation and changes in public policy, the difference between the two started to fade away. In the following period (the 1950s–1980s), rapid urbanisation and the expansion of urban areas to peripheral areas became more noticeable due to housing and industrial development [3]. This was stimulated by foreign capital investment and public policy, which contributed to the development of activity and commercial, transportation and technology innovation centres [2,3,55]. During the phase of fragmented peri-urban development, characteristics of an urban belt located between urban and rural areas surfaced. In this period, socio-economic society in peri-urban areas was divided between haves and have-nots. To date, peri-urban areas have been growing. Since the 2000s, metropolitan areas have drastically increased, in line with city centres’ declining development. During this period, massive, luxurious gated housing developments were also apparent [3]. Additionally, Coy, Sandholz, Töpfer, and Zirkl [56] explain that peri-urban development could become unpredictable due to its independent and unique way of progressing. A summary of peri-urban development phases is presented in Figure 1.
Peri-urbanisation often takes place in specific locations. In some cases, peri-urban development takes place in coastal areas, such as in developing countries in eastern Asia. Locations include cities such as Shanghai and Guangzhou in China [60,61], Bangkok in Thailand and several urban regions in Malaysia, the Philippines and Indonesia [2]. Peri-urbanisation is also apparent in highland areas located further away from coastal areas, such as Swiss areas and urban areas in Athens, Greece [61,62]. Additionally, this process is obvious in the agglomeration of urban areas such as Huancayo Metropolitan and mountainous towns in Peru [63] and even in peri-urban areas in arid regions such as Greater Cairo, Egypt [64].
In the case of Indonesia, the development of peri-urban areas often takes place in primary towns or agglomerations of growing towns, mostly along the coastal areas whose community members work in fishery. But in some cases, it can also be found in inland areas that are dominated by agricultural activities. This condition is inextricable from the fact that in Indonesia, as an archipelagic state, 70% of its big cities are located in coastal areas [65] and 33.2% of its land used for agriculture [66]. Another study also discovered that most agricultural land sits in peripheral areas [67].
The characteristics of people living along the coast and inland have different implications for peri-urban development. Development has not only spatial but also social and economic consequences [68,69], such as changes in the community’s quality of life and livelihoods [70,71]. The geographical and sociological characteristics of the community can hypothetically be deemed triggers for various development impacts. Geographically, coastal areas are the first to see large-scale foreign investment, making coastal development dynamics more complex than those of inland areas with a much more limited peri-urbanisation process [2,72]. In addition, coastal communities are generally poorer than inland communities [73]. This is due to differences in perceptions of living standards, ecological conditions and geographic isolation, which causes coastal communities to have a lower level of development than inland communities [73].
The penetration of physical, social or economic development in peri-urban areas is deemed to have led to both opportunities and problems that accompany modernisation [74]. The problems are triggered by weak development policies, bad governance and poorly planned land use [75]. Consequently, issues such as social inequality, a lack of urban infrastructure [75,76] and environmental problems are surfacing [77].

2.2. New Town Development: Solutions for Providing New Urban Activities in Peri-Urban Areas

New town development is not a new phenomenon regarding the expansion of urban activities. This kind of development is seen as a form of urban development [24,78,79,80] and, in some cases, also a form of urban redevelopment [81,82,83]. According to its economic self-containment, a new town can be categorised into two types of towns: dependent and independent. The former is primarily intended to back up the town centre [59,84]. This kind of town is developed uniformly to accommodate a large population and many infrastructural services [46,85,86]. It is also planned close to the primary city [87,88,89], which sees high numbers of commuters [42,88] and depends on services and facilities in the main city [86]. Meanwhile, the independent town is relatively self-sufficient economically, socially and physically [24]. It allows for mixed-used and integrated space utilisation outside the administrative area of the primary city [7,90], provides extensive job opportunities [91] and prevents commuter traffic from extending to the main city centre [92]. Practically, in several cases, the independent town also serves an administrative function [7,93,94], such as a new national capital city. Putrajaya Malaysia [95], Brasilia [96] and several new African cities—Abuja, Dodoma, Gaborone and Lilongwe [7]—are examples.
Although in its implementation, new town development is often found in urban areas, such as Manhattan [24], Multicentro in Bogota [97], Wujin in Changzhou city [98] and Sadra Town in Iran [99], it looks more promising when it takes place in peri-urban areas. These areas provide extensive and cheap land, have a high investment potential and are supported by abundant natural resources and cheap labour, making this kind of large-scale development very suitable [4]. Additionally, new town development will open up new growth centres, reducing the economic gap between the city centre and its suburbs. However, some experts have pointed out that new town expansion failed to generate new economic activities, especially for local communities, because of its temporary nature. New town developments have been increasingly popular in developed countries in Europe and North America since the mid-1970s [100]. This trend has also reached countries in the Global South, including Indonesia [93].
In Indonesia’s case, new town development is no longer a new phenomenon, as it has taken place since independence. Ford [101] explains that this kind of development began in 1950 with the Kebayoran Baru project and became more massive in the late 1980s. Among practices of town development in Indonesia, the development of satellite and new independent towns is more common. Kartiwa [102] found that 40 new towns were developed from 1990 to 2010, with 22 new towns following in the next decade. Of these, 70% were located on the outskirts of the Jakarta Metropolitan Area. Moreover, the Indonesian government currently plans to relocate the national capital city, which will be a new town, to Penajam Paser Utara and Kutai Kartanegara in East Kalimantan. This indicates that there is decentralisation in the development of new metropolitan areas in Indonesia.
New town development in Indonesia has evidently positively contributed to the development of spatial structures, bringing new growth to new areas and reducing the burden on main city centres [103]. Regarding investment, the economic value of land near a new town location increases by more than 100% [104]. For example, Bumi Serpong Damai (BSD) has managed to stimulate a tertiary economy involving industrialisation [45] followed by trade and services, contributing 70% of regional revenues [105]. Meanwhile, new town development integrated with other activities can provide jobs, leading to higher monthly incomes. This can contribute to the fulfilment of human needs, as seen in BSD [45] and Bukit Semarang Baru [106]. Further, public facilities’ availability means locals have access to services, minimising the physical and economic gap between peri-urban areas and the main city.
Although new town development in peri-urban areas leads to opportunities for the development of regions, it also has consequences for local people who depend on economic activities that rely on land resources, such as agriculture and fishery [16,17]. At a basic level, this kind of large-scale development has evidently changed land and property rights, which are central assets in local people’s lives. The transformation of these rights has caused locals to lose their livelihood assets, which not only impacted their income [19,107,108] but also their living conditions [109,110], environmental quality [77,111,112] and even interactions and social life [45,113], among other impacts [114]. All of these outcomes potentially have different effects on their QoL. Therefore, as mentioned in Section 1, this study conducts a detailed investigation of the magnitude of the impact of new town development on the QoL of local communities.

2.3. Measuring Quality of Life in Socio-Economic Development

The concept of quality of life has been defined in different ways. This notion has expanded in various directions into the fields of environment, development, urbanisation and marketing studies, among many others. Despite these varied perspectives, Sirgy [38] has succeeded in establishing an understanding of QoL according to six different theoretical perspectives: economic development, personal utility, justice, human development, sustainability and functioning. The first is regarded as being able to explain QoL since it does not only focus on the physical improvement of the areas but also on the improvement of economic and social conditions. The economic aspect is inextricable from the social one, both of which are closely related to establishing each individual’s welfare [115]. Welfare is determined by the extent to which people manage to control or create opportunities to meet their needs through the ownership and utilisation of assets [116,117].
QoL is constructed by a set of components closely related to the standard of living, or each individual’s welfare (see Figure 2 for details). From an economic perspective, the components of QoL consist of income, employment and housing. All these components are generally used to assess welfare [118]. Income and employment are evidence of individuals’ economic productivity, and this productivity can be further utilised to meet other needs. Homeownership not only reflects the social status of an individual [119] but also represents that individual’s level of welfare [120]. Moreover, these days, buying a house is not a simple matter, as prices are rocketing while housing is among an individual’s primary needs. This situation highlights the status of individuals. From another perspective, health and education make up social aspects of QoL. Human resources are needed to enhance economic productivity and individual interaction [121]. Likewise, a social perspective represents a connection between individuals and their neighbourhood or other society members. A higher level of interaction, higher position and more participation of an individual in society will improve their life quality. Thus, social bonds and political freedom should also be considered as QoL components [44]. On the other hand, Keles [111] asserts that QoL is closely connected to the presence of resources required to support economic activities. Good environmental quality is also related to people’s health, which is fundamental in social activities [112].
In general terms, QoL can be evaluated through interactions between livelihood assets and human needs (Figure 3). Livelihood assets, also known as opportunities [44], include natural, social, financial, human and physical capital. Each represents environmental and natural resources conditions, relationships and interactions between people, financial resources, human resources and infrastructure. These assets are a central element in meeting the needs of both individuals and groups. Notably, each of the eight-component assets of QoL represents a focal set of human needs. These eight defined components can be turned into several indicators (See Table 1) to be used as the basic standard to assess the fulfilment of human needs and satisfaction, representing objective and subjective measurements [124], also known as objective and subjective QoL in much of the literature [120,125,126]. The former is carried out based on norms or standards in measuring individual needs’ fulfilment [126,127]. These norms or standards can refer to regulation, government policy or certain studies’ results. On the contrary, a subjective QoL relies on individual perceptions and opinions [128,129]. This approach provides freedom for individuals to assess their satisfaction regarding their needs in life. Although they can provide more information about individual conditions [130], in some cases the different responses given by each individual make it difficult for researchers to draw conclusions [131]. Therefore, the combination of objective and subjective measurements helps to more reliably describe the level of QoL.
Although scholars have classified QoL positions into well-being, deprivation, dissonance and adaptation [130,134], there are limitations in the literature regarding the order of these QoL levels. Evaluating each position’s rank is necessary to see the composition of the welfare level of individuals or groups experiencing development impacts. Foo [135] explains that objective—and not subjective—QoL should be the main consideration when assessing QoL. This idea certainly emerged due to the existence of more reliable measurements to assess human needs. In line with this opinion, Noll [136] also stresses that subjective QoL is not sufficient for explaining the welfare conditions of an individual and group in a representative way because it is based on perception only. By following these considerations, the overall QoL level sequence is well-being, dissonance, adaptation and deprivation (Figure 4).
The highest level exists when an individual or group lives in optimal conditions to fulfil and satisfy their human needs. Deprivation, on the other hand, occurs when the individual or a group is in the worst condition and fulfilment and satisfaction of their human needs are at the lowest level [135]. Adaptation and dissonance are considered ‘middle’ conditions [130,135], but dissonance is deemed as ranking above adaptation because it is qualified to fulfil needs according to the minimum standard of living, although with a low level of satisfaction. This is also known as the dissatisfaction dilemma [130]. Considering the adaptation, those who are at this level must try to accept and be satisfied with how their needs are fulfilled, even though this is not followed by the standard of a fulfilling life. Therefore, the level of adaptation is considered pre-prosperous, as is deprivation.

3. Materials and Methods

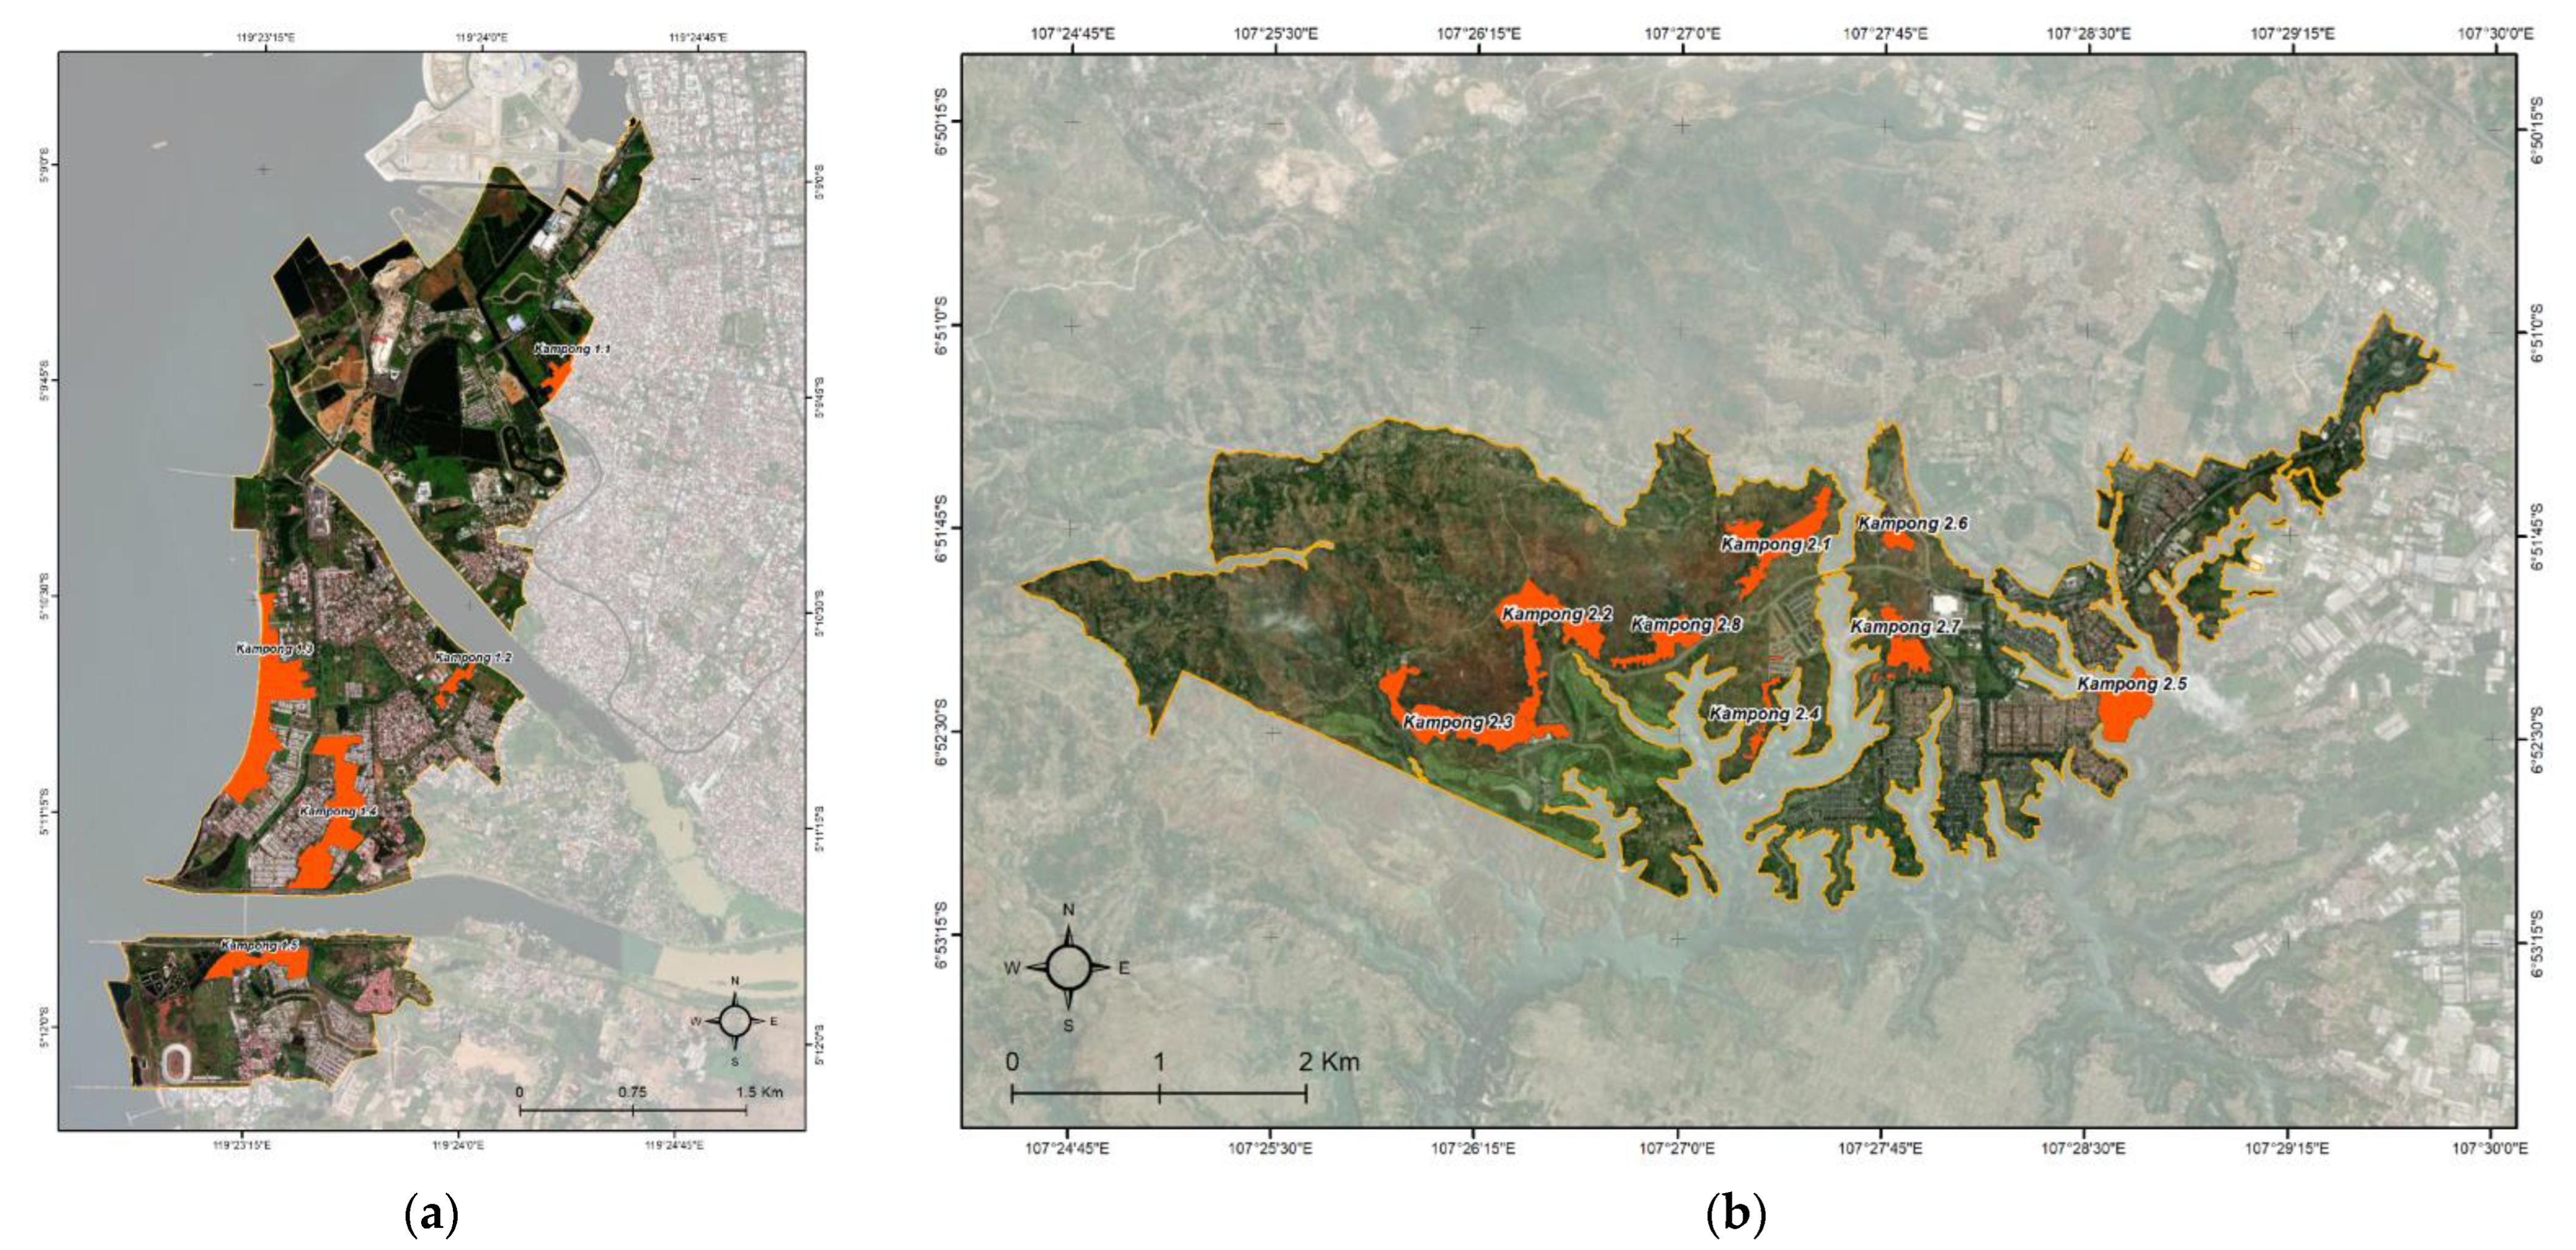
3.1. Research Location

This research was conducted in two new town development locations in peri-urban areas in Indonesia: Kota Baru Parahyangan (KBP) and Metro Tanjung Bunga (MTB). The former town was developed by PT [Perseroan Terbatas] Belaputera Intiland (Lyman Group) in 1997 with a total designed area of 1250 ha. KBP is categorised as a self-sufficient town. It provides not only residential space but also social and public infrastructure at the urban scale [137]. Meanwhile, MTB—which was planned as a satellite town—was set up on top of land extending to 1200 ha in 1996 [138]. This town was designed as a mixed-use and integrated area to support the Mamimasata Metropolitan area [139]. Because of its location in a coastal area, developer PT Gowa Makassar Tourism Development has been acquiring ponds and swamp areas throughout its development, which were the sources of livelihood for fishers and pond farmers in this location.
Since this research is concerned with the consequences of the new town development process for the sustainability of communities, data collection focused on the kampungs (enclaves) around the development location. These kampungs are dispersed and existed long before the penetration of urban development. Thus, local communities affected by the new town development sought refuge in these kampungs, which became the centre of their activities [140]. Based on the interpretation of a 1993 aerial photo and 2017 Pleiades satellite images, which were then confirmed with the result of interviews with key actors, a total of 13 kampungs were located, with eight kampungs spread across four villages in KBP and five kampungs in three subdistricts of MTB (see Table 1). The distribution of kampungs in the research locations is shown in Figure 5.

3.2. Sampling

Data were collected using the purposive sampling method at the household level. This method, also referred to as an expert or judgemental sample [141], was selected because we needed detailed and more in-depth information related to this research’s object. For this method, researchers’ knowledge and capability when determining and exploring information are central. The respondents selected were local communities that initially inhabited or worked at the new town development site. Those individuals who conformed to the criteria were then randomly selected so that each individual fulfilling the criteria had an equal opportunity to become a respondent. This purposive method—traditionally associated with a small sample [141,142]—has a limitation caused by its subjectivity [143], which may trigger a bias in research data, as explained by Barratt and Lenton [144]. To minimise this weakness, we decided to increase the number of respondents involved. Klar and Leeper [145] argue that the addition of data can sharpen and improve the reliability of research data, whereas Etikan [146] and Rivera [147] claim that the minimum number of respondents should be at least 30 if data is to be confidently employed for parametric statistical tests.
A total of 150 questionnaires were designed to be distributed evenly in each kampung from October to December 2019. However, in several kampungs, we encountered difficulties in collecting data due to security and privacy concerns. As a consequence, we added respondents from other kampungs to meet the minimum number of respondents required. The respondents’ distribution is presented in Table 2 and Figure 5.
Generally, prior to the development, the majority of respondents who lived around the KBP location worked in agriculture, as landowners (65%), farmers (30%) and others (5%). With the influence of rural activities being strong, their average income is below the minimum regional income (UMR) (55%). While in different locations, local MTB communities have livelihoods as fishermen (48%), fish-pond farmers (42%) and others (10%). Similar to the welfare level of other coastal communities in Indonesia [148], as many as 60% of respondents have an income below the UMR.

3.3. Evaluation of Data Survey

We evaluated the data survey by performing some statistical procedures to check the data’s validity and reliability. Factor analysis was applied to determine the factor structure pertaining to the QoL indicators. This analysis validates research instruments by structuring indicators or research items [149]. Following Hair et al. and Ghozali [150,151], the observed data should first have a factor loading of more than 0.50 so that it is considered to have strong validity to describe the latent construct (in this case the QoL component). The result from 26 indicators shows that they were loaded into eight components and that as many as four indicators corrupt the factor structure with values below the minimum threshold. They were taken out of the survey, and the most acceptable factor structure was achieved, as presented in Table 3.
Furthermore, a reliability test was performed by investigating the Cronbach Alpha (α) value to measure the internal consistency of a test or scale [152]. The test was carried out on 22 indicators of objective and subjective QoL. Table 3 shows that most reliability coefficients (α) are over 70%, which means that this data displays an adequate reliability value [153,154,155]. The highest value coefficients (α) found in income and housing are over 90%, reflecting excellent reliability.

3.4. Measuring Transformation of Livelihood Assets and QoL Level

The analysis performed in this research began with the measurement of the livelihood asset level and assessment of local people’s level of QoL in two different locations, MTB and KBP, before and after the penetration of development. Following Koenig (2001), after-development conditions represent the phase after land acquisition for the new town development. Through this analysis, we can gain insights into the effects of the new town development on local people’s livelihood assets and QoL. As an initial stage, the measurement of livelihoods’ assets involved the following steps:
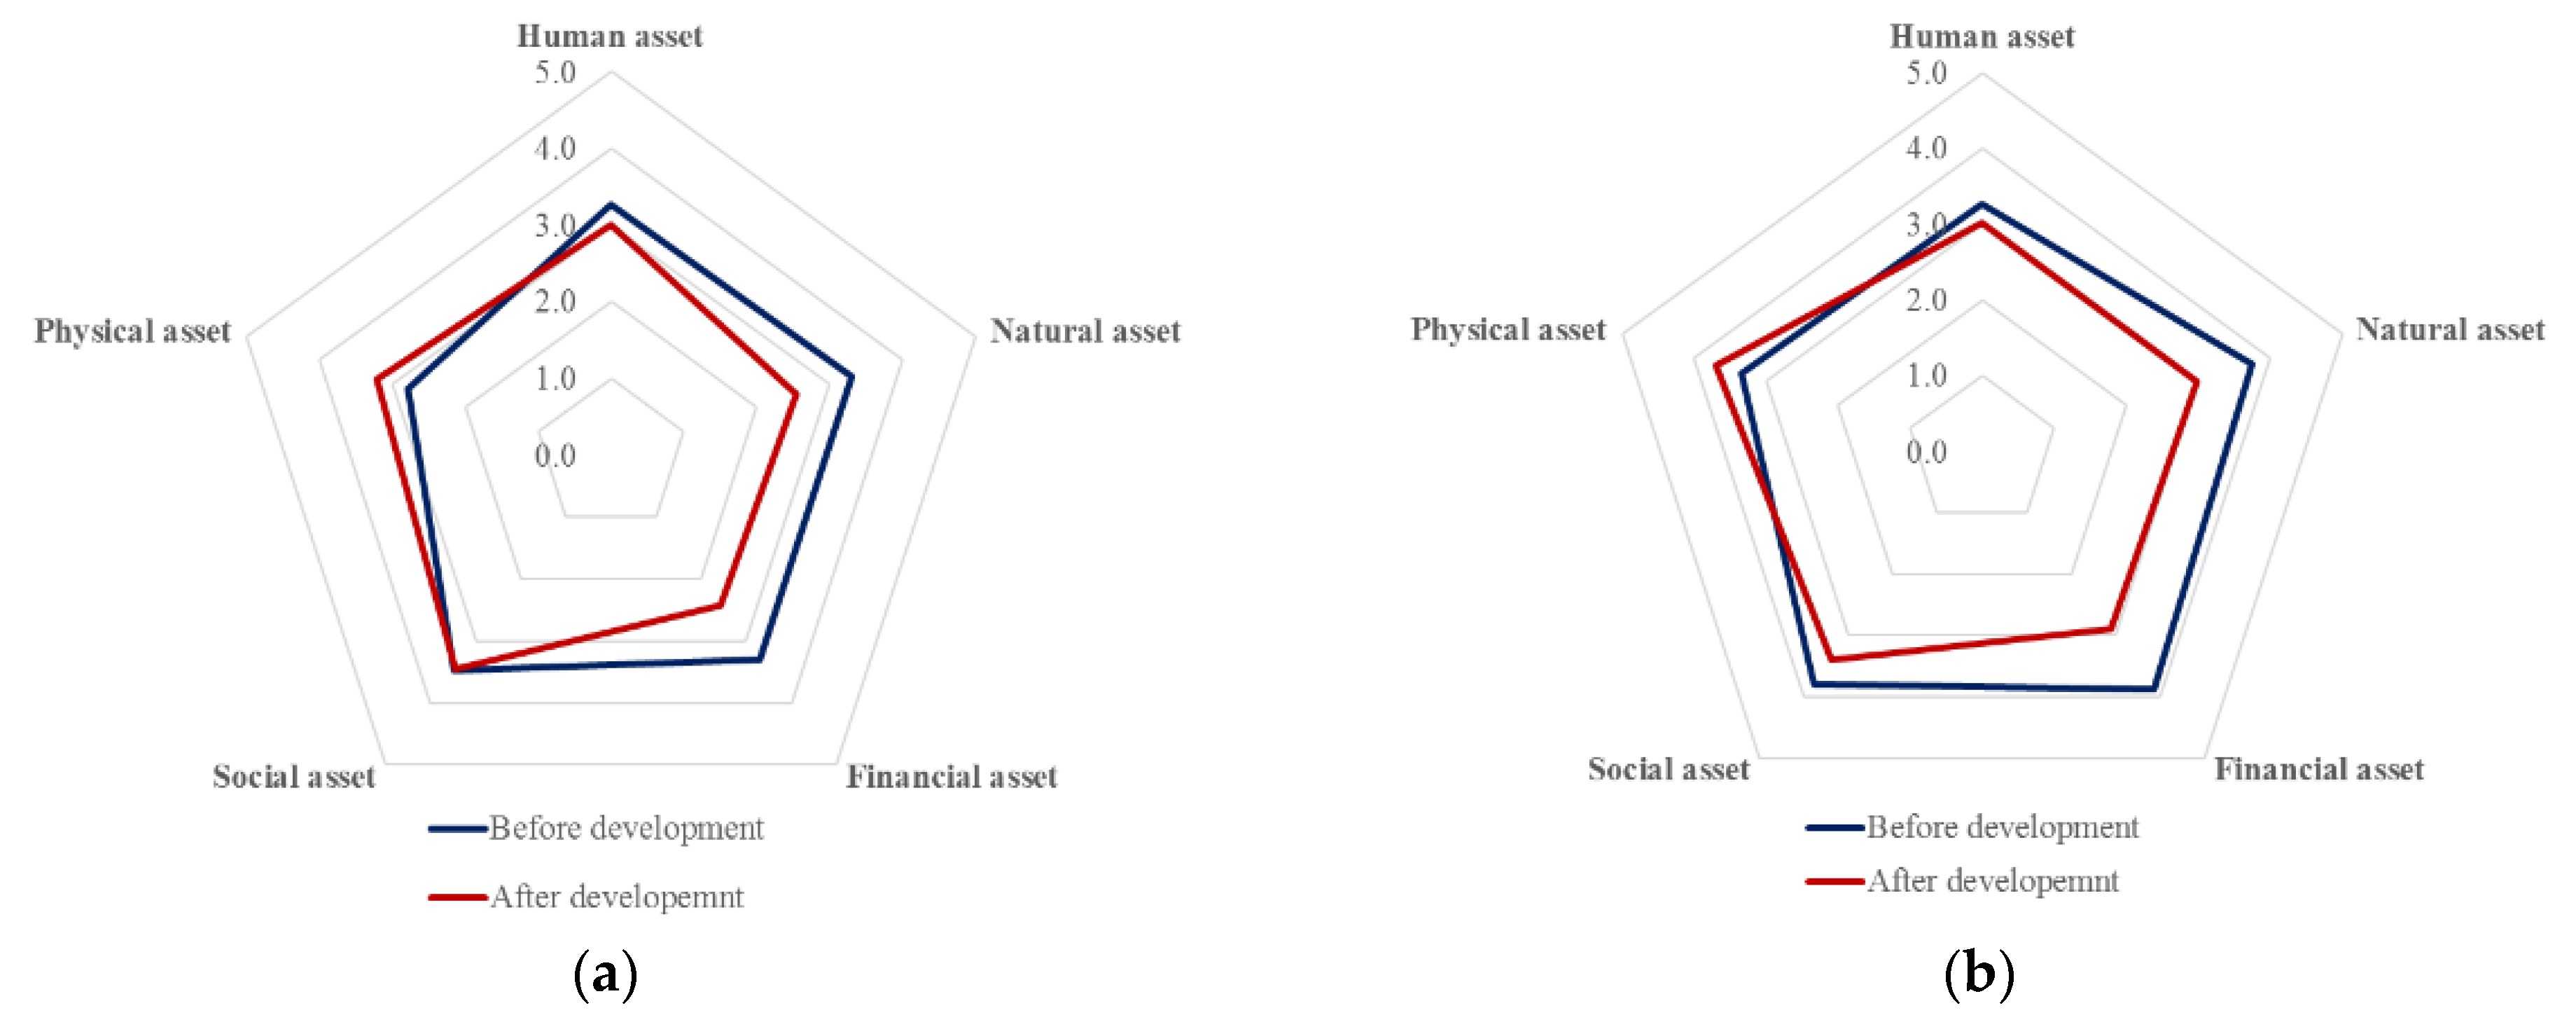
  • Setting indicators of livelihood assets: natural, financial, social, human and physical assets, according to the literature review conducted.
  • Scoring livelihood assets and classifying scores of the assets. The score for each indicator ranges from 1 to 6, where ≤3.0 is categorised as bad and >3.0 is categorised as good.
Furthermore, QoL assessment was carried out by considering both objective and subjective evaluations. The steps that need to be taken to analyse the QoL level are as follows:
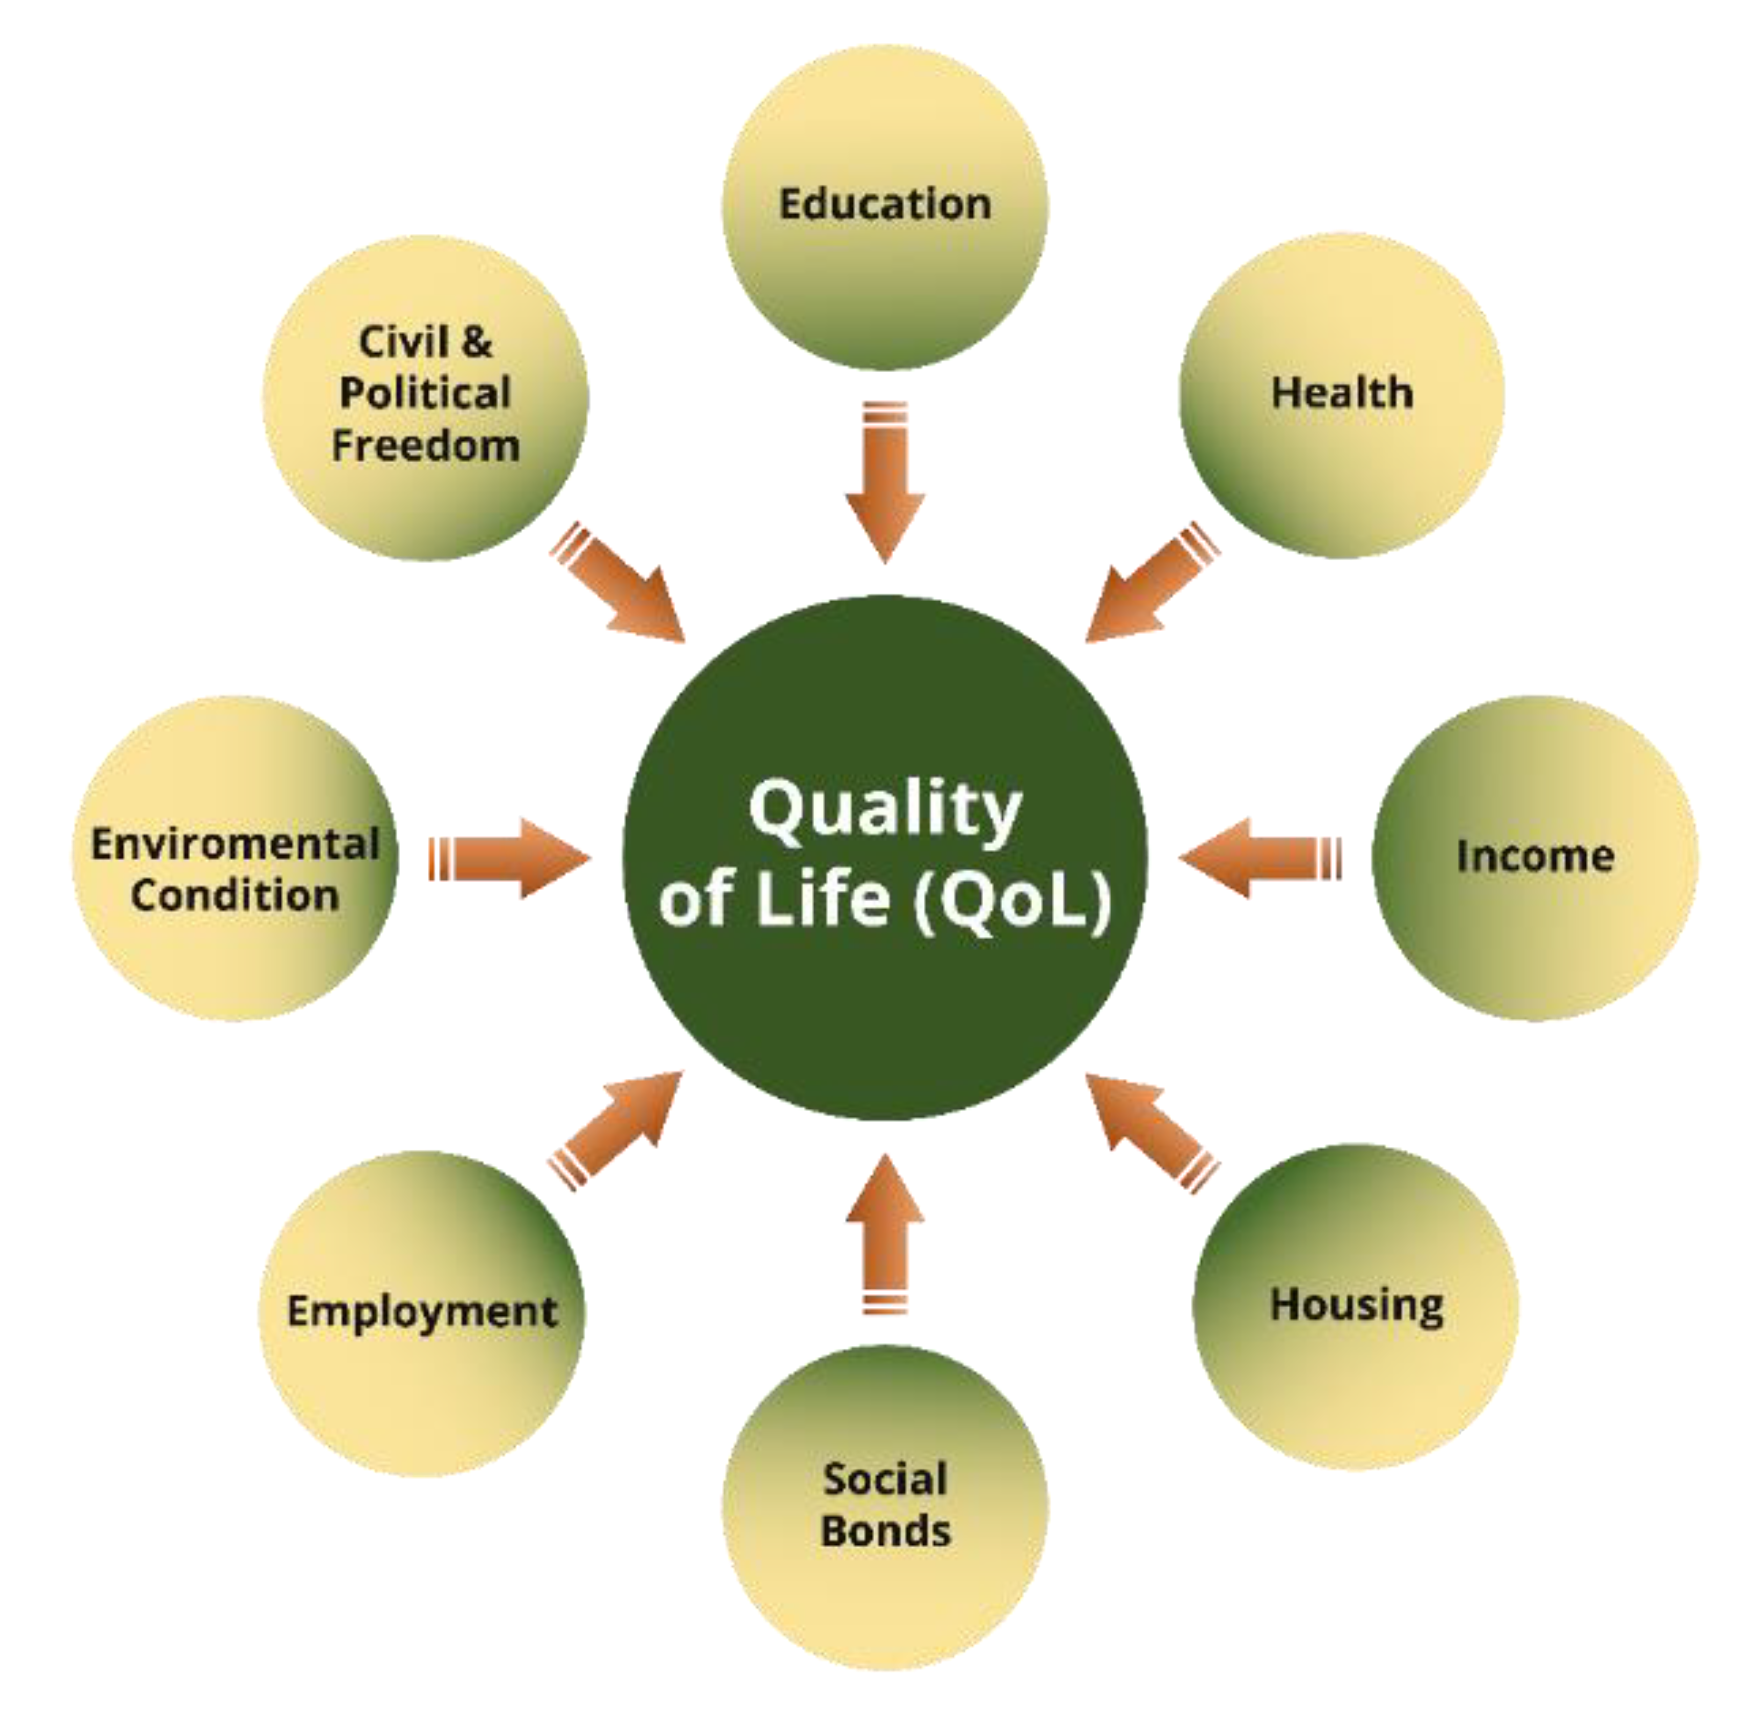
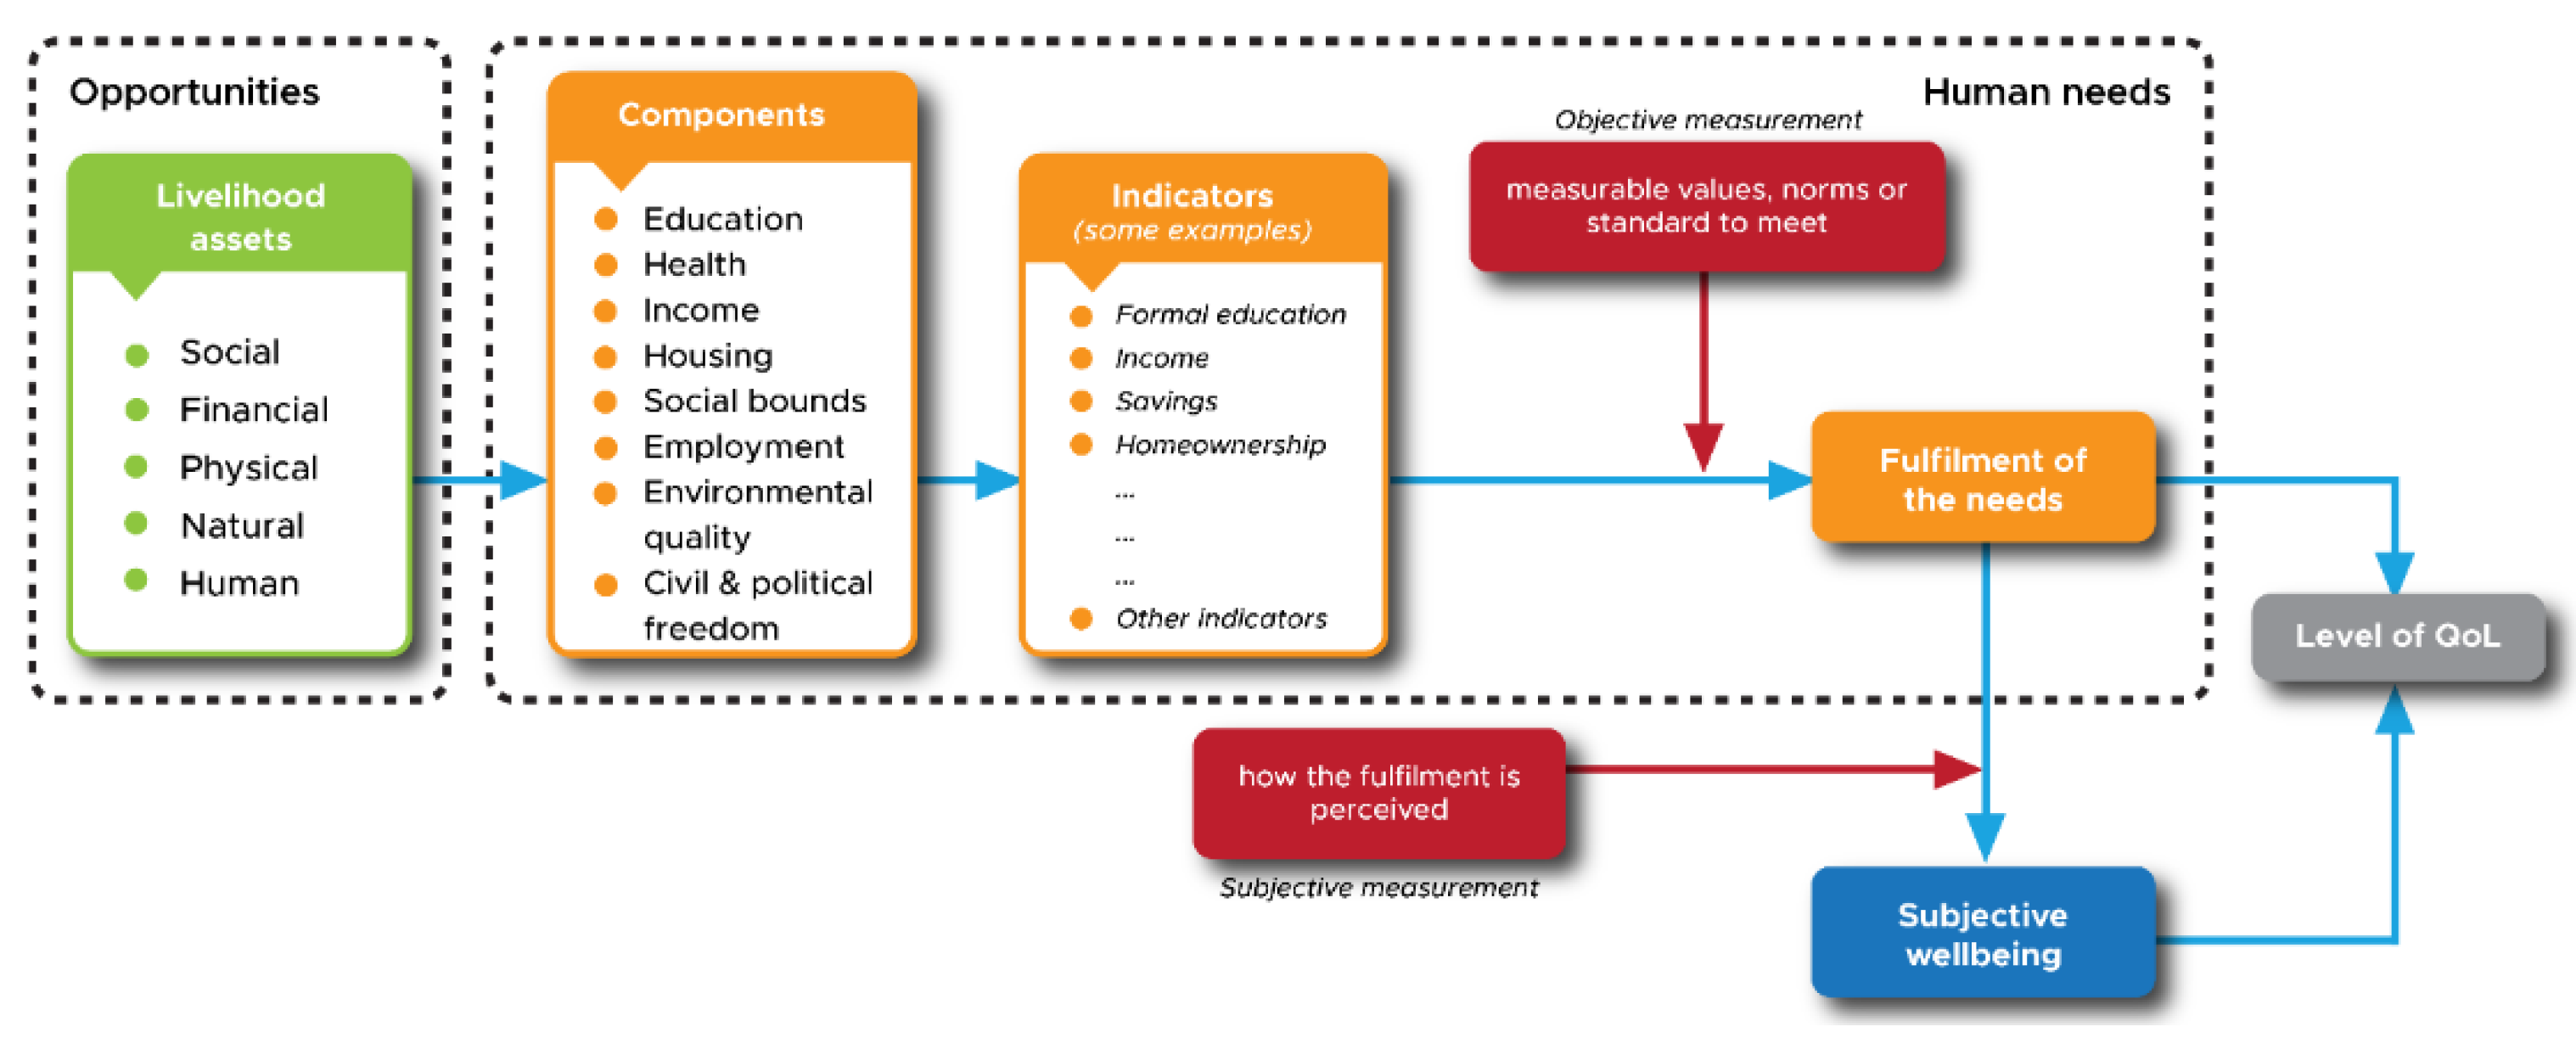
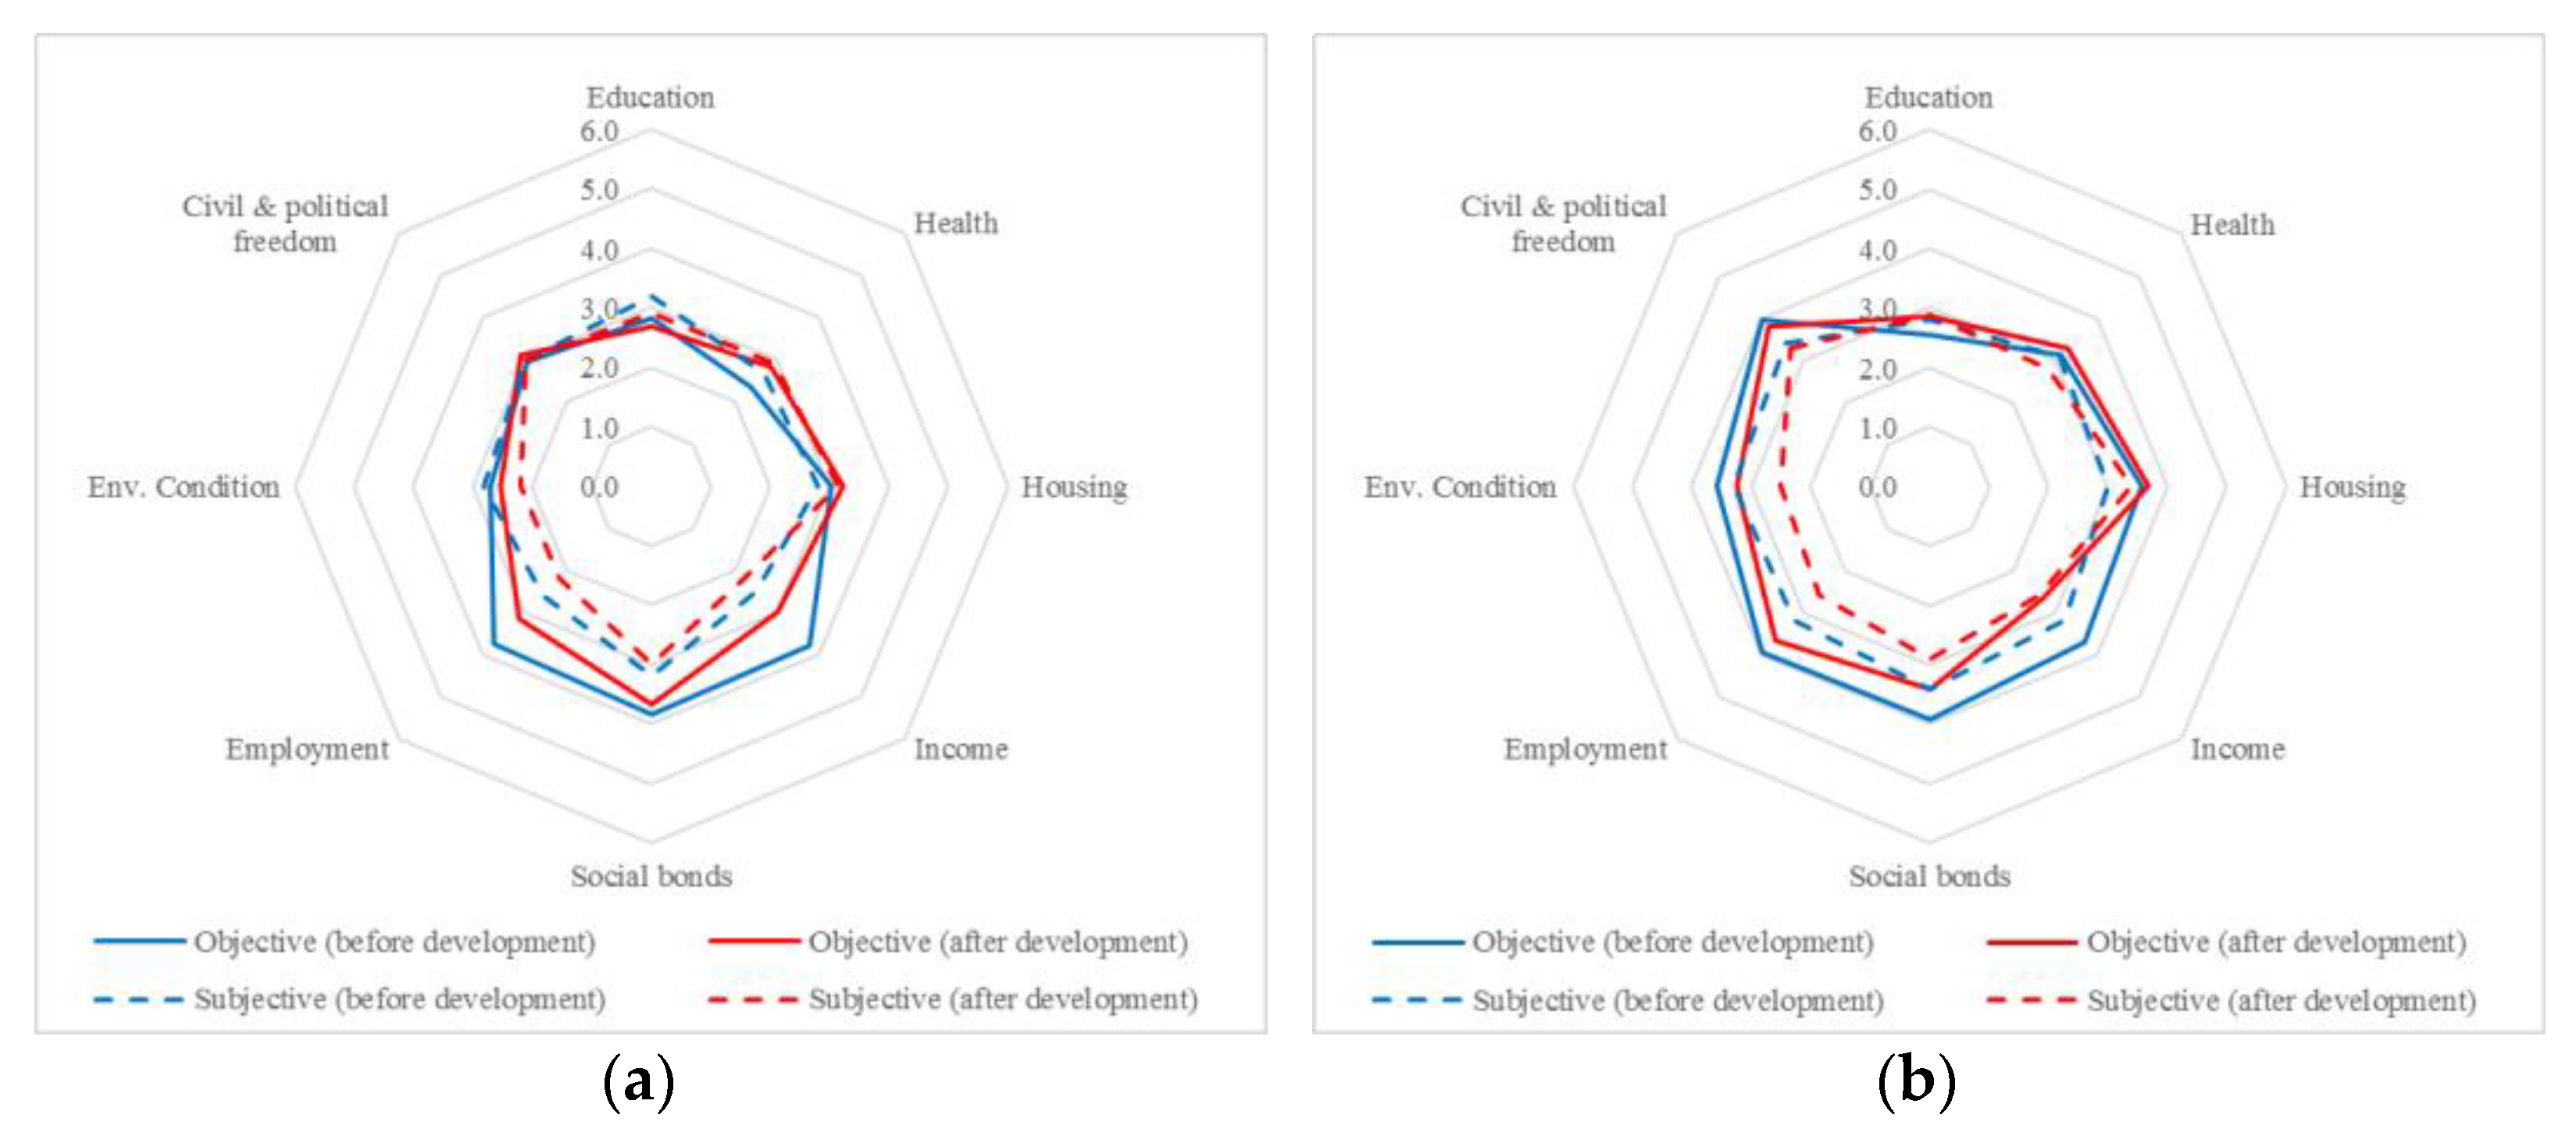
  • Determining the indicators used to assess QoL in both an objective and a subjective manner. Eight QoL indicators were used, formed by 22 indicators. These indicators came from five livelihood assets: natural, financial, social, human and physical assets.
  • Classifying the average total value of the objective and the subjective QoL. If both values were in the range of 3.1–6.0, they were considered good. Conversely, if the subjective and objective values were ≤3.0, they were considered bad.
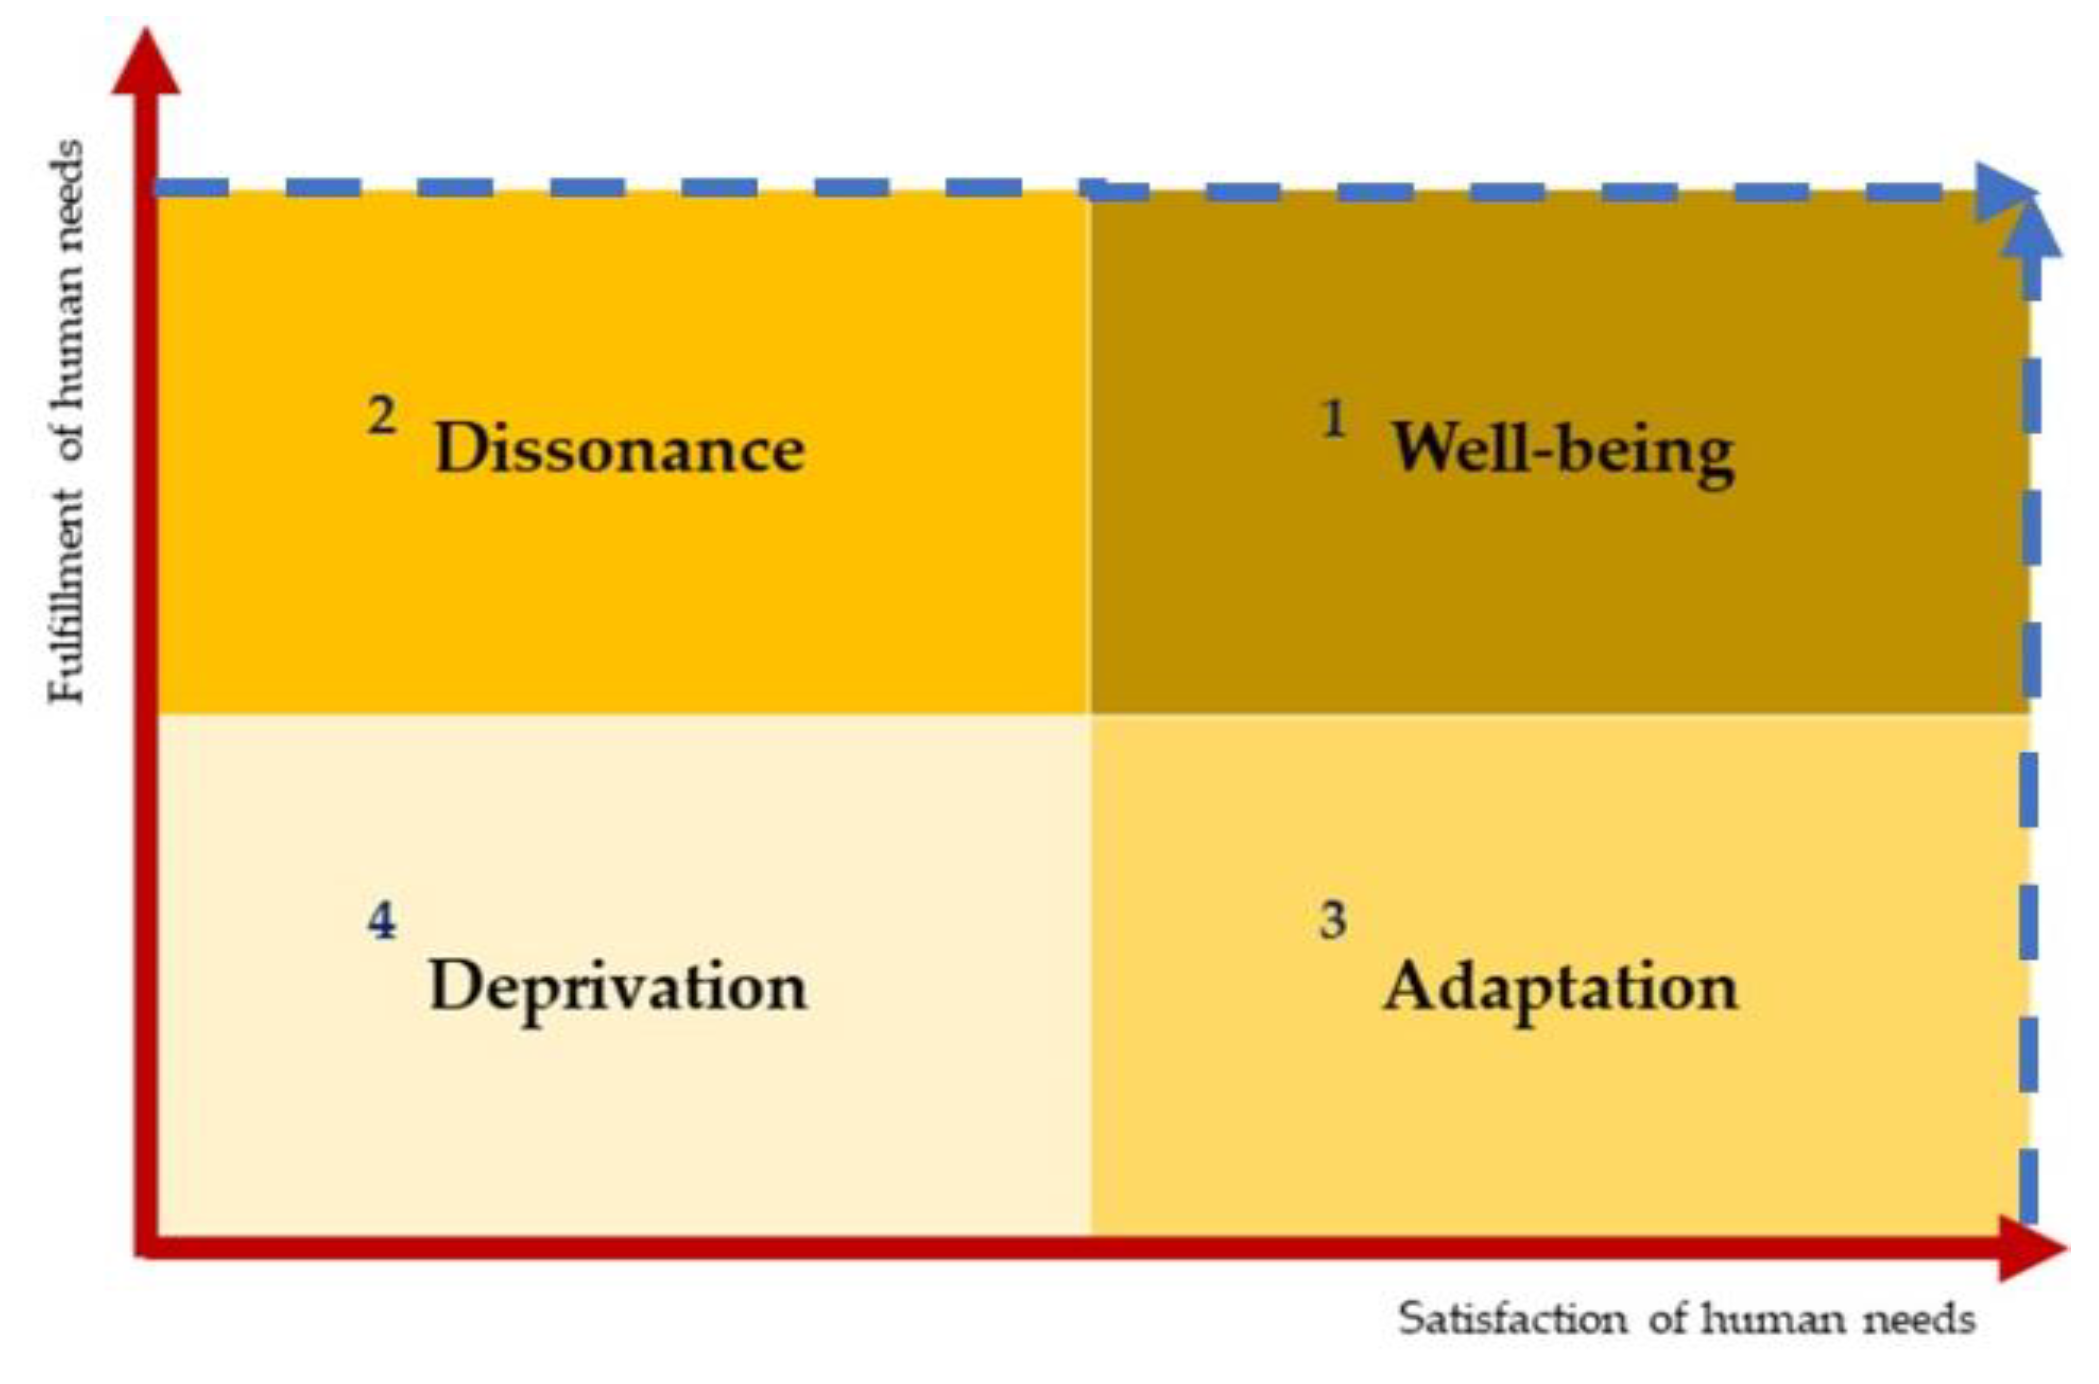
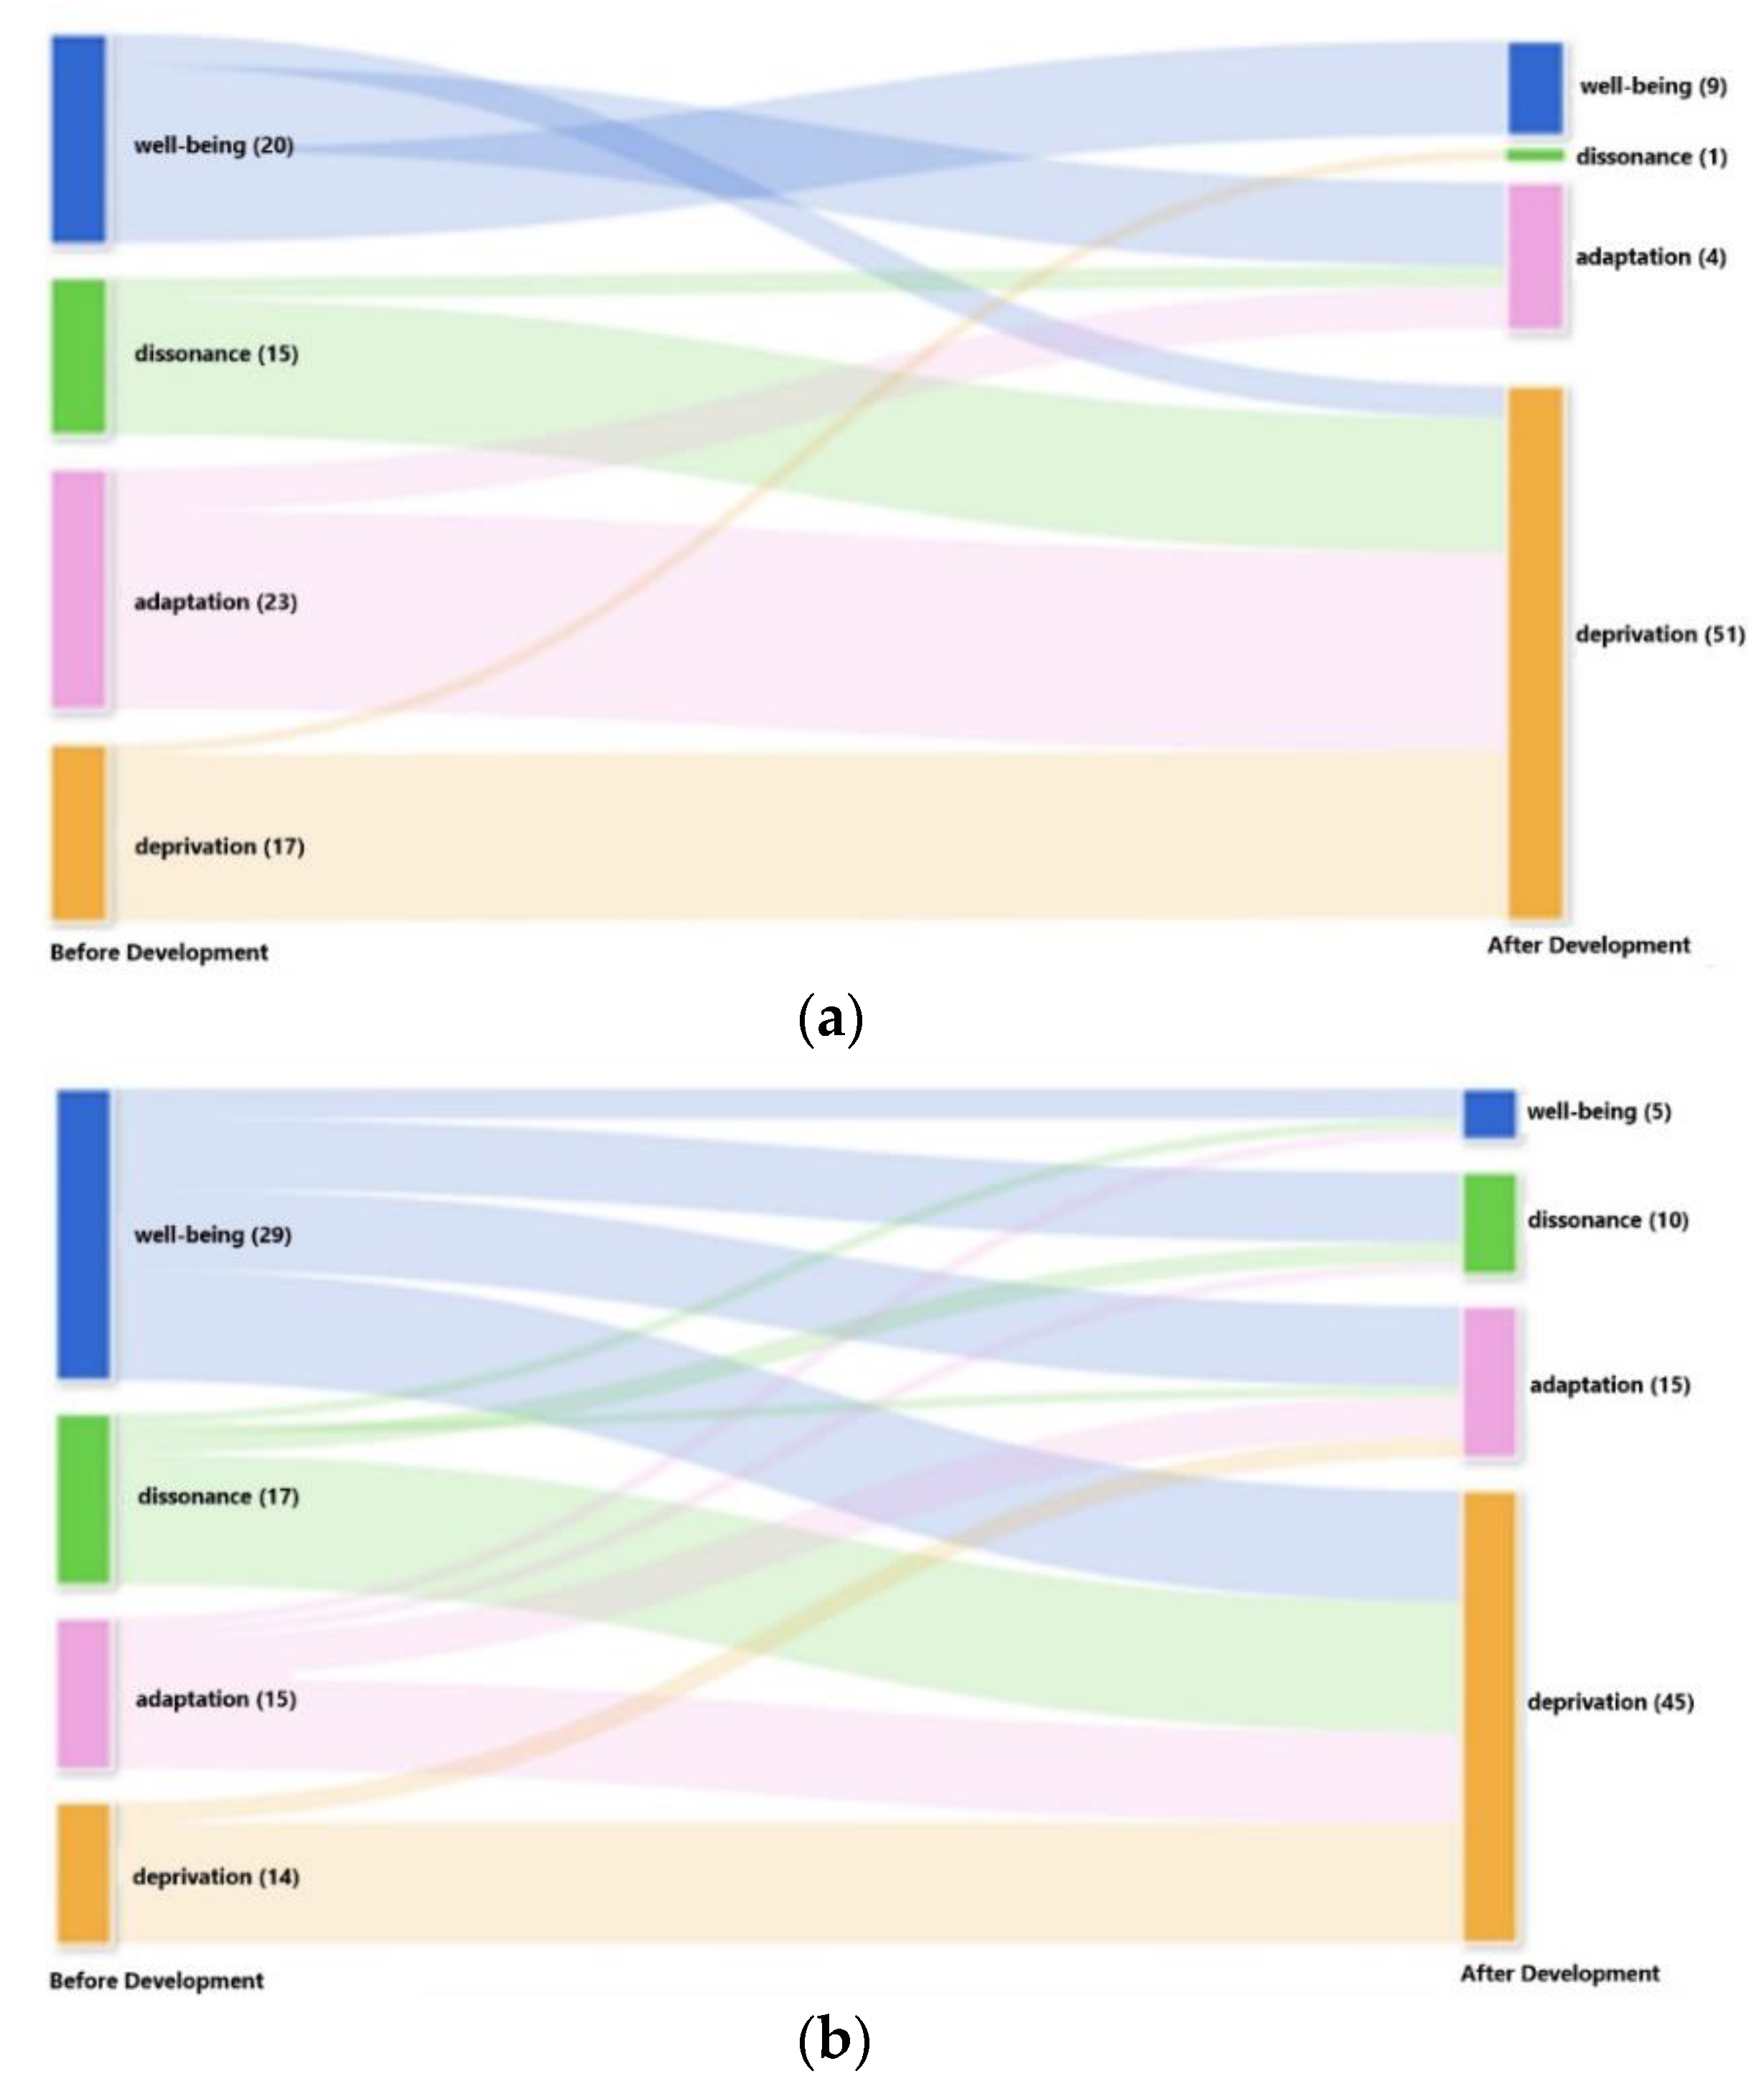
  • Determining the level of QoL. The classifications are as follows:
    • If both subjective and objective scores were >3.0, QoL was classified as well-being;
    • If the subjective score was ≤3.0 but the objective score was >3.0, QoL was classified as dissonance;
    • If the subjective score was >3.0 but the objective score was ≤3.0, QoL was classified as adaptation;
    • If both subjective and objective scores were ≤3.0, QoL is classified as deprivation.

3.5. Assessing Differences in Impacts of New Town Development on Local Communities in Different Peri-Urban Areas

The scoring of the differences in new town development impacts on local people was carried out in two different peri-urban areas with different characteristics: coastal and inland areas. Scoring was performed by using statistical testing to obtain transformation scores of livelihood assets, objective and subjective QoL and overall QoL. This testing began with a normality test for the entire data to determine their distribution. Oktaviani and Notobroto [156] state that normality testing is conducted to reduce inconsistent statistical decisions. The testing indicated that only the QoL variable was not normally distributed, with a p-value <0.05. However, following the central limit theorem, which implies that when the data sample is higher (>30 or 40), the distribution will approach normal [157,158,159], we decided to apply the same difference testing method in the following step.
The difference testing investigates the value of livelihood asset transformation and the QoL level of local communities between two research locations. The method used was the t-test, because this testing method is considered useful for identifying significant differences between two variables and can determine the influences of variable behaviour [160]. This method is relevant for data with normal distribution. Although the QoL variable was not normally distributed in the previous data distribution, a t-test could still be carried out [161] because of the large sample size. This statistical testing was divided into two. First, a dependent paired t-test was done to score average differences in paired variables of the livelihood asset and QoL before and after the development in each new town location. Second, an independent t-test was carried out to score the average of two independent variables of the transformation of the livelihood asset and overall QoL before and after the development in MTB and KBP.

4. Results

4.1. Assessing the Condition of Livelihood Assets

Large-scale development such as new towns in peri-urban areas obviously has an influence on the socio-economic conditions of the locals that have long resided in these areas. These consequences are reflected in their livelihood assets in different dimensions (i.e., social, financial, physical, natural and human). This phenomenon is also encountered by 150 locals in MTB and KBP. Figure 6 shows that prior to the development, average livelihood assets were similar, accounting for a score over 3.0. This number indicates that locals’ average livelihood assets were deemed to be good. The average value of physical assets of the locals was still deemed to be the lowest in both MTB and KBP, accounting for 2.78 and 3.34, respectively.
However, after the new town developments, the livelihood assets of the locals showed some evident changes, which were primarily triggered by the land acquisition process following the development, resulting in the decreasing value of almost all livelihood assets except the physical ones. Financial and natural assets were significantly affected by development. Figure 6 shows that the average financial asset value experienced a decrease to a score of as little as 0.86 and 0.98 in MTB and KBP, respectively. On the other hand, the average value of the natural asset fell to 0.77 in both locations. This decrease represents the main consequence of the land acquisition, which took the lands of the locals, while the decrease in the financial asset is indicated by the change in jobs, decreasing income and decreasing savings and educational insurance. On the other hand, development in the areas seems to have positively influenced physical assets in both locations, accounting for an increase of 0.43 in MTB and 0.35 in KBP following development.

4.2. Assessing the Quality of Life of Local People

According to Figure 7, before the development, the average value of the objective QoL was higher than the average based on subjective measurement. However, the average value of both measurements was more than 3.0, representing the basic value of fulfilment and satisfaction of human needs. In both locations, the objective QoL components with the highest value were income, social bonds and employment. In KBP, however, social bonds and civil and political freedom had a subjective QoL value that was higher than the objective one. After the development, similar to what has taken place for most locals’ livelihood assets, the value of both types of QoL decreased, especially the objective QoL. Significant falls are evident in three components: income, employment and environmental conditions, with an average decrease of 0.3 to 1.0 in MTB and KBP. These decreases are more significant than for the other five components, which decreased by less than 0.2 in the same locations. For the subjective QoL, a significant decrease is apparent in employment and environmental conditions in both MTB and KBP, accounting for 0.4 to 0.8, respectively. This result shows that employment and environmental conditions are two components significantly affected by new town development, either subjectively or objectively.
In terms of each component of QoL, Figure 7 indicates that both locations experienced different impacts, either subjectively or objectively. The component value of social bonds given by the respondents in MTB is the highest, meaning that people have strong interactions with others, influencing their livelihoods. In KBP, respondents assigned the highest value to the civil component and political freedom, meaning people are actively involved in organisational activities. Furthermore, housing and health improved after the development, by 0.1 to 0.4 in the two locations. Furthermore, income and employment have the lowest value in both subjective and objective scores: 55% of respondents are not satisfied with their income because their salary is lower than the minimum regional income, which further impacts the fulfilment of their daily needs.
The combination of objective and subjective QoL certainly affects the overall QoL level. Figure 8 indicates that the difference between the four levels of QoL of locals in MTB following the new town development is not more than 10%, indicating that the initial condition of the people was diverse because they had their own strategies to fulfil their needs and manage their assets. Unlike in MTB, before the development, the well-being level in KBP was higher than the other three QoL levels. Evidence shows that 39% of respondents experienced well-being, while the other levels were merely at about 18–23%. The results show that more than 54% of the respondents could fulfil their human needs before the development of MTB and KBP.
After the development, more than 62% of respondents in MTB and KBP experienced decreases in overall QoL level, most dropping to the deprivation level. In KBP, the most frequent decreases were at the well-being (36%) and dissonance levels (82%), whereas in MTB, the lowest QoL level was present for 80% of respondents who were originally at the dissonance level and 85% of respondents at the adaptation level (Figure 8). All evidence also underlines that adaptation and deprivation dominate the overall QoL level in both research locations due to the development.

4.3. Impact of New Town Development in the Different Peri-Urban Areas on Quality-of-Life Transformation

4.3.1. Dependent Paired t-Test

A paired t-test was performed to statistically determine the significance of the impacts of new town development on locals in the peri-urban areas. This test result represents the major change in locals’ livelihood assets and QoL before and after the new town development. Table 4 shows that the average value of livelihood assets, objective and subjective QoL and overall QoL level in both locations show a significant discrepancy before and after the development, where the p-value is below 0.05. In addition, this discrepancy indicates a decrease in each variable’s value after the development.
Table 4 also shows that the most marked decrease is in the overall QoL level variable, with an average decrease of 0.6 in MTB and KBP after the development, followed by the livelihood asset at 0.4 and the objective and subjective QoL of 0.2 and 0.3, respectively. These numbers confirm that new town development has remarkably affected the condition of locals’ livelihood assets and QoL.

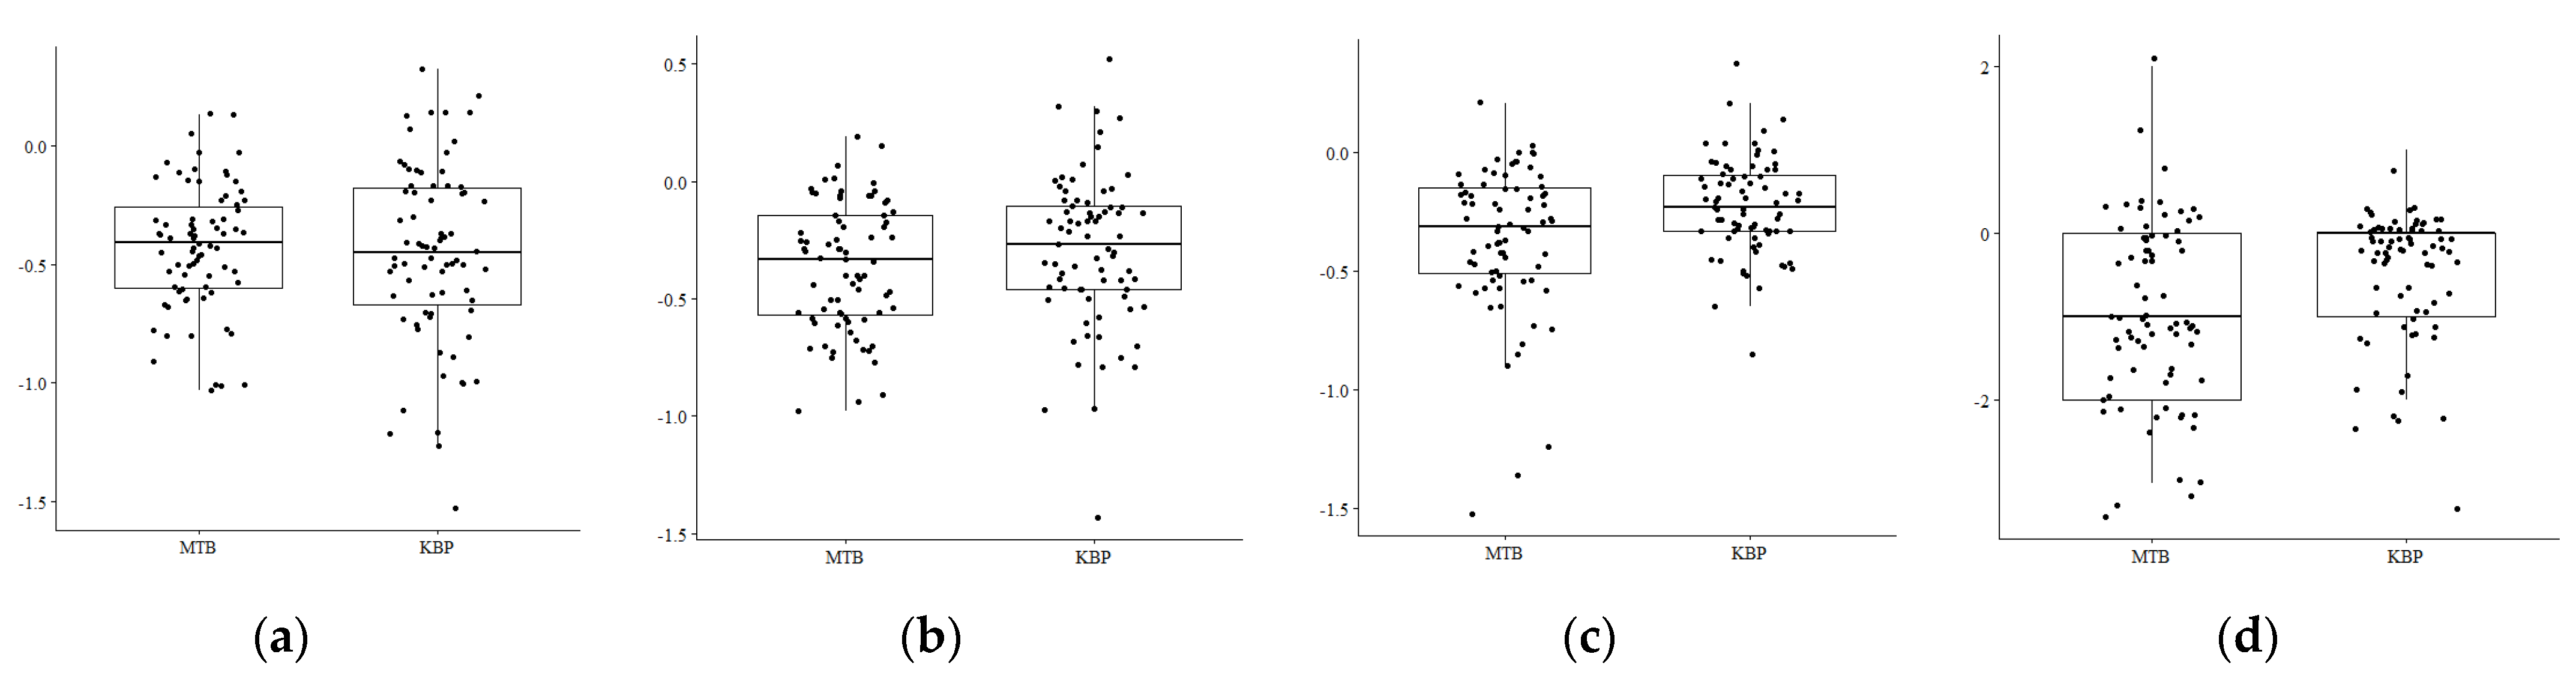
4.3.2. Independent t-Test

The characteristics of peri-urban areas differing from the development areas in MTB and KBP certainly leave implications on different levels of impact in new town development. Table 5 shows significant differences between subjective QoL conditions and overall QoL level in MTB and KBP, with a p-value < 0.05, while the average value of livelihood assets and objective QoL shows no marked difference in the respondents in both locations. The results of this statistical test show that the subjective QoL decreases significantly to about 0.36 in MTB and 0.23 in KBP. Another significant difference in decreasing values is also apparent in the average value of the overall QoL level, accounting for 0.91 in MTB and 0.43 in KBP for the average decreasing value of the QoL level. This shows that this significant difference in the impacts on the overall QoL level in both peri-urban locations is primarily affected by the subjective QoL.
Visually, the difference in the impact of the new town development taking place in these two peri-urban areas can be seen in Figure 9. All four plots show the difference in changing conditions before and after new town development in MTB and KBP. In general, livelihood assets and objective and subjective QoL have a relatively shorter boxplot than the overall QoL. This indicates that the change in locals’ livelihood assets and an objective and subjective QoL have values that are relatively identical to the change in the overall QoL level.
Furthermore, as shown in Figure 9a,b, although respondents in the two locations reside in several kampungs, the median variables of livelihood assets and objective QoL are not significantly different. Figure 9c,d shows a significant difference in the average value of the change in subjective QoL and overall QoL. The boxplots in the two locations are not identical to the median value. At a closer look, the boxplot in KBP is relatively shorter, with shorter upper and lower whiskers than that of MTB. This explains that the varied values representing the conditions of the locals in KBP are more strongly emphasised on certain values: ranging from −1 to 0. In KBP, however, the transformation of overall QoL in MTB has a longer boxplot and longer upper and lower whisker. The data distribution of the respondents tends to be more varied, where 50% is in the range of −2 and 0.

5. Discussion

Urban development that widely spreads to peri-urban areas, which also appears to occur in both research locations through the development of new towns, is difficult to predict and rarely induced by a single cause. The transition process in these complex areas directly reflects how self-organisation exists and continues, as observed by previous researchers [3,56,162]. Many studies have also shown that the development of new town developments fundamentally aims to increase economic growth in these areas, as well as for the new middle- to upper-income people who will live in them, and also surrounding areas [4,42,163]. At the same time, it can also widen the gap between migrants and the local community who originally inhabited the area.
In general, the findings of this study have shown that the new town developments in two different peri-urban areas with different geographical and also socio-economic characteristics have led to different livelihood assets and also QoL of the local communities, as statistically demonstrated by a t-test. Furthermore, by combining the assessment of the fulfilment and satisfaction of human needs based on the subjective perception of the local people with the objective assessment based on their actual livelihood level (Costanza et al. [164] also refer to these as ‘opportunities’) [44], the results of this study would complement previous works on QoL measurement (see, e.g., [120,124,125]).
The findings of this study could also provide strong support for the claim that the development trend is growth-oriented, which impacts the marginalisation of local communities, including those living on and around the development site [19,40,71]. Before development, local communities in both study areas, as in the majority of other peri-urban areas [74], relied on extractive livelihood activities using natural resources. This group of people has become one of the most affected because the central aspects of their livelihoods changed when new town development occurred. According to the findings, the development has also led to a dramatic decrease in natural and financial assets. The former is an essential component in the community’s QoL and is frequently overlooked by policymakers [111]. Furthermore, disruption to the existence of this asset can be directly or indirectly related to future generations’ inability to improve their QoL [111,165,166]. While a decrease in financial assets in the field is associated with changes in the type of work, a decrease in adequate income and a decrease in local community savings. This is consistent with the opinion of Kusiluka et al. [37], who believe that development activities involving the acquisition and conversion of land belonging to local communities have failed to prevent impoverishment and even harmed communities in the long run.
Reflecting back on the QoL, before the development of the new town, the majority of objective QoL conditions of people in MTB on the coast were lower than those living inland in KBP. Figure 6 depicts the trend of narrower lines in each QoL component, particularly environmental conditions, civil and political freedom and housing, for people living in coastal areas versus those living in non-coastal areas. This not only demonstrates that coastal communities have a lower standard of living but also that their living conditions are more vulnerable than those of non-coastal communities. According to Crawford and Pollnac [73], these coastal communities’ powerlessness may be due to environmental conditions or a lack of developed infrastructure.
Furthermore, large-scale development in the two peri-urban areas appears to have had implications for all QoL components. The evidence shows that development not only contributed to a decrease in local communities’ income, which is consistent with the previous findings in other countries, see e.g., [108,167,168], but also had a severe impact on other components that support their sustainable life. Approximately two-thirds of local communities’ overall QoL has decreased, with the majority falling to the worst level. As a result, the “good” condition of the objective and subjective QoL decreased by approximately 60%. In line with the decrease in the combination of these compositions, the “bad” QoL level increased by 76%. Additionally, the findings also indicate that many local communities are still attempting to be satisfied with their QoL, although their human needs are not being met due to the impact of development, as noticed by the adaptation level. This is not surprising, given that the characteristics of peri-urban society are empirically lower than those of urban communities [73].
Another interesting finding is that although it is obvious that the impact of development decreased the QoL value—whether objective, subjective or a combination of both—the latest results show a significant difference in decline between the two regions under study. The overall decline in QoL of coastal communities due to the new town development is much greater than that of non-coastal communities. This result is influenced by a significant difference in the decrease in subjective QoL values between coastal and non-coastal areas. Figure 9c,d shows how the subjective QoL value of coastal communities varies in a wider range of decline than that of non-coastal communities. These findings confirm that, in addition to being vulnerable, coastal communities have a lower level of adaptation to development when compared with those who live in non-coastal areas. Although some small cases, e.g., [169,170,171], demonstrate how coastal communities are attempting to adapt to the changes in their lives, several references demonstrate a similar phenomenon in many larger cases. Crawford and Pollnac [73], for example, discovered that coastal communities in the northern islands of Sumatra and Sulawesi had difficulty adjusting to their new lives due to housing projects. Several cases also support that, see [71,172,173]. The main factor causing their low level of adaptation is the character of coastal communities, as they are attached to resources and the coastal environment [174]. Another observation by Keles [111] explains how their lack of skill in job diversification contributes to their inability to adapt to a new situation.

6. Conclusions

This research examined how new town development in two different peri-urban areas has led to changes in local communities’ livelihood assets and their QoL. In general, this study contends that limited livelihood components should not be used to evaluate development impacts. To obtain a comprehensive picture of the sustainability of the affected parties’ lives, each component must be measured. Referring to previous studies’ conceptual assessments of QoL, this study operationalises them as a whole by combining assessments of objective and subjective QoL, particularly in the context of socio-economic development.
Furthermore, the evidence suggests that the development of a new town has an impact in the form of a decline in almost all local community livelihood assets. Only physical assets have grown. The assets most affected by development are financial and natural assets, primarily caused by the acquisition and conversion of productive land belonging to local communities. This causes some of them to lose or change their source of livelihood.
The decline in community livelihood assets has contributed to a significant decrease in the QoL of local communities in peri-urban areas, both coastal and inland. The specific result concludes that the degree of decline in coastal communities is greater than that in non-coastal communities. This also confirms that peri-urban coastal communities are much more vulnerable and less adaptable to development than non-coastal communities.
Despite limitations in explaining the phenomenon because it represents only the situation of the respondents involved, and without being able to generalise the condition of the local communities affected by new urban development in broader cases, this study might still contribute to ongoing debates concerning peri-urbanisation especially related to new town development. The result of this study has provided empirical evidence of the differences in QoL of local communities in different peri-urban areas, particularly in developing countries. This result would, therefore, complement previous studies in this issue [13,32,47]. Moreover, this study has also shown that the development of new towns has varying degrees of impact on the sustainability of local communities. However, it does not provide any statistical proof of these impacts. Therefore, future studies should offer statistical proof of the causal relationship between new town development and socio-economic aspects of local communities, including their QoL which is supported by a better dataset.

Author Contributions

Conceptualisation, R.A.P., D.A.A.S. and E.v.d.K.; methodology, R.A.P. and D.A.A.S.; data collection, R.A.P.; validation, R.A.P.; data analysis, R.A.P.; writing—original draft preparation, R.A.P.; writing—review and editing, R.A.P., D.A.A.S. and E.v.d.K.; visualisation, R.A.P.; supervision, D.A.A.S. and E.v.d.K. All authors have read and agreed to the published version of the manuscript.

Funding

This research was fully funded by the Indonesia Endowment Fund for Education (LPDP), Ministry of Finance, Republic of Indonesia. Grant number KEP-86/LPDP/2015.

Institutional Review Board Statement

Not applicable.

Informed Consent Statement

Not applicable.

Data Availability Statement

Not applicable.

Acknowledgments

We would like to thank the students of ITENAS and UNHAS who supported the authors during the fieldwork. The authors would also like to thank anonymous reviewers for their insightful comments and suggestions to the manuscript.

Conflicts of Interest

The authors declare no conflict of interest.

References

  1. Allen, A. Environmental Planning and Management of the Peri-Urban Interface: Perspectives on an Emerging Field. Environ. Urban. 2003, 15, 135–148. [Google Scholar] [CrossRef] [Green Version]
  2. Webster, D. On the Edge: Shaping the Future of Peri-Urban East Asia; Shorenstein APARC: Stanford, CA, USA, 2002. [Google Scholar]
  3. Rauws, W.S.; De Roo, G. Exploring Transitions in the Peri-Urban Area. Plan. Theory Pract. 2011, 12, 269–284. [Google Scholar] [CrossRef] [Green Version]
  4. Woltjer, J. A Global Review on Peri-Urban Development and Planning. J. Perenc. Wil. Dan Kota 2014, 25, 1–16. [Google Scholar] [CrossRef] [Green Version]
  5. Bartels, L.E.; Bruns, A.; Simon, D. Towards Situated Analyses of Uneven Peri-Urbanisation: An (Urban) Political Ecology Perspective. Antipode 2020, 52, 1237–1258. [Google Scholar] [CrossRef] [Green Version]
  6. Chakrabarty, D. Provincializing Europe: Postcolonial Thought and Historical Difference; Princeton University Press: Princeton, NJ, USA, 2000. [Google Scholar] [CrossRef]
  7. Abubakar, I.R.; Doan, P.L. Building New Capital Cities in Africa: Lessons for New Satellite Towns in Developing Countries. Afr. Stud. 2017, 76, 546–565. [Google Scholar] [CrossRef]
  8. Webster, D.; Muller, L. Challenges of Peri-Urbanization in the Lower Yangtze Region: The Case of the Hangzhou-Ningbo Corridor; Shorenstein APARC: Stanford, CA, USA, 2002; pp. 1–37. [Google Scholar]
  9. Zhao, P. Too Complex to Be Managed? New Trends in Peri-Urbanisation and Its Planning in Beijing. Cities 2013, 30, 68–76. [Google Scholar] [CrossRef]
  10. da Silva, R.F.B.; Batistella, M.; Moran, E.F. Socioeconomic Changes and Environmental Policies as Dimensions of Regional Land Transitions in the Atlantic Forest, Brazil. Environ. Sci. Policy 2017, 74, 14–22. [Google Scholar] [CrossRef]
  11. Guo, J.Y.; Bhat, C.R. Modifiable Areal Units Problem or Perception in Modeling of Residential Location Choice? Transp. Res. Rec. 2004, 1898, 138–147. [Google Scholar] [CrossRef] [Green Version]
  12. Dwyer, M.B. The Formalization Fix? Land Titling, Land Concessions and the Politics of Spatial Transparency in Cambodia. J. Peasant. Stud. 2015, 42, 903–928. [Google Scholar] [CrossRef]
  13. Wu, F.; Zhang, F.; Webster, C. Informality and the Development and Demolition of Urban Villages in the Chinese Peri-Urban Area. Urban Stud. 2013, 50, 1919–1934. [Google Scholar] [CrossRef]
  14. Webster, D. Urbanization Dynamics and Policy Frameworks in Developing East Asia; The World Bank: Washington, DC, USA, 2004. [Google Scholar]
  15. Hudalah, D.; Winarso, H.; Woltjer, J. Planning by Opportunity: An Analysis of Periurban Environmental Conflicts in Indonesia. Environ. Plan. A 2010, 42, 2254–2269. [Google Scholar] [CrossRef]
  16. Octifanny, Y.; Hudalah, D. Urban Agglomeration and Extension in Northern Coast of West Java: A Transformation into Mega Region. IOP Conf. Ser. Earth Environ. Sci. 2017, 79, 012011. [Google Scholar] [CrossRef]
  17. Pravitasari, A.E.; Rustiadi, E.; Mulya, S.P.; Setiawan, Y.; Fuadina, L.N.; Murtadho, A. Identifying the Driving Forces of Urban Expansion and Its Environmental Impact in Jakarta-Bandung Mega Urban Region. IOP Conf. Ser. Earth Environ. Sci. 2018, 149, 012044. [Google Scholar] [CrossRef] [Green Version]
  18. Narain, V.; Nischal, S. The Peri-Urban Interface in Shahpur Khurd and Karnera, India. Environ. Urban. 2007, 19, 261–273. [Google Scholar] [CrossRef] [Green Version]
  19. Zoomers, A.; van Noorloos, F.; Otsuki, K.; Steel, G.; van Westen, G. The Rush for Land in an Urbanizing World: From Land Grabbing Toward Developing Safe, Resilient, and Sustainable Cities and Landscapes. World Dev. 2017, 92, 242–252. [Google Scholar] [CrossRef]
  20. Zhen, N.; Fu, B.; Lü, Y.; Zheng, Z. Changes of Livelihood Due to Land Use Shifts: A Case Study of Yanchang County in the Loess Plateau of China. Land Use Policy 2014, 40, 28–35. [Google Scholar] [CrossRef]
  21. UN-HABITAT. Working for a Better Urban Future: Annual Progress Report 2018; UN-HABITAT: Nairobi, Kenya, 2018. [Google Scholar]
  22. International New Town Institute. Rising in the East: Contemporary New Towns in Asia; SUN Architecture: Amsterdam, The Netherlands, 2011. [Google Scholar]
  23. Abubakar, I.R.; Doan, P.L. New Towns in Africa: Modernity and/or Decentralization ? New Towns as Garden Cities. In Proceedings of the 53rd African Studies Association Annual Meetings, San Francisco, CA, USA, 18–21 November 2010. [Google Scholar]
  24. Golany, G. New-Town Planning: Principles and Practice; Wiley: New York, NY, USA, 1976. [Google Scholar]
  25. Sujarto, D. Perencanaan Kota Baru; Penerbit ITB: Bandung, Indonesia, 1995. [Google Scholar]
  26. Guy, S.; Henneberry, J. Understanding Urban Development Processes: Integrating the Economic and the Social in Property Research. Urban Stud. 2000, 37, 2399–2416. [Google Scholar] [CrossRef]
  27. Vanclay, F. Project-Induced Displacement and Resettlement: From Impoverishment Risks to an Opportunity for Development? Impact Assess. Proj. Apprais. 2017, 35, 3–21. [Google Scholar] [CrossRef] [Green Version]
  28. Zoomers, A.; Otsuki, K. Addressing the Impacts of Large-Scale Land Investments: Re-Engaging with Livelihood Research. Geoforum 2017, 83, 164–171. [Google Scholar] [CrossRef]
  29. Winarso, H.; Hudalah, D.; Firman, T. Peri-Urban Transformation in the Jakarta Metropolitan Area. Habitat Int. 2015, 49, 221–229. [Google Scholar] [CrossRef]
  30. D’Amour, C.B.; Reitsma, F.; Baiocchi, G.; Barthel, S.; Güneralp, B.; Erb, K.H.; Haberl, H.; Creutzig, F.; Seto, K.C. Future Urban Land Expansion and Implications for Global Croplands. Proc. Natl. Acad. Sci. USA 2017, 114, 8939–8944. [Google Scholar] [CrossRef] [PubMed] [Green Version]
  31. Koirala, S.; Hill, D.; Morgan, R. Impacts of the Delay in Construction of a Large Scale Hydropower Project on Potential Displaces. Impact Assess. Proj. Apprais. 2017, 35, 106–116. [Google Scholar] [CrossRef]
  32. Li, C.; Wang, M.; Song, Y. Vulnerability and Livelihood Restoration of Landless Households after Land Acquisition: Evidence from Peri-Urban China. Habitat Int. 2018, 79, 109–115. [Google Scholar] [CrossRef]
  33. Pratomo, R.A.; Samsura, D.A.A.; Krabben, E. van der. Transformation of Local People’s Property Rights Induced by New Town Development (Case Studies in Peri-Urban Areas in Indonesia). Land 2020, 9, 236. [Google Scholar] [CrossRef]
  34. Cernea, M.M. The Risks and Reconstruction Model for Resettling Displaced Populations. World Dev. 1997, 25, 1569–1587. [Google Scholar] [CrossRef]
  35. Wilmsen, B.; Webber, M. What Can We Learn from the Practice of Development-Forced Displacement and Resettlement for Organised Resettlements in Response to Climate Change? Geoforum 2015, 58, 76–85. [Google Scholar] [CrossRef]
  36. Messerschmidt, D. Can Compensation Prevent Impoverishment? Reforming Resettlement through Investments and Benefit-Sharing. Hydro Nepal J. Water Energy Environ. 2009, 3, 55–56. [Google Scholar] [CrossRef] [Green Version]
  37. Kusiluka, M.M.; Kongela, S.; Kusiluka, M.A.; Karimuribo, E.D.; Kusiluka, L.J.M. The Negative Impact of Land Acquisition on Indigenous Communities’ Livelihood and Environment in Tanzania. Habitat Int. 2011, 35, 66–73. [Google Scholar] [CrossRef]
  38. Sirgy, J.M. Theoretical Perspectives Guiding QOL Indicator Projects. Soc. Indic. Res. 2011, 103, 1–22. [Google Scholar] [CrossRef]
  39. Turkoglu, H. Sustainable Development and Quality of Urban Life. Procedia-Soc. Behav. Sci. 2015, 202, 10–14. [Google Scholar] [CrossRef] [Green Version]
  40. Pouw, N.; Gupta, J. Inclusive Development: A Multi-Disciplinary Approach. Curr. Opin. Environ. Sustain. 2017, 24, 104–108. [Google Scholar] [CrossRef]
  41. Scheyvens, R.; Biddulph, R. Inclusive Tourism Development. Tour. Geogr. 2018, 20, 589–609. [Google Scholar] [CrossRef]
  42. Wang, L.; Kundu, R.; Chen, X. Building for What and Whom? New Town Development as Planned Suburbanization in China and India. Res. Urban Sociol. 2010, 10, 319–345. [Google Scholar] [CrossRef] [Green Version]
  43. Borras, S.M.; Franco, J.C. Global Land Grabbing and Political Reactions “From Below”. Third World Q. 2013, 34, 1723–1747. [Google Scholar] [CrossRef]
  44. Costanza, R.; Fisher, B.; Ali, S.; Beer, C.; Bond, L.; Boumans, R.; Danigelis, N.L.; Dickinson, J.; Elliott, C.; Farley, J.; et al. Quality of Life: An Approach Integrating Opportunities, Human Needs, and Subjective Well-Being. Ecol. Econ. 2007, 61, 267–276. [Google Scholar] [CrossRef]
  45. Sari, M.K.; Winarso, H. Transformasi Sosial Ekonomi Masyarakat Peri-Urban Di Sekitar Pengembangan Lahan Skala Besar: Kasus Bumi Serpong Damai. J. Reg. City Plan. 2007, 18, 1–30. [Google Scholar]
  46. Cirolia, L.R. (W)Escaping the Challenges of the City: A Critique of Cape Town’s Proposed Satellite Town. Urban Forum 2014, 25, 295–312. [Google Scholar] [CrossRef]
  47. McGee, T.G. The Spatiality of Urbanization: The Policy Challenges of Mega-Urban and Desakota Regions of Southeast Asia. UNU-IAS Work. Pap. 2009, 161, 1–40. [Google Scholar]
  48. Adell, G. Theories and Models of the Peri-Urban Interface: Changing Conceptual Landscape; Draf for Discussion; UCL Discovery: London, UK, 1999. [Google Scholar]
  49. Rakodi, C.; Lloyd-Jones, T. Urban Livelihoods: A People-Centred Approach to Reducing Poverty; Earthscan Publications Ltd.: London, UK, 2002. [Google Scholar]
  50. Tacoli, C. Rural-Urban Interactions: A Guide to the Literature. Environ. Urban. 1998, 10, 147–166. [Google Scholar] [CrossRef]
  51. Mbiba, B.; Huchzermeyer, M. Contentious Development: Peri-Urban Studies in Sub-Saharan Africa. Prog. Dev. Stud. 2002, 2, 113–131. [Google Scholar] [CrossRef]
  52. Narain, V. Growing City, Shrinking Hinterland: Land Acquisition, Transition and Conflict in Peri-Urban Gurgaon, India. Environ. Urban. 2009, 21, 501–512. [Google Scholar] [CrossRef]
  53. Brook, R.; Purushothaman, S.; Hunshal, C. Changing Frontiers: The Peri-Urban Interface Hubli–Dharwad, India; Brook, R., Purushothaman, S., Hunshal, C., Eds.; Books for Change: Bangalore, India, 2003. [Google Scholar]
  54. Rojas-Caldelas, R.; Pena-Salmon, C.; Ranfla-González, A.; Venegas-Cardoso, R.; Leyva-Camacho, O.; Ley-Garcia, J. Approaches to Analysing the Rural-Urban Interface: Comprehensive Development Views from Town and Countryside. WIT Trans. Ecol. Environ. 2010, 129, 359–370. [Google Scholar] [CrossRef] [Green Version]
  55. McGee, T.G.; Robinson, I.M. The Mega-Urban Regions of Southeast Asia; University of British Columbia Press: Vancouver, BC, Canada, 1995. [Google Scholar]
  56. Coy, M.; Sandholz, S.; Töpfer, T.; Zirkl, F. Metropolitan Regions: Challenges for Sustainability and Governance of Periurban Areas in Brazil. Confins 2018, 38. [Google Scholar] [CrossRef]
  57. Douglass, M. A Regional Network Strategy for Reciprocal Rural-Urban Linkages. Third World Plan. Rev. 1998, 20, 1–33. [Google Scholar] [CrossRef]
  58. Firman, T. The Urbanisation of Java, 2000–2010: Towards ‘the Island of Mega-Urban Regions. ’ Asian Popul. Stud. 2017, 13, 50–66. [Google Scholar] [CrossRef]
  59. Rondinelli, D.A. Extending Urban Services in Developing Countries: Policy Options and Organisational Choices. Public Adm. Dev. 1986, 6, 1–21. [Google Scholar] [CrossRef]
  60. Fan, C.C. China on the Move: Migration, the State, and the Household; Routledge: Abingdon, UK, 2008. [Google Scholar]
  61. Mallinis, G.; Koutsias, N.; Arianoutsou, M. Monitoring Land Use/Land Cover Transformations from 1945 to 2007 in Two Peri-Urban Mountainous Areas of Athens Metropolitan Area, Greece. Sci. Total Environ. 2014, 490, 262–278. [Google Scholar] [CrossRef]
  62. Conedera, M.; Del Biaggio, A.; Seeland, K.; Moretti, M.; Home, R. Residents’ Preferences and Use of Urban and Peri-Urban Green Spaces in a Swiss Mountainous Region of the Southern. Alps. Urban For. Urban Green. 2015, 14, 139–147. [Google Scholar] [CrossRef]
  63. Haller, A. The “Sowing of Concrete”: Peri-Urban Smallholder Perceptions of Rural-Urban Land Change in the Central Peruvian Andes. Land Use Policy 2014, 38, 239–247. [Google Scholar] [CrossRef] [Green Version]
  64. Salem, M.; Tsurusaki, N.; Divigalpitiya, P. Land Use/Land Cover Change Detection and Urban Sprawl in the Peri-Urban Area of Greater Cairo since the Egyptian Revolution of 2011. J. Land Use Sci. 2020, 15, 592–606. [Google Scholar] [CrossRef]
  65. Wibowo, A.; Supriatna. Kerentanan Lingkungan Pantai Kota Pesisir Di Indonesia. J. Ilmu Dan Teknol. Kelaut. Trop. 2011, 3, 1–20. [Google Scholar]
  66. World Bank. Agricultural Land (% of Land Area)-Indonesia. Available online: https://data.worldbank.org/indicator/AG.LND.AGRI.ZS?locations=ID (accessed on 10 January 2022).
  67. Pribadi, D.O.; Vollmer, D.; Pauleit, S. Impact of Peri-Urban Agriculture on Runoff and Soil Erosion in the Rapidly Developing Metropolitan Area of Jakarta, Indonesia. Reg. Environ. Change 2018, 18, 2129–2143. [Google Scholar] [CrossRef]
  68. Mega, V.P. Conscious Coastal Cities; Springer: Berlin/Heidelberg, Germany, 2016. [Google Scholar] [CrossRef]
  69. Pratomo, R.A.; Ayuni, S.I.; Fitrianingsih, D. Implikasi Pembangunan Kota Baru Terhadap Perubahan Fisik Kawasan Dan Sosial-Ekonomi Masyarakat Lokal: Studi Kasus Pembangunan Kota Harapan Indah, Bekasi. J. Pengemb. Kota 2021, 9, 204–214. [Google Scholar] [CrossRef]
  70. Mandere, N.; Ness, B.; Anderberg, S. Peri-Urban Development, Livelihood Change and Household Income: A Case Study of Peri-Urban Nyahururu, Kenya. J. Agric. Ext. Rural Dev. 2010, 2, 73–83. [Google Scholar]
  71. Pratomo, R.A.; Samsura, D.A.A.; Krabben, E. Towards Sustainable Life of Local Communities in Coastal Cities: A Longitudinal Study of New Town Development in Makassar. In Routledge Handbook of Urban Indonesia; Rukmana, D., Roitman, S., Eds.; Routledge: London, UK, 2022. [Google Scholar]
  72. Drechsel, P.; Quansah, C.; Penning De Vries, F. Urban and Peri-Urban Agriculture in West Africa: Characteristics, Challenges, and Need for Action. In Urban Agriculture in West Africa: Contributing to Food Security and Urban Sanitation = Agriculture Urbaine en Afrique de L’Ouest: Une Contribution à la Sécurité Alimentaire et à L’assainissement des Villes; Smith, O.B., Ed.; IDRC: Ottawa, ON, Canada, 1999; p. 232. [Google Scholar]
  73. Crawford, B.R.; Pollnac, R.B. Among Coastal and Non-Coastal Communities Resources Management Project-Indonesia. J. Pesisir Dan Lautan 1999, 2, 1–11. [Google Scholar]
  74. Hudalah, D.; Winarso, H.; Woltjer, J. Peri-Urbanisation in East Asia: A New Challenge for Planning? Int. Dev. Plan. Rev. 2007, 29, 503–519. [Google Scholar] [CrossRef]
  75. Legates, R.; Hudalah, D. Peri-Urban Planning for Developing East Asia: Learning from Chengdu, China and Yogyakarta/Kartamantul, Indonesia. J. Urban Aff. 2014, 36 (Suppl. S1), 334–353. [Google Scholar] [CrossRef]
  76. Abramson, D.B. Urban Planning in China: Continuity and Change. J. Am. Plann. Assoc. 2006, 72, 197–215. [Google Scholar] [CrossRef]
  77. Simon, D. Urban Environments: Issues on the Peri-Urban Fringe. Annu. Rev. Environ. Resour. 2008, 33, 167–185. [Google Scholar] [CrossRef]
  78. Cervero, R. Sustainable New Towns. Stockholm’s Rail-Served Satellites. Cities 1995, 12, 41–51. [Google Scholar] [CrossRef]
  79. Lau, J.C.Y. The Influence of Suburbanization on the Access to Employment of Workers in the New Towns: A Case Study of Tin Shui Wai, Hong Kong. Habitat Int. 2010, 34, 38–45. [Google Scholar] [CrossRef]
  80. Jim, C.Y. Restoration of Forests Associated with New Town Development in Hong Kong. In A Goal-Oriented Approach to Forest Landscape Restoration; Stanturf, J., Madsen, P., Lamb, D., Eds.; Springer: New York, NY, USA, 2012; pp. 129–148. [Google Scholar] [CrossRef]
  81. Fong, P.K.W. Issues in Urban Redevelopment: The Land Development Corporation. Built Environ. 1985, 11, 283–293. [Google Scholar]
  82. Chen, X.; Wang, L.; Kundu, R. Localizing the Production of Global Cities: A Comparison of New Town Developments Around Shanghai and Kolkata. City Community 2009, 8, 433–465. [Google Scholar] [CrossRef]
  83. Anwar, N.H.; Viqar, S. Producing Cosmopolitan Karachi: Freedom, Security and Urban Redevelopment in the Post-Colonial Metropolis. South Asian Hist. Cult. 2014, 5, 328–348. [Google Scholar] [CrossRef]
  84. Simmons, A.B. Slowing Metropolitan City Growth in Asia: Policies, Programs, and Results. Popul. Dev. Rev. 1979, 5, 87. [Google Scholar] [CrossRef]
  85. Oyedele, J.A.; Shimboyo, S.; Sitoka, S.; Gaoseb, F. Assessment of Natural Radioactivity in the Soils of Rossing Uranium Mine and Its Satellite Town in Western Namibia, Southern Africa. Nucl. Instrum. Methods Phys. Res. Sect. Accel. Spectrometers Detect. Assoc. Equip. 2010, 619, 467–469. [Google Scholar] [CrossRef]
  86. Chatterjee, A.; Chatterjee, S. Satellite Town Development in India in Retrospect and Prospect: A Case of Navi Mumbai. Spandre 2015, 9, 1–10. [Google Scholar]
  87. Jun, M.J. The Effects of Seoul’s New-Town Development on Suburbanization and Mobility: A Counterfactual Approach. Environ. Plan. A 2012, 44, 2171–2190. [Google Scholar] [CrossRef]
  88. Rumbach, A. Do New Towns Increase Disaster Risk? Evidence from Kolkata, India. Habitat Int. 2014, 43, 117–124. [Google Scholar] [CrossRef]
  89. Wang, A.Q.; Chan, E.H.W.; Yeung, S.C.W.; Han, J.B. Urban Fringe Land Use Transitions in Hong Kong: From New Towns to New Development Areas. Procedia Eng. 2017, 198, 707–719. [Google Scholar] [CrossRef]
  90. Insa, R.; Ciriza. Two Ways of New Towns Development: A Tale of Two Cities. In Urban Development; Polyzos, S., Ed.; InTech: Rijeka, Croatia, 2012; pp. 219–242. [Google Scholar] [CrossRef] [Green Version]
  91. Borges, M.J.; Torres, S.B. Company Towns; Palgrave Macmillan US: New York, NY, USA, 2012. [Google Scholar] [CrossRef]
  92. Lee, Y.S.; Shin, H.R. Negotiating the Polycentric City-Region: Developmental State Politics of New Town Development in the Seoul Capital Region. Urban Stud. 2012, 49, 1333–1355. [Google Scholar] [CrossRef]
  93. Sujarto, D. Perkembangan Kota Baru. J. PWK 1993, 4, 3–34. [Google Scholar]
  94. Bloom, D.E.; Craig, P.H.; Malaney, P.N. The Quality of Life in Rural Asia; Oxford University Press: New York, NY, USA, 2001. [Google Scholar]
  95. Omar, D. Urban Planning and the Quality of Life in Putrajaya, Malaysia. WIT Trans. Built Environ. 2006, 86, 83–90. [Google Scholar] [CrossRef]
  96. Browder, J.O.; Godfrey, B.J. Frontier Urbanization in the Brazilian Amazon: A Theoretical Framework for Urban Transition. Yearb.-Conf. Lat. Am. Geogr. 1990, 16, 56–66. [Google Scholar]
  97. Thomas, B.; Bregón, N. Multicentro: A New Town in-Town for Old Bogotá. Third World Plan. Rev. 1979, 1, 179. [Google Scholar] [CrossRef]
  98. Chen, H.; Wu, Q.; Cheng, J.; Ma, Z.; Song, W. Scaling-up Strategy as an Appropriate Approach for Sustainable New Town Development? Lessons from Wujin, Changzhou, China. Sustainability 2015, 7, 5682–5704. [Google Scholar] [CrossRef] [Green Version]
  99. Ghasrodashti, R.E.; Majedi, H.; Paydar, M. Assessment of Residential Satisfaction in Mehr Housing Scheme: A Case Study of Sadra New Town, Iran. Hous. Theory Soc. 2017, 34, 323–342. [Google Scholar] [CrossRef]
  100. Güneralp, B.; Reba, M.; Hales, B.U.; Wentz, E.A.; Seto, K.C. Trends in Urban Land Expansion, Density, and Land Transitions from 1970 to 2010: A Global Synthesis. Environ. Res. Lett. 2020, 15, 044015. [Google Scholar] [CrossRef]
  101. Ford, L.R. A Model of Indonesian City Structure. Geogr. Rev. 1993, 83, 374–396. [Google Scholar] [CrossRef]
  102. Kartiwa, A. Karakteristik Jaringan Perusahaan Properti Di Jabodetabek; Institut Teknologi Bandung: Kota Bandung, Indonesia, 2016. [Google Scholar]
  103. Firman, T. New Town Development in Jakarta Metropolitan Region: A Perspective of Spatial Segregation. Habitat Int. 2004, 28, 349–368. [Google Scholar] [CrossRef]
  104. Diningrat, R. Segregasi Spasial Perumahan Skala Besar: Studi Kasus Kota Baru Kota Harapan Indah (KHI) Bekasi. J. Perenc. Wil. Dan Kota 2015, 26, 111–129. [Google Scholar] [CrossRef] [Green Version]
  105. Apriyanto, H.; Eriyanto; Rustiadi, E.; Mawardi, I. Status Berkelanjutan Kota Tangerang Selatan-Banten Dengan Menggunakan Key Performance Indicators. J. Mns. Dan Lingkung. 2015, 22, 260–270. [Google Scholar] [CrossRef] [Green Version]
  106. Sukarsa, R.; Rudiarto, I. Pengaruh Pembangunan Bukit Semarang Baru Terhadap Sosial-Ekonomi Fisik Lingkungan Masyarakat Sekitarnya. Tek. PWK Perenc. Wil. Kota 2014, 3, 209–219. [Google Scholar]
  107. Saito, L.T. How Low-Income Residents Can Benefit from Urban Development: The LA Live Community Benefits Agreement. City Community 2012, 11, 129–150. [Google Scholar] [CrossRef]
  108. Huu, T.P. Dilemmas of Hydropower Development in Vietnam: Between Dam-Induced Displacement and Sustainable Development; Utrecht University: Utrecht, The Netherlands, 2015. [Google Scholar]
  109. Craglia, M.; Leontidou, L.; Nuvolati, G.; Schweikart, J. Towards the Development of Quality of Life Indicators in the “digital” City. Environ. Plan. B Plan. Des. 2004, 31, 51–64. [Google Scholar] [CrossRef]
  110. Shameem, M.I.M.; Momtaz, S.; Rauscher, R. Vulnerability of Rural Livelihoods to Multiple Stressors: A Case Study from the Southwest Coastal Region of Bangladesh. Ocean Coast. Manag. 2014, 102, 79–87. [Google Scholar] [CrossRef]
  111. Keles, R. The Quality of Life and the Environment. Procedia-Soc. Behav. Sci. 2012, 35, 23–32. [Google Scholar] [CrossRef] [Green Version]
  112. Kõrreveski, K. Measuring Well-Being and Quality of Life Using OECD Indicators. Q. Bull. Stat. Est. 2011, 4, 38–44. [Google Scholar]
  113. Iyer, R.; Koleva, S.; Graham, J.; Ditto, P.H.; Haidt, J. Understanding Libertarian Morality: The Psychological Roots of an Individualist Ideology. SSRN Electron. J. 2010, 1–61. [Google Scholar] [CrossRef]
  114. Bhandari, P.B. Rural Livelihood Change? Household Capital, Community Resources and Livelihood Transition. J. Rural Stud. 2013, 32, 126–136. [Google Scholar] [CrossRef] [Green Version]
  115. Warren, M.R.; Thompson, J.P.; Saegert, S. The Role of Social Capital in Combating Poverty. In Social Capital and Poor Communities; Russell Sage Foundation: New York, NY, USA, 2001; pp. 1–28. [Google Scholar]
  116. Anielski, M. The Economics of Happiness: Building Genuine Wealth; New Society Publishers: Gabriola Island, BC, Canada, 2007; Volume 59. [Google Scholar]
  117. Mella, P.; Gazzola, P. The Holonic View of Organizations and Firms. Syst. Res. Behav. Sci. 2017, 34, 354–374. [Google Scholar] [CrossRef]
  118. Kenny, C. Does Development Make You Happy? Subjective Wellbeing and Economic Growth in Developing Countries. Soc. Indic. Res. 2005, 73, 199–219. [Google Scholar] [CrossRef]
  119. Johansson, S. Conceptualizing and Measuring Quality of Life for National Policy. Soc. Indic. Res. 2002, 58, 13–32. [Google Scholar] [CrossRef]
  120. Tesfazghi, E.S.; Martinez, J.A.; Verplanke, J.J. Variability of Quality of Life at Small Scales: Addis Ababa, Kirkos Sub-City. Soc. Indic. Res. 2010, 98, 73–88. [Google Scholar] [CrossRef] [Green Version]
  121. Grasso, M.; Canova, L. An Assessment of the Quality of Life in the European Union Based on the Social Indicators Approach. Soc. Indic. Res. 2007, 87, 1–25. [Google Scholar] [CrossRef] [Green Version]
  122. Atkinson, A.B.; Bourguignon, F. Introduction: Income Distribution and Economics. Handb. Income Distrib. 2000, 1, 1–58. [Google Scholar] [CrossRef]
  123. Streeten, P.; Burki, S.J. Basic Needs: Some Issues. World Dev. 1978, 6, 411–421. [Google Scholar] [CrossRef]
  124. Estoque, R.C.; Togawa, T.; Ooba, M.; Gomi, K.; Nakamura, S.; Hijioka, Y.; Kameyama, Y. A Review of Quality of Life (QOL) Assessments and Indicators: Towards a “QOL-Climate” Assessment Framework. Ambio 2019, 48, 619–638. [Google Scholar] [CrossRef]
  125. Berhe, R.T.; Martinez, J.; Verplanke, J. Adaptation and Dissonance in Quality of Life: A Case Study in Mekelle, Ethiopia. Soc. Indic. Res. 2014, 118, 535–554. [Google Scholar] [CrossRef]
  126. Das, D. Urban Quality of Life: A Case Study of Guwahati. Soc. Indic. Res. 2008, 88, 297–310. [Google Scholar] [CrossRef]
  127. Oldenhuizing, J.; de Kraker, J.; Valkering, P. Design of a Quality-of-Life Monitor to Promote Learning in a Multiactor Network for Sustainable Urban Development. J. Clean. Prod. 2013, 49, 74–84. [Google Scholar] [CrossRef]
  128. Santos, L.D.; Martins, I.; Brito, P. Measuring Subjective Quality of Life: A Survey to Porto’s Residents. Appl. Res. Qual. Life 2007, 2, 51–64. [Google Scholar] [CrossRef]
  129. Lee, Y.J. Subjective Quality of Life Measurement in Taipei. Build. Environ. 2008, 43, 1205–1215. [Google Scholar] [CrossRef]
  130. Olson, G.; Schober, B. The Satisfied Poor: Development of an Intervention-Oriented Theoretical Framework to Explain Satisfaction with a Life in Poverty. Soc. Indic. Res. 1993, 28, 173–193. [Google Scholar] [CrossRef]
  131. Sirgy, J.M.; Michalos, A.C.; Ferriss, A.L.; Easterlin, R.A.; Patrick, D.; Pavot, W. The Quality-of-Life (QOL) Research Movement: Past, Present, and Future. Soc. Indic. Res. 2006, 76, 343–466. [Google Scholar] [CrossRef]
  132. Brinkerhoff, M.B.; Fredell, K.A.; Frideres, J.S. Basic Minimum Needs, Quality of Life and Selected Correlates: Explorations in Villages in Northern India. Soc. Indic. Res. 1997, 42, 245–281. [Google Scholar] [CrossRef]
  133. Department for International Development. Sustainable Livelihoods Guidance Sheets; DFID: London, UK, 1999.
  134. Zapf, W. Individuelle Wohlfahrt: Lebensbedingungen Und Wahrgenom-Mene Lebensqualität. In Lebensqualität in der Bundesrepublik: Objektive Lebensbedingungen und subjektives Wohlbefinden; Glatzer, W., Zapf, W., Berger, R., Eds.; Frankfurt: New York, NY, USA, 1984; pp. 13–26. [Google Scholar]
  135. Foo, T.S. Subjective Assessment of Urban Quality of Life in Singapore (1997–1998). Habitat Int. 2000, 24, 31–49. [Google Scholar] [CrossRef]
  136. Noll, H.H. Subjective Social Indicators: Benefits and Limitations for Policy Making-An Introduction to This Special Issue. Soc. Indic. Res. 2013, 114, 1–11. [Google Scholar] [CrossRef] [Green Version]
  137. Megawati, D.R.; Ju, S.R.; Hanan, H. The Trend of Housing Design and Town Planning of New Towns in Indonesia. J. Korean Hous. Assoc. 2014, 25, 11–20. [Google Scholar] [CrossRef] [Green Version]
  138. Surya, B. Perubahan Fisik Spasial Kawasan Pinggiran Memarginalkan Komunitas Lokal. J. Tata Loka 2011, 13, 212–223. [Google Scholar]
  139. Surya, B.; Ahmad, D.N.A.; Sakti, H.H.; Sahban, H. Land Use Change, Spatial Interaction, and Sustainable Development in the Metropolitan Urban Areas, South Sulawesi Province, Indonesia. Land 2020, 9, 95. [Google Scholar] [CrossRef] [Green Version]
  140. Tunas, D.; Peresthu, A. The Self-Help Housing in Indonesia: The Only Option for the Poor? Habitat Int. 2010, 34, 315–322. [Google Scholar] [CrossRef]
  141. Battaglia, M.P. Nonprobability Sampling; Sage Publications: Thousand Oaks, CA, USA, 2008. [Google Scholar] [CrossRef]
  142. Acharya, A.S.; Prakash, A.; Saxena, P.; Nigam, A. Sampling: Why and How of It? Indian J. Med. Spec. 2013, 4, 3–7. [Google Scholar] [CrossRef]
  143. Henry, G. Practical Sampling; SAGE Publications, Inc.: Thousand Oaks CA, USA, 1990. [Google Scholar] [CrossRef]
  144. Barratt, M.J.; Lenton, S. Representativeness of Online Purposive Sampling with Australian Cannabis Cultivators. Int. J. Drug Policy 2015, 26, 323–326. [Google Scholar] [CrossRef] [Green Version]
  145. Klar, S.; Leeper, T.J. Identities and Intersectionality: A Case for Purposive Sampling in Survey-Experimental Research. In Experimental Methods in Survey Research: Techniques that Combine Random Sampling with Random Assignment; Wiley: Hoboken, NJ, USA, 2019; pp. 419–433. [Google Scholar] [CrossRef]
  146. Etikan, I. Comparison of Convenience Sampling and Purposive Sampling. Am. J. Theor. Appl. Stat. 2016, 5, 1–4. [Google Scholar] [CrossRef] [Green Version]
  147. Rivera, J.D. When Attaining the Best Sample Is out of Reach: Nonprobability Alternatives When Engaging in Public Administration Research. J. Public Aff. Educ. 2019, 25, 314–342. [Google Scholar] [CrossRef]
  148. Rahmad, R.; Rimba, F.; Wirda, M.A. Study of Population Activities in Establishing the Economic Welfare of Belawan Coastal Communities, North Sumatra. J. Environ. Earth Sci. 2017, 7, 146–152. [Google Scholar] [CrossRef]
  149. Cooper, D.R.; Schindler, P.S. Bussines Research Method, 9th ed.; McGraw-Hill International Editions; McGraw-Hill: New York, NY, USA, 2006. [Google Scholar]
  150. Hair, J.F.; Black, W.C.; Babin, B.J.; Anderson, R.E. Multivariate Data Analysis, 7th ed.; Pearson Education, Inc.: Saddle River, NJ, USA, 2010. [Google Scholar]
  151. Ghozali, I. Structural Equation Modelling, 2nd ed.; Universitas Diponegoro: Semarang, Indonesia, 2008. [Google Scholar]
  152. Streiner, D.L. Starting at the Beginning: An Introduction to Coefficient Alpha and Internal Consistency. J. Pers. Assess. 2003, 80, 99–103. [Google Scholar] [CrossRef]
  153. Green, S.B.; Lissitz, R.W.; Mulaik, S.A. Limitations of Coefficient Alpha as an Index of Test Unidimensionality1. Educ. Psychol. Meas. 1977, 37, 827–838. [Google Scholar] [CrossRef]
  154. Spector, P.E. Summated Rating Scale Construction. An Introduction; Sage Publications: London, UK, 1992. [Google Scholar]
  155. Vaske, J.J. Survey Research and Analysis: Applications in Parks, Recreation and Human Dimensions; Venture Publishing: State College, PA, USA, 2008. [Google Scholar]
  156. Oktaviani, M.A.; Notobroto, H.B. Perbandingan Tingkat Konsistensi Normalitas Distribusi Metode Kolmogorov-Smirnov, Lilliefors, Shapiro-Wilk, Dan Skewness-Kurtosis. J. Biom. Dan Kependud. 2014, 3, 127–135. [Google Scholar]
  157. Mordkoff, T.J. The Assumption(s) of Normality. Available online: http://www2.psychology.uiowa.edu/faculty/mordkoff/GradStats/part 1/I.07 normal.pdf (accessed on 6 September 2021).
  158. Ghasemi, A.; Zahediasl, S. Normality Test for Statistical Analysis: A Guide for Non-Statisticians. Int. J. Endocrinol. Metab. 2012, 10, 486–489. [Google Scholar] [CrossRef] [PubMed] [Green Version]
  159. Piovesana, A.; Senior, G. How Small Is Big: Sample Size and Skewness. Assessment 2018, 25, 793–800. [Google Scholar] [CrossRef] [PubMed]
  160. Kim, T.K. T Test as a Parametric Statistic. Korean J. Anesthesiol. 2015, 68, 540–546. [Google Scholar] [CrossRef] [PubMed] [Green Version]
  161. Kim, T.K.; Park, J.H. More about the Basic Assumptions of T-Test: Normality and Sample Size. Korean J. Anesthesiol. 2019, 72, 331–335. [Google Scholar] [CrossRef] [Green Version]
  162. Heylighen, F. Complexity and Self-Organization; Springer: New York, NY, USA, 2021. [Google Scholar]
  163. Thuiller, W.; Lavorel, S.; Araújo, M.B.; Sykes, M.T.; Prentice, I.C. Climate Change Threats to Plant Diversity in Europe. Proc. Natl. Acad. Sci. USA 2005, 102, 8245–8250. [Google Scholar] [CrossRef]
  164. Costanza, R.; Fisher, B.; Ali, S.; Beer, C.; Bond, L.; Boumans, R.; Danigelis, N.L.; Dickinson, J.; Elliott, C.; Farley, J.; et al. An Integrative Approach to Quality of Life Measurement, Research, and Policy. Surv. Perspect. Integr. Environ. Soc. 2008, 1, 11–15. [Google Scholar] [CrossRef]
  165. de Hollander, A.E.M.; Staatsen, B.A.M. Health, Environment and Quality of Life: An Epidemiological Perspective on Urban Development. Landsc. Urban Plan. 2003, 65, 53–62. [Google Scholar] [CrossRef]
  166. Rahman, T.; Mittelhammer, R.C.; Wandschneider, P.R. Measuring Quality of Life across Countries: A Multiple Indicators and Multiple Causes Approach. J. Socio-Econ. 2011, 40, 43–52. [Google Scholar] [CrossRef]
  167. Afriyie, K.; Abass, K.; Adomako, J.A.A. Urbanisation of the Rural Landscape: Assessing the Effects in Peri-Urban Kumasi. Int. J. Urban Sustain. Dev. 2014, 6, 1–19. [Google Scholar] [CrossRef]
  168. Haregeweyn, N.; Tesfaye, S.; Tsunekawa, A.; Tsubo, M.; Meshesha, D.T.; Adgo, E.; Elias, A. Dynamics of Land Use and Land Cover and Its Effects on Hydrologic Responses: Case Study of the Gilgel Tekeze Catchment in the Highlands of Northern Ethiopia. Environ. Monit. Assess. 2015, 187, 4090. [Google Scholar] [CrossRef]
  169. Gopalakrishnan, T.; Hasan, M.; Haque, A.; Jayasinghe, S.; Kumar, L. Sustainability of Coastal Agriculture under Climate Change. Sustainability 2019, 11, 7200. [Google Scholar] [CrossRef] [Green Version]
  170. Wijayanti, W.P.; Pratomo, R.A. Adaptation of Social-Economic Livelihoods in Coastal Community: The Case of Mangunharjo Sub-District, Semarang City. Procedia-Soc. Behav. Sci. 2016, 227, 477–484. [Google Scholar] [CrossRef] [Green Version]
  171. Blythe, J.L.; Murray, G.; Flaherty, M. Strengthening Threatened Communities through Adaptation: Insights from Coastal Mozambique. Ecol. Soc. 2014, 19, art6. [Google Scholar] [CrossRef] [Green Version]
  172. Cummins, V.; McKenna, J. The Potential Role of Sustainability Science in Coastal Zone Management. Ocean Coast. Manag. 2010, 53, 796–804. [Google Scholar] [CrossRef]
  173. Duxbury, J.; Dickinson, S. Principles for Sustainable Governance of the Coastal Zone: In the Context of Coastal Disasters. Ecol. Econ. 2007, 63, 319–330. [Google Scholar] [CrossRef]
  174. Mee, L. Between the Devil and the Deep Blue Sea: The Coastal Zone in an Era of Globalisation. Estuar. Coast. Shelf Sci. 2012, 96, 1–8. [Google Scholar] [CrossRef]
Figure 1. Stages of development of peri-urban areas. Source: Elaborated from Adell, [48]; Coy, Sandholz, Töpfer, & Zirkl, [56]; Douglass, [57]; Firman, [58]; Rauws & De Roo, [3]; Rondinelli, [59].
Sustainability 14 13435 g001
Figure 2. Components of quality of life. Source: Constructed from Atkinson & Bourguignon, [122]; Grasso & Canova, [121]; Sirgy, [38]; Streeten & Burki, [123].
Sustainability 14 13435 g002
Figure 3. Interaction among livelihood assets and quality of life in the context of socio-economic development. Source: Structured from Costanza et al. [44]; Estoque et al. [124]; Olson & Schober, [130]; Sirgy, [38].
Sustainability 14 13435 g003
Figure 4. Classification of levels of quality of life. Source: Constructed from Foo [135] and Noll [136].
Sustainability 14 13435 g004
Figure 5. Distribution of kampungs in (a) Metro Tanjung Bunga and (b) Kota Baru Parahyangan.
Sustainability 14 13435 g005
Figure 6. Livelihood assets in (a) Metro Tanjung Bunga and (b) Kota Baru Parahyangan.
Sustainability 14 13435 g006
Figure 7. Objective and subjective QoL of local communities in (a) Metro Tanjung Bunga and (b) Kota Baru Parahyangan.
Sustainability 14 13435 g007
Figure 8. Overall QoL transformation of local communities in (a) Metro Tanjung Bunga and (b) Kota Baru Parahyangan.
Sustainability 14 13435 g008
Figure 9. Comparison of multiple boxplots for the transformation of (a) livelihoods assets, (b) objective QoL, (c) subjective QoL and (d) overall QoL in MTB and KBP.
Sustainability 14 13435 g009
Table 1. Indicators of quality of life.
Education: formal education, access to informal education, educational insurance, access to educational facilitiesCivil and political freedom: involvement in organisations, active in decision-making
Health: personal disease, health insurance, access to health facilitiesSocial bonds: trust, tolerance, cooperation, access to information
Income: adequate income, savings, access to credit, landownershipEmployment: type of jobs, knowledge and skills, access to work location
Housing: homeownership, housing condition, comfort, access to the houseEnvironmental quality: access to fresh air, access to clean water
Source: Elaborated from Berhe et al. [125]; Bhandari, [114]; Brinkerhoff, Fredell, & Frideres, [132]; Costanza et al. [44]; Department for International Development, [133]; Tesfazghi et al. [120].
Table 2. Distribution of respondents in MTB and KBP.
Metro Tanjung Bunga Kota Baru Parahyangan
KampungLocationNumber of RespondentsKampungLocationNumber of Respondents
Kampung 1.1RW 1 Kelurahan Bontorannu & RW 4, 6, 7 Kelurahan Maccini Sombala15Kampung 2.1RW 2 Desa Bojonghaleuang9
Kampung 1.2RW 1, 2, and 7 Kelurahan Tanjung Merdeka16Kampung 2.2RW 7 Desa Bojonghaleuang10
Kampung 1.3RW 5 and 6 Kelurahan Tanjung Merdeka16Kampung 2.3RW 3 and 4 Desa Cikande9
Kampung 1.4RW 4 Kelurahan Tanjung Merdeka14Kampung 2.4RW 3 and 4 Desa Bojonghaleuang9
Kampung 1.5RW 10 Kelurahan Barombong14Kampung 2.5RW 10 Desa Cipeundeuy9
Total75Kampung 2.6RW 19 Desa Kertajaya10
Kampung 2.7RW 20 Desa Kertajaya9
Kampung 2.8RW 5 and 6 Desa Bojonghaleuang10
Total75
Table 3. Factor analysis and Cronbach Alpha Test.
No.QoL IndicatorsFactor LoadingNo.QoL IndicatorsFactor Loading
1Education (α = 0.772, 0.721) 5Social bonds (α = 0.711, 0.729)
  • Educational insurance
0.692
  • Cooperation
0.807
2.
Access to informal education
0.668
2.
Access to information
0.748
3.
Access to educational facilities
0.641
3.
Trust
0.709
4.
Formal education
0.6346Employment (α = 0.732, 0.729)
2Health (α = 0.762, 0.721)
  • Type of jobs
0.801
  • Access to health facilities
0.742
2.
Access to work location
0.732
2.
Personal disease
0.738
3.
Knowledge to work
0.705
3.
Health insurance
0.7137Environmental quality (α = 0.764, 0.726)
3Income (α = 0.921, 0.834)
  • Access to clean water
0.767
  • Adequate income
0.931
2.
Access to fresh air
0.741
2.
Savings
0.7718Civil and political freedom (α = 0.771, 0.763)
4Housing (α = 0.962, 0.819)
  • Active in decision-making
0.793
  • Homeownership
0.907
2.
Involvement in organisations
0.711
2.
Housing condition
0.811
3.
Comfort
0.782
Note: (α = Cronbach alpha of objective; subjective).
Table 4. Dependent paired t-test for livelihood assets and QoL level.
VariablesBefore DevelopmentAfter Developmentp-ValueResult
MeanStd. DeviationMeanStd. Deviation
Livelihood assets
MTB2.88±0.492.45±0.38<0.001 *Significant
KBP3.06±0.582.61±0.62<0.001 *Significant
Objective QoL
MTB2.83±0.442.46±0.36<0.001 *Significant
KBP3.07±0.512.78±0.57<0.001 *Significant
Subjective QoL
MTB3.08±0.412.72±0.38<0.001 *Significant
KBP3.21±0.562.98±0.53<0.001 *Significant
Overall QoL
MTB2.51±1.111.60±1.01<0.001 *Significant
KBP2.53±1.152.11±1.14<0.001 *Significant
* p-value < 0.05.
Table 5. Independent t-test for livelihood assets and QoL level.
VariablesTransformationp-ValueResult
MeanStd. Deviation
Livelihood asset
MTB−0.43±0.260.6316Not significant
KBP−0.46±0.38
Objective QoL
MTB−0.36±0.270.158Not significant
KBP−0.29±0.33
Subjective QoL
MTB−0.36±0.310.002 *Significant
KBP−0.23±0.20
Overall QoL
MTB−0.91±1.040.001 *Significant
KBP−0.43±0.74
* p-value < 0.05.
Publisher’s Note: MDPI stays neutral with regard to jurisdictional claims in published maps and institutional affiliations.

