Article

Reducing Wind Erosion through Agroforestry: A Case Study Using Large Eddy Simulations

by
Justus G. V. van Ramshorst
1,*,
Lukas Siebicke
1,
Moritz Baumeister
1,
Fernando E. Moyano
1,2,
Alexander Knohl
1,3 and
Christian Markwitz
1
1
Bioclimatology, Faculty of Forest Sciences and Forest Ecology, University of Göttingen, Büsgenweg 2, 37077 Göttingen, Germany
2
Institute of Geography, University of Augsburg, Alter Postweg 118, Building B, 86159 Augsburg, Germany
3
Centre of Biodiversity and Sustainable Land Use (CBL), University of Göttingen, Büsgenweg 1, 37077 Göttingen, Germany
*
Author to whom correspondence should be addressed.
Sustainability 2022, 14(20), 13372; https://doi.org/10.3390/su142013372
Submission received: 20 September 2022 / Revised: 12 October 2022 / Accepted: 13 October 2022 / Published: 17 October 2022
(This article belongs to the Special Issue Agroforestry for Sustainable Soil Management)

Abstract

:
Wind erosion is seen as one of the main risks for modern agriculture in dry and sandy regions. Shelterbelts and agroforestry systems are known for their ability to reduce wind speed and, consequently, wind erosion. The current study considers temperate alley cropping agroforestry systems, where multiple tree strips (shelterbelts) are interleaved with either annual rotating crops or perennial grassland. The aim was to quantify the potential wind erosion reduction by alley cropping agroforestry systems and the effect of design decisions for a case study in Germany. By combining wind measurements and Large Eddy Simulations, the wind speed and potential wind erosion inside an agroforestry system were estimated. Our model simulations result in an average reduction in wind speed between 17% and 67%, and a reduction of average potential wind erosion between 24% and 97%. The most optimal reduction of the average potential wind erosion was larger than 92% for tree strips orientated perpendicular to the main wind direction, whereas for a diagonal orientation of the tree strips to the main wind direction we found an average reduction of 86%. Parallel orientated tree strips reduce wind erosion on average by less than 35%. Tree strips planted with ≤48 m distance provide a strong and constant reduction of wind erosion, even for tree strips of 2 m height the average reduction was 86%, when the tree strips were orientated optimal to the dominant wind direction. Our model simulations showed that alley cropping agroforestry systems in a temperate climate have a large potential to reduce wind erosion by more than 80% when the system is well-designed and managed.

1. Introduction

The degradation of arable land due to wind erosion has been studied for decades, and is still seen as one of the main risks for modern agriculture in dry and sandy regions [1,2,3,4]. Maintaining a productive agriculture is fundamental for feeding the increasing world population of the future [5]. Next to an increasing population, the effects of climate change [6] will put extra stress on the world food production, stressing the importance of a sustainable intensification of agriculture [5,7,8]. An observed and projected air temperature increase and/or a decrease in rainfall due to climate change can result in drier soils, enhancing the vulnerability to wind erosion [6,9,10], and highlighting the importance of preventing degradation of arable land due to wind erosion.
Wind erosion is driven by the wind and therefore a reduction in wind speed, by for example tree strips, would result in a reduction of wind erosion [11,12,13]. Previous studies showed that (potential) wind erosion is proportional to the wind speed cubed, which can be understood as the wind erosion force [11,14,15]. Potential wind erosion calculations indirectly include the soil type, soil cover and soil moisture by applying a wind speed threshold. All wind speeds above this threshold are considered potential wind erosion events. Skidmore and Hagen (1977) [11] applied this method to quantify the reduction of potential wind erosion behind a single tree strip.
Single tree strips, or so called shelterbelts, have been studied for more than half a century for their potential to reduce wind speed [16,17]. The effectiveness of wind speed reduction by shelterbelts depends on design properties such as the height, width and density of the tree strips and the orientation of the tree strips relative to the (dominant) wind direction [12,18,19]. Wind speed reduction was only observed until approximately 2–10 times the height of the tree strip and diminishes with distance [17,19,20,21]. Wind speed reduction can be extended to a larger area if the number of tree strips are increased, as is carried out with alley cropping, which is one type of agroforestry (AF) [21,22,23]. Alley cropping agroforestry systems can be defined as multiple tree strips interleaved with either annual rotating crops or perennial grassland [24,25]. Recently, also the wind speed reduction by alley cropping agroforestry systems has been studied [13,26].
Agroforestry is well studied as a sustainable-ecological-solution for agriculture in a changing climate [8,27,28,29] and has proven to have many ecological benefits such as CO 2 sequestration [30,31], increased biodiversity [32,33,34], changed microclimate [35,36] and prevention of erosion by water and wind [13,28]. There a many different types of agroforestry, for example silvopasture, riparian buffers, shelterbelts and forest farming, and in general these all have a positive effect on wind erosion due to reduced wind speeds [28]. More specifically, it was discussed that alley cropping agroforestry systems will reduce wind erosion due to a reduced wind speed [13]. However, the possible magnitude of the reduction of wind erosion was not quantified yet. One of the reasons is that measuring the wind field and wind erosion inside an agroforestry system is more difficult compared to an open flat agricultural field, as the landscape becomes very heterogeneous [26].
Accurately measuring the wind field inside a heterogeneous agroforestry system would require a large effort, for example, installing a large number of cup or sonic anemometers, alternatively using a novel actively heated fiber-optics distributed wind measuring setup [37]. This was one of the reasons why the study of Markwitz (2021) [26], used Large Eddy Simulations (LES) to determine the wind field inside an agroforestry system. LES allow us to simulate the 3D wind field inside a complex terrain, which provides detailed spatial knowledge on the wind field dynamics [38]. By combining the LES and wind speed measurements it becomes possible to determine the precise magnitude of the wind speed inside the agroforestry system. This is very important, as a change in wind speed has a non-linear effect on (the potential) wind erosion. The obtained wind speed inside the agroforestry system enables to quantify the reduction of potential wind erosion inside the alley cropping agroforestry system compared to an open field.
The current study combines wind measurements with the LES model to, firstly, quantify the wind speed and potential wind erosion reduction by a temperate alley cropping agroforestry system in Germany, and, secondly, investigate the effect of the wind direction relative to the orientation of the tree strips, the height of the trees, the distance between tree strips, the density of the tree strips and the wind speed magnitude on potential wind erosion reduction.

2. Methods

2.1. Site Description

The current study is based on an existing agroforestry site in Forst (Lower Lusatia), Germany (51°47 19.4 N, 14°37 57.6 E) (Figure 1). The agroforestry site is part of the “sustainable intensification of agriculture through agroforestry (SIGNAL) project” (http://www.signal.uni-goettingen.de/, accessed on 19 September 2022), which investigates if and under which site conditions agroforestry can be a sustainable solution for future agriculture.
The study site is next to the river Neisse and this naturally influenced the top layer of the soil. In Böhm et al. (2014) [13] the agroforestry site (in that paper referred to as Site II) was described in detail. The key design and climate characteristics of the agroforestry site are listed in Table 1. The soil was classified as sandy loam (Gleyic Cambisol, with: 67% Sand, 24% Silt and 9% Clay), with a bulk density of 1280 kg m 3 [39].
The dominant wind direction is west–southwest (Figure 2). Based on the entire dataset used the long term mean and maximum wind speed at 3.5 m height are 2.31 m s 1 and 5.01 m s 1 , respectively.

2.2. Measurements

Meteorological measurements were performed at a 3.5 m tower at a control plot with conventional agriculture without tree strips (monoculture (MC)) since March 2016 [40]. This weather station is placed west of the agroforestry system. (Figure 1).
In the current study, we used the wind speed and wind direction measurements from the monoculture tower, from 9 March 2016 to 2 October 2018. The data contain several gaps which add up to approximately 33% of the total time period, however, the dataset still contains 29,865 half hourly data points, which equals 622 days of data. Most gaps occur at night and in winter time due to a lack of solar energy supply. At night and during winter time, wind erosion risks are smaller as at night the wind speeds are generally lower than during the day and in winter the soil moisture conditions are high. The half hourly average and maximum wind speed and wind direction were obtained with a sonic anemometer (uSONIC-3 Omni, METEK GmbH, Elmshorn, Germany) at 3.5 m height, with a 20 Hz sampling rate.

2.3. Calculating the Wind Speed at 0.5 m Height

Wind erosion occurs at the soil surface and therefore wind speeds closer to the surface are a better indication for wind erosion than wind speed measurements at 3.5 m height [41,42,43]. Additionally, in contrast to a relatively stable wind field at an open field, the wind speed inside heterogeneous agroforestry systems can change drastically with height due to the wind reduction by the tree strips. The lowest simulated height for relative wind speeds in our LES model is 0.5 m, therefore we estimated the average and maximum wind speed at 0.5 m height above ground from measurements at a height of 3.5 m by using the rearranged logarithmic wind profile equation [44,45].
u M C S F C = u M C · l n ( z M C S F C d z 0 ) + ψ ( z M C S F C / L ) l n ( z M C d z 0 ) + ψ ( z M C / L ) ,
where u M C S F C (m s 1 ) is the estimated wind speed close to the surface (SFC) at the monoculture tower in the open field at a height of 0.5 m ( z M C S F C = 0.5 m). u M C (m s 1 ) is the measured average wind speed at the monoculture tower in the open field at a height of 3.5 m ( z M C = 3.5 m). In the current study, bare soil conditions were assumed for the whole dataset, therefore the displacement height, d (m), was set to zero and the roughness length z 0 (m) was held constant and estimated by using high-frequency wind speed measurements (Section 2.5). Similarly, the half-hourly maximum wind speed at a height of 0.5 m above ground was estimated, u M C M A X S F C , based on the measured half-hourly maximum wind speed at a height of 3.5 m above ground, u M C M A X .
The standard logarithmic wind profile can only be applied for close to neutral atmospheric conditions [46,47]. By including an additional stability function, ψ ( z / L ) , the logarithmic wind profile can also be applied for non-neutral atmospheric conditions, where z (m) is the measurement height and L (m) the Monin-Obukhov length [46,48]. When applying the logarithmic wind profile, it was assumed that friction velocity, u * , and L stay constant with height [45], which is appropriate for the measurements at the open field.
The stability function ψ ( z / L ) changes for neutral, stable and unstable conditions [46,47,48].
Neutral : 0.1 z / L 0.1 ψ ( z / L ) = 0
Stable : z / L > 0.1 ψ ( z / L ) = 6 z / L
Unstable : z / L < 0.1 ( l n ( z d z 0 ) 19.3 z / L ) 1 / 4
The applicability range of ψ ( z / L ) is limited from 2 z / L 1 [48]. To extend the number of available data, we assume that all values of z / L < 2 are fixed to −2 and values of z / L > 1 are fixed to 1. This simplification prevents the stability function becoming nonphysical during very stable and unstable atmospheric conditions and in addition allows for a higher fraction of valid data points.

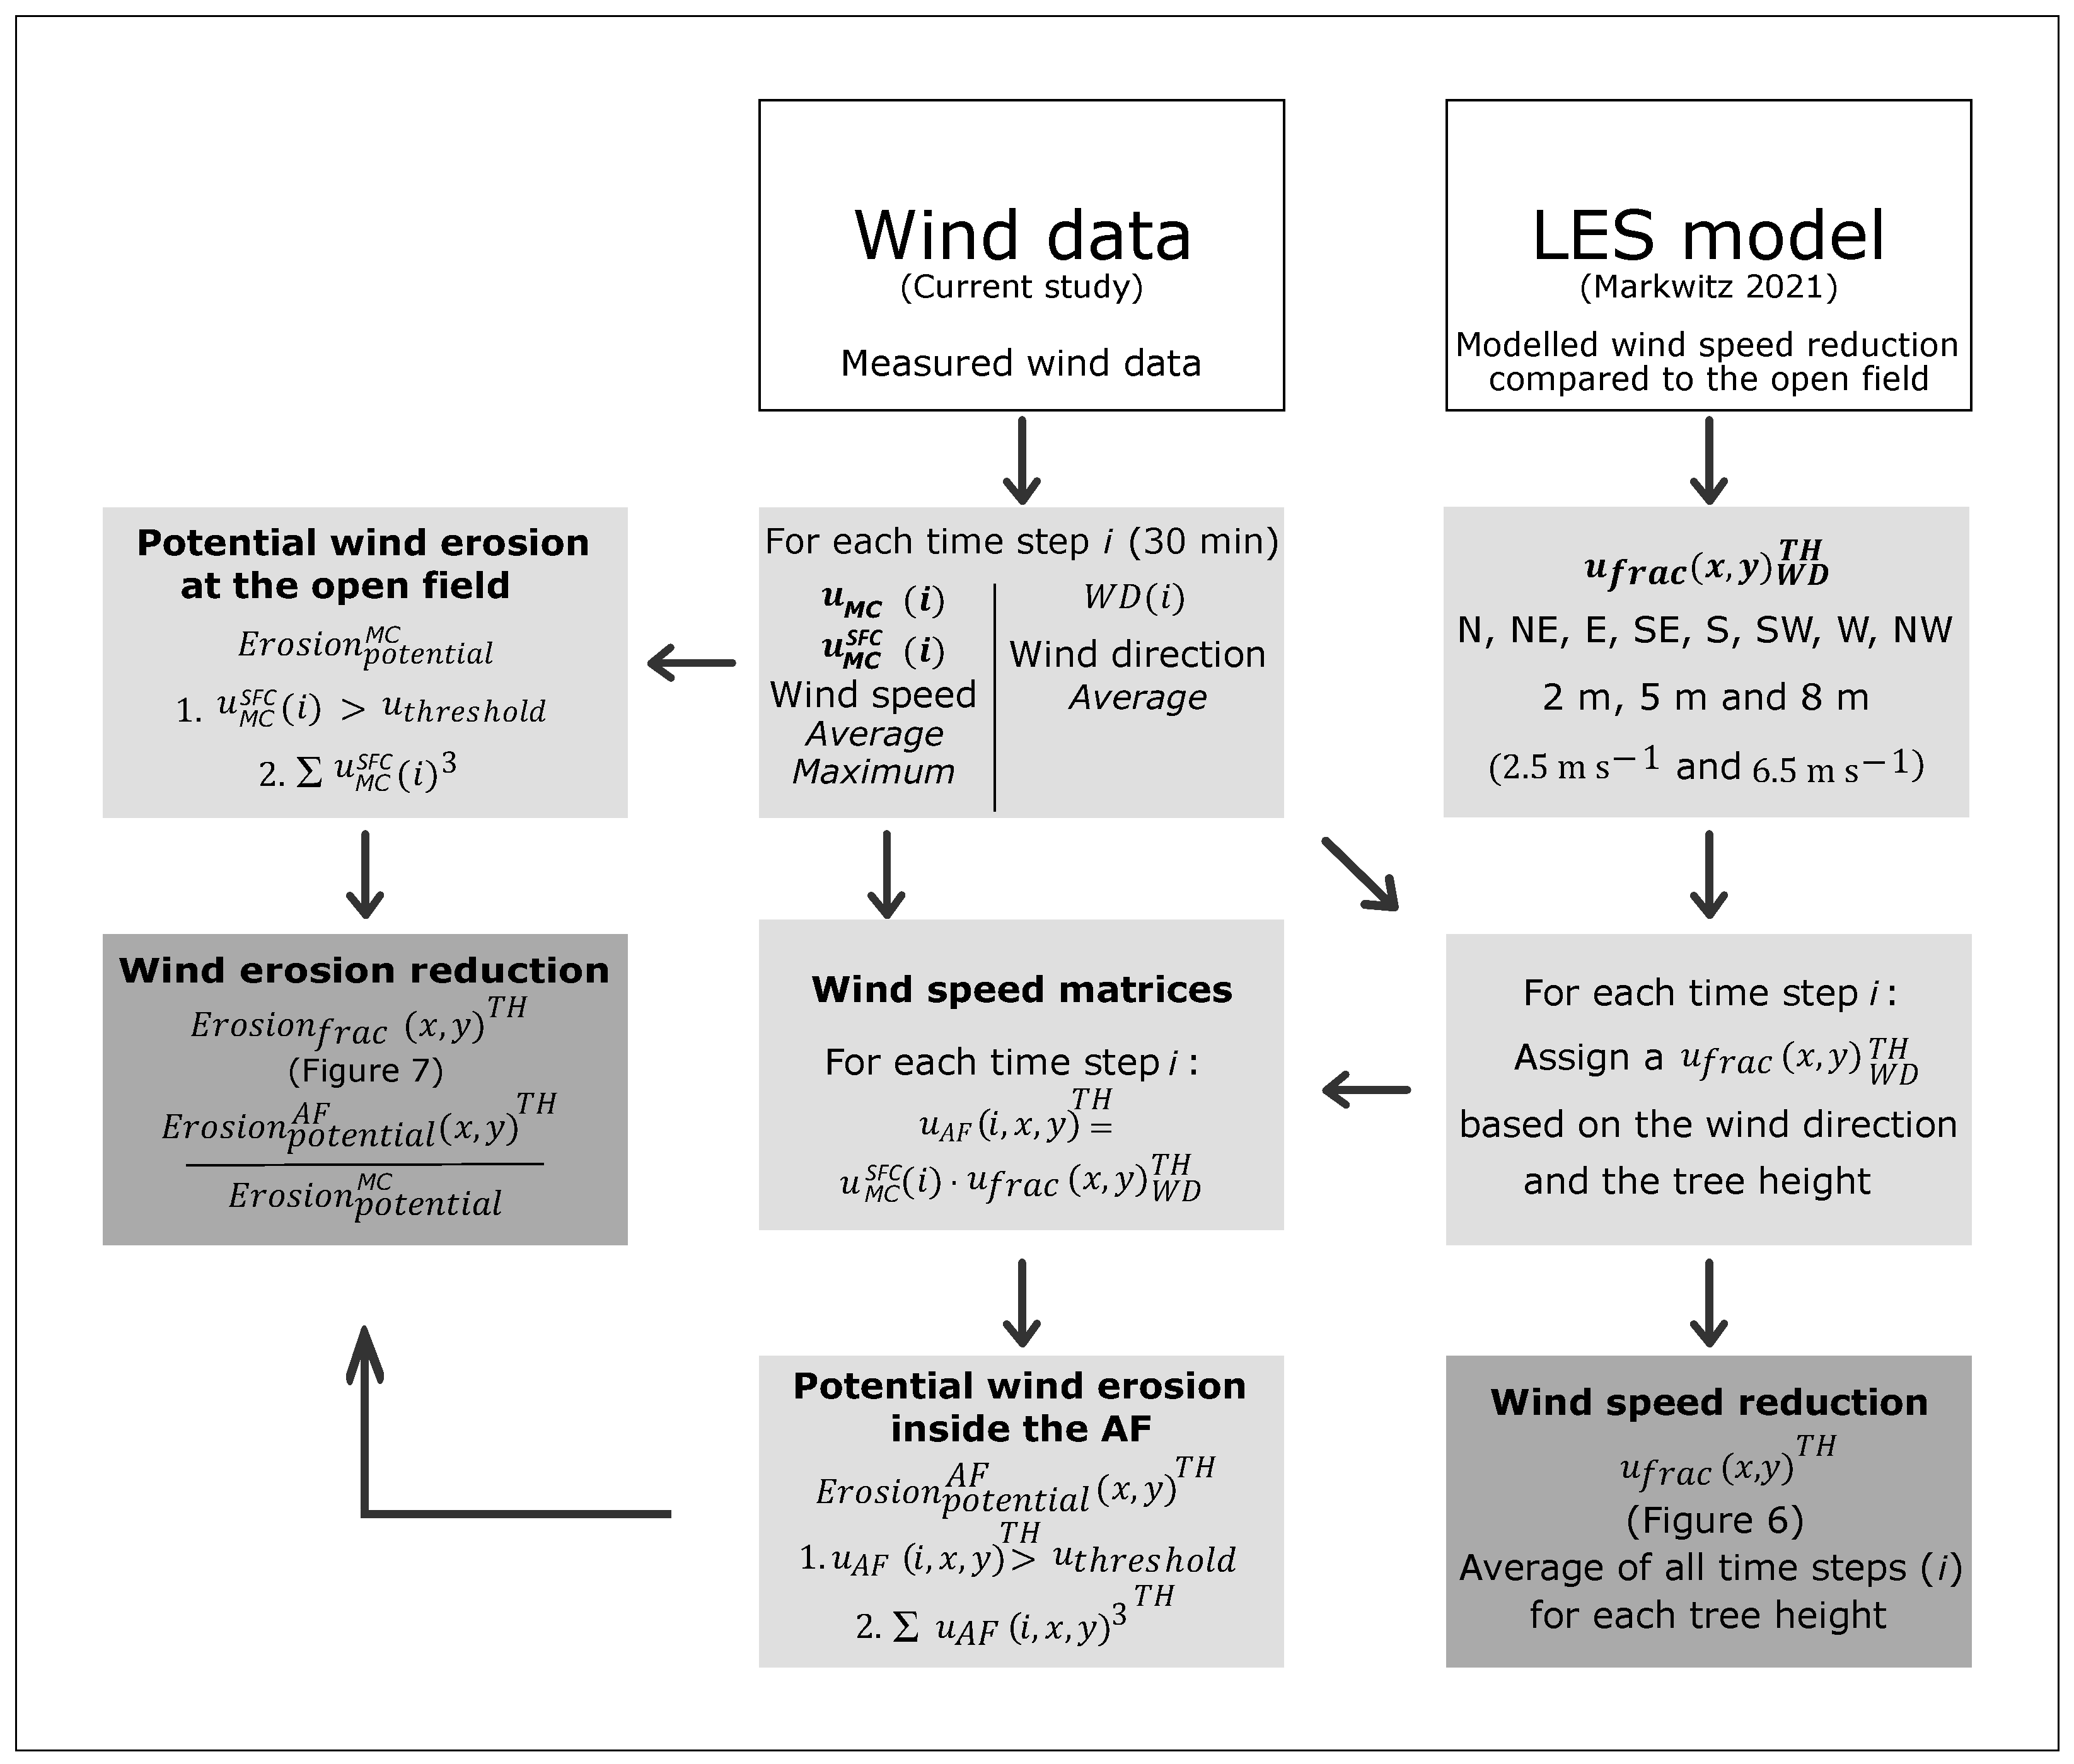
2.4. Potential Wind Erosion

Most studies estimate the amount of wind erosion by including wind speed (or friction velocity) cubed when reaching a wind speed threshold in their method (e.g., [42,49,50,51,52]). However, these methods often require additional detailed input such as soil moisture measurements or site dependent empirically determined parameters, which are difficult to verify with erosion measurements in the field [53].
By contrast, the current study will use the convenient approach from Skidmore and Hagen (1977) [11] to estimate the potential wind erosion given by Equation (3). This method simplifies the site dependent characteristics to a single estimated constant, u t h r e s h o l d , which is sufficient for our study interested in the relative effect of AF on wind erosion. Hence that we do not measure the amount of soil removed due to wind erosion, but merely estimate the potential wind erosion reduction by agroforestry. Similarly, this potential wind erosion reduction was estimated adjacent to shelterbelts by [11,14,15,54,55].
E r o s i o n p o t e n t i a l = u ¯ 3 ( i ) , for u ¯ ( i ) > u t h r e s h o l d ,
where E r o s i o n p o t e n t i a l is the potential wind erosion (m 3 s 3 ) and u ¯ ( i ) (m s 1 ) is the average wind speed for time step i. For each time step we determined if u ¯ ( i ) > u t h r e s h o l d , where u t h r e s h o l d is the threshold wind velocity, which needs to be exceeded to initiate wind erosion. When u ¯ ( i ) u t h r e s h o l d , a zero for no potential wind erosion will be added for this time step. Finally, the sum was taken over all half hourly values, resulting in a single value indicating the magnitude of potential wind erosion over the entire time period.
Based on the wind speed measurements at our site, the non-linear response of Equation (3) is shown in Figure 3, as a function of multiple u t h r e s h o l d . Wind erosion decreases faster than wind speed, and by including an u t h r e s h o l d the reduction is enhanced.

2.5. Wind Speed Threshold Estimation

There is a need of a certain magnitude of wind speed to initiate wind erosion and this threshold is defined by u t h r e s h o l d . In order to estimate the potential wind erosion an appropriate u t h r e s h o l d needs to be determined, which depends on the soil type, the soil cover, the soil moisture and the measurement height. Sandy soils, as present at our site, have a lower u t h r e s h o l d compared to for example cohesive clay soils and therefore wind erosion occurs more rapidly.
Empirical studies have used a friction velocity threshold ( u 🞰 t h r e s h o l d ), instead of a wind speed threshold ( u t h r e s h o l d ) and found an u 🞰 t h r e s h o l d = 0.30 m s 1 for dry, bare soil, sandy loam soils, as present at our site [42,56]. In our study we apply this u 🞰 t h r e s h o l d of 0.30 m s 1 from literature. Equation (3) requires a u t h r e s h o l d for the measurement height and therefore we transformed the u 🞰 t h r e s h o l d into a wind speed threshold, u t h r e s h o l d , by rearranging the standard logarithmic wind profile equation, as shown in Equation (4) [14,44,56]:
u t h r e s h o l d = u 🞰 t h r e s h o l d · ln ( z M C S F C d z 0 ) κ ,
where u 🞰 t h r e s h o l d (m s 1 ) is the friction velocity threshold, u t h r e s h o l d (m s 1 ) is the wind speed threshold, κ = 0.4 is the von Karman constant (-), d (m) is the displacement height and z M C S F C (m) and z 0 (m) are the measurement height and roughness length, respectively. The measurement height is 0.5 m and for bare soil conditions d is very small and assumed to be zero ( d = 0 ), therefore the only unknown is z 0 .
The 3D sonic anemometer at the Forst monoculture site also provides independent friction velocity measurements ( u 🞰 E C = ( u w ¯ ) 1 / 2 ), with u and w the deviations of the mean horizontal (u) and vertical (w) wind component, respectively. By combining the measured wind speeds ( u M C ) and friction velocity measurements ( u 🞰 E C ) and using the original logarithmic wind profile equation [44], we can solve z 0 by applying the nonlinear least squares estimate method (using the nls function from package stats in R (v.4.0.2.)).
Similar to Equation (1), Equation (4) can only be applied for neutral atmospheric conditions [46,47]. Therefore, the nonlinear least squares estimate method was applied after selecting the bare soil data when the atmosphere was considered close to neutral, 0.1 z / L 0.1 [47]. An average roughness length of z 0 = 0.0136 m was found for the bare soil conditions, with fitting statistics of: R 2 = 0.77 , slope = 1.06 and an intercept of −0.03 for n = 7184 . Hence, in our study agricultural bare soil conditions are present, this includes crop residuals and heterogeneity due to soil cultivation, which most likely leads to a higher roughness length compared to perfect smooth bare soil conditions. Nevertheless, an u 🞰 t h r e s h o l d = 0.30 m s 1 combined with a z 0 = 0.0136 m, resulted in an u t h r e s h o l d of 2.7 m s 1 , which fits within the range of the measurements and model predictions shown by Marticorena and Bergametti (1995) [49].
In the current study, the value of u t h r e s h o l d = 2.7 m s 1 was applied to the whole dataset. In case of any other land cover than bare soil, u t h r e s h o l d , u 🞰 t h r e s h o l d and z 0 would be different. In other cases Equation (4) can still be used to estimate z 0 , however in case of a land cover with a significant height it is necessary to express d in relation to z 0 , which was carried out for several crops based on experimental studies [57,58].
The magnitude of u t h r e s h o l d and consequently potential wind erosion is mainly determined by three main properties: the soil type, the soil cover and the soil moisture [1,51]. In the current study, we assume constant conditions for these properties and the consequences are briefly discussed.
Sandy soils are more prone to wind erosion than silty or clayish soils. Silt and clay soils have at least an u 🞰 t h r e s h o l d of 0.55 m s 1 , and depending on the state of the top layer (crusted/cloddy) the threshold can reach limits up to u 🞰 t h r e s h o l d = 2 m s 1 [56]. Therefore, most care is needed with the sandy parts ( u 🞰 t h r e s h o l d = 0.3 m s 1 ) of the soil layer [43]. Additionally, smaller sand grains will erode more easily and an u 🞰 t h r e s h o l d = 0.30 m s 1 infers that small and medium sand grains (<0.35 mm) are prone to wind erosion [50,59].
Wind erosion happens more easily when there are no crops or plants on the soil surface, hence there are bare soil conditions without a crust [43,60,61,62,63]. In the current study, we assume bare soil conditions for the whole dataset, so that we can focus on the effect of the tree strips only, without the influence of other factors. Furthermore, soils are bare for a substantial part of the year, as also shown by the current study where 33% of the dataset represents bare soil conditions.
When the upper top layer of the soil is dry, soil erosion can occur more easily compared to when the top layer of the soil is humid [64]. However, it is not straightforward to model the soil moisture dynamics and the effect on the erodibility of soil, because even air humidity can play a role, especially in dry climates or a dry summer [43,65]. For example, due to high humid air conditions at night, rewetting of the upper soil layer can occur as a result of dew fall. Therefore we assumed dry soil conditions throughout the dataset.

2.6. Wind Speed and Potential Wind Erosion inside the Agroforestry System

At the monoculture site the potential wind erosion, E r o s i o n p o t e n t i a l M C , can be determined directly by using the wind speeds from the monoculture tower ( u M C S F C ) and calculating E r o s i o n p o t e n t i a l M C according to Equation (3), being a point measurement. Similarly, we also calculated the potential wind erosion for maximum wind speeds, E r o s i o n p o t e n t i a l M C M A X , to investigate the impact of wind speed magnitude on potential wind erosion.
To calculate the potential wind erosion at the agroforestry site, E r o s i o n p o t e n t i a l A F , more steps are necessary, as also schematized in Figure 4. We used the AF configuration in the LES model from Markwitz (2021) [26] to calculate a fractional wind speed u f r a c (simulated wind speed inside the agroforestry system divided by the simulated wind speed outside the agroforestry system). By combining the modelled fractional wind speeds with the wind speed measurements at the open field ( u M C S F C ), the wind speed and potential wind erosion inside the agroforestry system can be estimated.

2.6.1. Large Eddy Simulation Model

The flow of the air inside an agroforestry system was simulated with the All Scale Atmospheric Model (ASAM), which was treated as a LES model [38,66]. The LES model was used with periodic boundary conditions in x and y direction, i.e., the outflow on the lee side was used as inflow on the upwind side. Periodic boundary conditions were chosen to allow for the development of a logarithmic wind profile in all parts of the domain. We are aware that this leads to artifacts at the inflow site of the domain. The model domain of the LES model for the Forst site is visualized in Figure 5 and described in more detail by Markwitz (2021) [26]. The agroforestry system was modelled as a three dimensional cube with dimensions of 640 × 640 × 50 m and a grid size of 2 × 2 × 1 m ( x , y , z ). For each pixel the model predicts a single wind speed, based on an initial undisturbed mean wind speed of 2.5 m s 1 and 6.5 m s 1 (close to the mean and maximum wind speed of our site, Table 1). The predicted wind speed equals the mean of the last 15 min of the 30 min simulation time of the LES model. The simulated wind speed was validated with several wind speed measurements from a different study at the Forst site [67].
The wind speed was simulated for three wind directions (west, northwest and north), three different tree heights (2, 5 and 8 m) and for two initial wind speeds (2.5 m s 1 and 6.5 m s 1 ) [26]. By assuming symmetry for wind speed between wind directions, the other wind directions (northeast, east, southeast, south and southwest) are acquired by mirroring the modelled matrices respectively. Measured tree strip densities for poplar (0.14 m 2 m 3 ) and black locust (0.2 m 2 m 3 ) were also included as indicated in Figure 5 [26,68]. Finally, the simulated wind speeds used for further analysis were taken from the height 0.5 m of the domain ( z = 0.5 m), which equals to the measurement height of the estimated u M C S F C .

2.6.2. Wind Speed Reduction

To obtain the fractional wind speed relative to the open field ( u f r a c (%)), the simulated wind speeds in the agroforestry system were divided by the representative simulated wind speeds in the open field upwind of the agroforestry system (as defined in Figure 5). The fractional wind speed can be seen as a matrix with a value for each pixel u f r a c ( x ,   y ) , with x and y being the position inside the matrix as visualized by Figure 5. Twentyfour u f r a c ( x ,   y ) W D T H matrices were calculated, where W D indicates the corresponding wind direction (N, NE, E, SE, S, SW, W, NW) and likewise T H indicates the corresponding modelled tree height (2, 5, 8 m). The same calculations were performed for both initial wind speeds of 2.5 m s 1 and 6.5 m s 1 .
The representative simulated wind speed in the open field outside the agroforestry system is different for each wind direction. With west wind conditions the wind speed west of the agroforestry system is unaffected and likewise for north wind conditions the wind speed north of the agroforestry system is unaffected. With west wind conditions, for each row in the matrix an average of the incoming wind speed was calculated: u A F L E S ( x 1 : x 50 , y ) ¯ W T H , where the average was calculated over the first 50 columns (100 m). With north wind conditions, for each column in the matrix an average of the incoming wind speed was calculated: u A F L E S ( x , y 1 : y 50 ) ¯ N T H , where the average was calculated over the first 50 rows (100 m). For northwest wind conditions, for each diagonal (upper left to lower right for NW) in the matrix an average of the incoming wind speed was calculated: u A F L E S ( d , e 1 : e 60 ) ¯ N W T H , where the average was calculated over the first 60 positions (e), or less at the edges, from the representative diagonal (d). For all other wind directions the same method was applied, where the averaging values have to be chosen accordingly to the representative unaffected simulated wind speeds.
By combining the simulated fractional wind speed u f r a c ( x , y ) W D T H with the open field wind speed measurements ( u M C S F C ), the actual wind speeds inside the agroforestry system can be estimated (Equation (5)):
u A F ( i ,   x ,   y ) T H = u M C S F C ( i ) · u f r a c ( x ,   y ) W D T H ,
where u A F ( i ,   x ,   y ) is the wind speed at 0.5 m height inside the agroforestry system for each x and y position, according to Figure 5. The i indicates that each time step of u A F is a single matrix and that the representative u f r a c ( x ,   y ) W D T H needs to be determined for each time step based on the wind direction measured at the monoculture tower ( W D M C ). Hence, there will be i matrices of u A F , where i is equal to the total amount of i of u M C .
The total average fractional wind speed can be calculated by averaging over all i selected fractional wind speed matrices, u f r a c ( x ,   y ) W D T H ( i ) ¯ T H , for each tree height (2, 5, 8 m).
For the case of maximum wind speeds, u M C M A X S F C ( i ) and u f r a c M A X ( x ,   y ) W D T H are used in Equation (5) to calculate the maximum wind speeds inside the agroforestry, u A F M A X ( i ,   x ,   y ) T H .

2.6.3. Potential Wind Erosion

The potential wind erosion inside the agroforestry system, E r o s i o n p o t e n t i a l A F , was calculated based on the previously estimated wind speeds inside the agroforestry system, u A F ( i ,   x ,   y ) :
E r o s i o n p o t e n t i a l A F ( x ,   y ) T H = u ¯ A F 3 ( i ,   x ,   y ) , if   u ¯ A F ( i ,   x ,   y ) > u t h r e s h o l d .
Finally, the fractional potential wind erosion, E r o s i o n f r a c ( x , y ) T H , was calculated as the fraction of the potential wind erosion of the agroforestry site, E r o s i o n p o t e n t i a l A F , and the potential wind erosion of the monoculture site, E r o s i o n p o t e n t i a l M C :
E r o s i o n f r a c ( x ,   y ) T H = E r o s i o n p o t e n t i a l A F ( x ,   y ) T H E r o s i o n p o t e n t i a l M C .
The potential wind erosion inside the agroforestry system for the maximum wind speed, E r o s i o n p o t e n t i a l A F M A X ( x ,   y ) T H , was also calculated by Equation (6), using respectively u A F M A X ( i ,   x ,   y ) T H . Likewise, E r o s i o n f r a c M A X ( x ,   y ) T H was calculated by dividing
E r o s i o n p o t e n t i a l A F M A X ( x ,   y ) T H by E r o s i o n p o t e n t i a l M C M A X .

3. Results

3.1. Overall Reduction of Wind Speed and Potential Wind Erosion inside the Alley Cropping System

The wind speed inside the AF system is reduced by on average 46.3 to 52.7%. Figure 6 illustrates that the wind speed reduction is a function of the distance between the tree strips. Shorter distances between tree strips lead to higher and more stable reduction. The tree height has only a small effect as the average reduction increases slightly with increasing tree height, from 46.3% for 2 m to 51.6% and 52.7% for 5 and 8 m tall tree strips, respectively (Table 2). The standard deviation, hence the spatial variation in wind speed inside the agroforestry system, increases slightly with tree height from 12.5% (2 m) to 13.2% (8 m).
Figure 7 illustrates the strong potential wind erosion reduction inside the AF system by on average 82.3 to 85.6%. The reduction of potential wind erosion for 2 m tall tree strips is 82.3% and increases slightly for 5 and 8 m tall trees to 85.6% and 85.2%, respectively (Table 2). In contrast to the wind speed, the standard deviation of the fractional potential wind erosion slightly reduces with tree height, from 15.7% (2 m) to 14.5 and 14.8% (5 and 8 m), indicating that the potential wind erosion reduction becomes more stable with increasing tree height (Table 2). The changes of potential wind erosion reduction with height are smaller compared to the changes of wind speed reduction with height, most likely due to the non-linear relation as visualized in Figure 3.
Increased risks ( E r o s i o n f r a c > 100 %) for potential wind erosion are located at the western and southern side and at the northwest corner of the agroforestry system (Figure 7), especially when the wind comes from the southwest and the distance in between the tree strips increases.

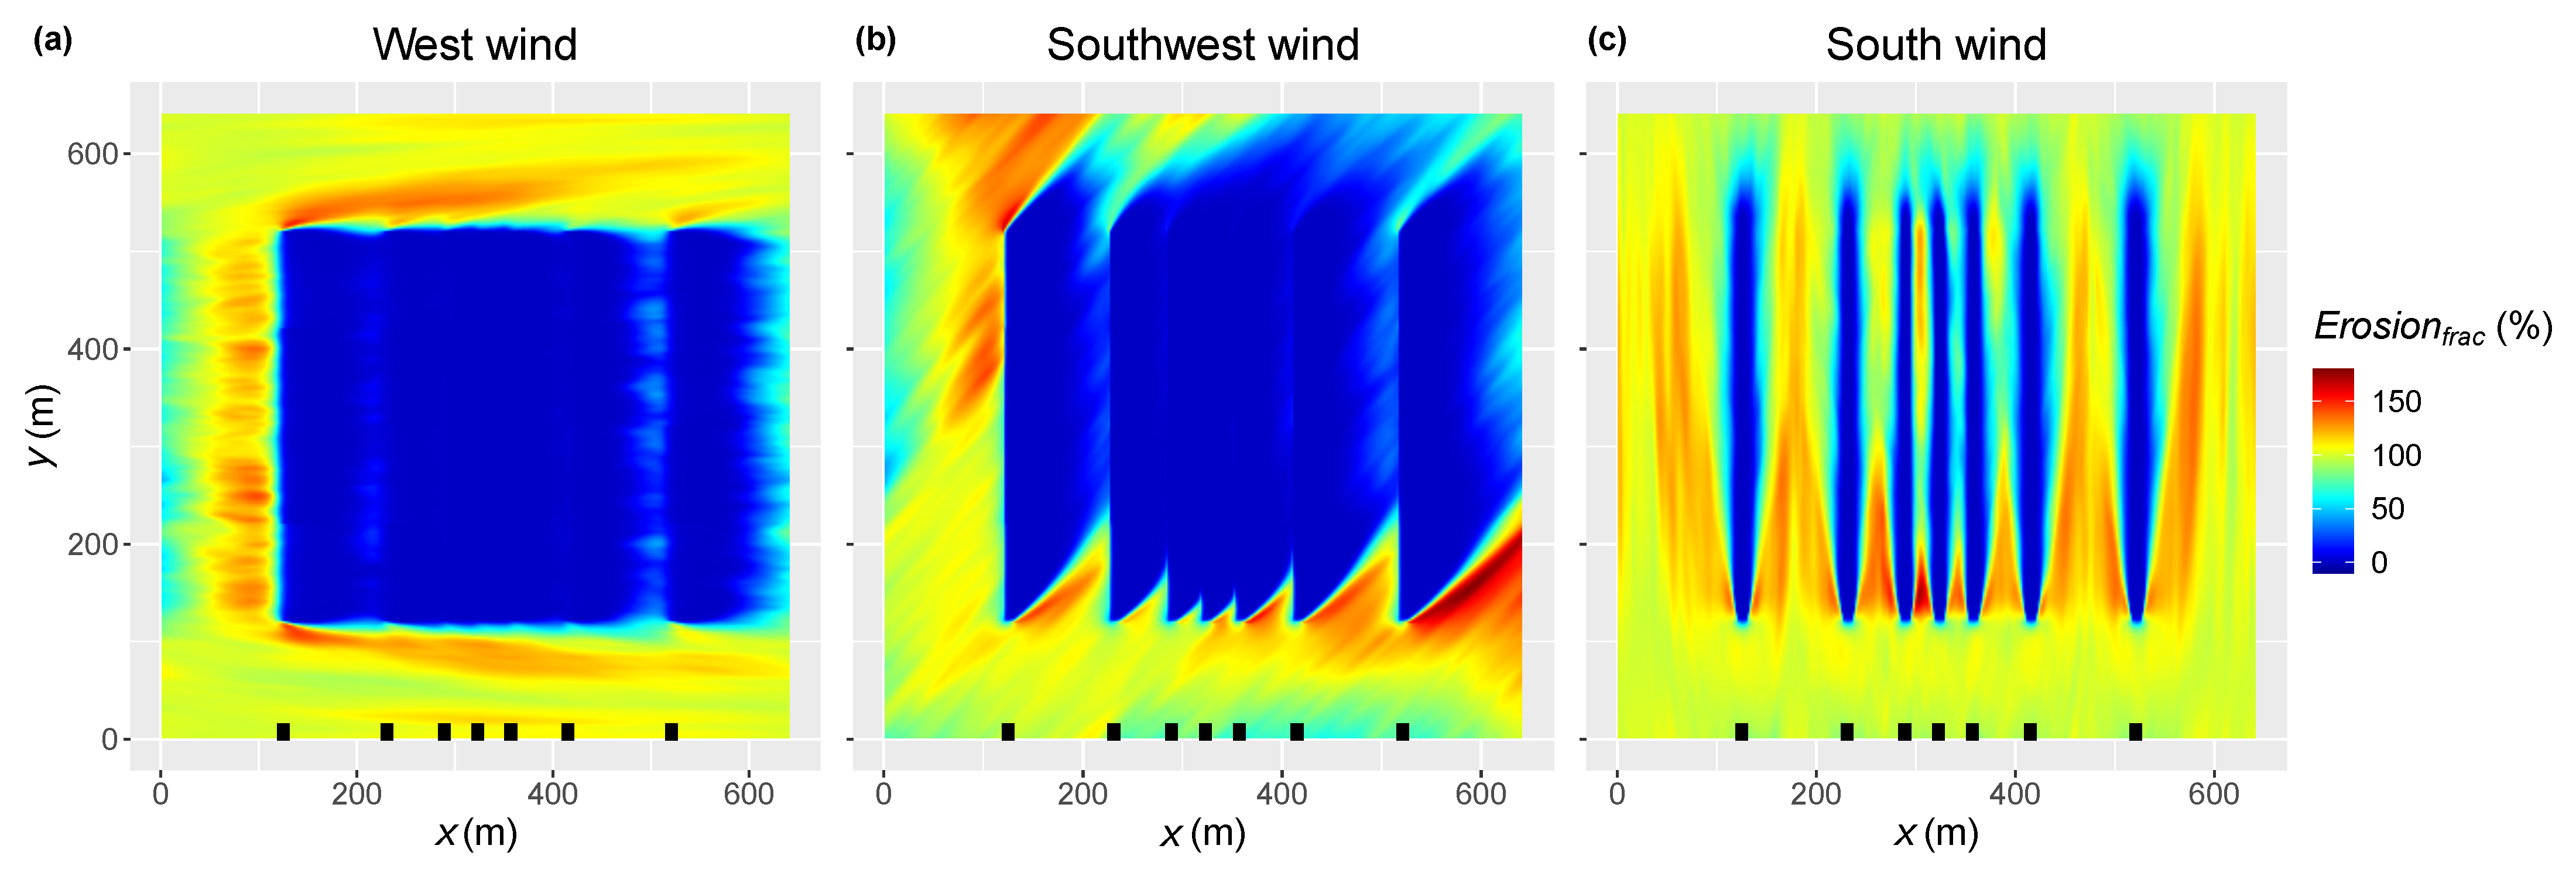
3.2. Effect of Wind Direction on Wind Speed and Potential Wind Erosion

The wind direction relative to the longitudinal orientation of the tree strips has a strong influence on the fractional wind erosion (Figure 8). The strongest reduction in wind speed and potential wind erosion was found for westerly and easterly wind directions perpendicular to the tree strips, with a wind speed reduction between 54–64% and a potential wind erosion reduction between 93–97%, respectively (Table 3). The lowest potential wind erosion reduction was observed for southerly and northerly winds, parallel to the tree strips, reducing the wind speed between 17–20% and potential wind erosion between 24–35% (Table 3). For wind directions diagonal to the tree strips the wind speed was reduced between 51–57% and the potential wind erosion was reduced by around 87% (Table 3).
The spatial standard deviation for the wind speed changes only slightly with height, less than 1.6%, and shows different patterns depending on the tree strip orientation (Table 3). The standard deviation for potential wind erosion indicates two patterns, first, for west wind conditions the standard deviation reduces with tree height, from 12.7% (2 m) to 8.5 and 8.6% (5 and 8 m), indicating the reduction becomes more stable with tree height. Second, for southwest wind conditions the standard deviation increases only slightly with tree height, from 30.3% (2 m) to 30.6 and 32.5% (5 and 8 m), due to partly sheltering conditions. Thirdly, for south wind conditions the standard deviation increases from 46.7% (2 m) to 47.1 and 51.6% (5 and 8 m). This indicates that with larger tree height the channeling effect and turbulent conditions between the tree strips increase.
There are areas with increased risk for potential wind erosion ( E r o s i o n f r a c > 100 %), as the air flow deviates and accelerates around the tree strips. The location of the increased risk for potential wind erosion depends on the wind direction. For the west and southwesterly winds these areas are mostly outside the agroforestry system and occur at the edges (west, south and north) and corners (northwest and southeast) (Figure 8).
Tree strips designed parallel to the dominant wind direction (southerly or northerly winds) can increase the risk of potential wind erosion, because the wind speed can be increased in between the tree strips due to channeling of the wind. Especially when the distance between the tree strips is larger than ≈48 m, this can locally result in an E r o s i o n f r a c > 100 % (Figure 8). The high standard deviation also indicates that E r o s i o n f r a c was frequently above 100% for south wind conditions (Table 3).

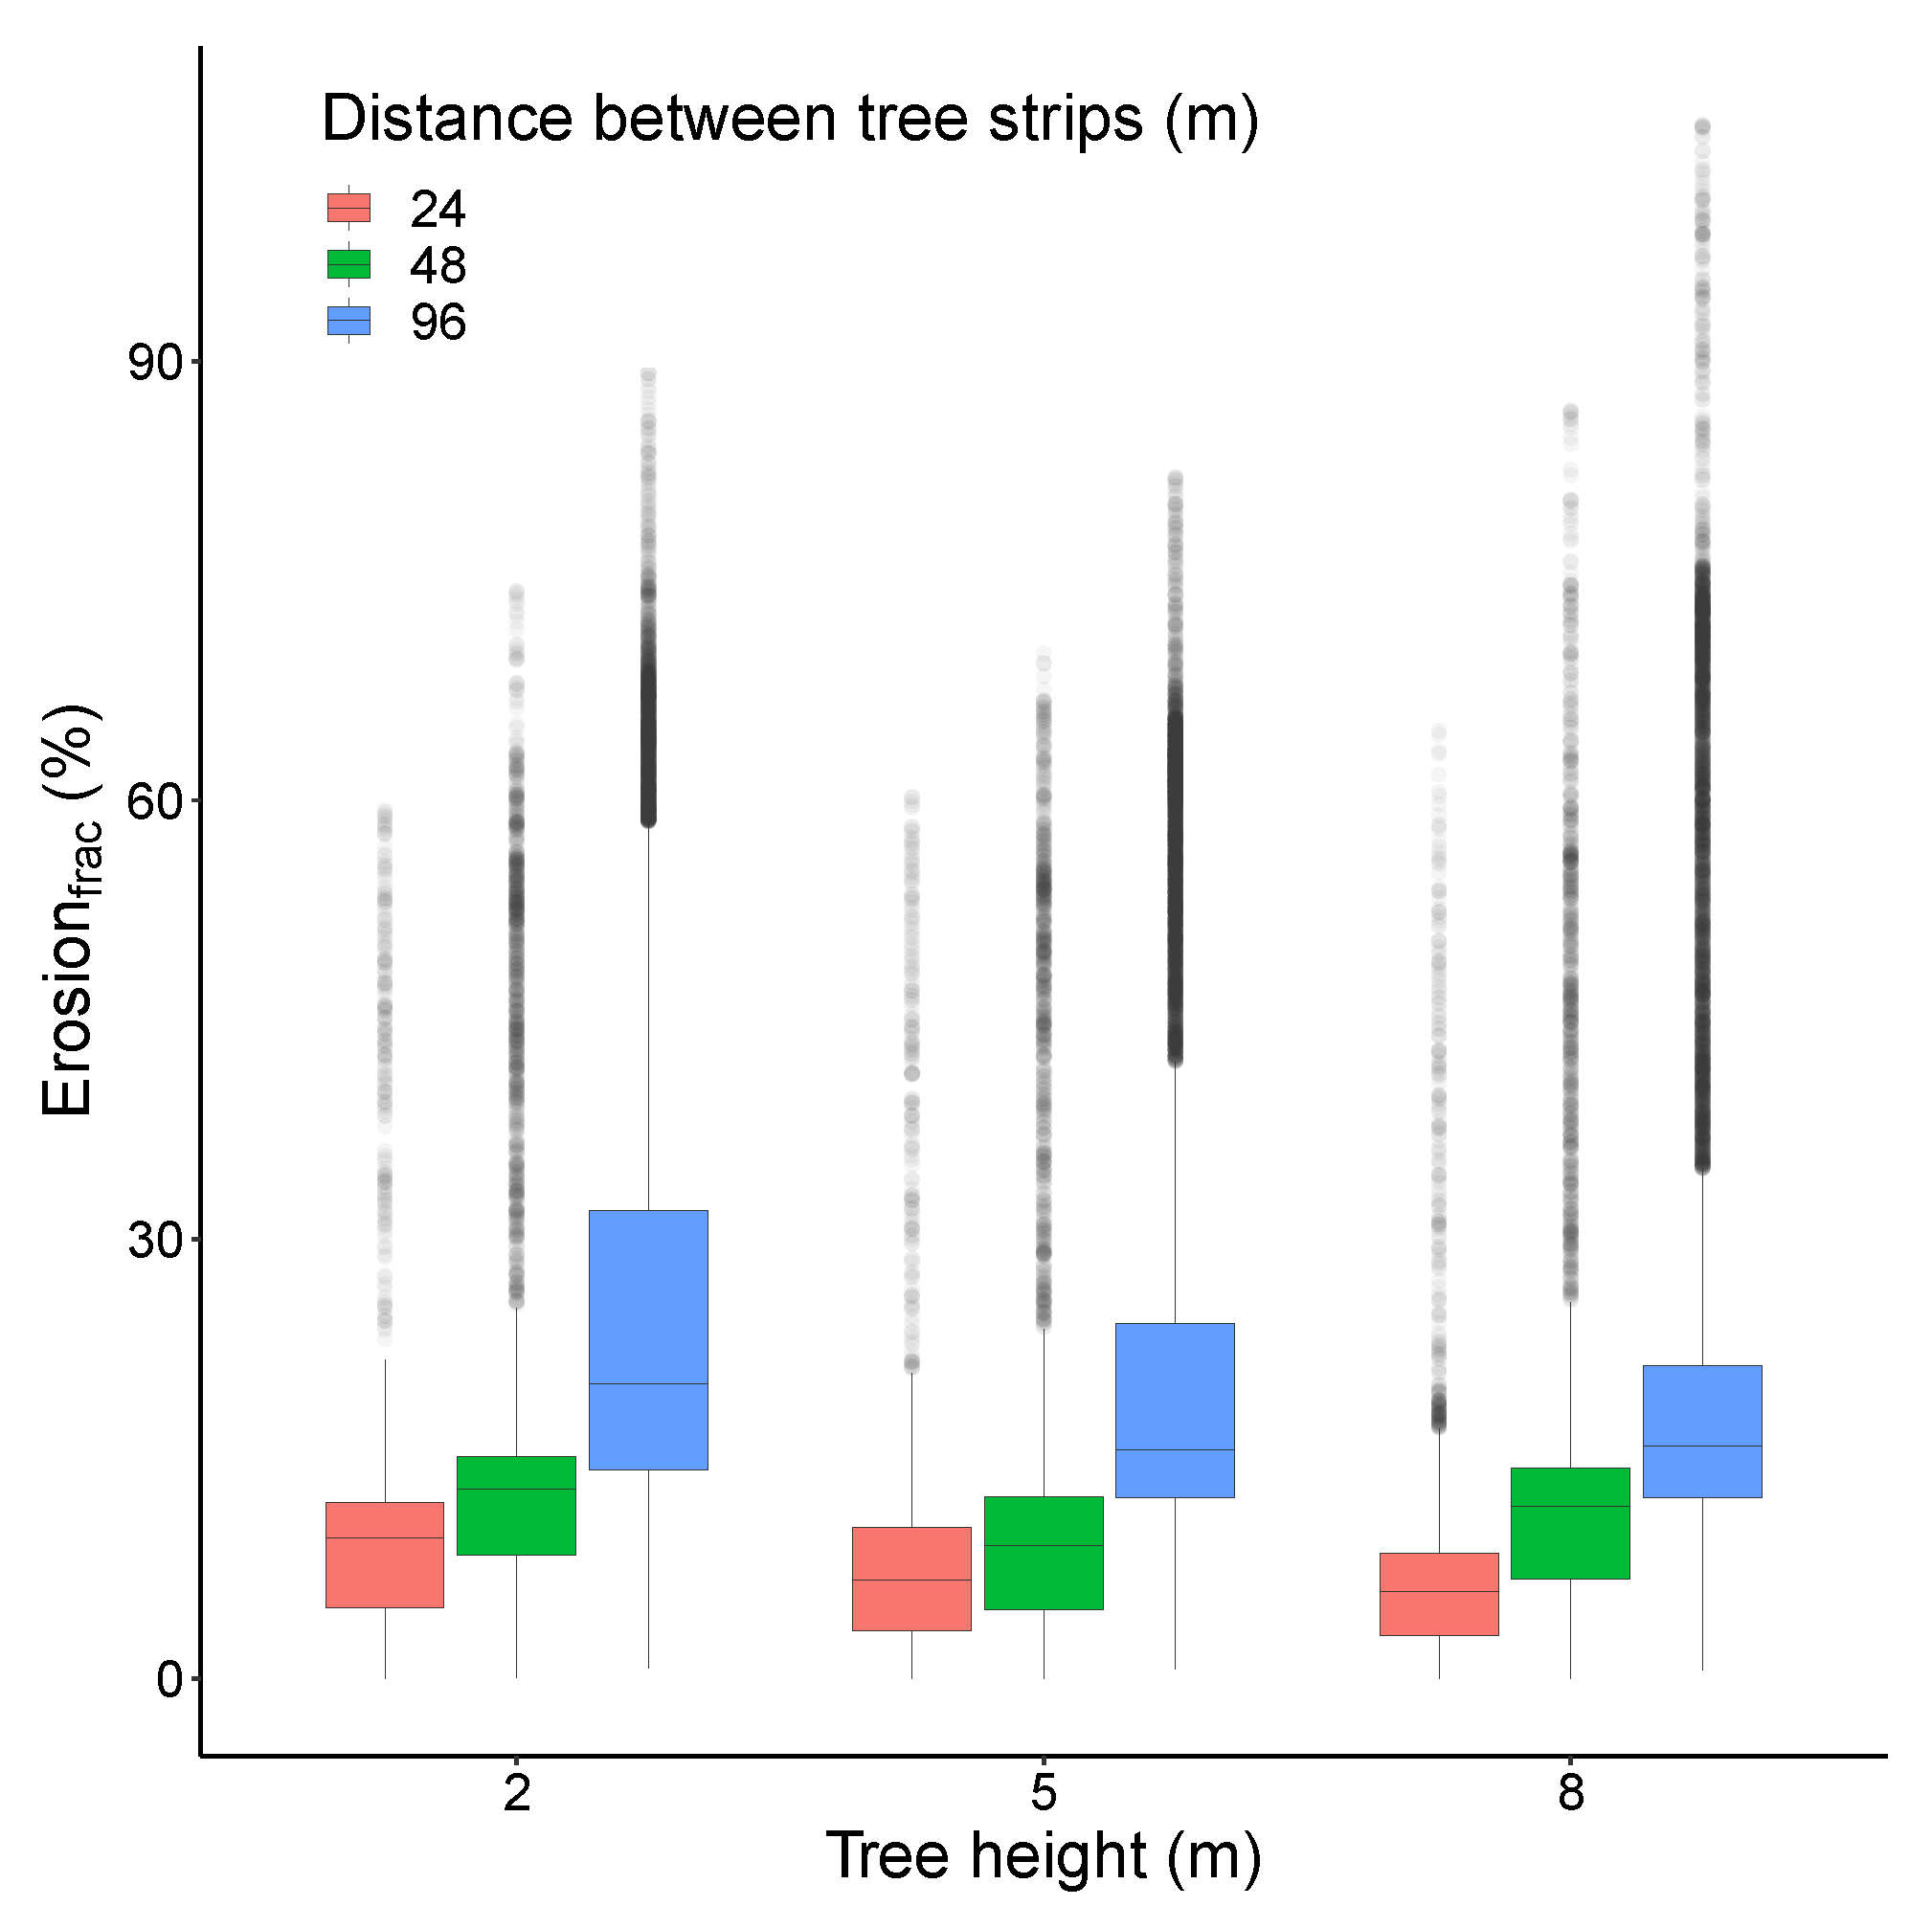
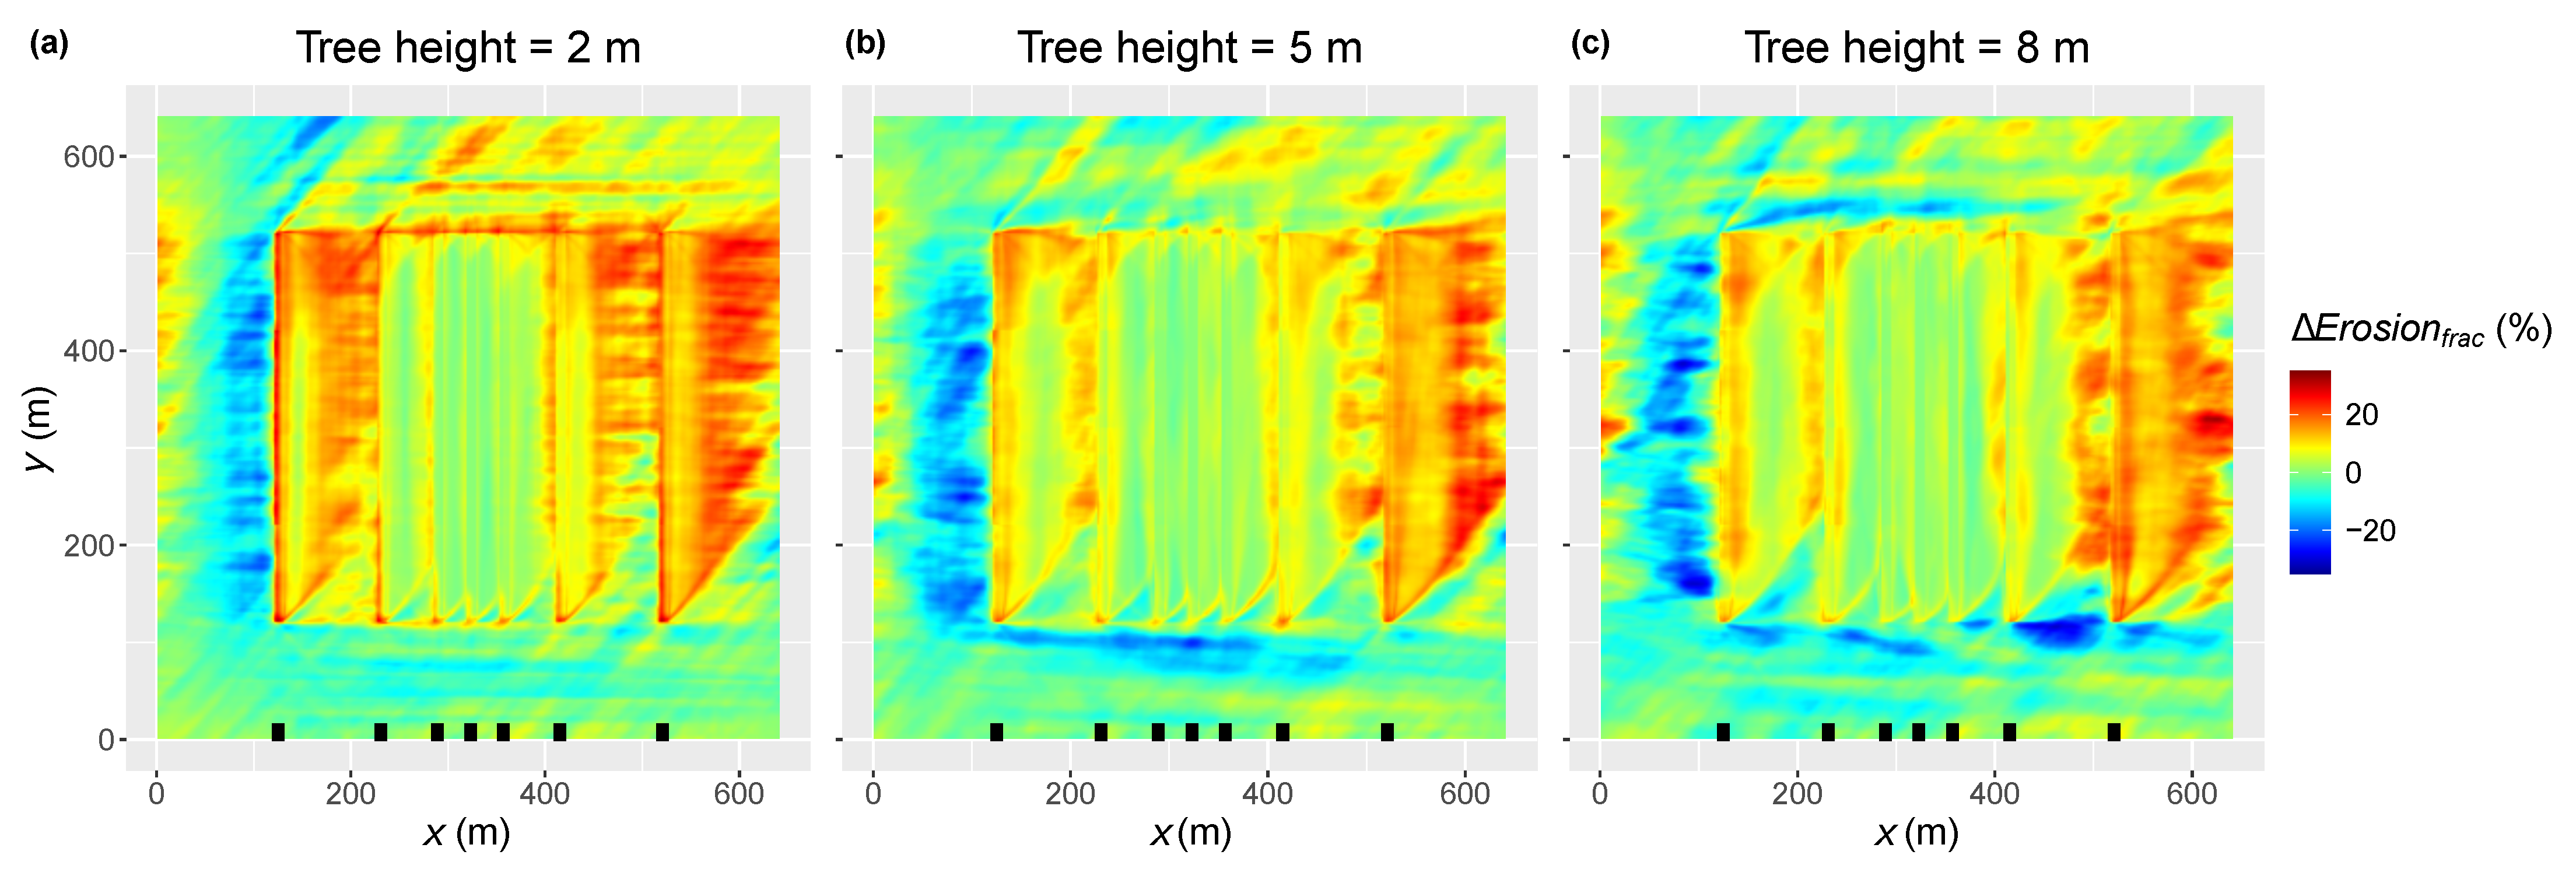
3.3. Effect of Tree Height and Distance between Tree Strips on Wind Speed and Potential Wind Erosion

The distance between the tree strips has a larger effect on the potential wind erosion than the tree height. A distance between the tree strips of 24 m results in an additional reduction of the wind speed between 23–26% and potential wind erosion between 13–16% compared to a distance between the tree strips of 96 m (Table 4). On the other hand, the reduction of wind speed and potential wind erosion only increases slightly with increasing tree height, resulting in an additional reduction of wind speed between 4–8% and potential wind erosion between 2–5% (Table 4).
Taller and closer placed tree strips provide the highest and most stable protection against potential wind erosion. For 8 m tall tree strips and 24 m distance between the tree strips the protection against wind erosion increased, as E r o s i o n f r a c ¯ decreased by 18%, compared to the 2 m tall trees and 96 m distance between the tree strips (Table 4). The standard deviation for 8 m tall trees and 24 m distance between tree strips is 8.6% lower compared to the standard deviation of 2 m tall trees and 96 m distance between tree strips (Table 4). Similarly, the interquartile range of E r o s i o n f r a c becomes lower with increasing tree height and less distance between tree strips, indicating that the reduction in potential wind erosion becomes more stable with height and less distance (Figure 9).
Nevertheless, short tree strips of 2 m height can provide strong protection when the tree strips are planted with a 24 m distance, reducing the wind speed by 63 ± 6%, and the potential wind erosion by 91 ± 8% (Table 4). In contrast, tall tree strips of 8 m height can provide reasonable protection when the tree strips are planted with 96 m distance, respectively reducing the wind speed by 44 ± 9%, and the potential wind erosion by 80 ± 16%.

3.4. Effect of Tree Strip Density on Potential Wind Erosion

The density difference between the denser Poplar trees compared to the more porous Black Locust trees results in small differences of ≤1.5 % for the fractional potential wind erosion when the tree strips are placed with a 24 or 48 m distance (Figure 10). Tree strips placed with a distance of 96 m resulted in a difference of maximum 6–8% between the two tree species. The highest difference for each tree height occurs before the last tree strip in respect with the west wind conditions (Figure 10).
The results suggest that the tree height and distance between the tree strips have a larger impact on the potential wind erosion than the difference between these two tree strip densities. For 24 m distance between the tree strips E r o s i o n f r a c is close to zero and increases to 16–39% for a 96 m distance. The peak of E r o s i o n f r a c decreases with an increase in tree height, from 39% for 2 m tall tree strips to 28% and 16% for 5 and 8 m tall tree strips, respectively.

3.5. Effect of Wind Speed Magnitude on Wind Speed Reduction and Potential Wind Erosion

The wind speed inside the agroforestry system relative to the open field, u f r a c , for the maximum wind speed (6.5 m s 1 ) is between 0.6 and 2.4% higher than for the mean wind speed (2.5 m s 1 ). This increase in mean u f r a c led to an increase in E r o s i o n f r a c between 5.1 to 8.0% (Table 5).
Even though the wind speed reduction is similar, the generally higher wind speeds result in a larger magnitude of absolute potential wind erosion, as the energy magnitude for potential wind erosion increases with the cube of wind speed. At the open field the absolute potential wind erosion for the maximum wind speed is 12.2 times higher compared to the mean wind speed.
Taller tree strips resulted in a lower increase in E r o s i o n f r a c compared to short tree strips, with an increase in E r o s i o n f r a c from 5.6% (5 m) and 5.1% (8 m) compared to 8% (2 m) (Table 5). For all tree heights a shorter distance between the tree strips provided better protection against higher wind speeds, with an increase in E r o s i o n f r a c of 1.6–2.7% (24 m), 3.2–5.0% (48 m) and 6.6–11.0% (96 m) (Figure 11).
In general, outside and at a distance from the agroforestry system no big differences in E r o s i o n f r a c were observed due to an increase in initial wind speed, as indicated by the difference between the fractional potential wind erosion for mean and maximum wind speed, Δ E r o s i o n f r a c (Figure 11). This was expected as E r o s i o n f r a c should be ≈100% for open field conditions independent of the wind speed. For most of the area outside the agroforestry system this was the case, however negative values (dark blue colors) were visible especially west and south of the agroforestry system (Figure 11). The high negative Δ E r o s i o n f r a c areas were artifacts related to the periodic boundary conditions of the LES model, meaning that the wind field at the end boundaries is fed to the starting boundaries of the LES model. Due to the dominant west-southwest wind conditions this results in the visible “wave” pattern, with an increase on the east side after the tree strips were passed and a reduction on the west side before the tree strips (Figure 11). This effect becomes more prevalent with taller tree strips as these create increased turbulent conditions compared to lower tree strips.

4. Discussion

4.1. Design Parameters of a Tree Strip in an Alley Cropping System

Tree strips can be effective at reducing the wind speed on their lee side when well-designed [12,18,19]. Therefore we discuss the key design parameters, as listed in the introduction, based on the findings of our model simulation results.
The orientation of the tree strips relative to the local wind direction is a very important design parameter for wind speed reduction and wind erosion protection [12,13,69]. Our model simulations show that tree strips arranged perpendicular to the prevailing wind direction provide the best protection. The smaller the angle between the tree strips and the wind direction, the more regions within the agroforestry system become exposed to potential wind erosion (Figure 8). This is in agreement with the study of Wang and Takle (1996a) [69], who have shown that the magnitude of the wind speed reduction and the shelter distance decrease when the angle between the tree strips and the wind direction changes from 90 (perpendicular) to 0 (parallel). Furthermore, when the tree strips are orientated parallel to the wind direction, wind erosion inside the agroforestry system could be increased due to channeling of the wind in between the tree strips [13,70,71].
Shorter distances between the tree strips resulted in a stronger reduction of the wind speed and consequently potential wind erosion, as also shown by [13,26]. Additionally, we observed a lower standard deviation of both wind speed and potential wind erosion, which indicates that the wind erosion reduction in a 24 or 48 m wide crop alley is more stable than within a 96 m wide crop alley (Table 4). This is in line with Böhm et al. (2014) [13] who recommended to have a distance between the tree strips of less than 50 m. These results show that a distance between tree strips of less than 48 m leads to a generally observed quiet zone, which extends over 2-8 times the tree height, depending on atmospheric conditions and wind direction [17,19,21].
The effect of the tree height seems to be smaller compared to the effect of distance between the tree strips according to our results (Table 4). Low tree strips with a height of 2 m caused already a strong reduction in wind speed and potential wind erosion, when the tree strips were oriented perpendicular to the prevailing wind direction and a distance of ≤48 m between the tree strips was maintained, as was also found by [13,67]. The only slight increase with tree height is probably due to the very dense and multiple row structure of the alley cropping system, which in general leads to a strong reduction of the wind speed behind the tree strips [12,72,73].
Compared to other parameters, such as the distance between tree strips, the tree height or tree orientation, the tree density of two different species had a low impact on the wind speed and potential wind erosion. This does not mean that the density of the tree strips in general is not important, the density, structure and crown shape of the trees strongly influence the effectiveness of the wind speed reduction and the shape of the quiet zone [19,23,74,75]. Therefore the planting scheme and the selection of suitable tree species is very important [12,73]. Additionally, the time of the year is important, as broad leaved trees have no leaves yet in spring, even though the erosion risks could be high, on the contrary coniferous trees do not shed their leaves [25,76]. In general, dense tree strips can result in an additional 50% reduction of the minimum wind speed behind a tree strip, relative to the reduction of more porous tree strips [12,18]. In the LES model the density of the tree strips was constant with height, which is a strong simplified assumption. The trees acted as a dense wall, which is often the case during summer, when trees are fully covered with leaves. The measured tree density used in the LES model is in the range tested previously by Wang and Takle (1996b) [75].
On average the magnitude of relative wind speed inside the agroforestry system stayed fairly similar for a range of wind speeds, indicated by the ∼1–2% increase of u f r a c for mean and maximum wind speeds (Table 5). Earlier studies confirm that the reduction of the wind speed behind a tree strip is independent of the open field wind speed magnitude, for wind speeds between roughly 5–12 m s 1 [77,78]. For wind speeds less than 5 m s 1 , Zhang et al. (1995) [78] found a stronger reduction of the wind speed, which agrees with the current study. However, the magnitude of this difference is much lower in our study, respectively 1–2% compared to approximately 20 % . The average relative wind erosion is more affected and E r o s i o n f r a c increases with 5.1–8.0% for a wind speed of 6.5 m s 1 compared to 2.5 m s 1 . However, for a distance between the tree strips of ≤48 m the increase in E r o s i o n f r a c is close to zero, compared to an increase of more than 20% for 96 m distance between the tree strips. Furthermore, the area of Δ E r o s i o n f r a c > 20 % decreases with tree height. The better protection with taller trees and shorter distance between the tree strips is most likely related to the size of the quiet zone and reduced turbulence in close proximity of the tree strips [17,19,21].

4.2. Designing and Maintaining an Alley Cropping System

Long term weather stations nearby could provide a local wind climatology and can serve as a first estimate when designing a new alley cropping system for optimal protection against wind erosion. Using this often freely available wind data and for example the methods from Skidmore (1965) [14] or Vigiak et al. (2003) [55], the wind direction with the highest wind erosion risk can be determined. Nevertheless, in some cases local topography (e.g., hill slopes, rivers, roads, field borders) and equal solar shading of the crops (by north-south orientation of the tree strips) are factors to consider as well [55,79]. Our study site is a good example, where without tree strips, 88.7% of the potential wind erosion would occur during west, northwest, northeast, east, southeast and southwest wind conditions. As there is a strong prevailing wind direction, ∼77% would occur during west and southwest wind conditions (Figure 2). During north and south wind conditions 11.3% of the potential wind erosion occurred, whereas three quarters of it occurred during high soil moisture conditions in winter, between the 1st of October and 31st of March. During dry spring and summer conditions, one quarter of the total potential wind erosion for north and south wind conditions could probably not be reduced by the alley cropping agroforestry system. Especially during a dry spring and bare soil conditions or when newly germinated crops are present, there is an increased risk for wind erosion, which could lead to crop damage due to uprooting, grinding and/or covering by sand [3,80,81]. Not only wind erosion is subject to seasonality, crops can also get enhanced stress due to strong dry winds during very cold or hot days. Subsequently, crops maturate earlier which can destabilize the soil and enhance wind erosion.
In addition to the simple design in this study of only parallel tree strips, one could also consider alternative designs to improve the resilience. An easy solution to prevent channeling would be planting a west-east orientated tree strip north and south of the north-south orientated tree strips, with keeping in mind an appropriate distance in between the tree strips for machinery. More circular tree strips would be a possibility as well, however workability of machinery and negative effect due to strong shading north of the tree strips should be taken into account. Additionally, when creating passages for machinery inside a long tree strip carefulness is needed, as this might create a local acceleration of the wind speed inside and around the gap [82]. Moreover, the morphology and density of the tree strips strongly influence the wind speed reduction and the turbulent flow [72,73,74,83]. Therefore, the increased risk of wind erosion at the edges and corners of the alley cropping system could be reduced by creating less abrupt corners of the tree strips, e.g., by slowly decreasing the tree strip height or changing the tree strip density.
Finally, when harvesting alley cropping tree strips, as is frequently carried out for bio-energy purposes, considering rotational or partial harvest could help maintaining almost continuous protection against wind erosion when the distance between the tree strips is not too large [13,84]. As we have shown low 2 m tall tree strips can already provide protection against wind erosion. The overall aim is not to have zero wind speed inside the agroforestry system, the aim is to manage that the wind speed remains below the site dependent critical u t h r e s h o l d , to prevent wind erosion, as frequent as preferred by the landowner [25]. Having too tall trees can even result in unnecessary shading of solar radiation for the adjacent crops, which has a negative influence on the crop yields [85].

4.3. Uncertainties and Limitations of Our Modeled Wind Erosion Estimates

In general, shelterbelts and agroforestry systems are known for their potential to reduce wind erosion, however we are not aware of a study like ours, quantifying the reduction of wind erosion due to alley cropping in combination with an explicit spatial interpretation. Based on model simulations we showed that alley cropping agroforestry systems in a temperate climate can reduce the wind speed by more than 45% and the potential wind erosion by more than 80% when the agroforestry system is well-designed for the local conditions. These findings agree with studies from the past as, Michels et al. (1998) [20] reported that a single shelterbelt of 2 m height reduced the measured wind erosion within ∼10 m distance of the shelterbelt by 47–77% compared to a control plot. Using a similar approach as the current study, Bird et al. (1992) [54] showed that a well-orientated single shelterbelt can reduce the wind speed by 30–50% and potential wind erosion up to 80%. More recently, Borrelli et al. (2021) [86] also indicated that agroforestry systems can reduce soil erosion in general by 92% compared to bare soils.
Including the effect of soil moisture and rainfall would have a positive impact on the absolute reduction of wind erosion [43,64,87], but also on the relative wind erosion, especially because the top soil layer inside the agroforestry system will generally have a higher soil moisture content compared to the open field due to the reduced wind speed in between the tree strips [88]. Estimating the exact spatial difference of the soil moisture and the effect on wind erosion is difficult due to the complex soil moisture dynamics of the top soil layer and the effect of air humidity [65,89]. Nevertheless, compared to completely dry sandy soils, u 🞰 t h r e s h o l d would increase by approximately 50 to 100% when the soil moisture is at field capacity (≈0.1 bar), depending on the particle diameter [90]. The effect of an approximate doubling of u t h r e s h o l d would strengthen the non-linear response between the wind speed and wind erosion, which is visualized in Figure 3. On the other hand, the absolute wind erosion risk - in other words the need for wind speed reduction - would reduce when soil moisture is included. When only wet soils with an u t h r e s h o l d = 5 m s 1 are assumed, 0.7% of our open field wind speed dataset would be above the u t h r e s h o l d , compared to 16.2% for dry soils with an u t h r e s h o l d = 2.7 m s 1 .
Preventing bare soil by cover crops or crop residues can strongly reduce the wind erosion or even completely when the soil cover is higher than 60% [42,43,91]. In such case u t h r e s h o l d would increase to an extend that wind speed reduction becomes unnecessary, as the wind speed in the open field is always below the threshold. Preventing bare soils in combination with agroforestry would create a very robust system against wind erosion [92]. The tree strips can provide protection for periods with bare soil conditions [76] and at the risk areas around or inside the agroforestry system soil cover could reduce risks as well.
In the current study the method of Skidmore and Hagen (1977) [11] is applied as described by Equation (3). This simple method was proposed for investigating potential wind erosion reduction behind single tree strips. More recently, Marsham et al. (2013) [52] proposed a more complex method to estimate the Dust Uplift Potential (DUP) in deserts. Applying the DUP approach would reduce the potential wind erosion at the open field by ∼22%, compared to the estimate using Equation (3). Nevertheless, the average potential wind erosion reduction inside the agroforestry system increases with only ∼2% for all tree heights, compared to the average reductions calculated by the method of Skidmore and Hagen (1977) [11] (Table 2). Due to small differences between the two methods inside the agroforestry system, we decided to stick to the more simple method, which was developed for the application at tree strips.
Estimating wind erosion with half-hourly mean wind speeds could lead to an underestimation of the absolute potential wind erosion by approximately 43–53%, due to smoothing of the gusts [93]. Nevertheless, we have shown that inside the agroforestry system the negative effect on E r o s i o n f r a c will be less, as u f r a c stays roughly similar for a wide range of wind speeds (Section 3.5). E r o s i o n f r a c would on average only increase by 5–8% for gusts based on the half-hourly maximum wind speed, u M C M A X S F C , compared to E r o s i o n f r a c based on the average wind speed, u M C S F C .
The application of periodic boundary conditions in the horizontal domain of the LES model is another point of uncertainty. These conditions lead to reduced wind speeds at the inflow side of the LES domain, as still partly visible at the west edge in Figure 7. As a result, u f r a c and E r o s i o n f r a c are already distorted before the wind field has encountered the first tree strip. The new proposed method from Section 2.6.2 compensates for this issue, leading to an u f r a c and E r o s i o n f r a c close to 100% before the first tree strip. Furthermore, the modeled u f r a c inside the agroforestry system is confirmed by direct wind measurements [26,67]. A different solution could be to create turbulent inflow conditions in the horizontal domain of the LES model. Using this approach requires an increased domain size to allow turbulent eddies to develop before the tree strips in the agroforestry system. This has the disadvantage that the processing time would increase, but the advantage that the ambient conditions could be closer to reality if the adjustment parameters are set properly.

5. Conclusions

Wind erosion is a serious risk for dry and sandy soils and our model simulations for a case study in Germany showed that alley cropping agroforestry systems in a temperate climate can strongly reduce the magnitude of wind erosion by more than 80% when well-designed.
For optimal protection the tree strips should be orientated perpendicular to the dominant wind direction, or at least diagonal. A distance of ≤48 m between tree strips provides a strong and constant reduction of wind speed and potential wind erosion. Dense tree strips of 2 m height can already provide protection when the distance between the tree strips is ≤48 m and the orientation in respect to the dominant wind direction is optimized. Taller tree heights can provide an increased and more stable reduction for wind directions perpendicular to the tree strips. For higher wind speeds, soils are also protected against wind erosion, especially when the distance between the tree strips is ≤48 m.
By designing the alley cropping agroforestry system to local conditions, optimal prevention against wind erosion can be created. Nevertheless, local topography and other aspects such as shading of solar radiation by trees need to be taken into account when optimizing the overall performance of the agroforestry system.

Author Contributions

J.G.V.v.R.: contributed to designing—and discussions of—the methods, performed the main wind erosion data analysis and wrote the manuscript. L.S.: contributed to method discussions, wind measurements during fieldwork and the combined LES and measurements approach, data analysis and writing of the paper. Co-wrote the project scientific proposal and acquired the funding as part of the BonaRes SIGNAL consortium. M.B.: Contributed to method discussions, data analysis and writing of the paper. F.E.M.: Contributed to method discussions, data analysis and writing of the paper. A.K.: Contributed to method discussions, data analysis and writing of the paper. Co-wrote the project scientific proposal and acquired the funding as part of the BonaRes SIGNAL consortium. C.M.: Collected the wind measurements during fieldwork, provided and analyzed the LES data and contributed to the method discussions and writing of the paper. Co-wrote the project scientific proposal and acquired the funding as part of the BonaRes SIGNAL consortium. All authors have read and agreed to the published version of the manuscript.

Funding

This research has been supported by the German Federal Ministry of Education and Research (BMBF; project BonaRes, Modul A: SIGNAL; grant no: 031B0510A). We also acknowledge the support by the Open Access Publication Funds of the University of Göttingen.

Institutional Review Board Statement

Not applicable.

Informed Consent Statement

Not applicable.

Data Availability Statement

The data used in this study are available on request.

Acknowledgments

The authors are thankful for the soil data provided by Marcus Schmidt and the fruitful discussions with colleagues at the Bioclimatology group; we also acknowledge the technical support through field work received from Frank Tiedemann, Edgar Tunsch, Dietmar Fellert, Martin Lindenberg, Johann Peters (Bioclimatology group), and Dirk Böttger (Soil Science group of Tropical and Subtropical Ecosystems) from the University of Göttingen.

Conflicts of Interest

The authors declare no conflict of interest.

References

  1. Chepil, W.; Woodruff, N. The Physics of Wind Erosion and its Control. Adv. Agron. 1963, 15, 211–302. [Google Scholar] [CrossRef]
  2. Skidmore, E.L. Wind erosion control. Clim. Change 1986, 9, 209–218. [Google Scholar] [CrossRef]
  3. Riksen, M.J.; De Graaff, J. On-site and off-site effects of wind erosion on European light soils. Land Degrad. Dev. 2001, 12, 1–11. [Google Scholar] [CrossRef]
  4. Borrelli, P.; Ballabio, C.; Panagos, P.; Montanarella, L. Wind erosion susceptibility of European soils. Geoderma 2014, 232–234, 471–478. [Google Scholar] [CrossRef]
  5. Godfray, H.C.J.; Beddington, J.R.; Crute, I.R.; Haddad, L.; Lawrence, D.; Muir, J.F.; Pretty, J.; Robinson, S.; Thomas, S.M.; Toulmin, C. Food Security: The Challenge of Feeding 9 Billion People. Science 2010, 327, 812–818. [Google Scholar] [CrossRef] [Green Version]
  6. IPCC. Summary for policymakers. In Climate Change 2021: The Physical Science Basis. Contribution of Working Group I to the Sixth Assessment Report of the Intergovernmental Panel on Climate Change; Masson-Delmotte, V., Zhai, P., Pirani, A., Connors, S.L., Péan, C., Berger, S., Caud, N., Chen, Y., Goldfarb, L., Gomis, M.I., et al., Eds.; Cambridge University Press: Cambridge, UK; New York, NY, USA, 2021; pp. 3–32. [Google Scholar] [CrossRef]
  7. Garrity, D. Agroforestry and the achievement of the Millennium Development Goals. Agrofor. Syst. 2004, 61-62, 5–17. [Google Scholar] [CrossRef]
  8. Wilson, M.H.; Lovell, S.T. Agroforestry—The next step in sustainable and resilient agriculture. Sustainability 2016, 8, 574. [Google Scholar] [CrossRef] [Green Version]
  9. Skidmore, E.L. Wind erosion climatic erosivity. Clim. Chang. 1986, 9, 195–208. [Google Scholar] [CrossRef]
  10. Lee, J.J.; Phillips, D.L.; Dodson, R.F. Sensitivity of the US corn belt to climate change and elevated CO2: II. Soil erosion and organic carbon. Agric. Syst. 1996, 52, 503–521. [Google Scholar] [CrossRef]
  11. Skidmore, E.L.; Hagen, L.J. Reducing Wind Erosion with Barriers. Trans. ASAE 1977, 20, 0911–0915. [Google Scholar] [CrossRef] [Green Version]
  12. Brandle, J.; Hodges, L.; Zhou, X. Windbreaks in North American agricultural systems. Agrofor. Syst. 2004, 61–62, 65–78. [Google Scholar] [CrossRef]
  13. Böhm, C.; Kanzler, M.; Freese, D. Wind speed reductions as influenced by woody hedgerows grown for biomass in short rotation alley cropping systems in Germany. Agrofor. Syst. 2014, 88, 579–591. [Google Scholar] [CrossRef]
  14. Skidmore, E.L. Assessing Wind Erosion Forces: Directions and Relative Magnitudes. Soil Sci. Soc. Am. J. 1965, 29, 587. [Google Scholar] [CrossRef]
  15. Hagen, L.J. Windbreak Design for Optimum Wind Erosion Control. Publ. Great Plains Agric. Counc. 1976, 78, 31–36. [Google Scholar]
  16. Stoeckeler, J. Shelterbelt Influence on Great Plains Field Environment and Crops: A Guide for Determining Design and Orientation; Technical report; USDA: Washington, DC, USA, 1962. [Google Scholar]
  17. McNaughton, K. 1. Effects of windbreaks on turbulent transport and microclimate. Agric. Ecosyst. Environ. 1988, 22–23, 17–39. [Google Scholar] [CrossRef]
  18. Nord, M. Shelter effects of vegetation belts—Results of field measurements. Bound.-Layer Meteorol. 1991, 54, 363–385. [Google Scholar] [CrossRef]
  19. Cleugh, H.A. Effects of windbreaks on airflow, microclimates and crop yields. Agrofor. Syst. 1998, 41, 55–84. [Google Scholar] [CrossRef]
  20. Michels, K.; Lamers, J.P.A.; Buerkert, A. Effects of windbreak species and mulching on wind erosion and millet yield in the Sahel. Exp. Agric. 1998, 34, 449–464. [Google Scholar] [CrossRef] [Green Version]
  21. McAneney, K.J.; Judd, M.J. Multiple windbreaks: An aeolean ensemble. Bound.-Layer Meteorol. 1991, 54, 129–146. [Google Scholar] [CrossRef]
  22. Judd, M.J.; Raupach, M.R.; Finnigan, J.J. A wind tunnel study of turbulent flow around single and multiple windbreaks, part I: Velocity fields. Bound.-Layer Meteorol. 1996, 80, 127–165. [Google Scholar] [CrossRef]
  23. Frank, C.; Ruck, B. Double-arranged mound-mounted shelterbelts: Influence of porosity on wind reduction between the shelters. Environ. Fluid Mech. 2005, 5, 267–292. [Google Scholar] [CrossRef]
  24. Wolz, K.J.; Lovell, S.T.; Branham, B.E.; Eddy, W.C.; Keeley, K.; Revord, R.S.; Wander, M.M.; Yang, W.H.; DeLucia, E.H. Frontiers in alley cropping: Transformative solutions for temperate agriculture. Glob. Change Biol. 2018, 24, 883–894. [Google Scholar] [CrossRef] [PubMed] [Green Version]
  25. Garrett, H.E.; Wolz, K.J.; Walter, W.D.; Godsey, L.D.; McGraw, R.L. Alley Cropping Practices. In North American Agroforestry; Wiley: Hoboken, NJ, USA, 2021; Chapter 7; pp. 163–204. [Google Scholar] [CrossRef]
  26. Markwitz, C. Micrometeorological measurements and numerical simulations of turbulence and evapotranspiration over agroforestry. Ph.D Thesis, Georg-August-University Göttingen, Göttingen, Germany, 2021. [Google Scholar] [CrossRef]
  27. Smith, J.; Pearce, B.D.; Wolfe, M.S. A European perspective for developing modern multifunctional agroforestry systems for sustainable intensification. Renew. Agric. Food Syst. 2012, 27, 323–332. [Google Scholar] [CrossRef]
  28. Schoeneberger, M.; Bentrup, G.; de Gooijer, H.; Soolanayakanahally, R.; Sauer, T.; Brandle, J.; Zhou, X.; Current, D. Branching out: Agroforestry as a climate change mitigation and adaptation tool for agriculture. J. Soil Water Conserv. 2012, 67, 128A–136A. [Google Scholar] [CrossRef] [Green Version]
  29. Cardinael, R.; Cadisch, G.; Gosme, M.; Oelbermann, M.; van Noordwijk, M. Climate change mitigation and adaptation in agriculture: Why agroforestry should be part of the solution. Agric. Ecosyst. Environ. 2021, 319, 107555. [Google Scholar] [CrossRef]
  30. Montagnini, F.; Nair, P. Carbon sequestration: An underexploited environmental benefit of agroforestry systems. Agrofor. Syst. 2004, 61–62, 281–295. [Google Scholar] [CrossRef]
  31. Schoeneberger, M.M. Agroforestry: Working trees for sequestering carbon on agricultural lands. Agrofor. Syst. 2009, 75, 27–37. [Google Scholar] [CrossRef] [Green Version]
  32. Jose, S. Agroforestry for ecosystem services and environmental benefits: An overview. Agrofor. Syst. 2009, 76, 1–10. [Google Scholar] [CrossRef]
  33. Torralba, M.; Fagerholm, N.; Burgess, P.J.; Moreno, G.; Plieninger, T. Do European agroforestry systems enhance biodiversity and ecosystem services? A meta-analysis. Agric. Ecosyst. Environ. 2016, 230, 150–161. [Google Scholar] [CrossRef] [Green Version]
  34. Beule, L.; Karlovsky, P. Tree rows in temperate agroforestry croplands alter the composition of soil bacterial communities. PLoS ONE 2021, 16, e0246919. [Google Scholar] [CrossRef]
  35. Smith, J.; Pearce, B.D.; Wolfe, M.S. Reconciling productivity with protection of the environment: Is temperate agroforestry the answer? Renew. Agric. Food Syst. 2013, 28, 80–92. [Google Scholar] [CrossRef]
  36. Nerlich, K.; Graeff-Hönninger, S.; Claupein, W. Agroforestry in Europe: A review of the disappearance of traditional systems and development of modern agroforestry practices, with emphasis on experiences in Germany. Agrofor. Syst. 2013, 87, 475–492. [Google Scholar] [CrossRef]
  37. van Ramshorst, J.G.V.; Coenders-Gerrits, M.; Schilperoort, B.; van de Wiel, B.J.H.; Izett, J.G.; Selker, J.S.; Higgins, C.W.; Savenije, H.H.G.; van de Giesen, N.C. Revisiting wind speed measurements using actively heated fiber optics: A wind tunnel study. Atmos. Meas. Tech. 2020, 13, 5423–5439. [Google Scholar] [CrossRef]
  38. Jähn, M.; Knoth, O.; König, M.; Vogelsberg, U. ASAM v2.7: A compressible atmospheric model with a Cartesian cut cell approach. Geosci. Model Dev. 2015, 8, 317–340. [Google Scholar] [CrossRef] [Green Version]
  39. Schmidt, M.; Corre, M.D.; Kim, B.; Morley, J.; Göbel, L.; Sharma, A.S.I.; Setriuc, S.; Veldkamp, E. Nutrient saturation of crop monocultures and agroforestry indicated by nutrient response efficiency. Nutr. Cycl. Agroecosyst. 2021, 119, 69–82. [Google Scholar] [CrossRef]
  40. Markwitz, C.; Knohl, A.; Siebicke, L. Evapotranspiration over agroforestry sites in Germany. Biogeosciences 2020, 17, 5183–5208. [Google Scholar] [CrossRef]
  41. Fryrear, D.W.; Stout, J.E.; Hagen, L.J.; Vories, E.D. Wind Erosion: Field Measurement and Analysis. Trans. ASAE 1991, 34, 0155. [Google Scholar] [CrossRef]
  42. Funk, R.; Engel, W. Investigations with a field wind tunnel to estimate the wind erosion risk of row crops. Soil Tillage Res. 2015, 145, 224–232. [Google Scholar] [CrossRef]
  43. Zobeck, T.M.; Van Pelt, R.S. Wind Erosion. In Soil Management: Building a Stable Base for Agriculture; Number January; Soil Science Society of America: Madison, WI, USA, 2015; pp. 209–227. [Google Scholar] [CrossRef]
  44. Priestley, C. Turbulent Transfer in the Lower Atmosphere; Chicago University Press: Chicago, IL, USA, 1959; p. 130. [Google Scholar]
  45. Optis, M.; Monahan, A.; Bosveld, F.C. Moving Beyond Monin–Obukhov Similarity Theory in Modelling Wind-Speed Profiles in the Lower Atmospheric Boundary Layer under Stable Stratification. Bound.-Layer Meteorol. 2014, 153, 497–514. [Google Scholar] [CrossRef]
  46. Stull, R.B. (Ed.) An Introduction to Boundary Layer Meteorology; Springer: Dordrecht, The Netherlands, 1988. [Google Scholar] [CrossRef]
  47. Högström, U.; Hunt, J.C.R.; Smedman, A.S. Theory and Measurements for Turbulence Spectra and Variances in the Atmospheric Neutral Surface Layer. Bound.-Layer Meteorol. 2002, 103, 101–124. [Google Scholar] [CrossRef]
  48. Foken, T. 50 Years of the Monin–Obukhov Similarity Theory. Bound.-Layer Meteorol. 2006, 119, 431–447. [Google Scholar] [CrossRef]
  49. Marticorena, B.; Bergametti, G. Modeling the atmospheric dust cycle: 1. Design of a soil-derived dust emission scheme. J. Geophys. Res. 1995, 100, 16415. [Google Scholar] [CrossRef] [Green Version]
  50. Potter, K.N.; Williams, J.R.; Larney, F.J.; Bullock, M.S. Evaluation of EPIC’s wind erosion submodel using data from southern Alberta. Can. J. Soil Sci. 1998, 78, 485–492. [Google Scholar] [CrossRef]
  51. Jarrah, M.; Mayel, S.; Tatarko, J.; Funk, R.; Kuka, K. A review of wind erosion models: Data requirements, processes, and validity. CATENA 2020, 187, 104388. [Google Scholar] [CrossRef]
  52. Marsham, J.H.; Hobby, M.; Allen, C.J.T.; Banks, J.R.; Bart, M.; Brooks, B.J.; Cavazos-Guerra, C.; Engelstaedter, S.; Gascoyne, M.; Lima, A.R.; et al. Meteorology and dust in the central Sahara: Observations from Fennec supersite-1 during the June 2011 Intensive Observation Period. J. Geophys. Res. Atmos. 2013, 118, 4069–4089. [Google Scholar] [CrossRef]
  53. Stroosnijder, L. Measurement of erosion: Is it possible? CATENA 2005, 64, 162–173. [Google Scholar] [CrossRef]
  54. Bird, P.R.; Bicknell, D.; Bulman, P.A.; Burke, S.J.A.; Leys, J.F.; Parker, J.N.; Van Der Sommen, F.J.; Voller, P. The role of shelter in Australia for protecting soils, plants and livestock. Agrofor. Syst. 1992, 20, 59–86. [Google Scholar] [CrossRef]
  55. Vigiak, O.; Sterk, G.; Warren, A.; Hagen, L.J. Spatial modeling of wind speed around windbreaks. CATENA 2003, 52, 273–288. [Google Scholar] [CrossRef]
  56. Gillette, D.A. Threshold friction velocities for dust production for agricultural soils. J. Geophys. Res. 1988, 93, 12645. [Google Scholar] [CrossRef] [Green Version]
  57. Thom, A.S. Momentum absorption by vegetation. Q. J. R. Meteorol. Soc. 1971, 97, 414–428. [Google Scholar] [CrossRef]
  58. Jacobs, A.F.; Van Boxel, J.H. Changes of the displacement height and roughness length of maize during a growing season. Agric. For. Meteorol. 1988, 42, 53–62. [Google Scholar] [CrossRef]
  59. Carter, M.; Gregorich, E. Soil Sampling and Methods of Analysis; CRC Press: Boca Raton, FL, USA, 2007. [Google Scholar] [CrossRef]
  60. Gillette, D.A.; Passi, R. Modeling dust emission caused by wind erosion. J. Geophys. Res. 1988, 93, 14233. [Google Scholar] [CrossRef] [Green Version]
  61. Langdale, G.W.; Blevins, R.L.; Karlen, D.L.; Mccool, D.K.; Nearing, M.A.; Skidmore, E.L.; Thomas, A.W.; Tyler, D.D.; Williams, J.R. Cover crop effects on soil erosion by wind and water. Cover Crops for Clean Water; Soil and Water Conservation Society: Ankeny, IA, USA, 1991; pp. 15–22. [Google Scholar]
  62. Wolfe, S.A.; Nickling, W.G. The protective role of sparse vegetation in wind erosion. Prog. Phys. Geogr. 1993, 17, 50–68. [Google Scholar] [CrossRef]
  63. Goossens, D.; Gross, J.; Spaan, W. Aeolian dust dynamics in agricultural land areas in Lower Saxony, Germany. Earth Surf. Process. Landforms 2001, 26, 701–720. [Google Scholar] [CrossRef]
  64. Chepil, W.S. Influence of Moisture on Erodibility of Soil by Wind. Soil Sci. Soc. Am. J. 1956, 20, 288–292. [Google Scholar] [CrossRef]
  65. McKenna Neuman, C.; Sanderson, S. Humidity control of particle emissions in aeolian systems. J. Geophys. Res. 2008, 113, F02S14. [Google Scholar] [CrossRef] [Green Version]
  66. Jähn, M.; Muñoz-Esparza, D.; Chouza, F.; Reitebuch, O.; Knoth, O.; Haarig, M.; Ansmann, A. Investigations of boundary layer structure, cloud characteristics and vertical mixing of aerosols at Barbados with large eddy simulations. Atmos. Chem. Phys. 2016, 16, 651–674. [Google Scholar] [CrossRef] [Green Version]
  67. Kanzler, M.; Böhm, C.; Mirck, J.; Schmitt, D.; Veste, M. Microclimate effects on evaporation and winter wheat (Triticum aestivum L.) yield within a temperate agroforestry system. Agrofor. Syst. 2019, 93, 1821–1841. [Google Scholar] [CrossRef]
  68. Veste, M.; Malaga Linares, R.A.; Seserman, D.M.; Freese, D.; Schmitt, D.; Wachendorf, M.; Küppers, M. Simulation of annual leaf carbon fluxes and analysis of stand structure of poplars and black locusts in an alley-cropping system, Brandenburg, Germany. In Proceedings of the 4th European Agroforestry Conference Agroforestry as Sustainable Land Use, Nijmegen, The Netherlands, 28–30 May 2018; EURAF & University of Santiago de Compostela: Lugo, Spain, 2018; pp. 488–492. [Google Scholar]
  69. Wang, H.; Takle, E.S. On shelter efficiency of shelterbelts in oblique wind. Agric. For. Meteorol. 1996, 81, 95–117. [Google Scholar] [CrossRef]
  70. Bowker, G.E.; Gillette, D.A.; Bergametti, G.; Marticorena, B. Modeling Flow Patterns in a Small Vegetated Area in the Northern Chihuahuan Desert using QUIC (Quick Urban & Industrial Complex). Environ. Fluid Mech. 2006, 6, 359–384. [Google Scholar] [CrossRef]
  71. Bowker, G.E.; Gillette, D.A.; Bergametti, G.; Marticorena, B.; Heist, D.K. Sand Flux Simulations at a Small Scale over a Heterogeneous Mesquite Area of the Northern Chihuahuan Desert. J. Appl. Meteorol. Climatol. 2007, 46, 1410–1422. [Google Scholar] [CrossRef]
  72. Dupont, S.; Bergametti, G.; Simoëns, S. Modeling aeolian erosion in presence of vegetation. J. Geophys. Res. Earth Surf. 2014, 119, 168–187. [Google Scholar] [CrossRef] [Green Version]
  73. Vacek, Z.; Řeháček, D.; Cukor, J.; Vacek, S.; Khel, T.; Sharma, R.P.; Kučera, J.; Král, J.; Papaj, V. Windbreak Efficiency in Agricultural Landscape of the Central Europe: Multiple Approaches to Wind Erosion Control. Environ. Manag. 2018, 62, 942–954. [Google Scholar] [CrossRef]
  74. Loeffler, A.E.; Gordon, A.M.; Gillespie, T.J. Optical porosity and windspeed reduction by coniferous windbreaks in Southern Ontario. Agrofor. Syst. 1992, 17, 119–133. [Google Scholar] [CrossRef]
  75. Wang, H.; Takle, E.S. On three-dimensionality of shelterbelt structure and its influences on shelter effects. Bound.-Layer Meteorol. 1996, 79, 83–105. [Google Scholar] [CrossRef]
  76. Řeháček, D.; Khel, T.; Kučera, J.; Vopravil, J.; Petera, M. Effect of windbreaks on wind speed reduction and soil protection against wind erosion. Soil Water Res. 2017, 12, 128–135. [Google Scholar] [CrossRef] [Green Version]
  77. Rollin, E. The influence of wind speed and direction on the reduction of wind speed leeward of a medium porous hedge. Agric. Meteorol. 1983, 30, 25–34. [Google Scholar] [CrossRef]
  78. Zhang, H.; Brandle, J.R.; Meyer, G.E.; Hodges, L. The relationship between open windspeed and windspeed reduction in shelter. Agrofor. Syst. 1995, 32, 297–311. [Google Scholar] [CrossRef]
  79. Trentacoste, E.R.; Connor, D.J.; Gómez-del Campo, M. Row orientation: Applications to productivity and design of hedgerows in horticultural and olive orchards. Sci. Hortic. 2015, 187, 15–29. [Google Scholar] [CrossRef]
  80. Cleugh, H.A.; Miller, J.M.; Böhm, M. Direct mechanical effects of wind on crops. Agrofor. Syst. 1998, 41, 85–112. [Google Scholar] [CrossRef]
  81. Sterk, G. Causes, consequences and control of wind erosion in Sahelian Africa: A review. Land Degrad. Dev. 2003, 14, 95–108. [Google Scholar] [CrossRef]
  82. Oteng’i, S.B.; Stigter, C.J.; Ng’ang’a, J.K.; Mungai, D.N. Wind protection in a hedged agroforestry system in semiarid Kenya. Agrofor. Syst. 2000, 50, 137–156. [Google Scholar] [CrossRef]
  83. Mayaud, J.; Webb, N. Vegetation in Drylands: Effects on Wind Flow and Aeolian Sediment Transport. Land 2017, 6, 64. [Google Scholar] [CrossRef] [Green Version]
  84. Bagley, W.T. 33. Agroforestry and windbreaks. Agric. Ecosyst. Environ. 1988, 22–23, 583–591. [Google Scholar] [CrossRef]
  85. Swieter, A.; Langhof, M.; Lamerre, J. Competition, stress and benefits: Trees and crops in the transition zone of a temperate short rotation alley cropping agroforestry system. J. Agron. Crop Sci. 2022, 208, 209–224. [Google Scholar] [CrossRef]
  86. Borrelli, P.; Alewell, C.; Alvarez, P.; Anache, J.A.A.; Baartman, J.; Ballabio, C.; Bezak, N.; Biddoccu, M.; Cerdà, A.; Chalise, D.; et al. Soil erosion modelling: A global review and statistical analysis. Sci. Total Environ. 2021, 780, 146494. [Google Scholar] [CrossRef]
  87. Bergametti, G.; Rajot, J.L.; Pierre, C.; Bouet, C.; Marticorena, B. How long does precipitation inhibit wind erosion in the Sahel? Geophys. Res. Lett. 2016, 43, 6643–6649. [Google Scholar] [CrossRef] [Green Version]
  88. Lal, R. Agroforestry systems and soil surface management of a tropical alfisol: I: Soil moisture and crop yields. Agrofor. Syst. 1989, 8, 7–29. [Google Scholar] [CrossRef]
  89. Durar, A.A.; Steiner, J.L.; Evett, S.R.; Skidmore, E.L. Measured and Simulated Surface Soil Drying. Agron. J. 1995, 87, 235–244. [Google Scholar] [CrossRef]
  90. McKenna-Neuman, C.; Nickling, W.G. A theoretical and wind tunnel investigation of the effect of capillary water on the entrainment of sediment by wind. Can. J. Soil Sci. 1989, 69, 79–96. [Google Scholar] [CrossRef]
  91. Pi, H.; Webb, N.P.; Huggins, D.R.; Sharratt, B. Critical standing crop residue amounts for wind erosion control in the inland Pacific Northwest, USA. CATENA 2020, 195, 104742. [Google Scholar] [CrossRef]
  92. Tibke, G. 5. Basic principles of wind erosion control. Agric. Ecosyst. Environ. 1988, 22–23, 103–122. [Google Scholar] [CrossRef]
  93. Guo, Z.; Zobeck, T.M.; Stout, J.E.; Zhang, K. The effect of wind averaging time on wind erosivity estimation. Earth Surf. Process. Landforms 2012, 37, 797–802. [Google Scholar] [CrossRef]
Figure 1. (a) The Forst monoculture tower west of the tree strips. Photo facing in north-west direction, with open field for hundreds of meters and bare soil after harvest (Photo by Justus van Ramshorst). (b) Satellite image from the agroforestry site, with a yellow star indicating the Forst monoculture tower (Google Earth, © Google 2021).
Sustainability 14 13372 g001
Figure 2. Wind rose for average half-hourly wind speeds (u) at 3.5 m height from the monoculture site for eight wind direction classes ( ). The grey circles indicate steps of about 3.3% of the dataset.
Sustainability 14 13372 g002
Figure 3. Wind erosion relative to open field, E r o s i o n f r a c (%), versus wind speed relative to open field, u f r a c (%), based on the estimated wind speed measurements at our site at 0.5 m height. The non-linear response is shown for u t h r e s h o l d = 5.0 m s 1 , u t h r e s h o l d = 2.7 m s 1 and u t h r e s h o l d = 0 m s 1 (no threshold). Wind erosion decreases faster than wind speed. The dotted line of u t h r e s h o l d = 5.0 m s 1 is less smooth due to the limited amount of wind speed data where u > 5 m s 1 at 0.5 m height.
Sustainability 14 13372 g003
Figure 4. Schematized workflow to calculate the wind speed and potential wind erosion at the monoculture site and inside the agroforestry system. The fractional wind speed relative to the open field (Figure 6), u f r a c (%), is dependent on the wind direction (WD) and the tree height (TH). The measured wind speed, u M C , is used to estimate the wind speed at 0.5 m above the surface, u M C S F C . Based on the wind speed measurements and the Large Eddy Simulations (LES) by [26] the potential wind erosion at the monoculture (MC) site and the fractional potential wind erosion (Figure 7), E r o s i o n f r a c (%), at the agroforestry (AF) site are calculated.
Sustainability 14 13372 g004
Figure 5. The model domain of the LES model, simulating an agroforestry system (indicated by the blue dash-dotted line). The agroforestry system is surrounded by open field (monoculture), which is used as a reference. The size of each pixel (position) is 2 × 2 × 1 m ( x ,   y ,   z ) and the dimension of the model is 320 × 320 × 50 pixels, which equals 640 × 640 × 50 m. The two different tree species have a tree strip density of 0.14 m 2 m 3 (Poplar) and 0.2 m 2 m 3 (Black Locust). This figure is based on Markwitz (2021) [26].
Sustainability 14 13372 g005
Figure 6. Average wind speed relative to the open field, u f r a c (%), for tree heights of 2 m (a), 5 m (b) and 8 m (c) at a domain height of 0.5 m. The black squares at the bottom indicate the location of the tree strips inside the agroforestry system, as shown in Figure 5.
Sustainability 14 13372 g006
Figure 7. Average potential wind erosion relative to the open field, E r o s i o n f r a c (%), for tree heights of 2 m (a), 5 m (b) and 8 m (c) at a domain height of 0.5 m. The black squares at the bottom indicate the location of the tree strips inside the agroforestry system, as shown in Figure 5.
Sustainability 14 13372 g007
Figure 8. Average potential wind erosion relative to the open field, E r o s i o n f r a c (%), for a tree height of 5 m and three different wind directions, west (a), southwest (b) and south (c). The black squares at the bottom indicate the location of the tree strips inside the agroforestry system, as shown in Figure 5.
Sustainability 14 13372 g008
Figure 9. Boxplot of average potential wind erosion relative to the open field, E r o s i o n f r a c (%), for tree heights of 2, 5 and 8 m, and distances between tree strips of 24, 48 and 96 m. For calculating the boxplot the respective areas with a distance of 24, 48 and 96 m between the tree strips inside the agroforestry system were extracted (as defined in Figure 5). The vertical range of the boxes in the boxplot indicates the range between the minimum (1st quartile − 1.5 × interquartile range) and maximum (3rd quartile + 1.5 × interquartile range) of the boxplot.
Sustainability 14 13372 g009
Figure 10. Average potential wind erosion relative to the open field, E r o s i o n f r a c (%), for west wind conditions, for tree heights of 2 m (a), 5 m (b) and 8 m (c), and for two different tree strip densities (0.14 m 2 m 3 for Poplar and 0.2 m 2 m 3 for Black Locust). For each pixel inside the agroforestry system (x in Figure 5), E r o s i o n f r a c was averaged over y(420:520 m) for Poplar and over y(320:420 m) for Black Locust. The vertical green bars indicate the locations of the tree strips.
Sustainability 14 13372 g010
Figure 11. The difference in average potential wind erosion relative to the open field, E r o s i o n f r a c (%), calculated for two initial wind speeds of 2.5 and 6.5 m s 1 , Δ E r o s i o n f r a c = E r o s i o n f r a c M A X E r o s i o n f r a c M E A N . The differences are calculated for an agroforestry system with tree heights of 2 m (a), 5 m (b) and 8 m (c). The black squares at the bottom indicate the location of the tree strips inside the agroforestry system, as shown in Figure 5.
Sustainability 14 13372 g011
Table 1. Site characteristics at Forst (Lower Lusatia). * Böhm et al. (2014) [13], ** Markwitz (2021) [26], *** current study.
ItemDescription
Slope *Flat
Landscape *Intensively used (open) agricultural landscape
Trees species *Black locust (Robinia pseudoacacia L.) and
Poplar (Populus nigra L. × P. maximowiczii
Henry)
Planting layout *Double row
Width of tree strips *10 m
Long-term average temperature **9.6 C
Average annual precipitation **568 mm
Köppen index ***Temperate continental climate
Average mean wind speed ***2.31 m s 1
Average maximum wind speed ***5.01 m s 1
Table 2. Average wind speed inside the agroforestry system relative to the open field, u f r a c (%), ±1 sd and potential wind erosion inside the agroforestry system relative to the open field, E r o s i o n f r a c (%), ±1 sd inside the agroforestry system (as indicated by the blue dash-dotted line in Figure 5) for tree heights of 2 m, 5 m and 8 m. The average reduction of the wind speed and potential wind erosion is expressed as 100 u f r a c ¯ (%) and 100 E r o s i o n f r a c ¯ , respectively.
Tree Height (m)258
u f r a c ¯ (%)53.7 ± 12.548.4 ± 12.747.3 ± 13.2
100 u f r a c ¯ (%)46.3 ± 12.551.6 ± 12.752.7 ± 13.2
E r o s i o n f r a c ¯ (%)17.7 ± 15.714.4 ± 14.514.8 ± 14.8
100 E r o s i o n f r a c ¯ (%)82.3 ± 15.785.6 ± 14.585.2 ± 14.8
Table 3. Average wind speed inside the agroforestry system relative to the open field, u f r a c (%), and potential wind erosion inside the agroforestry system relative to the open field, E r o s i o n f r a c (%), ±1 sd inside the agroforestry system (as indicated by the blue dash-dotted line in Figure 5) for three wind directions (west, southwest and south) and three tree heights (2, 5 and 8 m). The average reduction of the wind speed and potential wind erosion is expressed as 100 u f r a c ¯ and 100 E r o s i o n f r a c ¯ , respectively.
Tree Height (m)258
West wind
u f r a c ¯ (%)46.1 ± 18.338.7 ± 18.036.4 ± 18.3
100 u f r a c ¯ (%)53.9 ± 18.361.3 ± 18.063.6 ± 18.3
Southwest wind
u f r a c ¯ (%)48.7 ± 24.244.4 ± 25.643.5 ± 25.8
100 u f r a c ¯ (%)51.3 ± 24.255.6 ± 25.656.5 ± 25.8
South wind
u f r a c ¯ (%)83.1 ± 32.079.8 ± 31.081.3 ± 30.9
100 u f r a c ¯ (%)16.9 ± 32.020.2 ± 31.018.7 ± 30.9
West wind
E r o s i o n f r a c ¯ (%)7.2 ± 12.73.8 ± 8.53.3 ± 8.6
100 E r o s i o n f r a c ¯ (%)92.8 ± 12.796.2 ± 8.596.7 ± 8.6
Southwest wind
E r o s i o n f r a c ¯ (%)14.0 ± 30.313.0 ± 30.612.9 ± 32.5
100 E r o s i o n f r a c ¯ (%)86.0 ± 30.387.0 ± 30.687.1 ± 32.5
South wind
E r o s i o n f r a c ¯ (%)76.2 ± 46.765.2 ± 47.169.8 ± 51.6
100 E r o s i o n f r a c ¯ (%)23.8 ± 46.734.8 ± 47.130.2 ± 51.6
Table 4. Average wind speed inside the agroforestry system relative to the open field, u f r a c (%), and potential wind erosion relative to the open field, E r o s i o n f r a c (%), ±1 sd for tree heights of 2, 5 and 8 m and distances between tree strips of 24, 48 and 96 m. Averages are representative for the respective areas with a distance of 24, 48 and 96 m between the tree strips inside the agroforestry system (as indicated by the blue dash-dotted line in Figure 5). The average reduction of the wind speed and potential wind erosion is expressed as 100 u f r a c ¯ and 100 E r o s i o n f r a c ¯ , respectively.
Tree Height (m)258
24 m distance between tree strips
u f r a c ¯ (%)37.4 ± 5.933.2 ± 6.733.5 ± 6.9
100 u f r a c ¯ (%)62.6 ± 5.966.8 ± 6.766.5 ± 6.9
48 m distance between tree strips
u f r a c ¯ (%)48.7 ± 6.142.2 ± 7.541.8 ± 7.9
100 u f r a c ¯ (%)51.3 ± 6.157.8 ± 7.558.2 ± 7.9
96 m distance between tree strips
u f r a c ¯ (%)63.5 ± 6.457.7 ± 7.056.0 ± 9.0
100 u f r a c ¯ (%)36.5 ± 6.442.3 ± 7.044.0 ± 9.0
24 m distance between tree strips
E r o s i o n f r a c ¯ (%)9.3 ± 7.97.9 ± 7.87.1 ± 7.5
100 E r o s i o n f r a c ¯ (%)90.7 ± 7.992.1 ± 7.892.9 ± 7.5
48 m distance between tree strips
E r o s i o n f r a c ¯ (%)13.6 ± 10.810.6 ± 10.612.7 ± 11.2
100 E r o s i o n f r a c ¯ (%)86.4 ± 10.889.4 ± 10.687.3 ± 11.2
96 m distance between tree strips
E r o s i o n f r a c ¯ (%)25.3 ± 16.120.7 ± 15.520.4 ± 16.3
100 E r o s i o n f r a c ¯ (%)74.7 ± 16.179.3 ± 15.579.6 ± 16.3
Table 5. Average wind speed inside the agroforestry system relative to the open field, u f r a c (%), and potential wind erosion relative to the open field, E r o s i o n f r a c (%), ±1 sd inside the agroforestry system (as indicated by the blue dash-dotted line in Figure 5) for 2.5 and 6.5 m s 1 mean and maximum wind speed at the site. The average reduction of the wind speed and potential wind erosion is expressed as 100 u f r a c ¯ and 100 E r o s i o n f r a c ¯ , respectively.
Tree Height (m)258
Initial wind speed of 2.5 m s 1
u f r a c ¯ (%)53.7 ± 12.548.4 ± 12.747.3 ± 13.2
100 u f r a c ¯ (%)46.3 ± 12.551.6 ± 12.752.7 ± 13.2
Initial wind speed of 6.5 m s 1
u f r a c M A X ¯ (%)56.1 ± 13.449.0 ± 13.248.1 ± 13.0
100 u f r a c M A X ¯ (%)43.9 ± 13.451.0 ± 13.251.9 ± 13.0
Initial wind speed of 2.5 m s 1
E r o s i o n f r a c ¯ (%)17.7 ± 15.714.4 ± 14.514.8 ± 14.8
100 E r o s i o n f r a c ¯ (%)82.3 ± 15.785.6 ± 14.585.2 ± 14.8
Initial wind speed of 6.5 m s 1
E r o s i o n f r a c M A X ¯ (%)25.7 ± 13.920.0 ± 14.519.9 ± 13.9
100 E r o s i o n f r a c M A X ¯ (%)74.3 ± 13.980.0 ± 14.580.1 ± 13.9
Publisher’s Note: MDPI stays neutral with regard to jurisdictional claims in published maps and institutional affiliations.

