Article

Feasibility of using Waste Brine/Seawater and Sea Sand for the Production of Concrete: An Experimental Investigation from Mechanical Properties and Durability Perspectives

1
College of Civil Engineering, Tongji University, Shanghai 200092, China
2
College of Transportation and Civil Engineering, Fujian Agriculture and Forestry University, Fuzhou 350108, China
3
School of Materials Science and Engineering, Tongji University, Shanghai 200092, China
*
Authors to whom correspondence should be addressed.
Sustainability 2022, 14(20), 13340; https://doi.org/10.3390/su142013340
Submission received: 10 September 2022 / Revised: 10 October 2022 / Accepted: 11 October 2022 / Published: 17 October 2022

Abstract

:
The anti-corrosion property of fiber reinforced polymer (FRP) makes the concrete produced with marine wastes (waste brine after desalination) and resources (seawater and sea sand) a promising green structural material which can be a sustainable solution to fresh water and river sand scarcity in marine and offshore construction. To evaluate the feasibility of using waste and marine resources in concrete, this study investigated the mechanical properties and durability of brine-sea sand concrete (BSC) and seawater-sea sand concrete (SSC) with three different water-to-cement ratios and compared them to the corresponding ordinary concrete (OC). The results demonstrated that the increased salinity had a minor effect on the 28-day compressive strength, but a significant effect on the large-size capillary pore structure. The semi-quantitative analysis of the concrete phase based on the X-ray diffraction (XRD) and thermogravimetric analysis (TGA) revealed that BSC and SSC had larger mass fractions of the amorphous phase (mainly C-S-H), ettringite and gypsum during hydration. At last, the comprehensive performance of three different concrete mixtures was evaluated by five indexes (workability, alkali environment, compressive strength, carbonization resistance, and sulfate resistance). The results show that it is feasible to use brine/seawater and sea sand to replace freshwater and river sand for marine structural concrete reinforced with FRP.

1. Introduction

Desalination plants worldwide are mainly located near the coastline due to the scarcity of freshwater resources, especially in the Middle East and North Africa region (Figure 1). These existing facilities were designed to produce desalinated water for the municipal and industrial sectors [1]. During the last decade, the total desalination capacity has increased from 4.6 million m3/d to 99.8 million m3/d [2]. It is estimated that by 2050, the supply of desalination will increase to 192 million m3/d [3]. Although the desalination process has improved significantly in recent decades, the highest ratio of the obtained freshwater is 50%. In other words, a large amount of waste brine was produced during desalination. The statistics in 2018 showed that the global production of brine reached 51.7 billion m3/year [1]. However, in most cases, the brine was directly discharged into the oceans [4,5], which created an inhospitable environment for cells of those marine organisms due to excessive osmotic pressure induced by high salinity [6]. Further, on a larger scale, the marine ecological environment was adversely impacted [7,8]. As a result, the industry is seeking solutions to recycle brine for the sake of sustainable social development and ecological protection.
On the other hand, concrete construction has consumed a large amount of freshwater and river sands worldwide. Concrete production is responsible for consuming about one-fifth of global industrial water consumption and 75% of the water demand for concrete production will occur in regions that suffer from water stress [9]. Meanwhile, the total demand for global sands and gravels has increased by three times in the past 20 years [10]. However, in islands and coastal areas where fresh water and river sand are scarce, there are a large number of desalination plants or at least abundant marine resources (seawater and sea sand) which makes the production of concrete from desalinated waste brine/seawater and sea sand instead of fresh water and river sand a potential application for alleviating the scarcity of natural resources, reducing the transportation cost of raw materials [11] and solving the problem of the impossibility to effectively treat waste brine.
The direct use of seawater in concrete could date back to the ancient Romans. Concrete structures adjacent to the ports consisted of lime, zeolitic tuff, pumiceous volcanic ash, and seawater, and have remained intact despite being immersed in seawater for 2000 years [12]. The mechanical properties of modern seawater and/or sea-sand concrete (SSC) consisting of seawater, sea sand, cement, and coarse aggregate is different from that of the ancient Romans’ due to the different hydration mechanisms and products consisting raw materials. In terms of the performance of fresh concrete, SSC had a faster setting time due to the acceleration of hydration induced by chlorides compared with ordinary concrete (OC) [13]. The results from Yang et al. [14] and Safi et al. [15] demonstrated that the workability of concrete decreased with the increasing seashell content and attributed the reduction in the fluidity of fresh concrete to the irregular shape of seashell particles. In terms of mechanical properties, most researchers have agreed that SSC had a higher early-age compressive strength compared to OC [16,17,18]. The 28-day and long-term compressive strengths of SSC were close to that of OC [19]. In terms of hydration and microstructure, the cement paste mixed with seawater had a shorter induction stage and higher peak between 1 and 10 h due to the presence of Ca 2 + , Cl , Mg 2 + , and SO 4 2 in seawater and had a higher content of ettringite, portlandite, and Friedel’s salt than that of the cement paste mixed with freshwater after 28 days of curing [20]. Liu et al. [21] found that the increase in chloride ions concentration in seawater cement paste improved the pore structure due to the formation of Friedel’s salt. However, Li et al. [22] considered that the sulfate in seawater could be a potential threat due to the expansion and microcracks caused by the excessive formation of ettringite. In terms of engineering application, Etxeberria et al. [23] reported the application of on-site real-scale dyke blocks produced using steel slag aggregates, recycled aggregates, and seawater in the port of Barcelona. By sampling dyke blocks that had been exposed to sea for one year, they found that the use of seawater had an insignificant effect on the compressive strength of dyke blocks and even had a positive effect on the permeability. However, some researchers pointed out the safety problems associated with the use of seawater in reinforced concrete (RC) structures, since the existence of chlorides in seawater can lead to the corrosion of steel rebars, further reducing the bearing capacity of RC structures [24,25]. Recently, a few researchers have been studying the mechanical performance of fiber-reinforced polymer (FRP)-reinforced SSC [26,27,28] due to the anti-corrosion of FRP which can be an alternative to steel reinforcement [29]. Based on life cycle cost analysis (LCCA), Younis et al. [30] found that the total cost of FRP-reinforced seawater concrete can be reduced by 50% compared to steel-reinforced ordinary concrete based on a 100-year study period. However, up to now, concrete by brine instead of fresh water has not yet been studied by researchers. Therefore, it is of great significance to explore the feasibility of using waste brine and sea sand (BSC) for the production of green concrete and the difference between BSC and SSC due to the different hydration rates, as the content of chemical ions in the brine is 60 to 110% higher than that of the seawater [31].
In this study, the BSC and SSC were investigated on the macro and micro properties compared to the OC. The specimens were designed with three different water-cement (w/c) ratios (0.51, 0.6, 0.65). A series of tests were conducted including a compressive strength test, slump test, pH value test, mercury intrusion porosimetry (MIP), X-ray diffraction (XRD), thermogravimetric analysis (TGA), and scanning electron microscopy (SEM). The performance of SSC and BSC was evaluated by comparing the compression strength, slump, pH value, pore structure, and hydrate phase composition with those of OC. Finally, the sulfate resistance of BSC and SSC was predicted based on the analysis of the pore structure tested by MIP.

2. Specimen Design and Preparation

All the concrete specimens had the same crushed stone with a minimum size of 5 mm and a maximum size of 25 mm. Ordinary Portland Cement (OPC) type P.O 42.5 with the 28-day compressive strength of 42.5 MPa was used, following Chinese standard GB175-2020 [32]. The type of water and fine aggregates differed in BSC, SSC, and OC. Each type of concrete specimen was divided into three groups regarding different w/c. The w/c was designed with the targeted compressive strength above 30 MPa, the typical strength of concrete jetty structures.

2.1. Water

For OC specimens, freshwater was used. In the group of SSC specimens, the artificial seawater was prepared according to the ASTM D1141-2021 [33]. Since the salinity of brine was 1.6 to 2.1 times that of seawater [31], the concentration of chemical ions in the artificial brine was set as twice that in the standard artificial seawater. Table 1 compares the chemical components of the seawater and brine in this study and from different ocean areas. It can be found that the chemical ions content of artificial seawater and brine was within the practical range.

2.2. Fine Aggregates

The fine aggregates used to prepare OC were local river sand with a fineness modulus of 2.5. SSC and BSC used the sea sands which were original desalted sands from the East Ocean of China. They were standardized by immersion in standard artificial seawater and dried naturally for casting. Table 2 compared the chloride ion content of standardized sea sands and the sands in different oceans. It showed that the content of sea sand samples used in this study was within a reasonable range. To minimize the adverse effect, the sea sands were sieved to reduce the shell content to 4.1% according to Chinese standard JGJ 52-2006 [45]. Afterward, the fineness modulus was determined as 2.51, similar to the river sands. The particle size distributions of three sea sand samples (Figure 2) showed that they belonged to Grade II sands specified in JGJ206-2010 [46].

2.3. Concrete Mixture Design

Each type of concrete was designed with three w/c which were 0.51, 0.6, and 0.65, respectively. The concrete slump was designed between 70 and 130 mm, conforming to the general workability requirement of commercial concrete in the Chinese standard GB50164-2011 [51]. The mixture proportions for three w/c groups were designed according to the concrete mixture design specification [52] and listed in Table 3. The measured bulk densities of OC, SSC, and BSC mixtures were 2540, 2590, and 2600 kg/m3, respectively.

2.4. Specimen Preparation

For each mixture, nine 100 × 100 × 100 mm cubic specimens were cast following GB/T 50081-2019 [53]. Three specimens were tested for 7-day compressive strength. Three were tested for 28-day compressive strength, and the remaining were used for the XRD, TGA, MIP, and SEM tests after 28 days. The molds were removed two days after casting and placed in the standard curing room (temperature of 20 ± 2 °C and >95% relative humidity) until the 28th day.

3. Test Methods

The brine, seawater, and sea sands contained large amounts of salt. The presence of salt will affect early strength and workability. Complex series of chemical reactions also change the concrete internal pore structure, phase composition, and microscopic morphology. In this study, a series of tests and measurements were conducted to evaluate the characteristics of three different concrete from macroscopic to microscopic aspects.

3.1. Workability, Compressive Strength, and pH Value

The slump value is an important index to evaluate the workability of the concrete mixture. The slump test was conducted by the ASTM C143/C143M [54]. The compressive strength tests were carried out at the curing date of 7th and 28th day according to the Chinese standard GB/T 50081-2019 [53]. The characteristic strength was the average value of the three samples. After the 28-day compression strength test, a 10 g sample was obtained from the cube corner of one tested cube of three identical specimens and was ground to powder. The sample powder after air drying was prepared for testing the pH value following the standard procedures in the NYT 1377 [55] with consideration of difficulty in extracting pore solution in hardened concrete.

3.2. Mercury Intrusion Porosimetry (MIP)

The pore size distribution of different types of concrete was tested by an automatic mercury porosimeter (AutoPore IV 9500). The maximum pressure was set as 228 MPa which enabled the measuring porosity between 0.005 and 360 μm. In addition, the contact angle between the mercury and the pore surface was θ = 130°. When the different types of concrete reached the age of 28 days, the samples with a size of 5 mm × 2 mm × 5 mm were cut from the concrete cube corner shown in Figure 3. The weight of the small concrete pieces was approximately 1.07 g. Before the testing of MIP, the samples were placed in a plastic container containing isopropanol for 1 h to cease hydration. After that, to reduce the influence of moisture on the results of MIP, the samples were dried in a vacuum oven at 50 °C (to avoid the decomposition of ettringite due to excessive temperature) to evaporate the free water. When the difference between the two masses of adjacent tests was not changing within 48 h, the dried samples were placed in a mercury intrusion test tube under low- and high-pressure tests.

3.3. Thermogravimetric Analysis (TGA) and X-ray Diffraction (XRD)

All the samples for TGA and XRD were taken from the 28-day compressive cubes after the test. The sampling method of the sample is shown in Figure 3. Samples used for XRD and TGA were drilled to a depth of 1 to 7 mm from the concrete specimen by a 10 mm diameter milling cutter and then were ground into powders. During the grinding process, coarse aggregate in the sample was carefully picked out. The shortest distance between the hole and the outer edge of the concrete specimen was 25 mm.
TGA was the microscopic test method to obtain the content of chemically bound water and hydrated phases (calcium hydroxide, magnesium carbonate, calcium carbonate) through the sample mass loss caused by elevated temperature over a range of 30–1000 °C at a heating rate of 10 °C/min. The instrument was American TA Q5000. The powder samples with a weight of 10 mg were placed in a 150 μL platinum crucible. Nitrogen with a flow of 10 mL/min was used as a purging gas.
The XRD test semi-quantitatively analyzed the composition of hydration products through the internal standard method [56]. The powder sample was mixed with a 10% mass fraction of α-Al2O3 corundum (internal standard substance). The X-ray data were collected using a Japan Rigaku D/max2500 diffractometer, the scanning range was 5–90°, and the scanning rate was 1°/min. The accuracy of the semi-quantitative analysis was verified by comparing the calculation results on the mass fraction of calcium hydroxide and calcium carbonate between TGA and XRD. Afterward, the content of the amorphous phase could be determined for a different concrete.

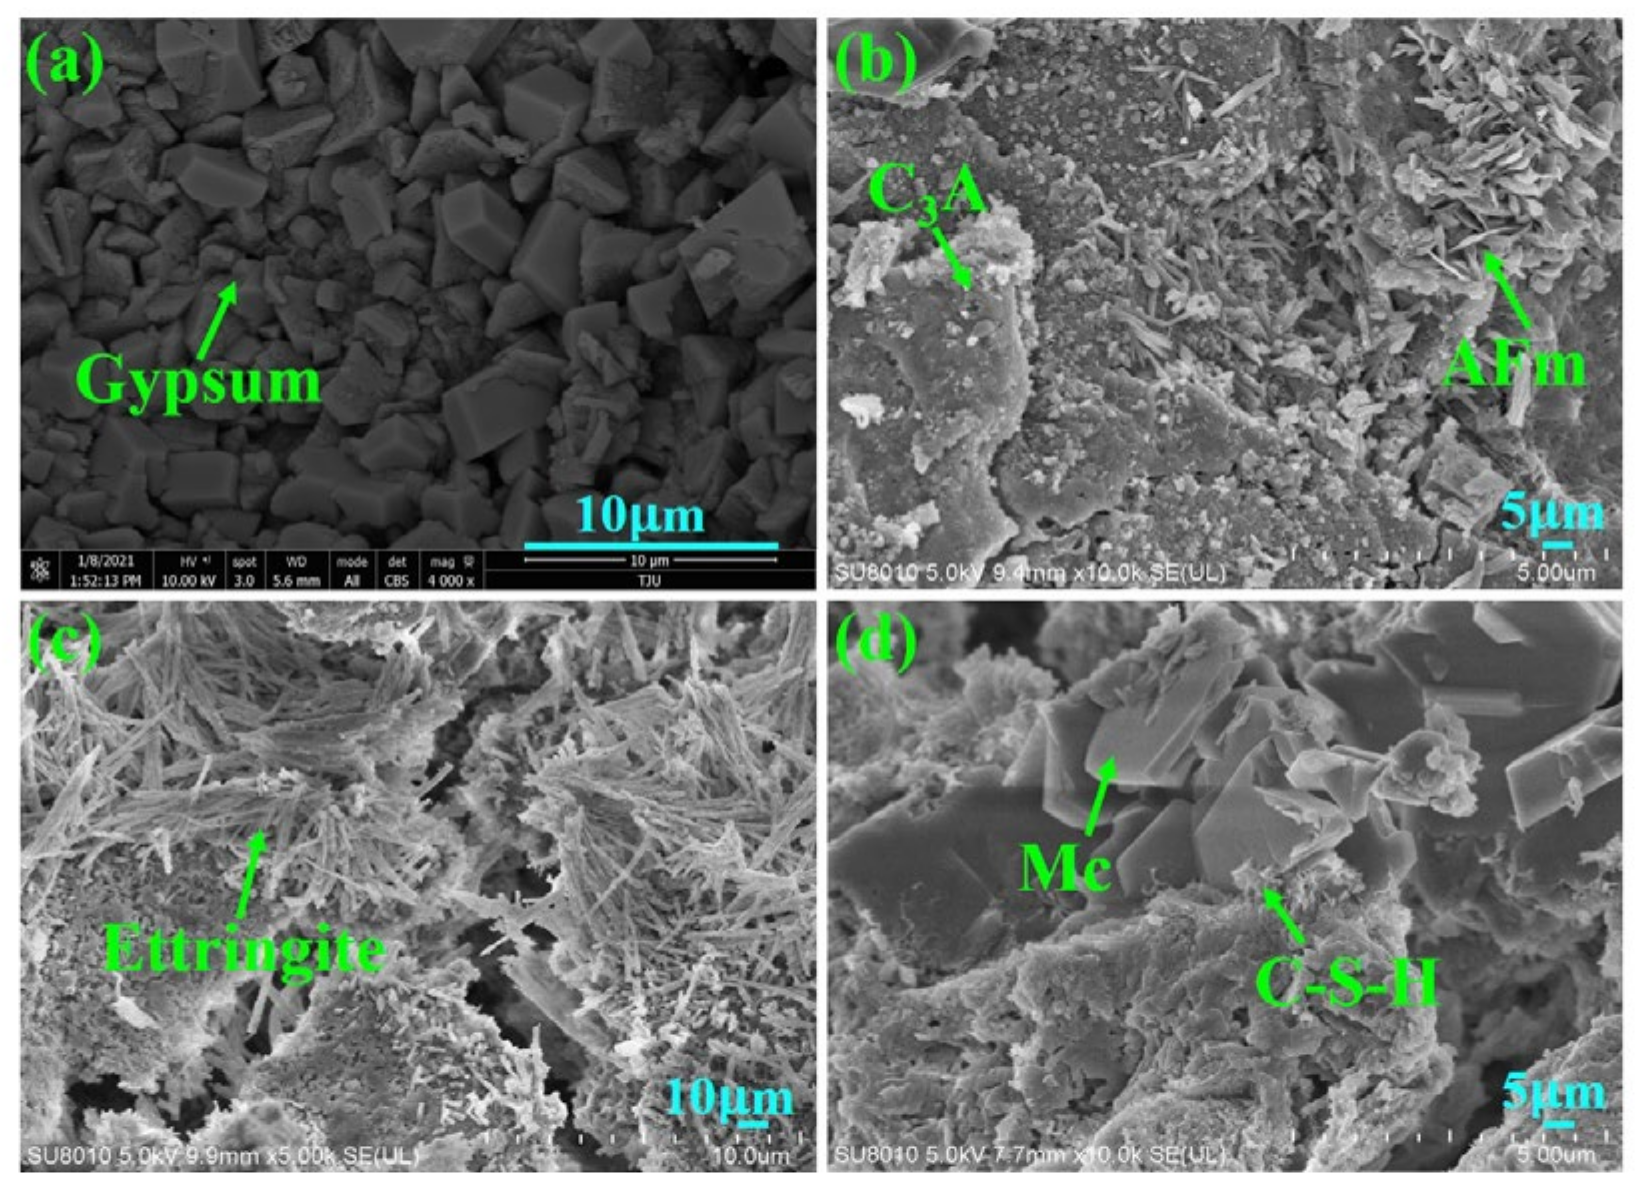
3.4. Scanning Electron Microscopy (SEM)

The scanning electron microscope (SEM) was adopted to observe the major hydration products’ microscopic morphology. The 10 mm × 10 mm × 10 mm sample from the concrete cube corner (Figure 2) after 28-day curing was sputtered by gold and then put into the observation chamber. The test instrument was Nova NanoSEM450.

4. Results and Discussion

4.1. Slump

Figure 4 shows the slump value of all the specimens. Whatever the w/c, the slump of BSC and SSC are both less than that of OC, and BSC even had a lower slump value than SSC. In addition, the reduction of slump value in BSC and SSC decreased with the increase in the w/c. In general, the slump of concrete decreased with the increase in chloride ion concentration in the mixing water, which is attributed to the chlorides in seawater/bine. The investigation of Geng et al. [57] and Kishar et al. [58] demonstrated that NaCl in seawater/brine can consume the Ca(OH)2 in the pore solution and increases the content of CaCl2 which is a strong accelerator of cement hydration. Therefore, the presence of chlorides in seawater/brine reduced the initial setting time of concrete, further reducing the slump compared to OC. However, the salt effect on the workability can be neglected when the w/c is between 0.51 and 0.65. The slump of mixtures in this study was between 90 and 120 mm, which still met the design requirement (70 to 130 mm) [51] for infrastructural construction.

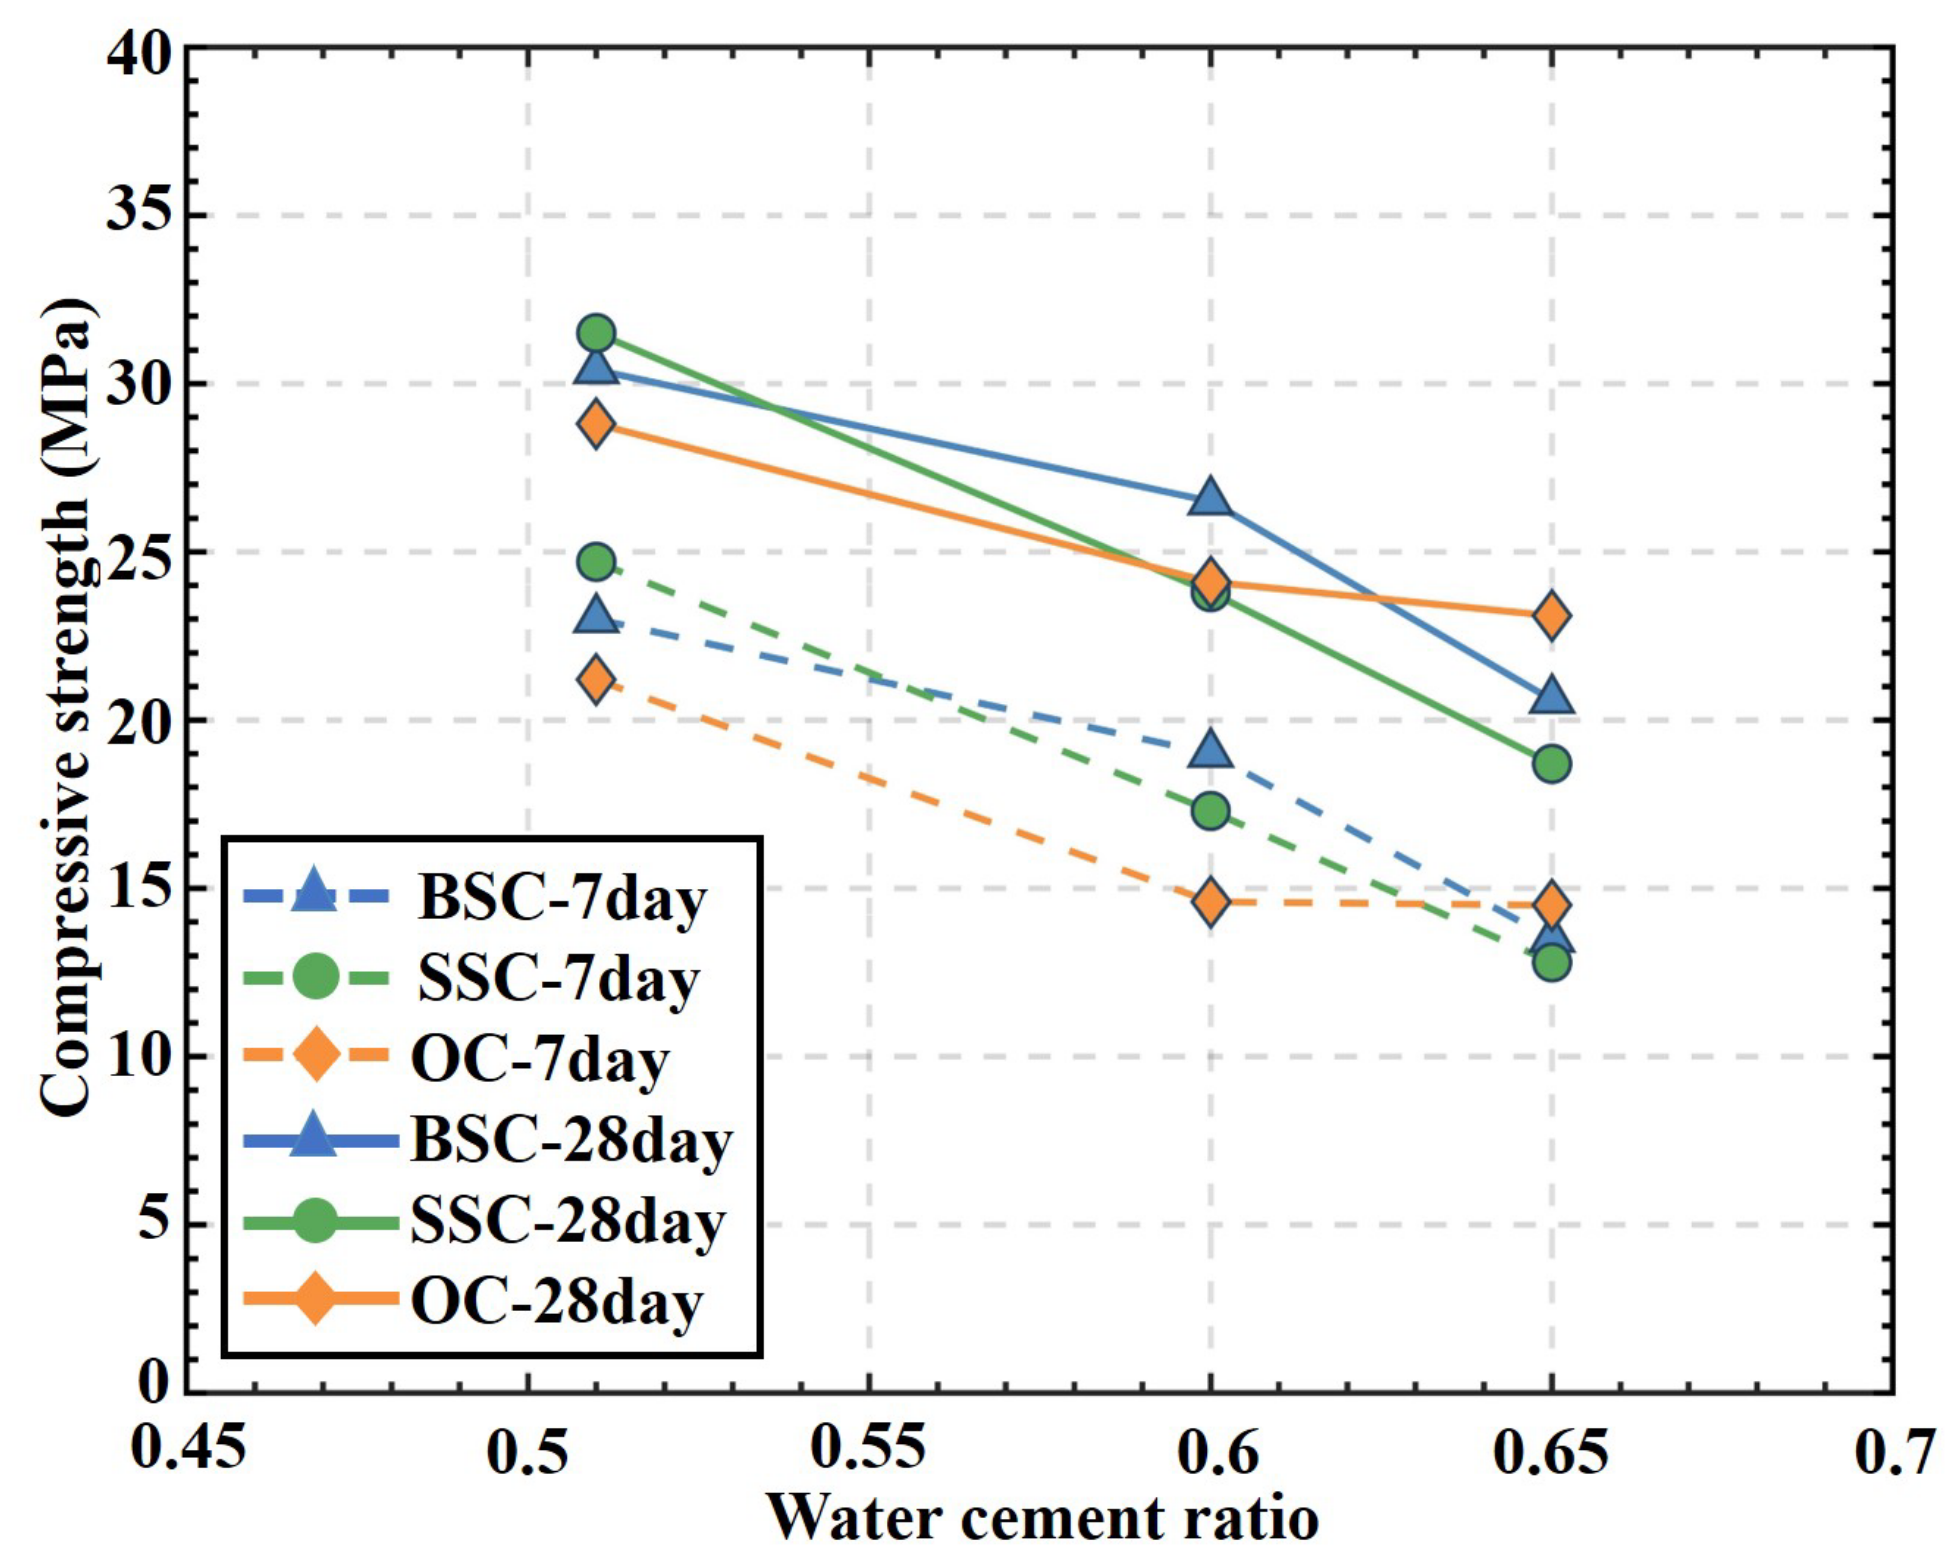
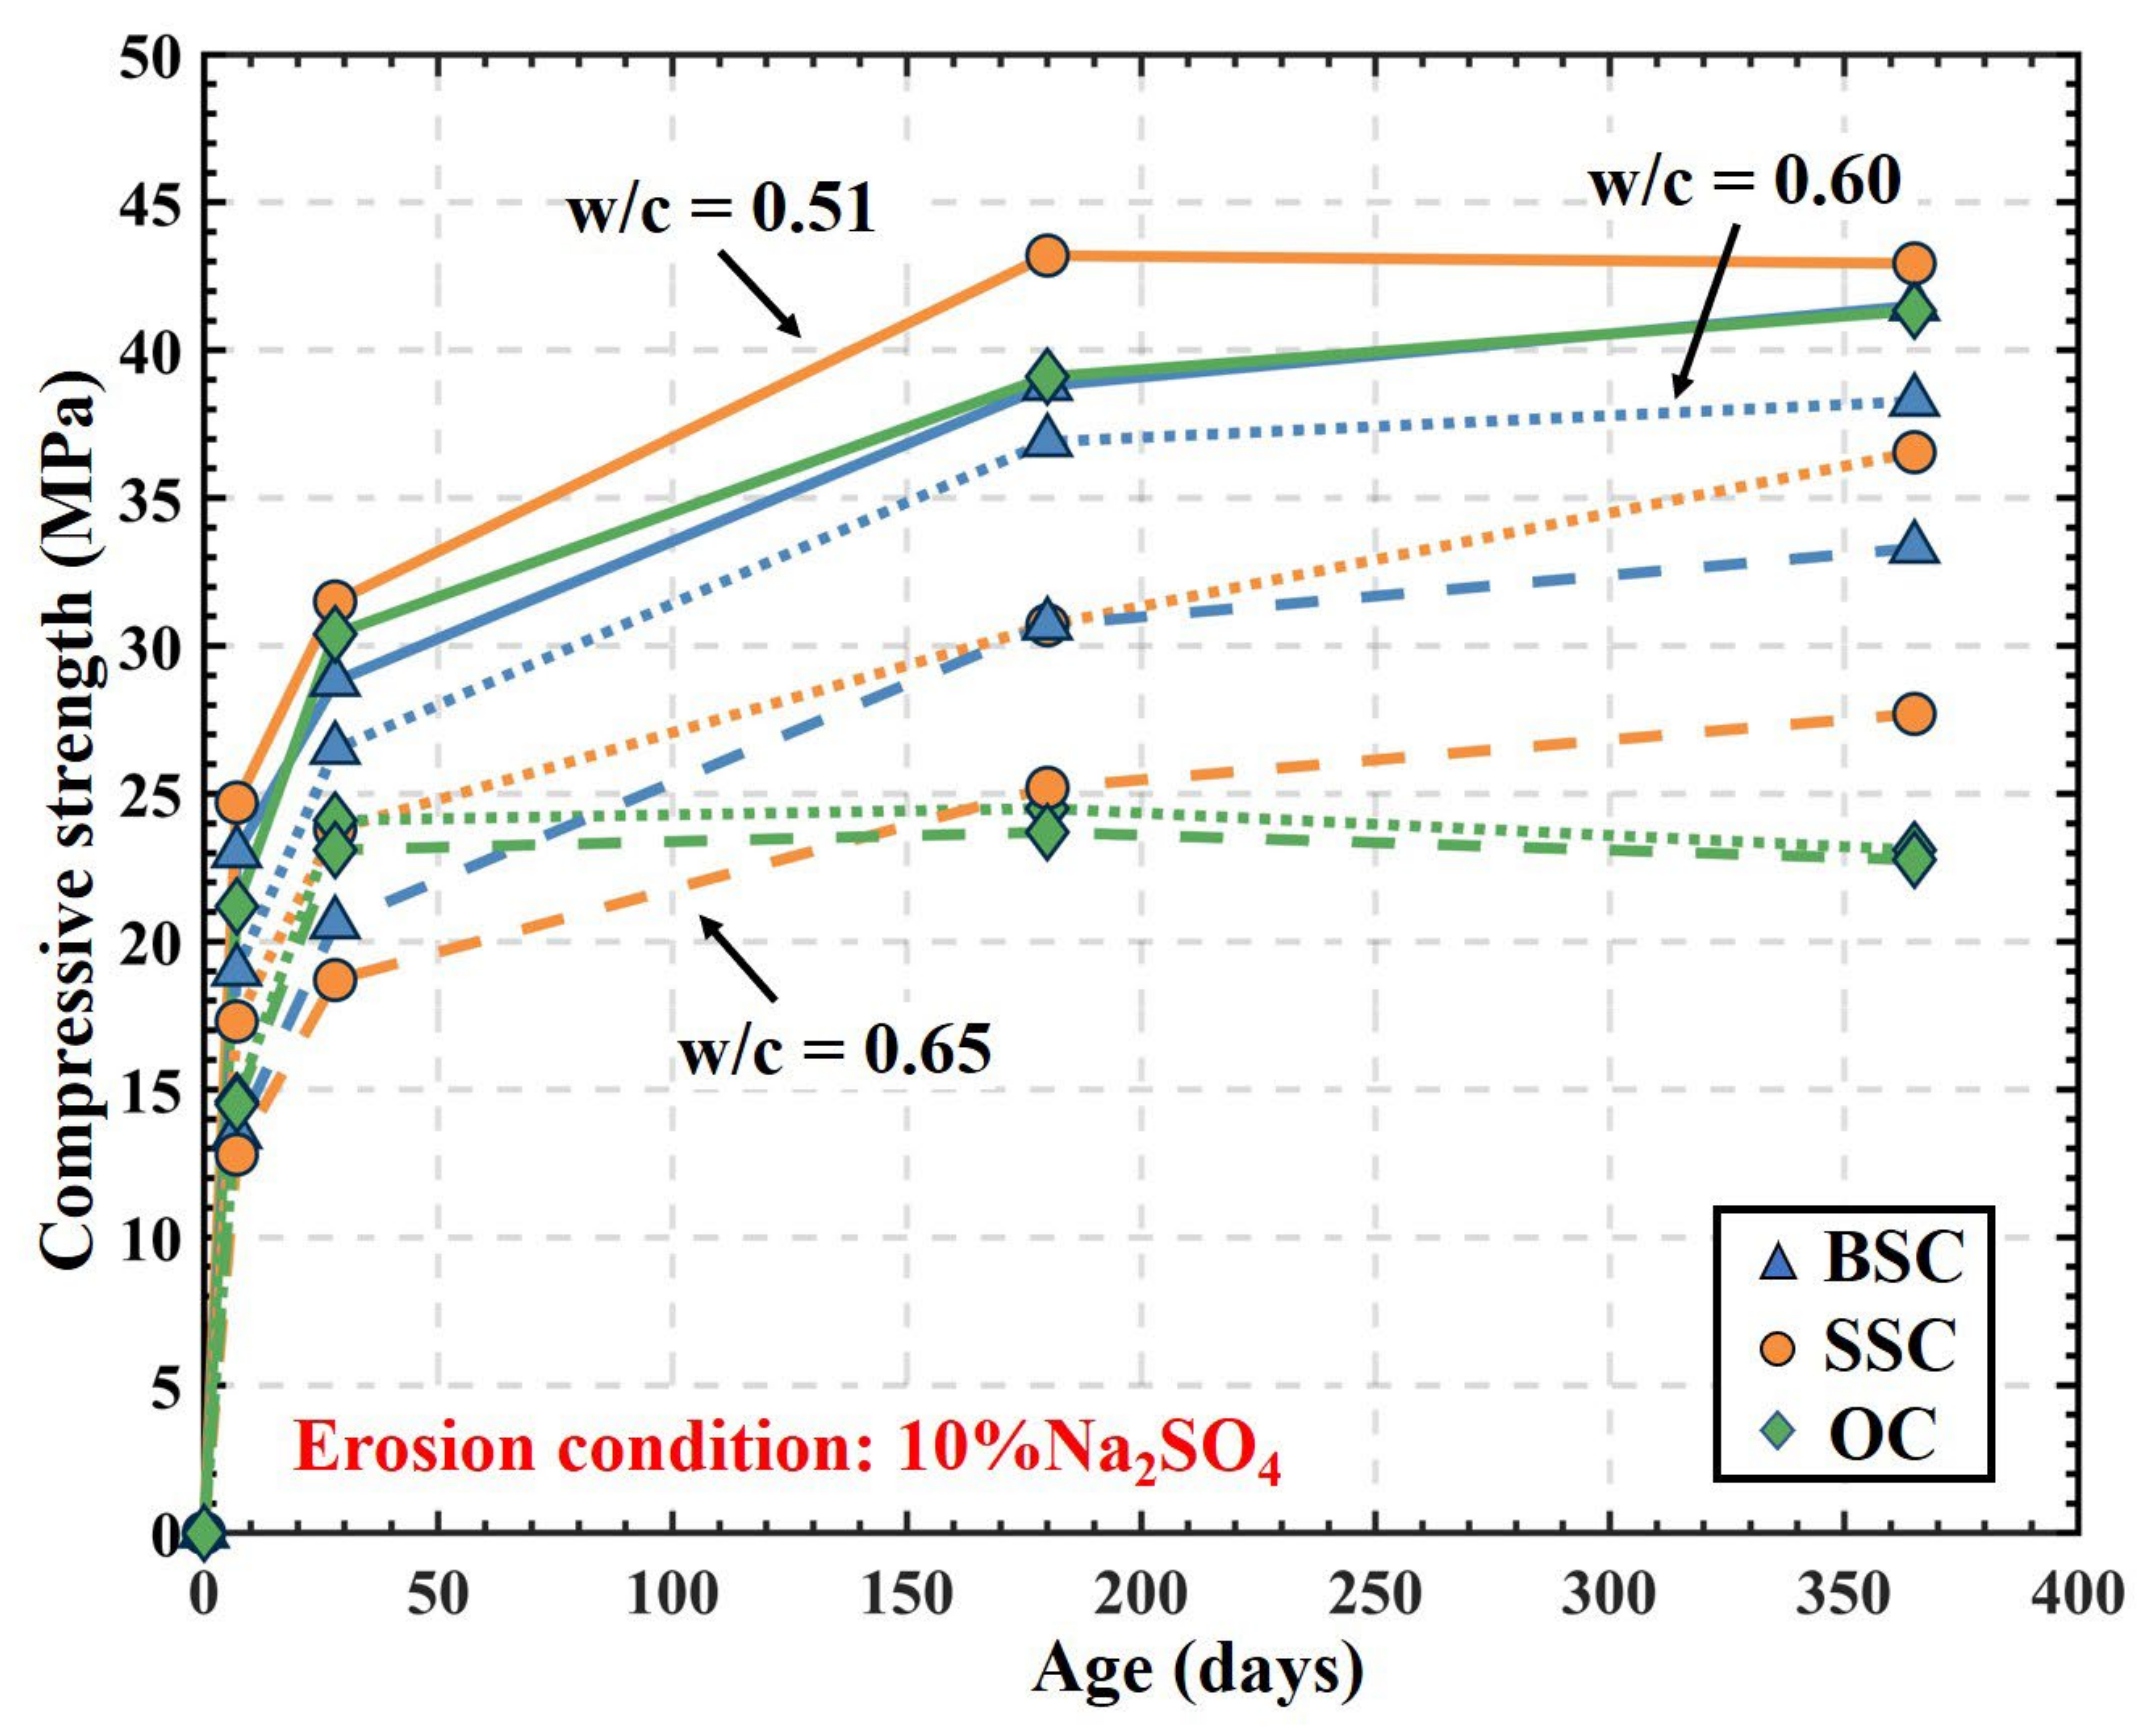
4.2. Compressive Strength

The 7-day and 28-day compressive strengths are displayed in Figure 5. The results of the comparison are summarized as follows.
  • BSC had higher 7-day compressive strength than OC. BSC had 8.5 and 30.1% higher compressive strength than the OC in the two groups with the w/c of 0.51 and 0.60, respectively. The difference between BSC and OC with a 0.65 w/c was 6.9%. The higher 7-day strength could be attributed to chloride ions in the brine which reacted with C3A and Ca(OH)2/CaSO4 to form Friedel’s and Kuzel’s salts, respectively, which accelerate the hydration reaction and optimize the microstructure of the concrete [59,60]. Therefore, at the same hydration age, BSC has more hydration products and higher compressive strength than OC.
  • The 28-day compressive strength of BSC was comparable to that of OC. The strength of BSC with the w/c of 0.51 and 0.60 was 5.26 and 9.96% higher than the corresponding OC, respectively. The strength difference of BSC with the w/c of 0.51 and 0.60 to corresponding OC was reduced by 3.2 and 20.1%, respectively, compared to the 7-day compressive strength. Moreover, the strength of BSC with the w/c of 0.65 was 10.82% lower than that of OC. The adverse effect of additional chloride ion would be attributed to damage of microstructure due to the leaching of the hydration products and salt crystallization.
  • Minor strength difference was displayed between BSC and SSC. The 7-day compressive strength of BSC with w/c of 0.60 and 0.65 was 9.83 and 5.47% higher than that of SSC, respectively. The 28-day strengths of BSC with w/c of 0.60 and 0.65 increased by 11.34 and 10.16%, respectively, compared with the corresponding SSC specimens. In the group with a w/c of 0.51, the 7-day and 28-day strength of BSC was 6.88 and 3.49% less than that of SSC, respectively. For concrete with a lower w/c, the increase in salinity slightly reduced the compressive strength. Moreover, the compressive strengths of BSC, SSC, and OC exhibited a decreasing trend with the increasing w/c in an approximately linear relationship for both 7-day and 28-day strengths.

4.3. pH Value

The 28-day pH values of BSC, SSC, and OC with different w/c are shown in Figure 6. The BSC and SSC pH values were slightly higher than those of OC, but all pH values were between 12.7 and 12.9 which was within the range for conventional concrete (12.5–13.5) [60]. Therefore, the salt in brine/seawater had no significant effect on the pH value, which could ensure the stability of the alkali environment inside the concrete. This is an important index for using FRP in the BSC/SSC structure during service, as the change in the alkaline environment would affect the mechanical properties of FRP reinforcement. According to the existing studies, current commercial FRP reinforcement can be well designed to be used in the alkaline environment in OC. Therefore, the similar alkaline environment in BSC and SSC makes using FRP reinforcement in BSC and SSC possible, which has also been demonstrated in [61].

4.4. Pore Structure Analysis and Sulfate Resistance Prediction

4.4.1. Cumulative Intrusion Pore Volume and Pore Size Distribution

The microstructure of hydrated cement paste should have a significant influence on the mechanical properties of concrete. In this study, the microstructure was quantitively evaluated by cumulative intrusion pore volume and pore size distribution. The cumulative porosity curves of BSC, SSC, and OC at different w/c are displayed in Figure 7. In general, the higher the w/c, the larger the cumulative porosity was. Meanwhile, the curve pattern of BSC was approximately the same as that of SSC and OC. The significant difference in cumulative pore volume among different concrete became evident with the decrease in pore size. Especially when the pore size was smaller than 100 nm, the pore volume had a fast cumulation. Hence, different constituents of the concrete had a significant effect on the smaller pore structures.
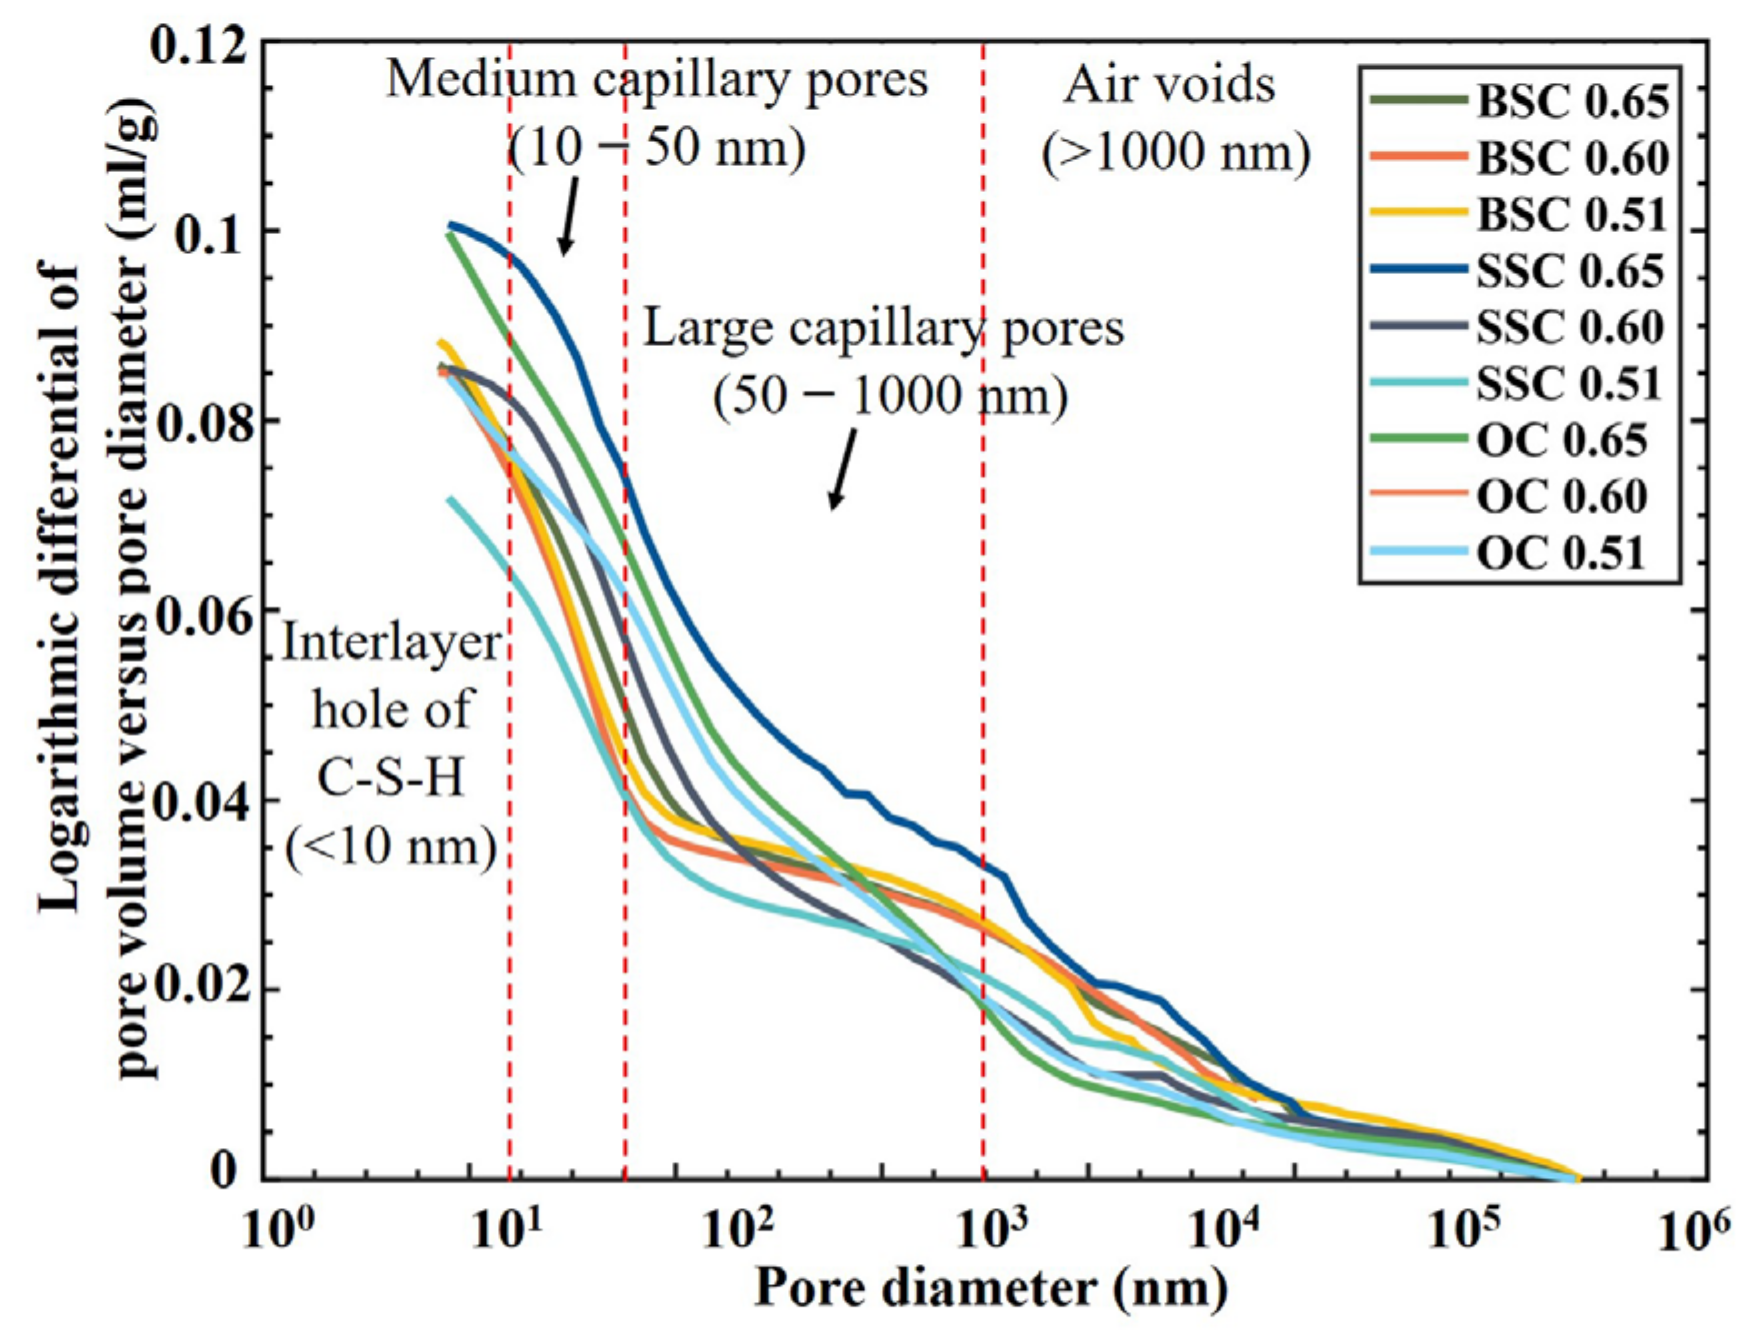
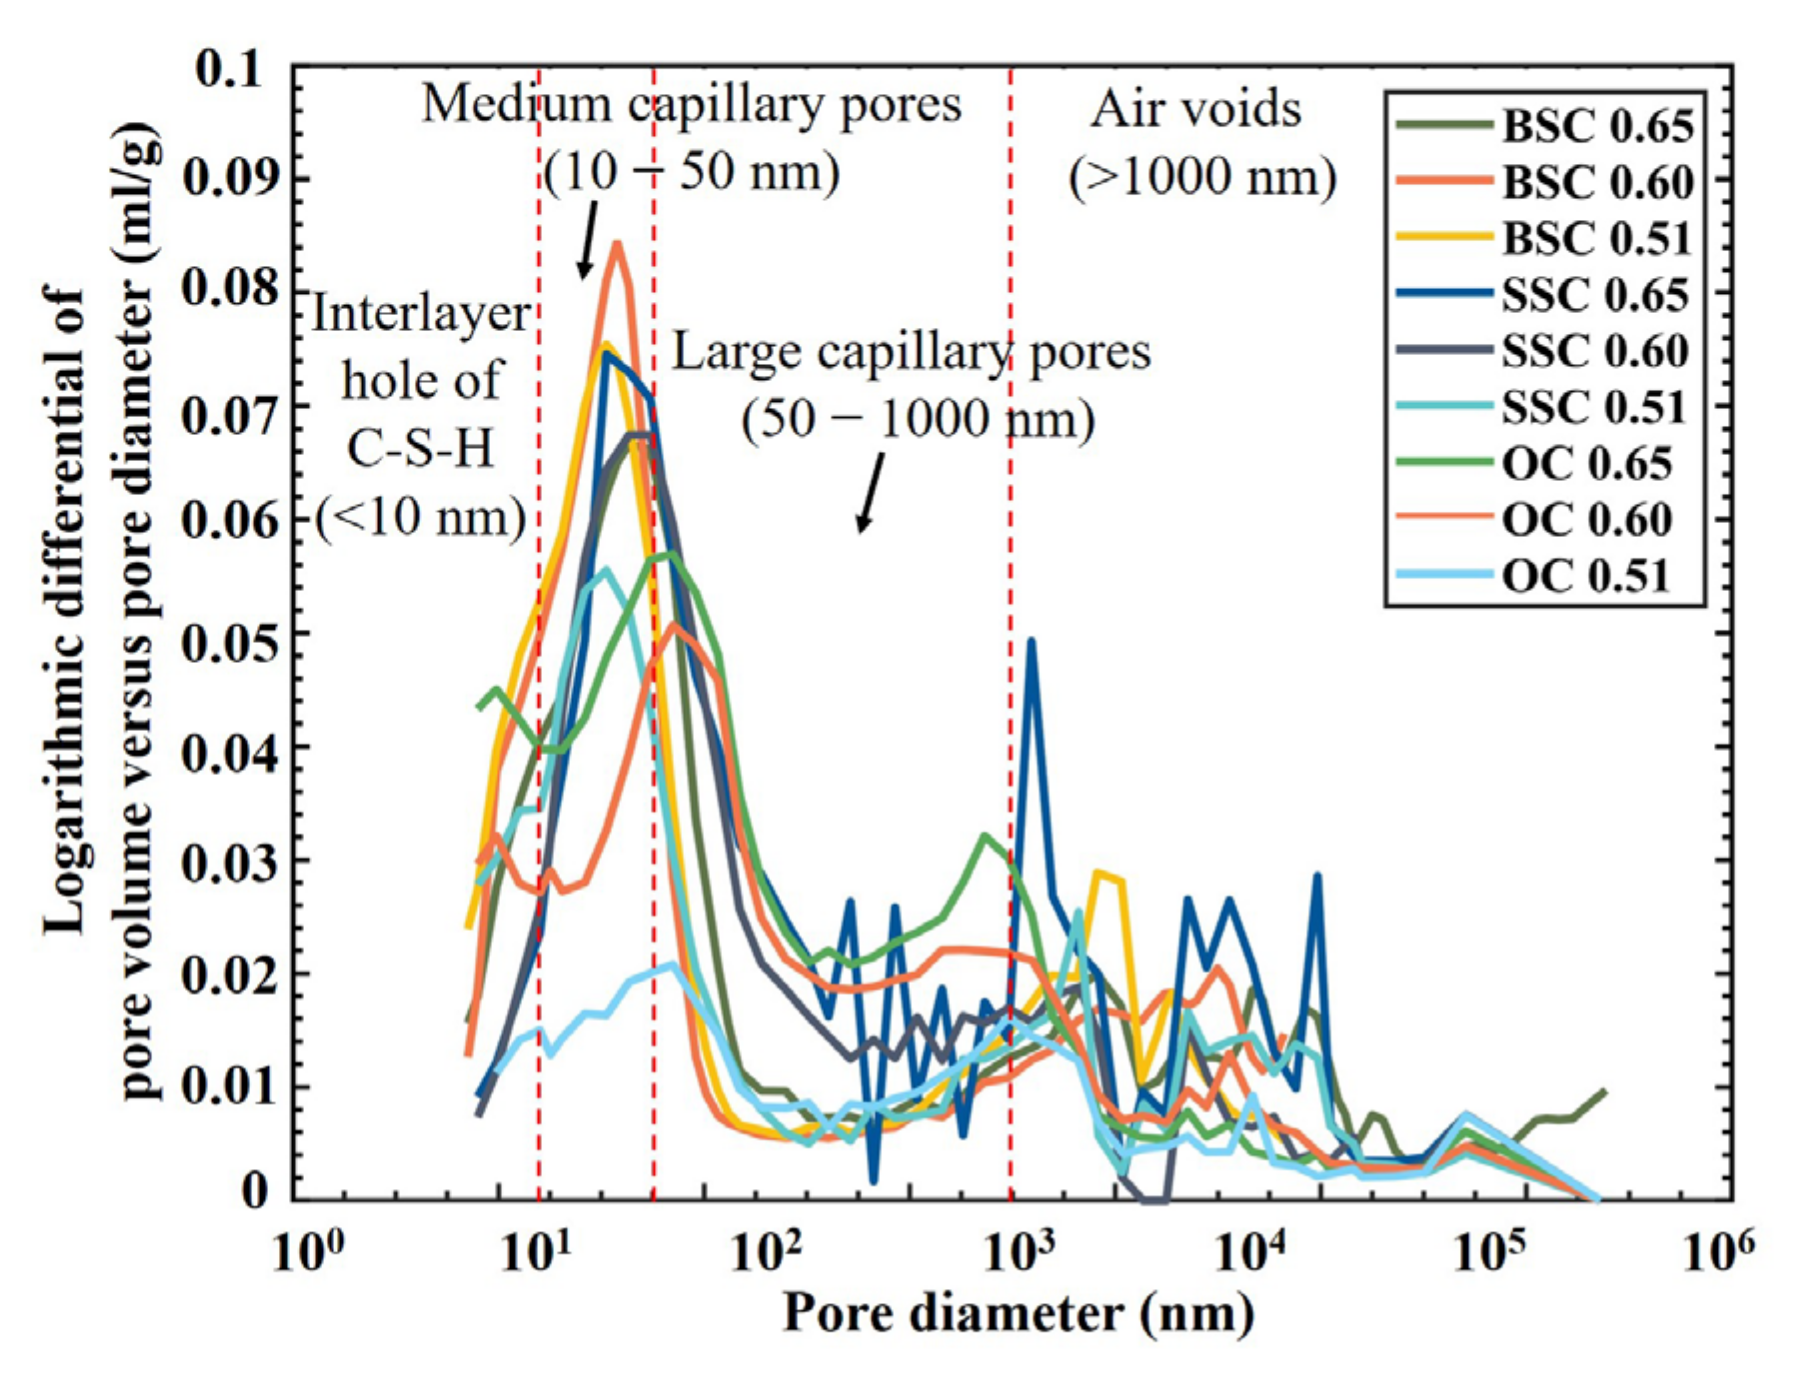
  • The pore structure was further analyzed through the pore size distribution curves, which were obtained by taking derivation of the cumulative porosity curves (Figure 8). Pore size between 1 and 10 nm (gel pores) is the size of interlayer pore of calcium silicate hydrate (C-S-H). The pore volume of BSC and SSC was larger than OC, implying that BSC and SSC may contain more interlayer pores of C-S-H than OC (the pore volume of gel pores in BSC with w/c). However, higher porosity of gel pores would not cause adverse effects on the permeability and strength of the hydrated cement paste as the gel pores were extremely tiny [60].
  • A pore size between 10 and 1000 nm is a capillary pore. It can be seen that the large capillary pores volume (diameters between 50 and 1000 nm) of concrete with a lower w/c was smaller than that of concrete with a higher w/c. A similar conclusion can be found in the other studies [20,62,63]. It demonstrated that the large capillary pores had a more significant impact on the strength and permeability of concrete [64]. Moreover, it can be observed that the critical pore size was located in this range. For all types of w/c, the critical pore sizes of BSC and SSC are less than OC. The volume of capillary pores less than 50 nm increased with increasing content of chloride ions, i.e., BSC > SSC > OC. The volume of large capillary pores decreased significantly with the increasing concentration of chloride ions. In general, the large capillary pore structure of BSC and SSC was more compact than that of OC. It indicated that the addition of chloride ions is beneficial for lowering the content of large capillary pores. It could be attributed to the presence of chloride ions combined with sodium ions to form sodium chloride crystals which fill the large capillary pores in BSC and SSC [65].
  • Pore size greater than 1000 nm is the air voids. The relative pore volume of BSC, SSC, and OC was in the order of BSC > SSC > OC, indicating that introducing the chemical ions from seawater could increase the volume of air voids in the concrete.

4.4.2. Sulfate Resistance Prediction

External sulfate attack (ESA) is a degradation process for concrete structures exposed to sulfate environments, one of the primary corrosion factors for FRP-reinforced concrete in the marine environment. The sulfate ions will react with the aluminate phase in the concrete which results in the dissolution of the aluminate phase and the massive formation of expansive products ettringite. During the reaction, the solid-state conversion of C3A to ettringite can cause an eightfold increase in volume [66]. The expansion of ettringite formation will trigger crystallization pressure in the pore and deteriorate the strength of the concrete. Up to now, the most widely-cited hypothesis is that the large crystallization pressure is prone to be generated in the pore with a diameter smaller than 100 nm according to the crystal growth pressure theory [67]. Therefore, the sulfate resistance of three different concrete mixtures was predicted by evaluating the difference of contributive porosities in four pore size ranges (<10 nm, 10–50 nm, 50–1000 nm, and >1000 nm) based on the abovementioned hypothesis.
The four contributive porosities of BSC, SSC, and OC at different w/c are shown in Table 4. Among the four pore size ranges, the volume of gel pores (pore size < 10 nm) in concrete was the lowest and did not contribute to ion transport [68]. The volume of medium capillary pores (pore size 10–50 nm) accounts for the largest proportion of pores. The volume of medium capillary pores in BSC and SSC was larger than that of OC, and the difference in the concrete with the smallest w/c was the most significant. In this range of pore diameter, the formation of small-size ettringite (typically 1–2 μm long and 0.1–0.2 μm thick) [69] would generate tremendous crystallization pressure as high as 8 MPa that was far beyond the tensile strength of concrete [70]. However, the formation of ettringite is governed by the permeability of sulfate ions which is determined by the structure of large capillary pores (pore size 50–1000 nm) [68]. The pore volume of large capillary pores in BSC and SSC was smaller than in OC, especially for a high w/c, and the increase in seawater concentration could decrease the pore volume of large capillary pores. Hence, the sulfate ions in BSC and SSC would have lower transport rates in large capillary pores. Comparatively, the large capillary pores of OC will be preferentially filled with small-size ettringite. Subsequently, the accumulation of small-size ettringite during the ESA will eventually lead to OC being prone to have more micro cracks. Meanwhile, the pore volume of air voids (pore size > 1000 nm) in BSC and SSC was larger than in OC. Within the air voids, large-size ettringite up to 10–100 μm long and several micrometers thick could be found [69]. However, the ettringite of the large size would not cause interior cracking due to insufficient crystallization pressure in the air voids [69].
To sum up, the salinity increase could reduce the large capillary pores and increase the air voids. Regarding the formation features of ettringite during the ESA, the pore structural variation in BSC and SSC would enable two types of concrete to perform better in the sulfate resistance. The predicted results can be confirmed by the results (Figure 9) of a one-year durability test on the same BSC, SSC, and OC under sulfate attack [71].

4.5. Hydration Product Analysis and Microstructures

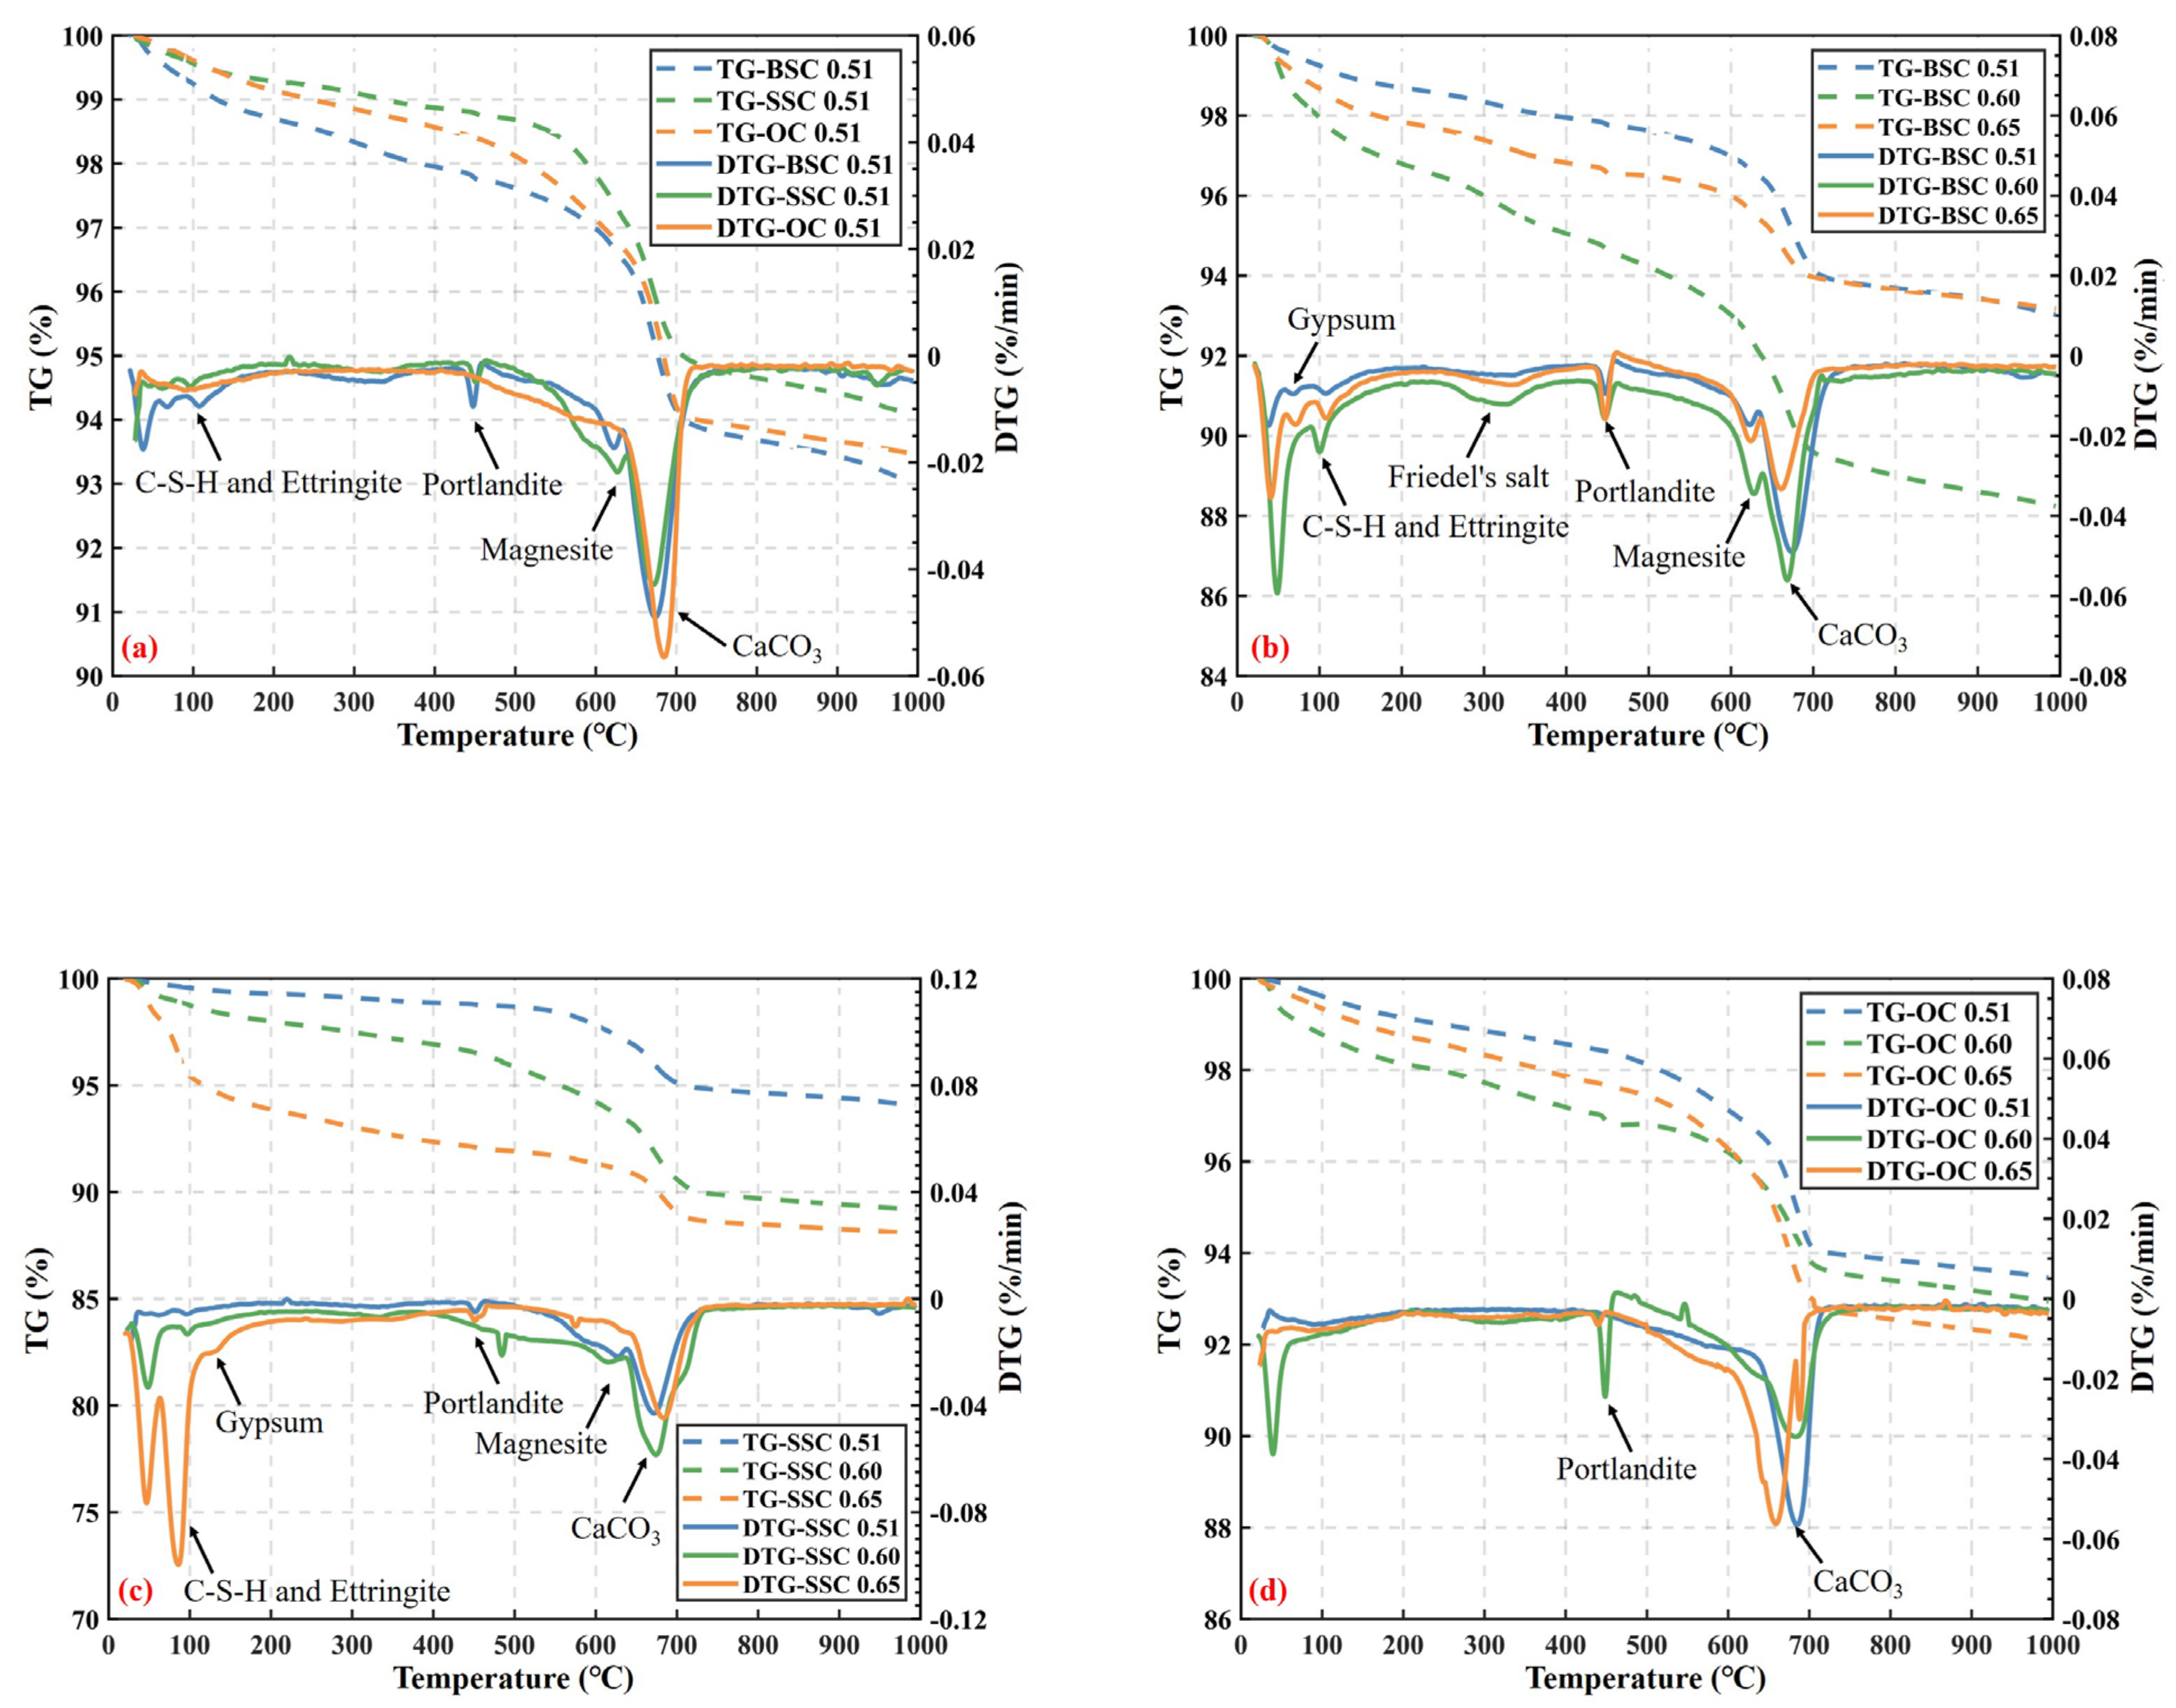
4.5.1. Thermogravimetric Analysis (TGA)

Figure 10a reveals the TG-DTG curve of BSC, SSC, and OC at a w/c of 0.51, with four prominent endothermic peaks. The first peak (approximately 100 °C) was the endothermic peak for the loss of bound water and thermal dehydration of C-S-H and ettringite. The second peak within 400–500 °C was the endothermic peak for portlandite (CH) dehydration. The weight loss of CH is more significant in BSC and SSC than in OC. It demonstrated higher content of CH in BSC and SSC, which is also consistent with the results of the XRD analysis in the following section. Compared with OC, there were additional peaks for magnesium carbonate (550–650 °C) in the TG-DTG curves of BSC and SSC which might be due to the additional magnesium and calcium carbonate ions in the brine, seawater, and sea sand. The last peak in the TG-DTG curve within 500–800 °C was for calcium carbonate. All the TG-DTG curves showed that the weight loss of calcium carbonate increased significantly. It confirmed the carbonization of the sample which was due to the planned test being postponed by the unexpected COVID-19 pandemic.
The TG-DTG curves of BSC with different w/c are shown in Figure 10b. As the w/c increased, the weight loss of CH and calcium carbonate in BSC started to increase. Meanwhile, the peak for Friedel’s salt (250–400 °C) was gradually formed with the increasing w/c, which indicates that the content of Friedel’s salt increased. It was also consistent with the XRD pattern analysis in the following section. Moreover, the presence of magnesium carbonate was observed in all the BSC specimens. Similar features could also be observed in SSC and OC as illustrated in Figure 10c,d.

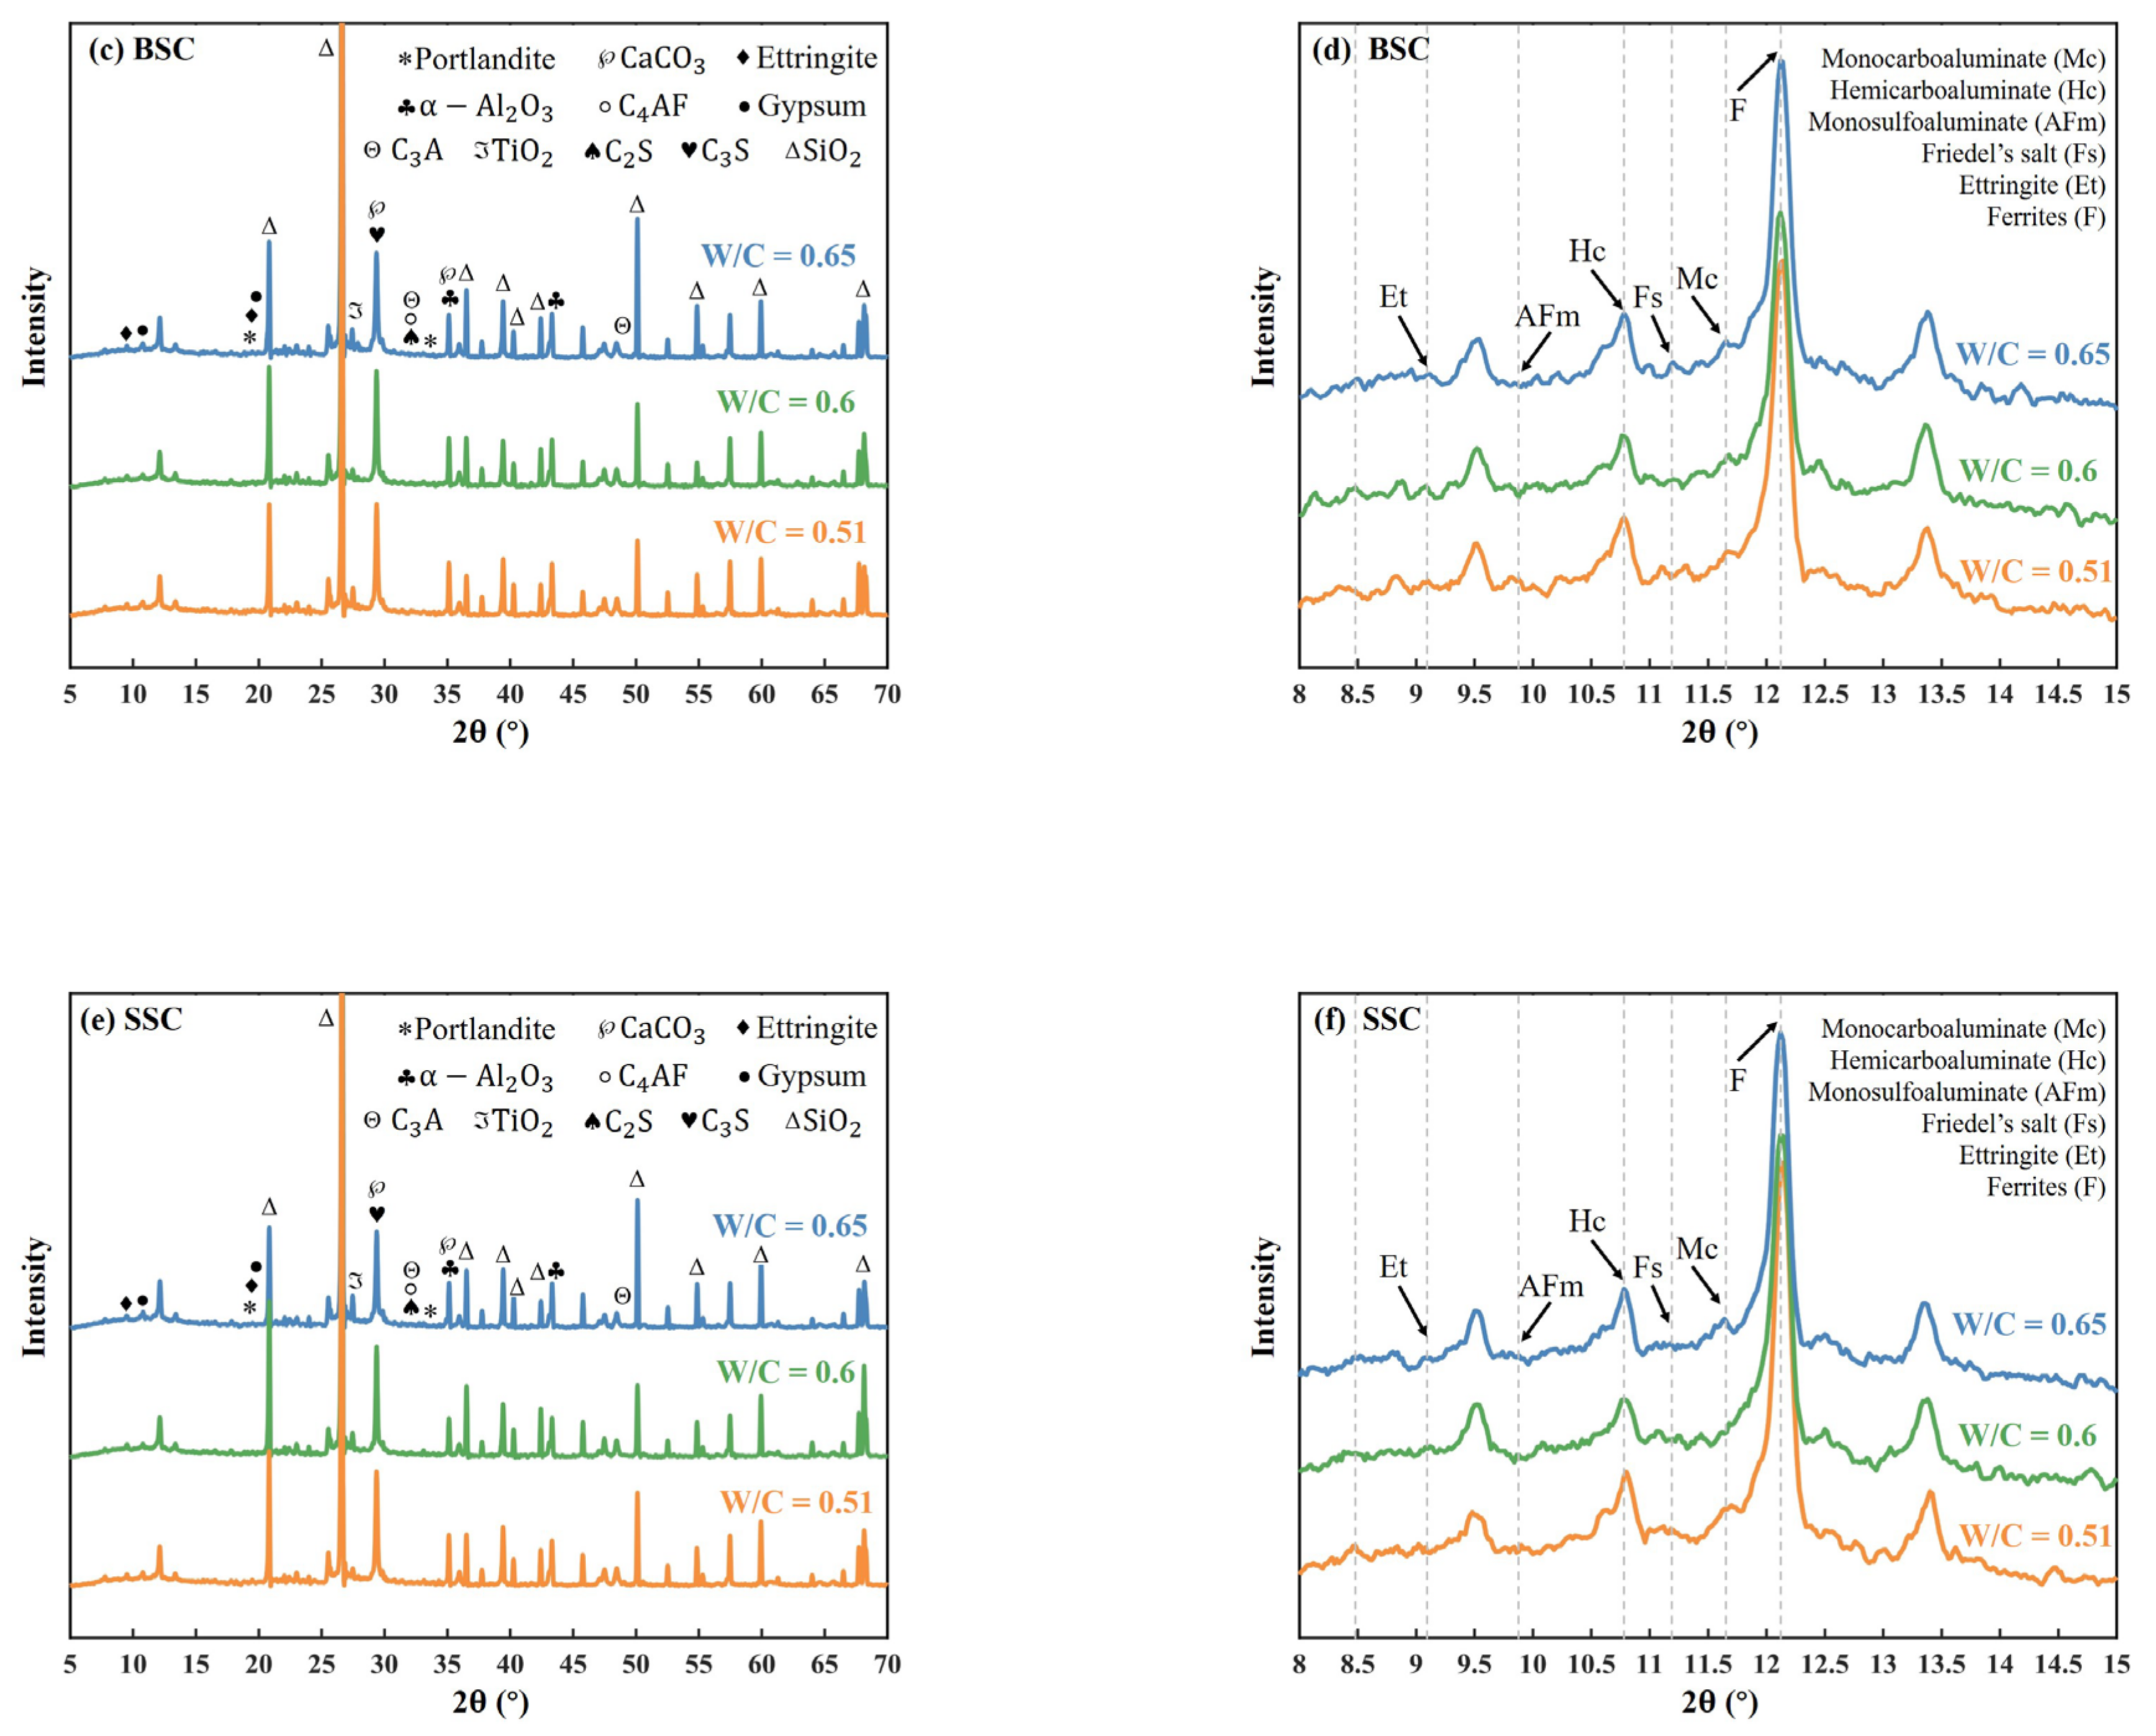
4.5.2. X-ray Diffraction (XRD)

The XRD pattern of BSC, SSC, and OC with a w/c of 0.51 is displayed in Figure 11a. All samples had been found to have anhydrous phases of C3S, C2S, C3A, and C4AF (the mineral composition of cement). The peak of quartz was visible, and the integrated intensity was the highest due to the presence of sand. In addition to the mineral composition of cement, α-Al2O3 (2-Theta at 43.362°), CH (2-Theta at 34.088°), calcium carbonate (2-Theta at 29.405°), gypsum (2-Theta at 11.588°), ettringite (2-Theta at 9.091°), AFm, and other hydrate phases were also observed in the XRD pattern. It is worth mentioning that the peaks of CH in all samples were extremely weak, while the peaks of calcium carbonate were relatively high. It was caused by carbonization, as explained in the discussion of the TGA section. Figure 11b is an amplified XRD pattern with 2-Theta within 8–15°. The content of ettringite in BSC and SSC was slightly higher than that of OC. This was because the additional sulfate ions and sodium ions in BSC and SSC would react with the free water and hydrated product CH to form dihydrate gypsum and sodium hydroxide. Hence, BSC and SSC had more gypsum that could participate in the C3A reaction to form ettringite during the hydration process. The typical microscopic morphology of the C3A-gypsum system is shown in Figure 12a–d. Meanwhile, BSC and SSC had a larger volume of air voids which reserved more space for ettringite formation. At last, it could be found that the other difference between sea sand concrete (BSC/SSC) and OC in the phase peak at 2-Theta of 11.2° demonstrated the existence of Friedel’s salt in BSC and SSC, which was formed by the chemical reaction between AFm and chloride ions from brine/seawater and sea sands.
The XRD patterns for BSC specimens with the w/c of 0.51, 0.60, and 0.65 are displayed in Figure 11c,d. The phase composition of the hydrated product was not affected by the change of w/c, while the peaks of each phase were different: the peak height of ettringite, Ms, Mc, Hc, Ferrite, and Friedel’s salt all increased with the increasing w/c. This was because BSC with higher w/c had a higher content of sulfate and chloride ions which accelerated the hydration reaction to produce ettringite, Ms, Mc, and Hc. Similar characteristics of XRD patterns could be summarized for SSC (Figure 11e,f).

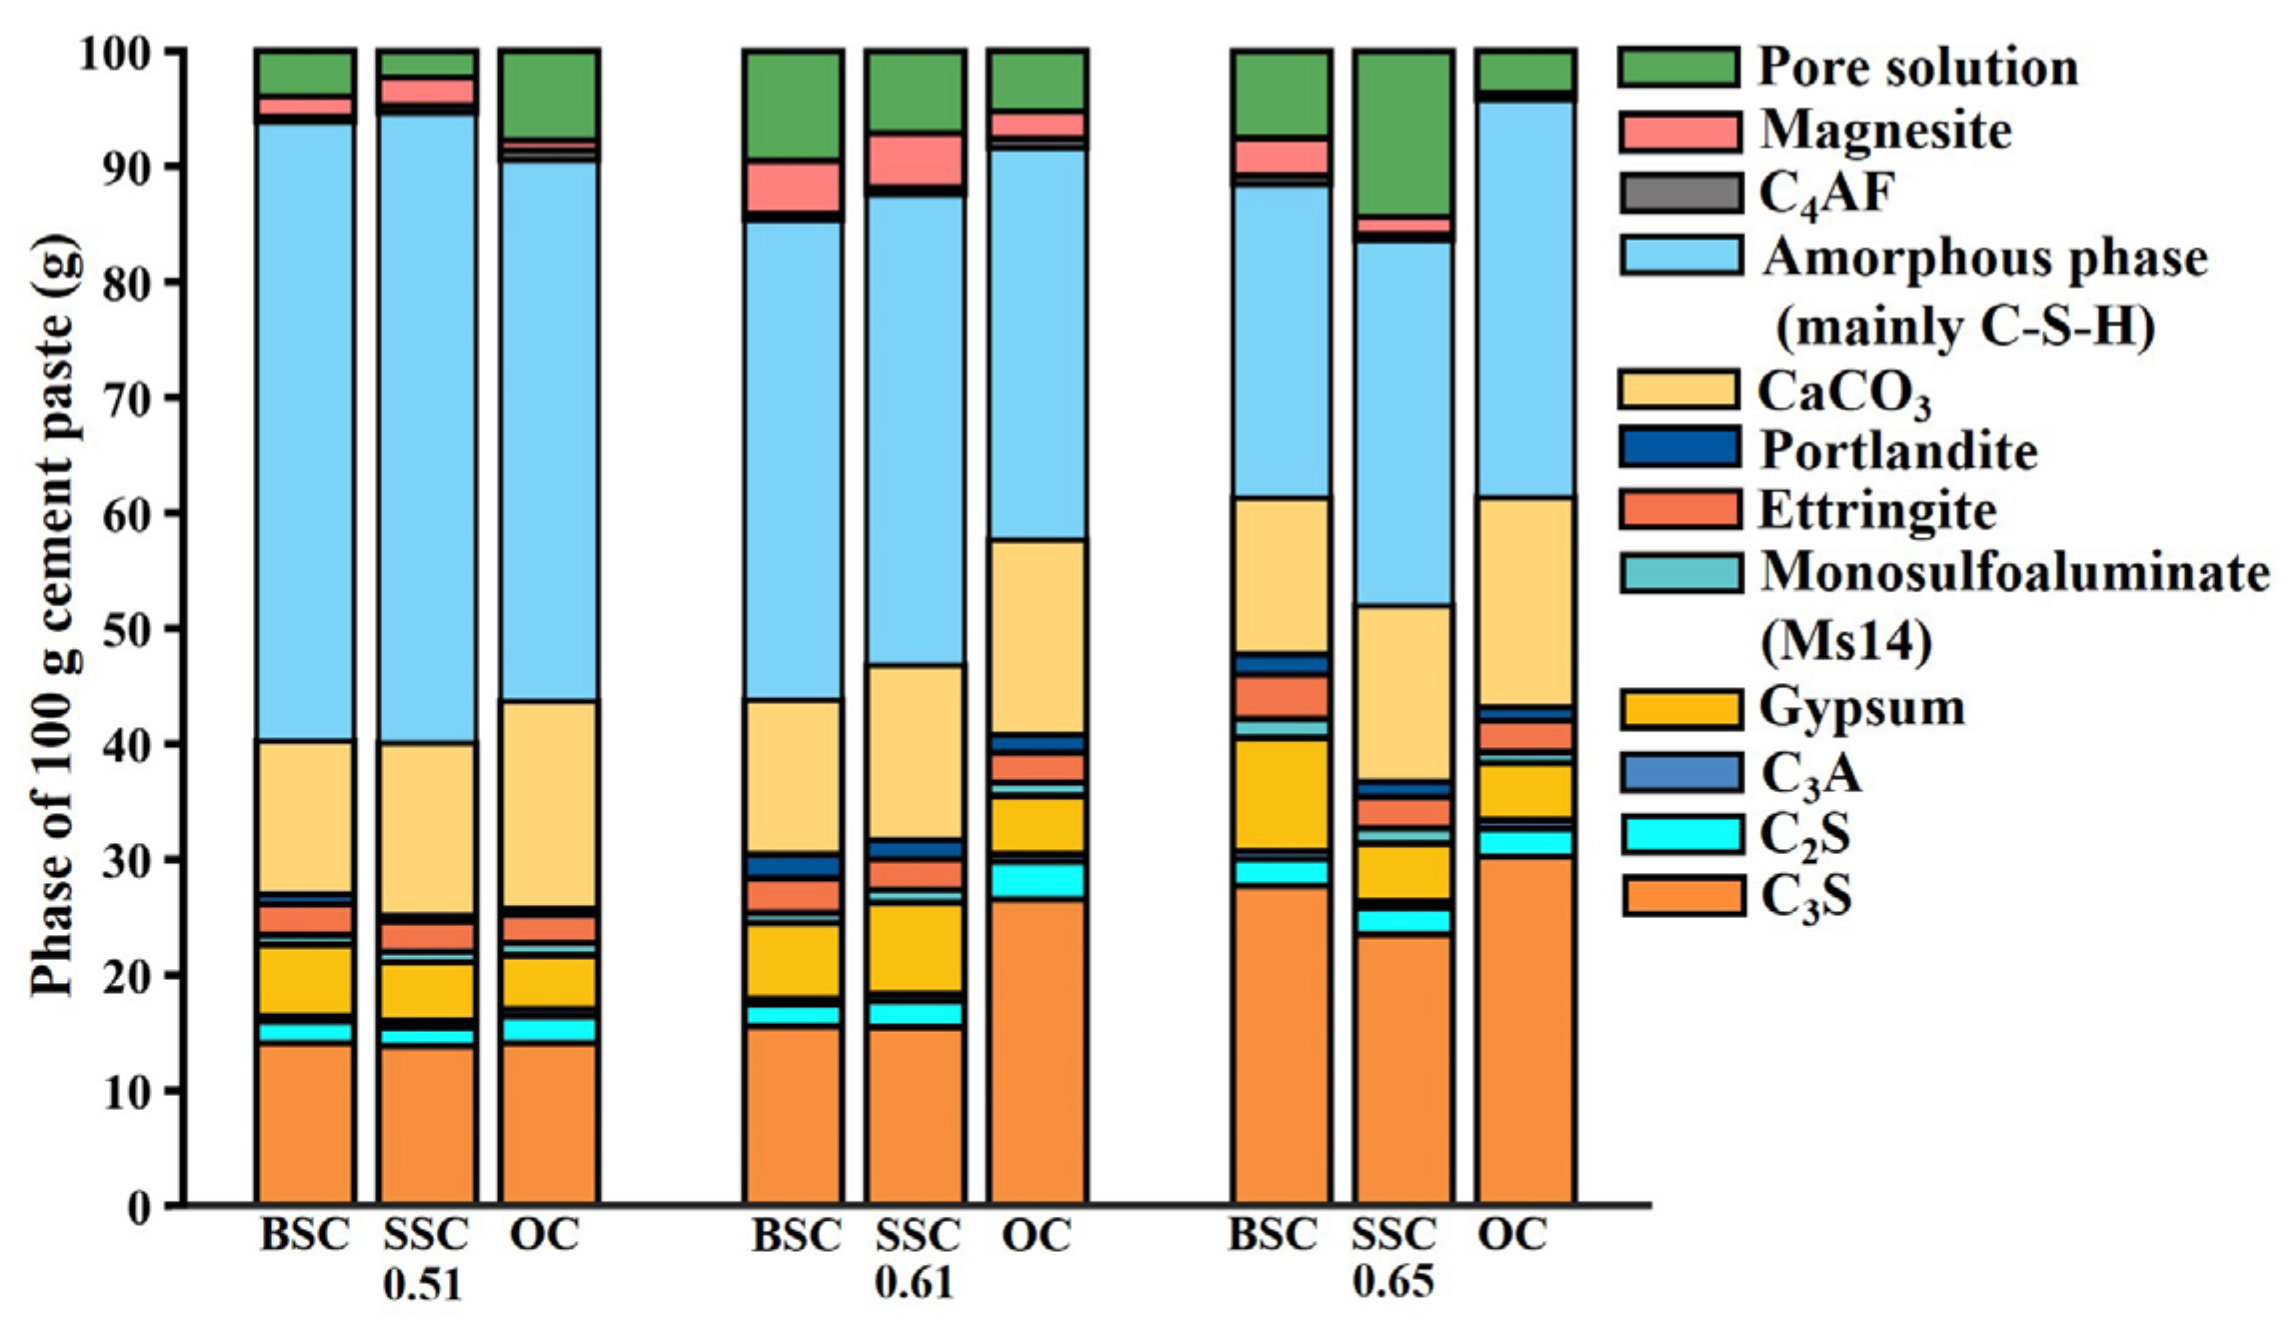
4.6. Semi-Quantitative Analysis of Concrete Phase

The mass fractions of the crystalline phases with K values can be calculated according to the XRD internal standard method and corrected by the TGA results. These known values for the K of the concrete phases are shown in Table 5. The C-S-H and other crystalline phases with unknown K values, called the amorphous phase, were obtained by subtracting 100 from the sum of the mass fractions of all phases with known K values in Table 5. The masses of major phases in 100 g of cement paste are displayed in Figure 13.

4.6.1. Amorphous Phase

C-S-H plays a dominant role in the mechanical and chemical properties of concrete. Although the mass fractions of C-S-H could not be directly and precisely quantified, the comparison of the amorphous phase among different concrete mixtures could reflect the relative difference of C-S-H as the amorphous phase is mainly represented by the C-S-H [60]. Figure 13 showed that the amorphous phase content gradually declined with the increasing w/c and the decrease in the compressive strength of concrete. The amorphous phase mass fraction of the BSC with the w/c of 0.51, 0.60, and 0.65 was 25.78% higher, 5.95% higher, and 25.13% lower than that of the corresponding OC, respectively. The difference in the amorphous phase content between BSC and SSC decreased with the decrease in the w/c.

4.6.2. AFm, Ettringite, and Gypsum

The content of AFm (a family of hydrated calcium aluminate phases), gypsum, and ettringite in all types of concrete increases with the increasing w/c. When the w/c was constant, taking the ratio of 0.51 as an example, the content of AFm in BSC and SSC was 24.06 and 12.2% lower than that of OC, respectively. The C3A formed during hydration reacted with gypsum to form ettringite when sulfate was depleted, C3A and C4AF started hydration again, and ettringite became unstable and gradually transformed to AFm, while BSC and SSC contained a large amount of sulfate, making ettringite stable in the cement paste which could explain why the AFm content of BSC and SSC was lower than that of OC. The content of ettringite in BSC and SSC was 12.19 and 8.15% higher than that of OC, respectively. In the process of hydration of cement paste, the proportion of AFm and ettringite in phases of concrete is a dynamic equilibrium. More AFm means less ettringite, which is important for qualitative analysis of the differences in hydration products in concrete prepared from different raw materials such as brine/seawater or sea sand. Regarding the gypsum, its content in BSC and SSC was higher 34.18 and 9.24% than that of OC, respectively. This was because the additional sulfate ions in seawater/brine and sea sand reacted with CH in the pore solution to produce the gypsum. A similar tendency could be observed among concrete specimens with the other two types of w/c.

4.6.3. Calcium Carbonate and Portlandite

All types of concrete contained a relatively high content of calcium carbonate which confirmed the existence of carbonization as mentioned in Section 4.5. The content of calcium carbonate increased as the w/c increased. This could be attributed to the relatively higher permeable pore volume in concrete with a higher w/c, which caused CO2 from the external environment to diffuse more rapidly in the concrete. It is worth mentioning that when the w/c was constant, taking the w/c of 0.51 as an example, the content of calcium carbonate in BSC and SSC was 26.24 and 16.42% lower than that of OC, respectively. A similar tendency could also be observed in concrete specimens with the other two types of w/c.
This is because the lower volume of capillary pores can reduce the diffusion rate of CO2 in the capillary pores [21]. This implied that the carbonization resistance of BSC and SSC was better than that of OC and that the increasing salinity could improve the carbonation resistance of concrete. A similar conclusion was also found in the study of Liu et al. [21]. Furthermore, the content of CH was insignificant without clear evidence with the change of w/c and type of concrete. As CH could react with sulfate and be consumed during carbonization, the carbonization caused the chemical reaction with CH quite complicated in BSC and SSC. It was, therefore, difficult to directly assess the effect of the additional chemical ions in BSC and SSC on the content of CH in concrete.

4.6.4. C3S, C2S, C3A and C4AF

Figure 13 reveals a minor variation in the content of C3A and C4AF with the change in w/c. When the w/c was 0.51, the content of C3S and C2S in BSC was 0.16 and 21.86% lower than OC, respectively. Moreover, the mass fraction of C3S and C2S in SSC was 1.76 and 31.02% lower than in OC, respectively. This demonstrated that more C3S and C2S were consumed in BSC and SSC to generate C-S-H, consistent with the conclusion of higher content of the amorphous phase in BSC and SSC than that of OC in Section 4.6.1. In addition, the mass fraction of C3A in BSC and SSC was 23.21 and 6.7% lower than that of OC, which was also consistent with the analysis results in Section 4.6.2. Similarly, the concrete with the other two w/c also had similar features.

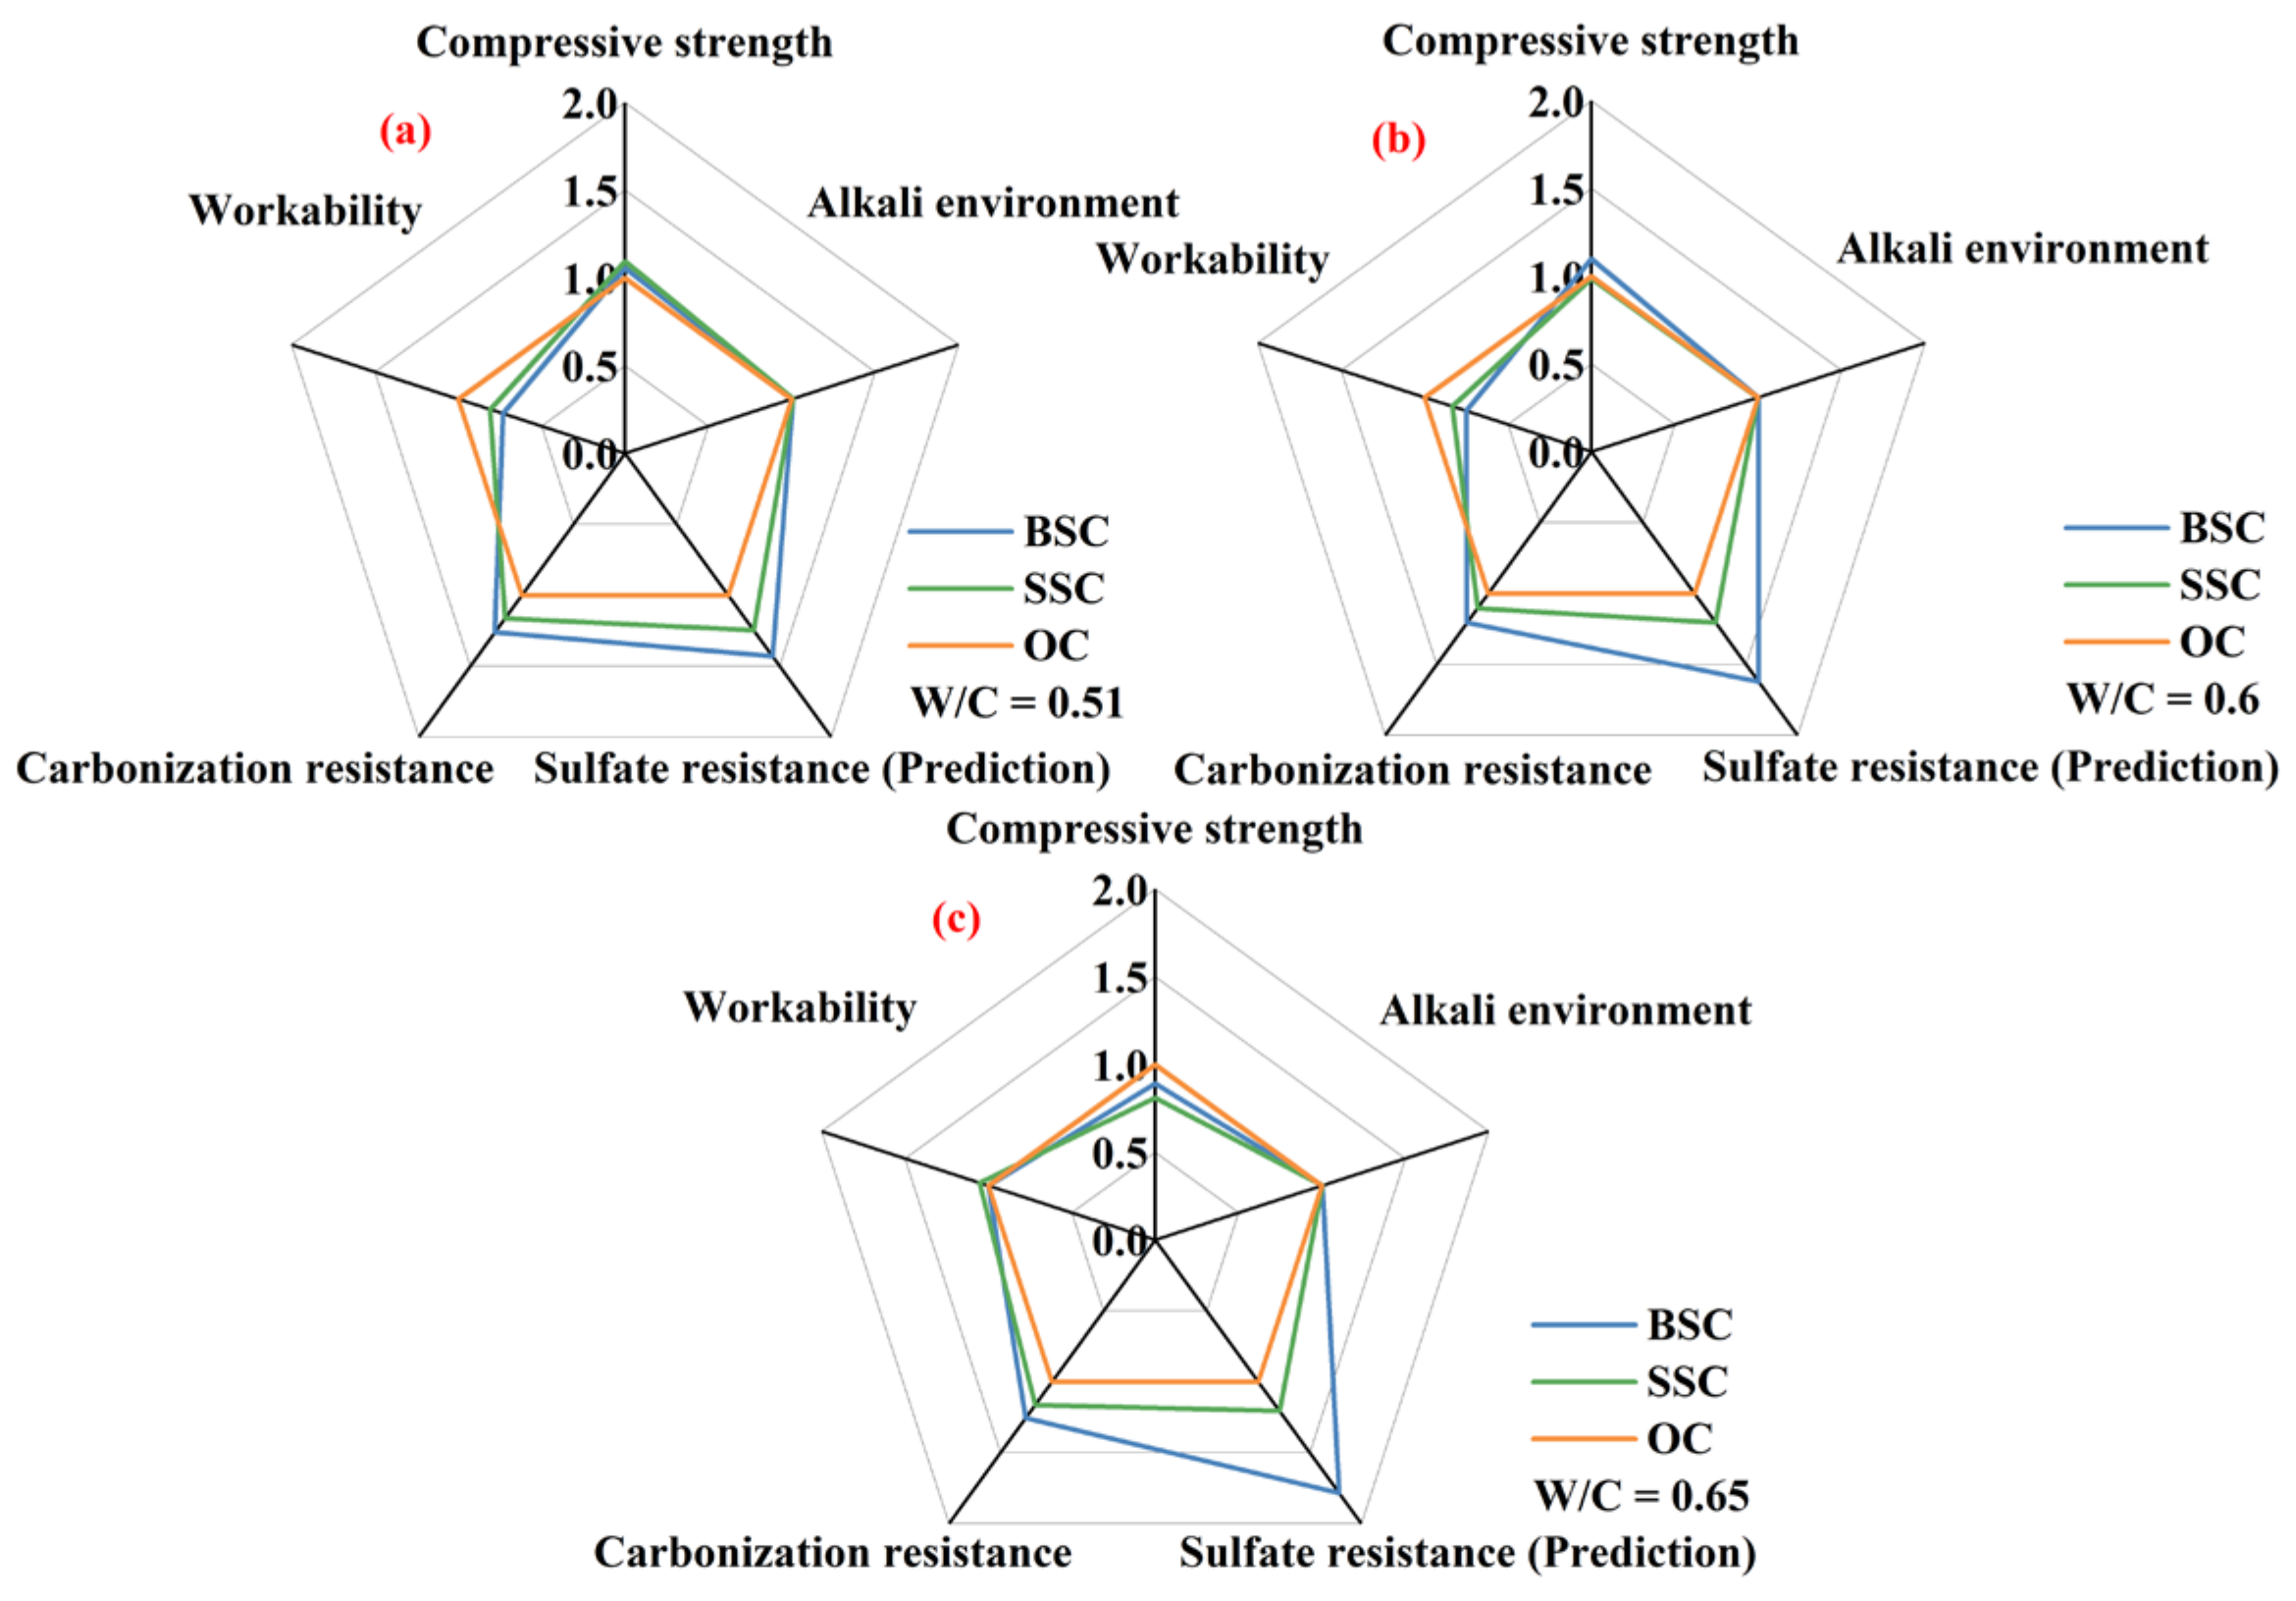
4.7. Performance Evaluation of BSC and SSC

The performance of BSC and SSC was quantitively evaluated by five indexes and compared with OC. The five indexes are compressive strength, workability (slump), alkali environment (pH), carbonization resistance, and sulfate resistance. The content of CaCO3 quantified the index value of carbonization resistance according to the semi-quantitative analysis. The index value of sulfate resistance was quantified by the pore volume of large capillary pores based on the quantitative study in Section 4.4. Among these indexes, the first two reflected short-term performance, and the following three indexes reflected the potential durability of different concrete under adverse environmental impact. The value of each index for BSC and SSC was normalized by the index value of OC and illustrated in the radar charts (Figure 14).
  • In short-term performance, the difference in compressive strength between BSC/SSC and OC was minor when w/c was 0.51 and 0.6, while the compressive strengths of BSC and SSC with w/c of 0.65 were reduced by 10.82 and 19.05% compared to OC, respectively. The strength-based design for ordinary concrete applies to BSC and SSC.
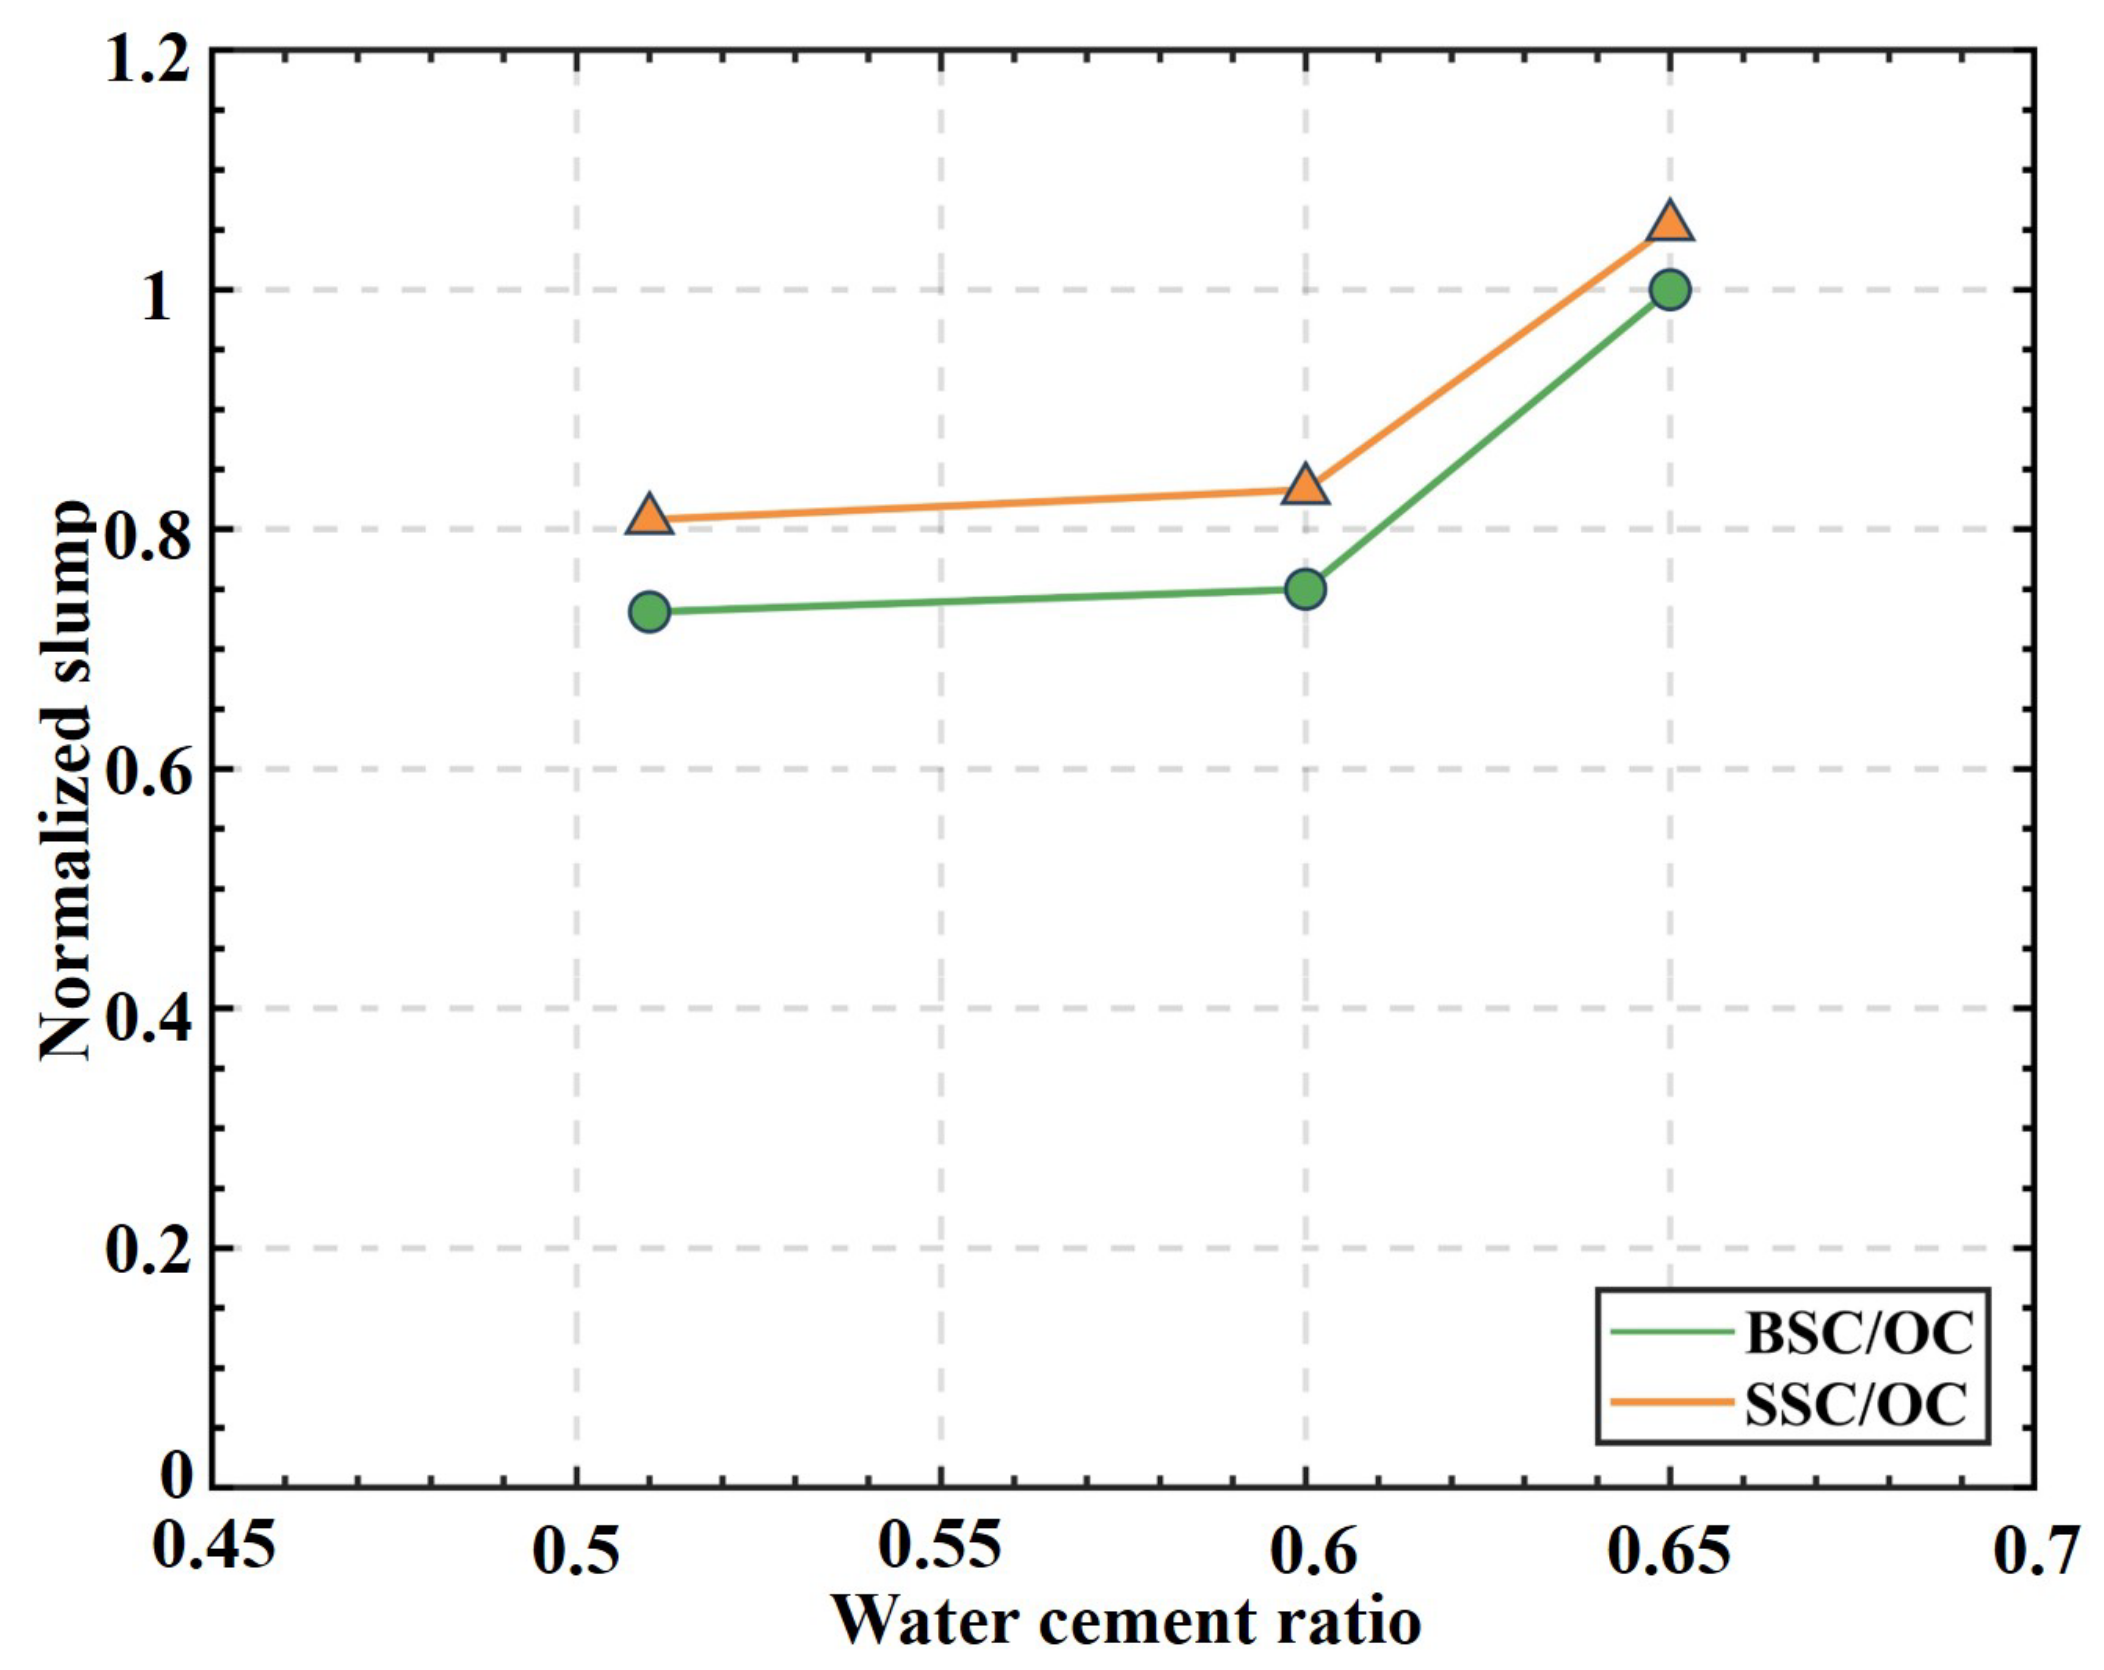
  • Although the workability of all concrete satisfied the requirement of infrastructural construction in the code GB50164-2011 [51], the reduction effect on the slump could be observed with the increase in salinity. Therefore, the water-consuming design should be re-examined for BSC and SSC, especially for BSC and SSC with a low w/c and high workability demand.
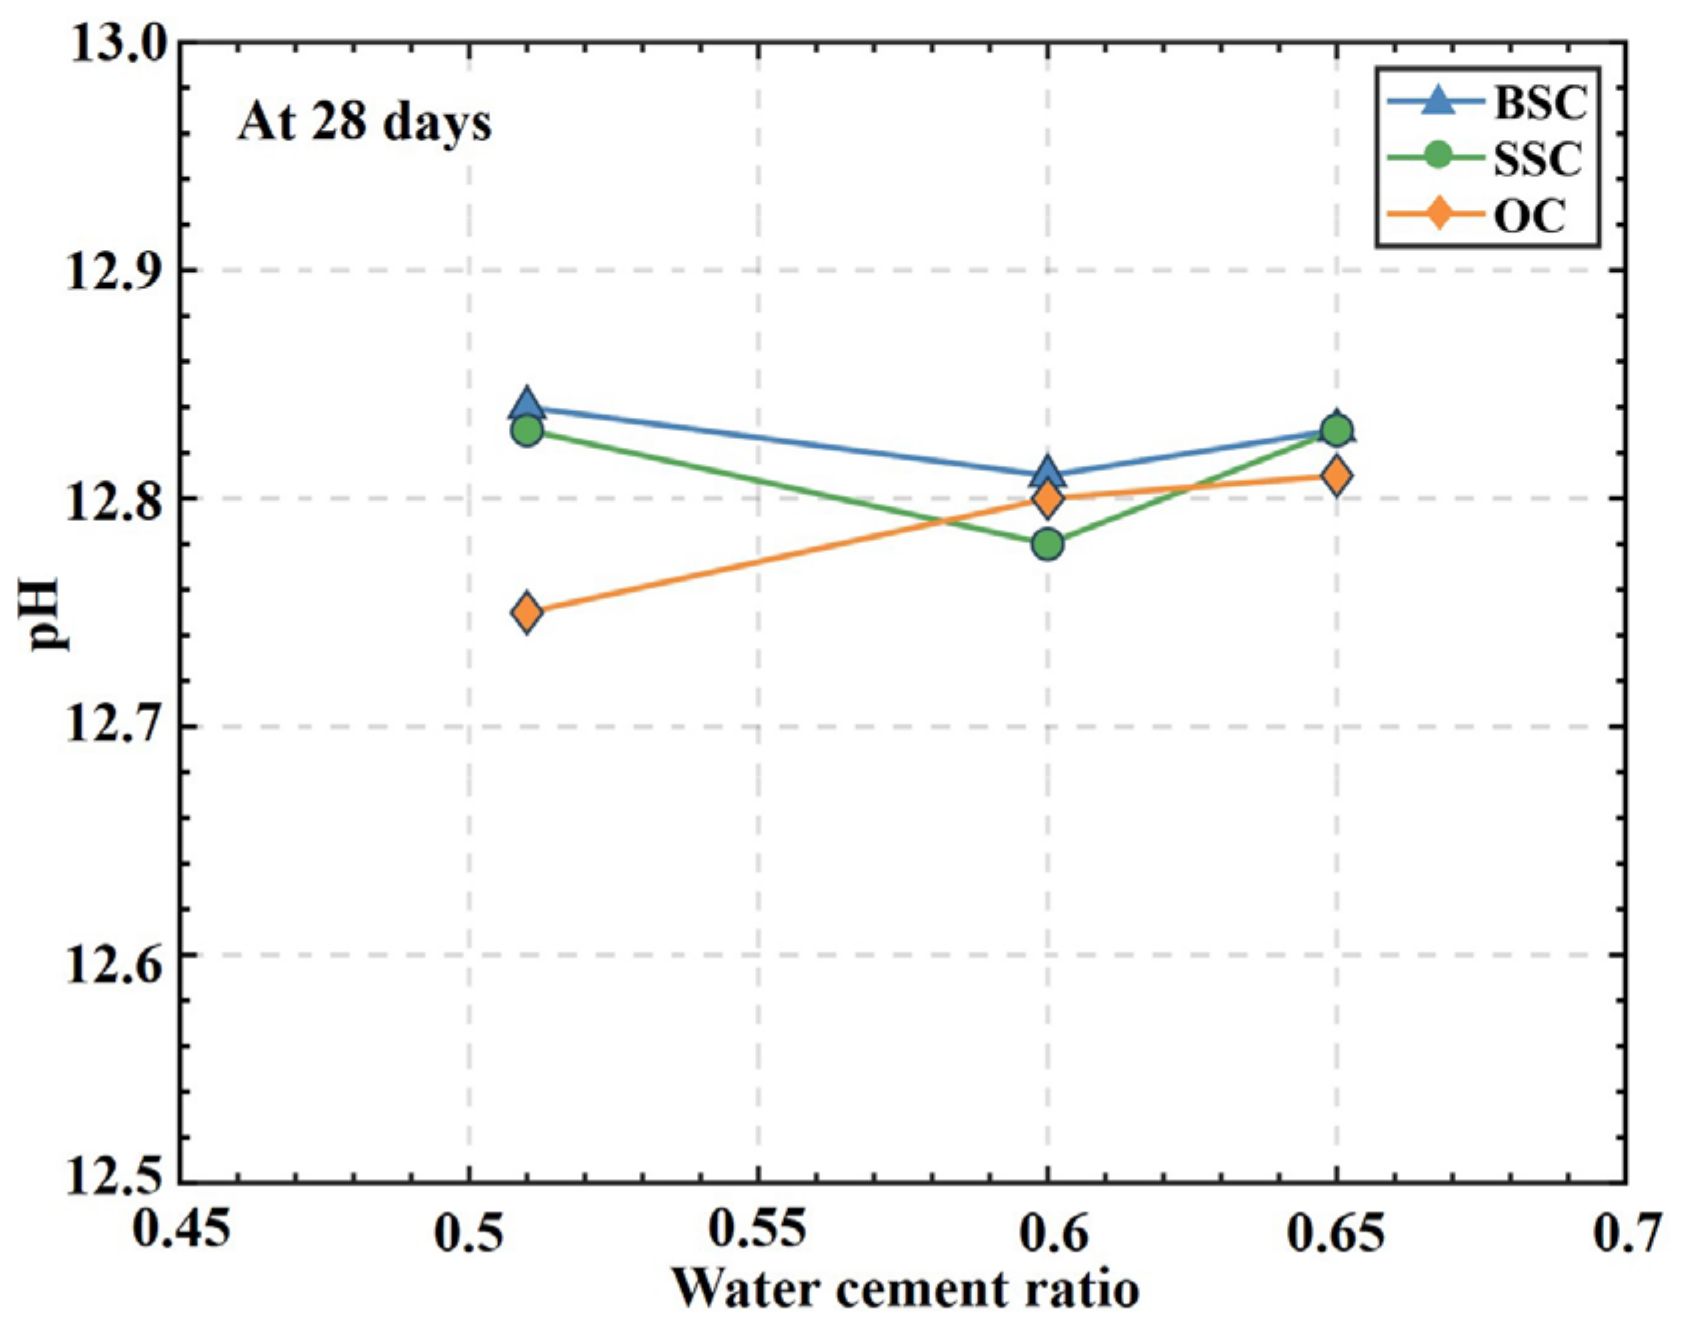
  • Regarding the long-term performance, the pH value of BSC and SSC was slightly larger than that of OC but within the conventional range of concrete. Therefore, it demonstrated no significant effect of the introduction of chemical ions in brine/seawater or sea sand on the pH value in concrete. This is valuable information for the application of FRP bars in BSC and SSC as the mechanical properties of FRP materials are more sensitive to alkali environments.
  • By comparing the quantity of carbonization product, it could be found that the index of carbonization resistance was the largest for BSC and the lowest for OC. The w/c variation had a minor effect on the index difference among different concrete mixtures with the same w/c.
  • The effect of the w/c on the pore volume of large capillary pores in OC and SSC was more significant than in BSC, while the reduction effect on the volume of large capillary pores in BSC by reducing the w/c was limited. It indicated that the sulfate resistance difference between BSC and OC notably turned smaller with the decrease of the w/c. In general, among three different concrete mixtures with a w/c between 0.51 and 0.65, the sulfate resistance of BSC was the best, and that of SSC was next.
In general, the performance of both BSC and SSC is comparable to the OC from the above aspects. There was no significant difference in the short-term performance between BSC and SSC with the increase in salinity. The BSC and SSC even had better durability in terms of carbonization and sulfate resistance. Therefore, it is feasible to use either brine or seawater to replace freshwater for marine structural concrete reinforced with FRP rebars.

5. Conclusions

In this work, the macro and micro properties of three concrete mixtures, BSC, SSC, and OC were experimentally investigated through the compressive strength test, slump test, pH value test, MIP, XRD, TGA, and SEM test. The influence of salt from the brine, seawater, and sea sand on the short-term properties was analyzed, and the long-term durability was predicted. The following conclusions can be drawn as follows.
  • Under the same w/c, the 7-day compressive strengths of BSC and SSC were higher than that of OC (except for a w/c of 0.65), and the 28-day compressive strengths of BSC, SSC, and OC had a difference within 5.56–9.36%. From the short-term strength perspective, the salinity had a minor effect on the mechanical properties of concrete.
  • The increasing salinity had a reducing effect on the slump of concrete. For the concrete with a w/c between 0.51 and 0.65, the reduction effect could be neglected. However, for high-performance concrete with a lower w/c, it is necessary to add admixtures to enhance the workability.
  • Regardless of whether it is BSC, SSC, or OC, the volume of porosity increases with the w/c. The pore volume of large capillary pores in BSC and SSC was smaller than that of OC, especially for the concrete with a higher w/c, which implied the lower permeability of concrete. The analysis based on the difference in pore structure shows that BSC and SSC had better sulfate resistance than OC. In addition, the experimental results showed that the carbonization resistance of BSC and SSC was higher than that of OC. Therefore, the BSC and SSC’s durability could be better than the OC’s.
  • It was found that the phase difference was the presence of Friedel’s salt in BSC and SSC, but not in OC. Among the same phases in three types of concrete, the mass fraction of the amorphous phase, ettringite, and gypsum in BSC and SSC were greater than that of OC. In contrast, the mass fraction of AFm, C3S, and C2S in BSC and SSC was lower than in OC. The difference could be well explained by the increasing salinity and the resulting pore structural difference.
To sum up, the increasing salinity due to the introduction of brine, seawater, and sea sand has no adverse effect on concrete macro and micro properties. It is feasible to use marine wasters (brine) and resources (seawater and sea sand) to replace the traditional constituents for concrete, solve natural resource scarcity, and achieve green concrete reinforced with FRP for marine construction. The research output can foster the acceptance of BSC and SSC by the engineering community.

Author Contributions

Conceptualization, Y.C. and J.J.; methodology, Y.C., J.J., T.F. and S.L.; software, Y.C.; validation, Y.C., J.J. and T.F.; formal analysis, Y.C. and J.J.; investigation, Y.C.; resources, J.J.; data curation, Y.C.; writing—original draft preparation, Y.C.; writing—review and editing, Y.C., J.J., T.F. and S.L.; supervision, J.J.; funding acquisition, J.J. All authors have read and agreed to the published version of the manuscript.

Funding

This research was funded by the National Natural Science Foundation of China with No. 51978503, the Natural Science Foundation of Shanghai with No. 19ZR1460900, and the Fundamental Research Funds for the Central Universities.

Institutional Review Board Statement

Not applicable.

Informed Consent Statement

Not applicable.

Data Availability Statement

The data used to support the findings of this study are available from the corresponding author upon request.

Acknowledgments

The authors gratefully acknowledge the financial support provided by the National Natural Science Foundation of China with No. 51978503 and the Fundamental Research Funds for the Central Universities.

Conflicts of Interest

The authors declare no conflict of interest.

References

  1. Jones, E.; Qadir, M.; van Vliet, M.T.H.; Smakhtin, V.; Kang, S. The State of Desalination and Brine Production: A Global Outlook. Sci. Total Environ. 2019, 657, 1343–1356. [Google Scholar] [CrossRef] [PubMed]
  2. Eke, J.; Yusuf, A.; Giwa, A.; Sodiq, A. The Global Status of Desalination: An Assessment of Current Desalination Technologies, Plants and Capacity. Desalination 2020, 495, 114633. [Google Scholar] [CrossRef]
  3. Virgili, F.; Brown, H.; Pankratz, T. IDA Desalination Yearbook 2017–2018; Media Analytics Ltd.: Oxford, UK, 2019. [Google Scholar]
  4. Huang, L.; Wang, D.; He, C.; Pan, M.; Zhang, B.; Chen, Q.; Ren, J. Industrial Wastewater Desalination under Uncertainty in Coal-Chemical Eco-Industrial Parks. Resour. Conserv. Recycl. 2019, 145, 370–378. [Google Scholar] [CrossRef]
  5. Van Wyk, S.; van der Ham, A.G.J.; Kersten, S.R.A. Analysis of the Energy Consumption of Supercritical Water Desalination (SCWD). Desalination 2020, 474, 114189. [Google Scholar] [CrossRef]
  6. Sánchez-Lizaso, J.L.; Romero, J.; Ruiz, J.; Gacia, E.; Buceta, J.L.; Invers, O.; Fernández Torquemada, Y.; Mas, J.; Ruiz-Mateo, A.; Manzanera, M. Salinity Tolerance of the Mediterranean Seagrass Posidonia Oceanica: Recommendations to Minimize the Impact of Brine Discharges from Desalination Plants. Desalination 2008, 221, 602–607. [Google Scholar] [CrossRef]
  7. Hancock, N.T.; Black, N.D.; Cath, T.Y. A Comparative Life Cycle Assessment of Hybrid Osmotic Dilution Desalination and Established Seawater Desalination and Wastewater Reclamation Processes. Water Res. 2012, 46, 1145–1154. [Google Scholar] [CrossRef] [PubMed]
  8. Backer, S.N.; Bouaziz, I.; Kallayi, N.; Thomas, R.T.; Preethikumar, G.; Takriff, M.S.; Laoui, T.; Atieh, M.A. Review: Brine Solution: Current Status, Future Management and Technology Development. Sustainability 2022, 14, 6752. [Google Scholar] [CrossRef]
  9. Miller, S.A.; Horvath, A.; Monteiro, P.J.M. Impacts of Booming Concrete Production on Water Resources Worldwide. Nat. Sustain. 2018, 1, 69–76. [Google Scholar] [CrossRef]
  10. Wang, X. Study on Legal Issues of Mining and Utilization and Protection of River Gravel Resources in China. Master’s Thesis, China University of Geosciences, Beijing, China, 2020. [Google Scholar]
  11. Da, B.; Chen, Y.; Yu, H.; Ma, H.; Chen, D.; Wu, Z.; Liu, J.; Li, Y. Preparation Technology, Mechanical Properties and Durability of Coral Aggregate Seawater Concrete in the Island-Reef Environment. J. Clean. Prod. 2022, 339, 130572. [Google Scholar] [CrossRef]
  12. Jackson, M.D.; Chae, S.R.; Mulcahy, S.R.; Meral, C.; Taylor, R.; Li, P.; Emwas, A.-H.; Moon, J.; Yoon, S.; Vola, G.; et al. Unlocking the Secrets of Al-Tobermorite in Roman Seawater Concrete. Am. Mineral. 2013, 98, 1669–1687. [Google Scholar] [CrossRef]
  13. Younis, A.; Ebead, U.; Suraneni, P.; Nanni, A. Fresh and Hardened Properties of Seawater-Mixed Concrete. Constr. Build. Mater. 2018, 190, 276–286. [Google Scholar] [CrossRef]
  14. Yang, E.-I.; Yi, S.-T.; Leem, Y.-M. Effect of Oyster Shell Substituted for Fine Aggregate on Concrete Characteristics: Part I. Fundamental Properties. Cem. Concr. Res. 2005, 35, 2175–2182. [Google Scholar] [CrossRef]
  15. Safi, B.; Saidi, M.; Daoui, A.; Bellal, A.; Mechekak, A.; Toumi, K. The Use of Seashells as a Fine Aggregate (by Sand Substitution) in Self-Compacting Mortar (SCM). Constr. Build. Mater. 2015, 78, 430–438. [Google Scholar] [CrossRef]
  16. Pan, D.; Yaseen, S.A.; Chen, K.; Niu, D.; Ying Leung, C.K.; Li, Z. Study of the Influence of Seawater and Sea Sand on the Mechanical and Microstructural Properties of Concrete. J. Build. Eng. 2021, 42, 103006. [Google Scholar] [CrossRef]
  17. Li, P.; Li, W.; Yu, T.; Qu, F.; Tam, V.W.Y. Investigation on Early-Age Hydration, Mechanical Properties and Microstructure of Seawater Sea Sand Cement Mortar. Constr. Build. Mater. 2020, 249, 118776. [Google Scholar] [CrossRef]
  18. Xu, Q.; Ji, T.; Yang, Z.; Ye, Y. Preliminary Investigation of Artificial Reef Concrete with Sulphoaluminate Cement, Marine Sand and Sea Water. Constr. Build. Mater. 2019, 211, 837–846. [Google Scholar] [CrossRef]
  19. Xiao, J.; Qiang, C.; Nanni, A.; Zhang, K. Use of Sea-Sand and Seawater in Concrete Construction: Current Status and Future Opportunities. Constr. Build. Mater. 2017, 155, 1101–1111. [Google Scholar] [CrossRef]
  20. Wang, J.; Liu, E.; Li, L. Multiscale Investigations on Hydration Mechanisms in Seawater OPC Paste. Constr. Build. Mater. 2018, 191, 891–903. [Google Scholar] [CrossRef]
  21. Liu, W.; Cui, H.; Dong, Z.; Xing, F.; Zhang, H.; Lo, T.Y. Carbonation of Concrete Made with Dredged Marine Sand and Its Effect on Chloride Binding. Constr. Build. Mater. 2016, 120, 1–9. [Google Scholar] [CrossRef]
  22. Li, Q.; Geng, H.; Shui, Z.; Huang, Y. Effect of Metakaolin Addition and Seawater Mixing on the Properties and Hydration of Concrete. Appl. Clay Sci. 2015, 115, 51–60. [Google Scholar] [CrossRef]
  23. Etxeberria, M.; Fernandez, J.M.; Limeira, J. Secondary Aggregates and Seawater Employment for Sustainable Concrete Dyke Blocks Production: Case Study. Constr. Build. Mater. 2016, 113, 586–595. [Google Scholar] [CrossRef]
  24. González, J.A.; Ramírez, E.; Bautista, A. Protection of Steel Embedded in Chloride-Containing Concrete by Means of Inhibitors. Cem. Concr. Res. 1998, 28, 577–589. [Google Scholar] [CrossRef]
  25. Kobayashi, K. Deterioration Mechanism of Concrete Structures Due to Steel Corrosion. Dobokuseko 1984, 25, 20–26. [Google Scholar]
  26. Ebead, U.; Lau, D.; Lollini, F.; Nanni, A.; Suraneni, P.; Yu, T. A Review of Recent Advances in the Science and Technology of Seawater-Mixed Concrete. Cem. Concr. Res. 2022, 152, 106666. [Google Scholar] [CrossRef]
  27. Teng, J.; Yu, T.; Dai, J.; Chen, G. FRP Composites in New Construction: Current Status and Opportunities. In Proceedings of the 7th National Conference on FRP Composites in Infrastructure, Hangzhou, China, 14 October 2011. [Google Scholar]
  28. Zhang, Y.; Wei, Y.; Bai, J.; Wu, G.; Dong, Z. A Novel Seawater and Sea Sand Concrete Filled FRP-Carbon Steel Composite Tube Column: Concept and Behaviour. Compos. Struct. 2020, 246, 112421. [Google Scholar] [CrossRef]
  29. Mirdarsoltany, M.; Abed, F.; Homayoonmehr, R.; Alavi Nezhad Khalil Abad, S.V. A Comprehensive Review of the Effects of Different Simulated Environmental Conditions and Hybridization Processes on the Mechanical Behavior of Different FRP Bars. Sustainability 2022, 14, 8834. [Google Scholar] [CrossRef]
  30. Younis, A.; Ebead, U.; Judd, S. Life Cycle Cost Analysis of Structural Concrete Using Seawater, Recycled Concrete Aggregate, and GFRP Reinforcement. Constr. Build. Mater. 2018, 175, 152–160. [Google Scholar] [CrossRef]
  31. Panagopoulos, A.; Haralambous, K.-J.; Loizidou, M. Desalination Brine Disposal Methods and Treatment Technologies—A Review. Sci. Total Environ. 2019, 693, 133545. [Google Scholar] [CrossRef]
  32. GB175-2020; Common Portland Cement. China Planning Press: Beijing, China, 2020.
  33. ASTM D1141–2021; Standard Practice for the Preparation of Substitute Ocean Water. ASTM International: West Conshohocken, PA, USA, 2021.
  34. Thabit, M.S.; Hawari, A.H.; Ammar, M.H.; Zaidi, S.; Zaragoza, G.; Altaee, A. Evaluation of Forward Osmosis as a Pretreatment Process for Multi Stage Flash Seawater Desalination. Desalination 2019, 461, 22–29. [Google Scholar] [CrossRef]
  35. Ji, X.S.; Curcio, E.; Al Obaidani, S.; Di Profio, G.; Fontananova, E.; Drioli, E. Membrane Distillation-Crystallization of Seawater Reverse Osmosis Brines. Sep. Purif. Technol. 2010, 71, 76–82. [Google Scholar] [CrossRef]
  36. Loizides, L. The Cost of Environmental and Social Sustainability of Desalination. In Proceedings of the International Conference on Desalination Costing, Limassol, Cyprus, December 2004. [Google Scholar]
  37. Ahmed, M.; Shayya, W.H.; Hoey, D.; Al-Handaly, J. Brine Disposal from Reverse Osmosis Desalination Plants in Oman and the United Arab Emirates. Desalination 2001, 133, 135–147. [Google Scholar] [CrossRef]
  38. Sadhwani, J.J.; Veza, J.M.; Santana, C. Case Studies on Environmental Impact of Seawater Desalination. Desalination 2005, 185, 1–8. [Google Scholar] [CrossRef]
  39. Al Mutaz, I.S.; Wagialia, K.M. Production of Magnesium from Desalination Brines. Resour. Conserv. Recycl. 1990, 3, 231–239. [Google Scholar] [CrossRef]
  40. Melián-Martel, N.; Sadhwani Alonso, J.J.; Pérez Báez, S.O. Reuse and Management of Brine in Sustainable SWRO Desalination Plants. Desalin. Water Treat. 2013, 51, 560–566. [Google Scholar] [CrossRef]
  41. Sanmartino, J.A.; Khayet, M.; García-Payo, M.C.; El-Bakouri, H.; Riaza, A. Treatment of Reverse Osmosis Brine by Direct Contact Membrane Distillation: Chemical Pretreatment Approach. Desalination 2017, 420, 79–90. [Google Scholar] [CrossRef]
  42. Alkhudhiri, A.; Hilal, N. Emerging Technologies for Sustainable Desalination Handbook; Butterworth-Heinemann: Oxford, UK, 2018. [Google Scholar]
  43. Lior, N.; Kim, D. Quantitative Sustainability Analysis of Water Desalination—A Didactic Example for Reverse Osmosis. Desalination 2018, 431, 157–170. [Google Scholar] [CrossRef]
  44. Kayvani Fard, A.; Rhadfi, T.; Khraisheh, M.; Atieh, M.A.; Khraisheh, M.; Hilal, N. Reducing Flux Decline and Fouling of Direct Contact Membrane Distillation by Utilizing Thermal Brine from MSF Desalination Plant. Desalination 2016, 379, 172–181. [Google Scholar] [CrossRef]
  45. JGJ 52; Standard for Technical Requirements and Test Method of Sand and Crushed Stone (or Gravel) for Ordinary Concrete. China Architecture & Building Press: Beijing, China, 2006.
  46. JGJ206-2010; Technical Code for Application of Sea Sand Concrete. China Architecture & Building Press: Beijing, China, 2010.
  47. Zhang, Q.; Xiao, J.; Zhang, P.; Zhang, K. Mechanical Behaviour of Seawater Sea-Sand Recycled Coarse Aggregate Concrete Columns under Axial Compressive Loading. Constr. Build. Mater. 2019, 229, 117050. [Google Scholar] [CrossRef]
  48. Liu, W.; Pu, Z.L.; Sun, H.F.; He, Z.M.; Xing, F. Study on the influencing factors of chloride ion content in sea sand. J. Build. Mater. 2016, 19, 921–925+932. [Google Scholar]
  49. Dong, Z.Q.; Wu, G.; Xu, Y.Q. Experimental Study on the Bond Durability between Steel-FRP Composite Bars (SFCBs) and Sea Sand Concrete in Ocean Environment. Constr. Build. Mater. 2016, 115, 277–284. [Google Scholar] [CrossRef]
  50. Ramaswamy, S.; Aziz, M.; Murthy, C. Sea Dredged Sand for Concrete. In Extending Aggregate Resources; Hotaling, W., Ed.; ASTM International: West Conshohocken, PA, USA, 1982; pp. 167–177. ISBN 978-0-8031-0611-6. [Google Scholar]
  51. GB50164-2011; Standard of Quality Control of Concrete. China Planning Press: Beijing, China, 2011.
  52. JGJ55-2011; Specification for Mix Proportion Design of Ordinary Concrete. China Architecture & Building Press: Beijing, China, 2011.
  53. GB/T 50081; Standard for Test Methods of Concrete Physical and Mechanical Properties. China Architecture & Building Press: Beijing, China, 2019.
  54. ASTM C143/C143M-15a; Standard Test Method for Slump of Hydraulic-Cement Concrete. ASTM International: West Conshohocken, PA, USA, 2015.
  55. NYT 1377; Determination of Ph in Soil. Beijing, China, 2007. (In Chinese)
  56. Pan, F.; Wang, Y.H.; Chen, C. X-ray Diffraction Technique; Chemical industry Press: Beijing, China, 2016. (In Chinese) [Google Scholar]
  57. Geng, J.; Easterbrook, D.; Liu, Q.-F.; Li, L.-Y. Effect of Carbonation on Release of Bound Chlorides in Chloride-Contaminated Concrete. Mag. Concr. Res. 2016, 68, 353–363. [Google Scholar] [CrossRef] [Green Version]
  58. Kishar, E.A.; Ahmed, D.A.; Mohammed, M.R.; Noury, R. Effect of Calcium Chloride on the Hydration Characteristics of Ground Clay Bricks Cement Pastes. Beni-Suef Univ. J. Basic Appl. Sci. 2013, 2, 20–30. [Google Scholar] [CrossRef]
  59. Qu, F.; Li, W.; Wang, K.; Tam, V.W.Y.; Zhang, S. Effects of Seawater and Undesalted Sea Sand on the Hydration Products, Mechanical Properties and Microstructures of Cement Mortar. Constr. Build. Mater. 2021, 310, 125229. [Google Scholar] [CrossRef]
  60. Mehta, P.K.; Monteiro, P.J.M. Concrete: Microstructure, Properties, and Materials; McGraw-Hill: New York, NY, USA, 2006. [Google Scholar]
  61. Morales, C.N.; Claure, G.; Emparanza, A.R.; Nanni, A. Durability of GFRP Reinforcing Bars in Seawater Concrete. Constr. Build. Mater. 2021, 270, 121492. [Google Scholar] [CrossRef]
  62. Montanari, L.; Suraneni, P.; Tsui Chang, M.; Khatib, M.; Ebead, U.; Weiss, W.; Nanni, A. Hydration, Pore Solution, and Porosity of Cementitious Pastes Made with Seawater. J. Mater. Civ. Eng. 2019, 31, 04019154. [Google Scholar] [CrossRef]
  63. Zhao, Y.; Hu, X.; Shi, C.; Zhang, Z.; Zhu, D. A Review on Seawater Sea-Sand Concrete: Mixture Proportion, Hydration, Microstructure and Properties. Constr. Build. Mater. 2021, 295, 123602. [Google Scholar] [CrossRef]
  64. Zhang, J.Z.; Bian, F.; Zhang, Y.R.; Fang, Z.F.; Fu, C.Q.; Guo, J. Effect of Pore Structures on Gas Permeability and Chloride Diffusivity of Concrete. Constr. Build. Mater. 2018, 163, 402–413. [Google Scholar] [CrossRef]
  65. Scherer, G.W. Crystallization in Pores. Cem. Concr. Res. 1999, 29, 1347–1358. [Google Scholar] [CrossRef]
  66. Ikumi, T.; Segura, I. Numerical Assessment of External Sulfate Attack in Concrete Structures. A Review. Cem. Concr. Res. 2019, 121, 91–105. [Google Scholar] [CrossRef]
  67. Taylor, H.F.W.; Famy, C.; Scrivener, K.L. Delayed Ettringite Formation. Cem. Concr. Res. 2001, 31, 683–693. [Google Scholar] [CrossRef]
  68. Sánchez, I.; Nóvoa, X.R.; de Vera, G.; Climent, M.A. Microstructural Modifications in Portland Cement Concrete Due to Forced Ionic Migration Tests. Study by Impedance Spectroscopy. Cem. Concr. Res. 2008, 38, 1015–1025. [Google Scholar] [CrossRef]
  69. Mehta, P.K. Mechanism of Sulfate Attack on Portland Cement Concrete—Another Look. Cem. Concr. Res. 1983, 13, 401–406. [Google Scholar] [CrossRef]
  70. Müllauer, W.; Beddoe, R.E.; Heinz, D. Sulfate Attack Expansion Mechanisms. Cem. Concr. Res. 2013, 52, 208–215. [Google Scholar] [CrossRef]
  71. Cui, Y.X.; Xiong, H.B.; Liu, S.F.; Jiang, J.F.; Xiao, J.Z. Basic Mechanical Performances of Concentration Seawater-Sea Sand Concrete. In Proceedings of the Fib Shanghai Symposium, Shanghai, China, 22–24 November 2020. [Google Scholar]
Figure 1. Global distribution of operational desalination plants and capacities by sector user of produced water [1]. Reprinted with permission from Ref. [1]. 2018, Elsevier.
Sustainability 14 13340 g001
Figure 2. Gradation of sea sand from local area (Zhoushan).
Sustainability 14 13340 g002
Figure 3. Sampling and drilling diagram of specimens.
Sustainability 14 13340 g003
Figure 4. Normalized slump of BSC and SSC.
Sustainability 14 13340 g004
Figure 5. Compressive strength of concrete prepared by different raw materials.
Sustainability 14 13340 g005
Figure 6. pH value of BSC, SSC and OC.
Sustainability 14 13340 g006
Figure 7. Cumulative pore volume of BSC, SSC and OC at different w/c.
Sustainability 14 13340 g007
Figure 8. The pore size distribution of BSC, SSC and OC at different w/c.
Sustainability 14 13340 g008
Figure 9. Compressive strength of BSC, SSC, and OC under external sulfate attack.
Sustainability 14 13340 g009
Figure 10. TG/DTG analysis of BSC, SSC and OC. (a) TG/DTG with w/c of 0.51 in BSC, SSC, and OC. (b) TG/DTG with w/c of 0.51, 0.6, and 0.65 in BSC. (c) TG/DTG with w/c of 0.51, 0.6, and 0.65 in SSC. (d) TG/DTG with w/c of 0.51, 0.6, and 0.65 in OC.
Sustainability 14 13340 g010
Figure 11. XRD patterns of different samples. (a) XRD with w/c of 0.51 in BSC, SSC, and OC. (b) Local XRD with w/c of 0.51 in BSC, SSC, and OC. (c) XRD with w/c of 0.51, 0.6, and 0.65 in BSC. (d) Local XRD with w/c of 0.51, 0.6, and 0.65 in BSC. (e) XRD with w/c of 0.51, 0.6, and 0.65 in SSC. (f) Local XRD with w/c of 0.51, 0.6, and 0.65 in SSC.
Sustainability 14 13340 g011aSustainability 14 13340 g011b
Figure 12. SEM of BSC at w/c of 0.51: (a) microscopic morphology of gypsum, (b) microscopic morphology of C3A and AFm, (c) microscopic morphology of ettringite, (d) microscopic morphology of Mc and C-S-H.
Sustainability 14 13340 g012
Figure 13. Mass of hydration products of BSC, SSC and OC at different w/c.
Sustainability 14 13340 g013
Figure 14. Performance evaluation of BSC, SSC and OC (five-index radar chart)): (a) w/c = 0.51, (b) w/c = 0.6, (c) w/c = 0.65.
Sustainability 14 13340 g014
Table 1. Characteristics of seawater and brine in this study and from various regions.
TypeTechnology/SourceTDS
(mg/L)
C a 2 +
(mg/L)
N a +
(mg/L)
M g 2 +
(mg/L)
K +
(mg/L)
C l
(mg/L)
S O 4 2
(mg/L)
pHRef.
SeawaterArtificial seawater36,03241811,026131436419,85627658.2This study [33]
The west bay in Qatar43,47448612,952153545922,18431548.4[34]
Tyrrhenian Sea35,30044010,9001420-20,2502150-[35]
The Mediterranean Sea40,49845012,480145245022,09934068.1[36]
The United Arab Emirates40,59246411,900164057423,14927877.9[37]
The Gran Canaria38,00045011,415152045020,8003110-[38]
Arabian Gulf45,00060014,8001600-25,00034508.2[39]
BrineArtificial brine72,06483622,052262872839,7125530-This study
RO79,66096025,237286778141,8906050-[40]
RO55,00087915,2701864-31,15052647.9[41]
RO70,48879021,921247974338,8865316-[42]
RO68,96784521,070255078438,0145342-[42]
RO80,02889124,649287888843,66167457.8[43]
MSF57,40052118,434173849132,12740258.3[44]
MSF81,49272520,993250574035,37850419.1[34]
Notes: Desalination technology was mainly separated into two categories: (1) Reverse Osmosis (RO); (2) Multi-Stage Flash (MSF).
Table 2. Chloride ion content in sea sand in different areas.
Sea Sand in This Study (Zhoushan)FujianThe Pearl RiverYantianThe Yellow SeaChangi
Chloride ion (%)0.2380.0570.210.210.0820.286
ReferenceThis study[47][21][48][49][50]
Table 3. Concrete mixture proportions (kg/m3).
w/cWaterCementCoarse AggregateFine Aggregate
0.65197.36304.501129.41752.94
0.60197.66327.921152.54706.39
0.51198.26387.551151.55647.75
Table 4. Contribution porosity (%) of BSC, SSC and OC at different w/c.
Classification of Pore SizeBSC (0.65)SSC (0.65)OC (0.65)BSC (0.60)SSC (0.60)OC (0.60)BSC (0.51)SSC (0.51)OC (0.51)
<101.440.732.301.220.721.641.791.730.55
10–508.588.117.557.668.886.038.446.993.33
50–10001.344.926.202.114.455.591.592.102.79
>10006.176.022.905.953.193.325.753.992.80
Table 5. 2-Theta and the K value of the phase.
PhaseC3SC2SC3AGypsumMs 14EttringitePortlanditeCaCO3C4AFα-Al203
2-Theta (°)32.2832.1547.6320.729.8922.9434.0829.4233.71835.14
K Value0.80.763.161.832.970.451.422.241
Publisher’s Note: MDPI stays neutral with regard to jurisdictional claims in published maps and institutional affiliations.

