Article

Safety Warning of Mine Conveyor Belt Based on Binocular Vision

1
School of Mines, China University of Mining and Technology, Xuzhou 221116, China
2
School of Coal Engineering, Shanxi Datong University, Datong 037003, China
*
Author to whom correspondence should be addressed.
Sustainability 2022, 14(20), 13276; https://doi.org/10.3390/su142013276
Submission received: 19 September 2022 / Revised: 12 October 2022 / Accepted: 13 October 2022 / Published: 15 October 2022
(This article belongs to the Special Issue Sustainable Risk Management and Safety in Coal Mine)

Abstract

:
For the wear and damage to mine conveyor belts by foreign materials, such as large materials, this paper designs a volume measurement method for large materials based on binocular vision by the volume measurement of the large material inon the conveyor belt, provides safety-warning data of over-volume limits for mine conveyor belts, and prevents damage to the mine conveyor belts. In this design, first, by obtaining the binocular camera parameters to improve the image-edge information, images taken with a binocular camera were then aligned by the Bouguet stereo correction algorithm. Finally, the disparity map was calculated by the semi-global-block matching (SGBM) stereo matching, and to get the target 3D coordinates, volume measurements were performed by the micrometric method. The study shows that the experimental error remains at about 5.65%, which provides a low-cost measurement method for raw-coal-volume measurement of the well industry and coal-mine belt conveyor.

1. Introduction

As the world’s largest coal power producer and consumer, coal resources have played an indelible role in the development of China’s national economy [1]. Coal output is an important index of the economic benefit of coal mining enterprises, and the intelligent development of coal mines in China is in the primary stage. The innovation of theory and technology requires our continuous efforts to promote development [2,3]. As the key equipment of coal transportation, the mine conveyor belt is in the harsh environment of the mine. In the long-term use of a high-load conveyor belt, it is easily affected by foreign bodies such as large coal and gangue if not cleaned up in time, and in the process of falling they may cause partial deviation, skids, belt breaks, and longitudinal tear accidents. Light damage to the mining conveyor belt affects the safety of production and the economic benefits of the coal mine; heavy damage causes the conveyor belt to tear and deviate and other conditions occur, causing a foreign-body splash onto pedestrians near the belt, or it is a direct threat to the life and safety of mine workers. Concerning the occurrence of mining conveyor belt tears, deviations, and other abnormal phenomena, there are two detection methods: contact and non-contact types. Contact detection mainly determines the nonlinear deformation caused by pressure; this method has a low accuracy rate and is easy to damage. The non-contact detection method mainly includes an embedding method, ultrasonic method, X-ray detection, frequency emission method, and so on. The above methods are reliable, but the price is expensive and complex. The contactless detection method used in this paper is computer vision, setting the large material volume threshold as the limit, carrying an early warning of mine conveyer-belt safety; this method is low-cost, easy to maintain, and highly reliable. In an accurate measurement of a large material volume, it is helpful to monitor real-time damage of large materials and coal-storage materials to the mining conveyor belt, to maintain the safe use of mine conveyor belts and the safety of miners. It is of great significance.
Currently, the volume measurement method mainly adopts manual and instrument measurement methods. There are many limitations in manual measurement, such as many difficulties in measurement, long measurement time consumption, lack of real-time performance, large influence of artificial subjective factors, and serious limitations in the measurement environment. There are still many deficiencies in the contact electronic belt scale [4] in the instrument measurement, but the use of image processing and other technologies simplifies the production process, helps to control costs, and reflects the trend of digital visualization [5]. It meets the needs and development trend for the national construction of intelligent coal mines. Mi Yizhou [6] used binocular stereo vision to reconstruct the regular wrapping object in 3D, and obtained the coordinates of the four corners of the regular wrapping to calculate the wrapping volume, and this method is only valid for measuring regular objects; Shao Baofeng [7] proposed combining point lasers to obtain depth information and locate image feature points, but this method is only limited to regular objects, and the cost is relatively high compared to simple binocular cameras; Gao Ruxin et al. [8] used binocular stereo vision and the SURF (speed-up features) feature-matching algorithm to extract feature points to achieve volume calculation. However, the feature points in this method are relatively sparse, so a large error is generated to measure volume. In this paper, combined with the principle of binocular vision, this noncontact method for measuring irregular raw coal is proposed. The method includes camera calibration, image acquisition, image processing, correction and stereo matching, parallax acquisition, and volume calculation. The image processing and stereo matching are compared with various methods, and experimental verification is carried out.

2. The principle of Binocular Vision

2.1. Binocular Camera Model

Binocular stereo vision is established on the basis of the human visual system. Through the principle of parallax and similar triangles, the three-dimensional information of the object to be measured is obtained from multiple images [9]. As shown in Figure 1, the distance from a point in space to the imaging plane of the camera can be obtained according to the proportional relationship.
The points Pl and Pr in the figure are the image points of the point P on the imaging planes of the left and right cameras, respectively, and Z is expressed as the distance from the point P to the camera, which can be calculated by the following Equations (1)–(4):
d = | x l x r |
s = T ( x l x r )
T ( x l x r ) z f = T z
z = f T x l x r
where the distance from the left and right image points to the imaging surface is Xl and Xr, respectively, and d represents the parallax of point P on the binocular camera; the distance from point Pl to Pr is s; and the distance between the left and right cameras is T.

2.2. Camera Calibration

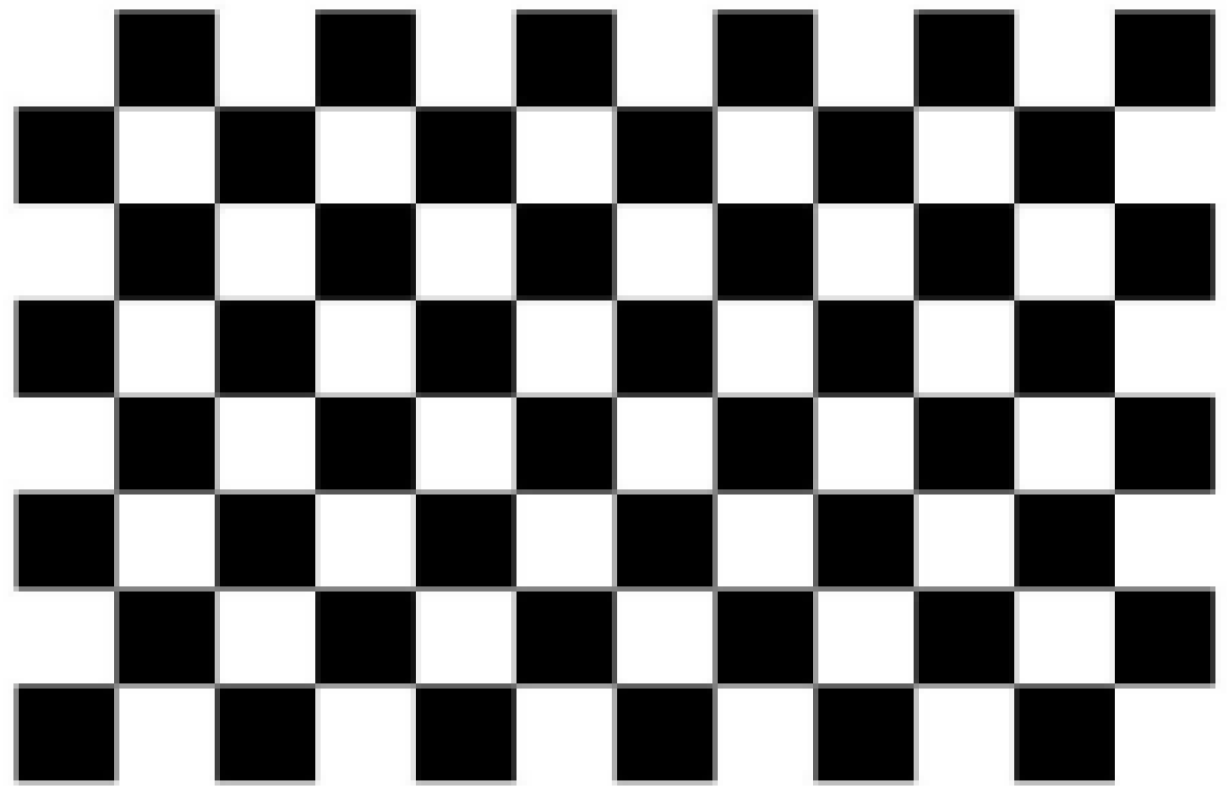
The parameters of the camera are obtained by Zhang Zhengyou’s calibration method [10] and images of different angles are taken for the checkerboard of Zhang’s calibration method, which makes the calibration results more accurate. In this paper, an 8 × 12 checkerboard is selected, and the grid size is 22 mm × 22 mm. The checkerboard for the experiment is shown in Figure 2.
During the shooting process, make sure that the binocular cameras are on the same horizontal line and then collect the calibration boards in different positions to ensure that the calibration boards in each photo account for about 1/4 of the camera. In the collected photos, name the left and right cameras respectively and store in two folders respectively.
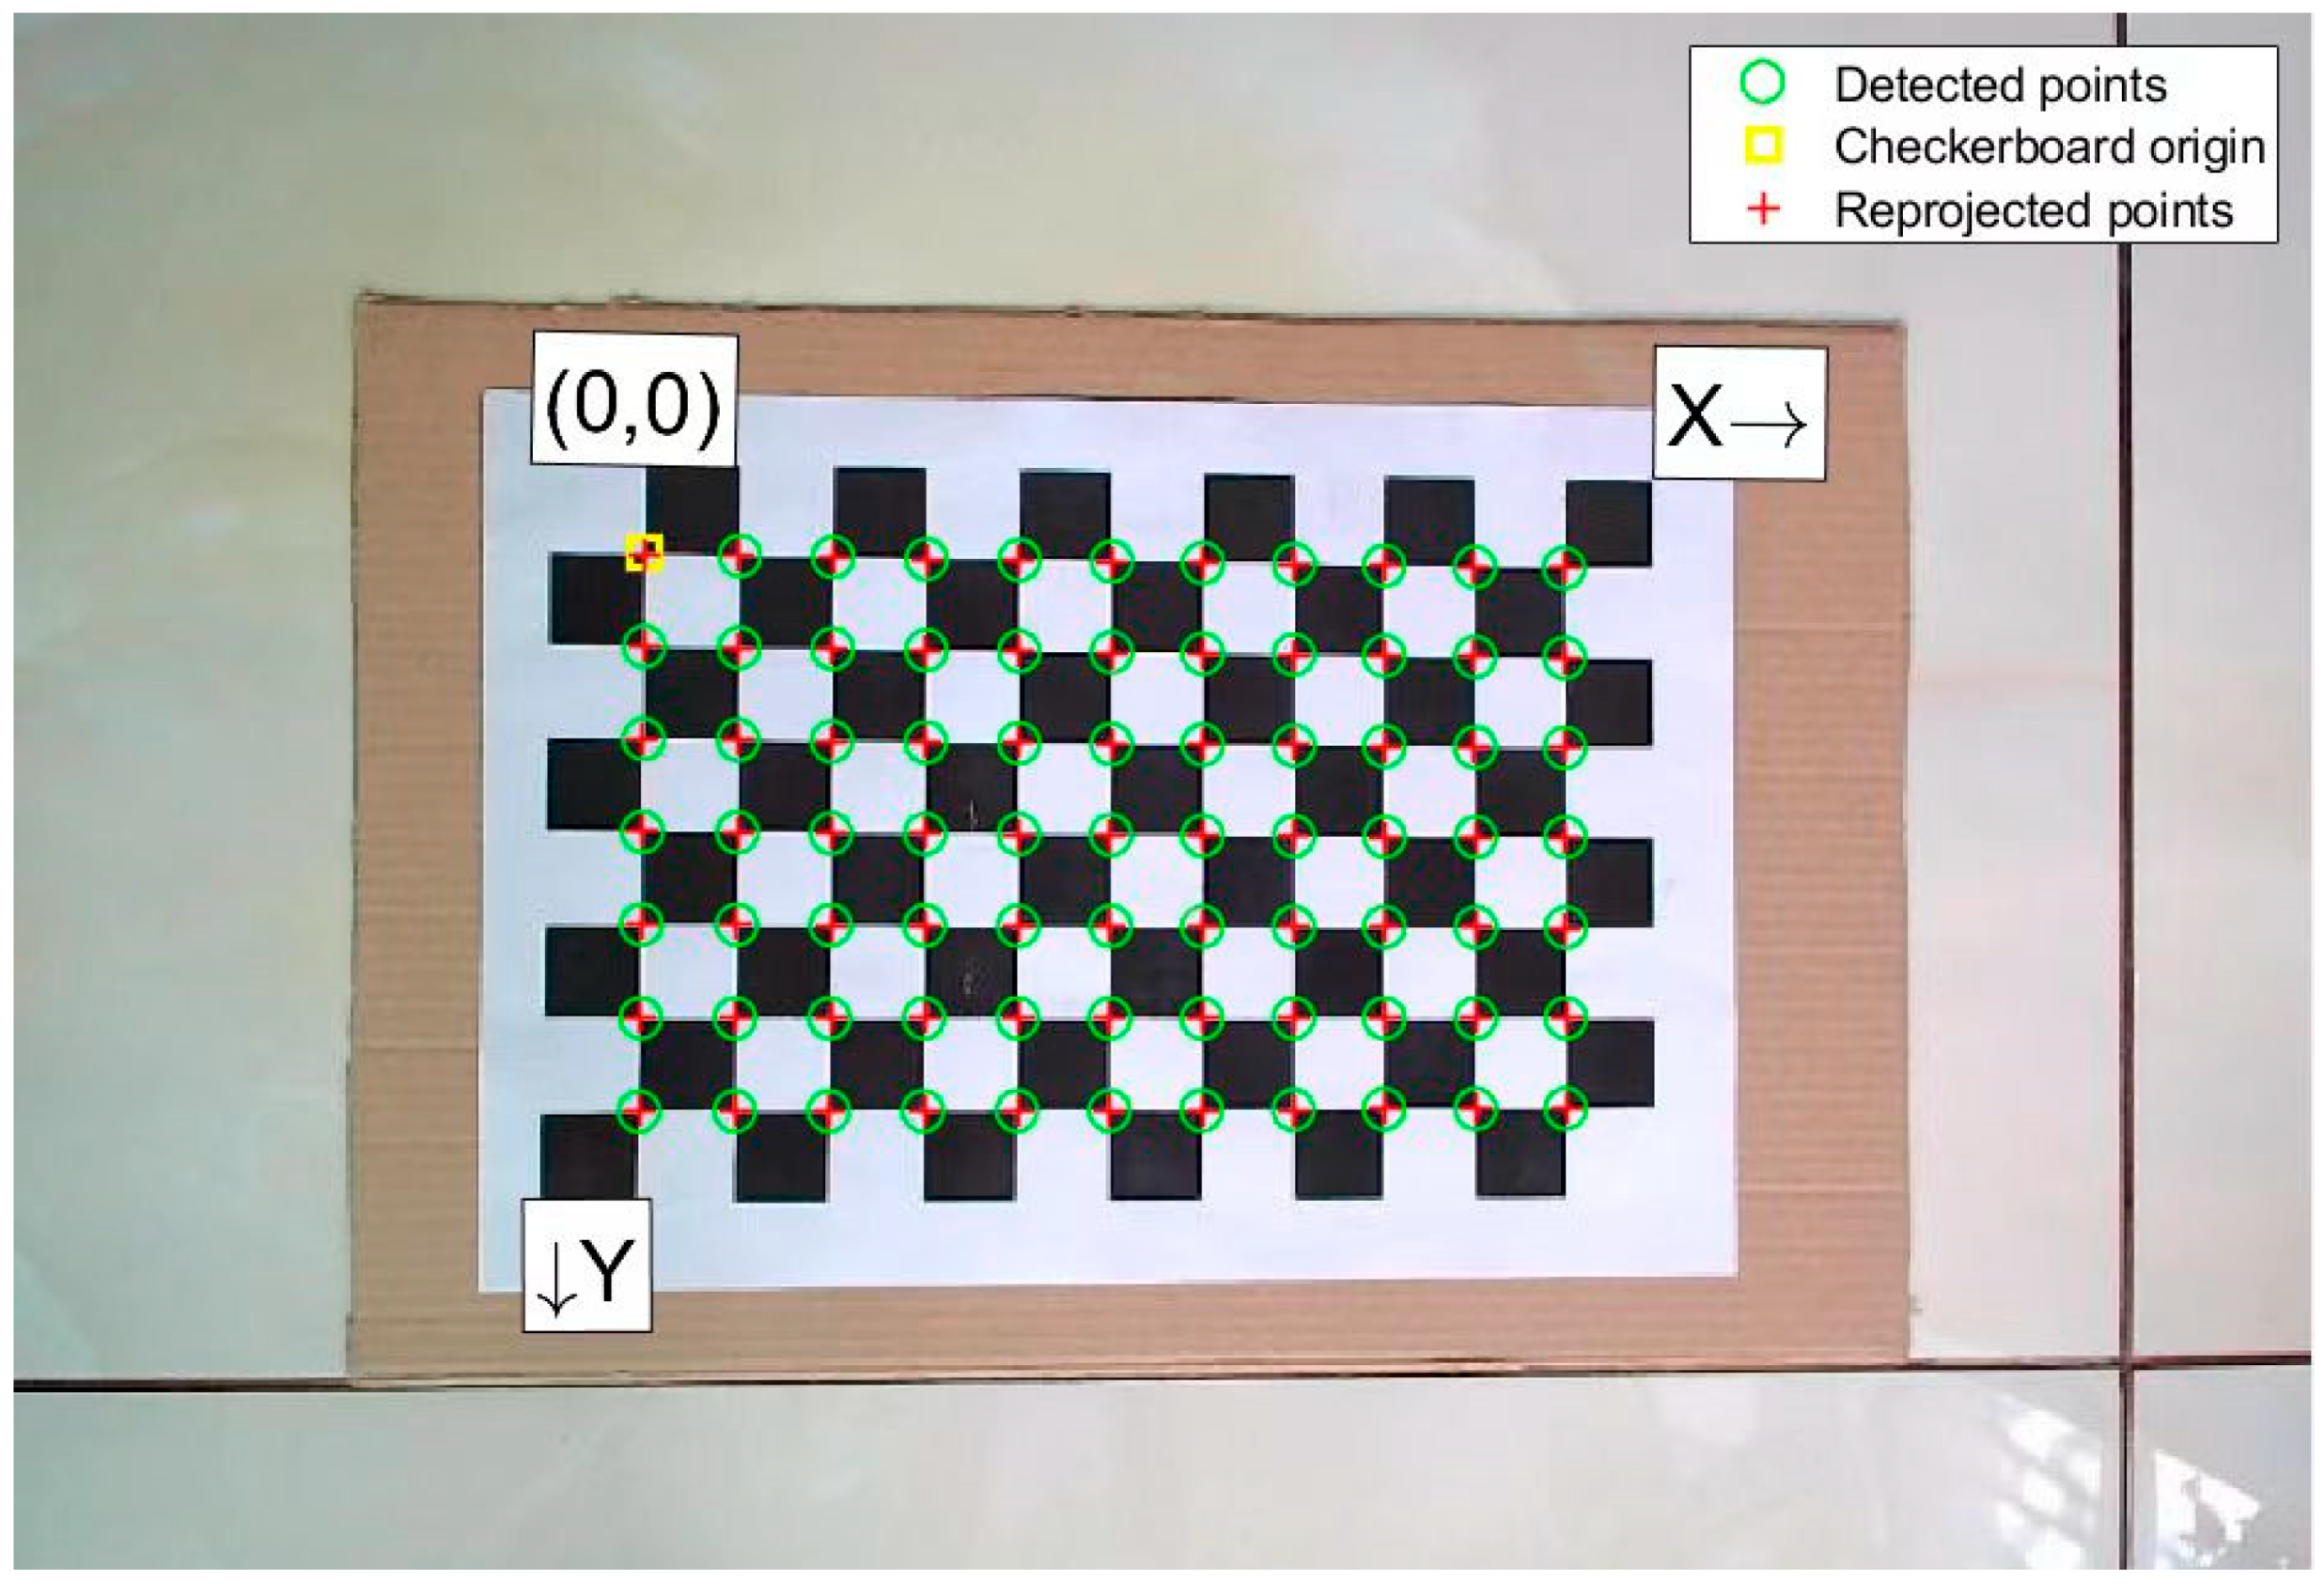
Run the MATLAB program, input the left camera image collected by the binocular camera into the Camera Calibrator calibration toolbox, and preset the size and size of the checkerboard, and the calibration toolbox will automatically extract the corners of each image [11]. The calibration effect is shown in Figure 3.
The calibration process of the right camera is the same. The calibration results of the left and right cameras are shown in Table 1.
Binocular cameras are mainly in the same world frame, unified with the respective world coordinate systems of the left and right cameras. Using the stereo-camera calibrator toolbox in MATLAB, the rotation matrix R and the translation vector T were obtained for the binocular camera; the obtained parameters are shown in Table 2.

3. Image Preprocessing and Stereo Correction

3.1. Image Preprocessing

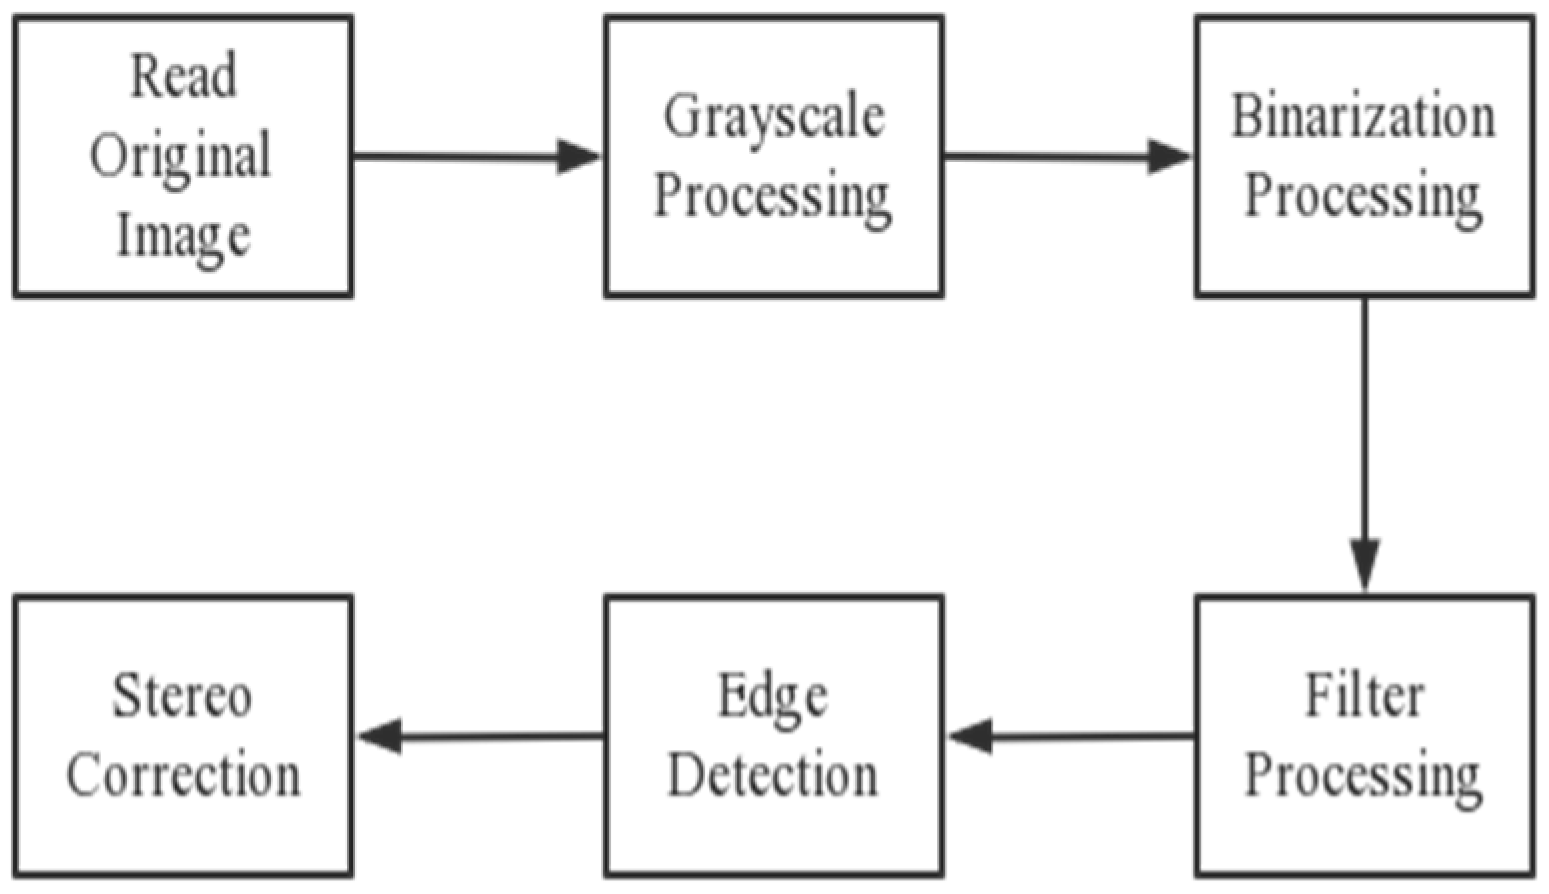
In the process of collecting images, to reduce the noise pollution caused by some mis-operation on the collected images, such as environmental background interference, camera or human environmental factors, or high exposure caused by strong light, the image processing process [12] is shown in Figure 4.
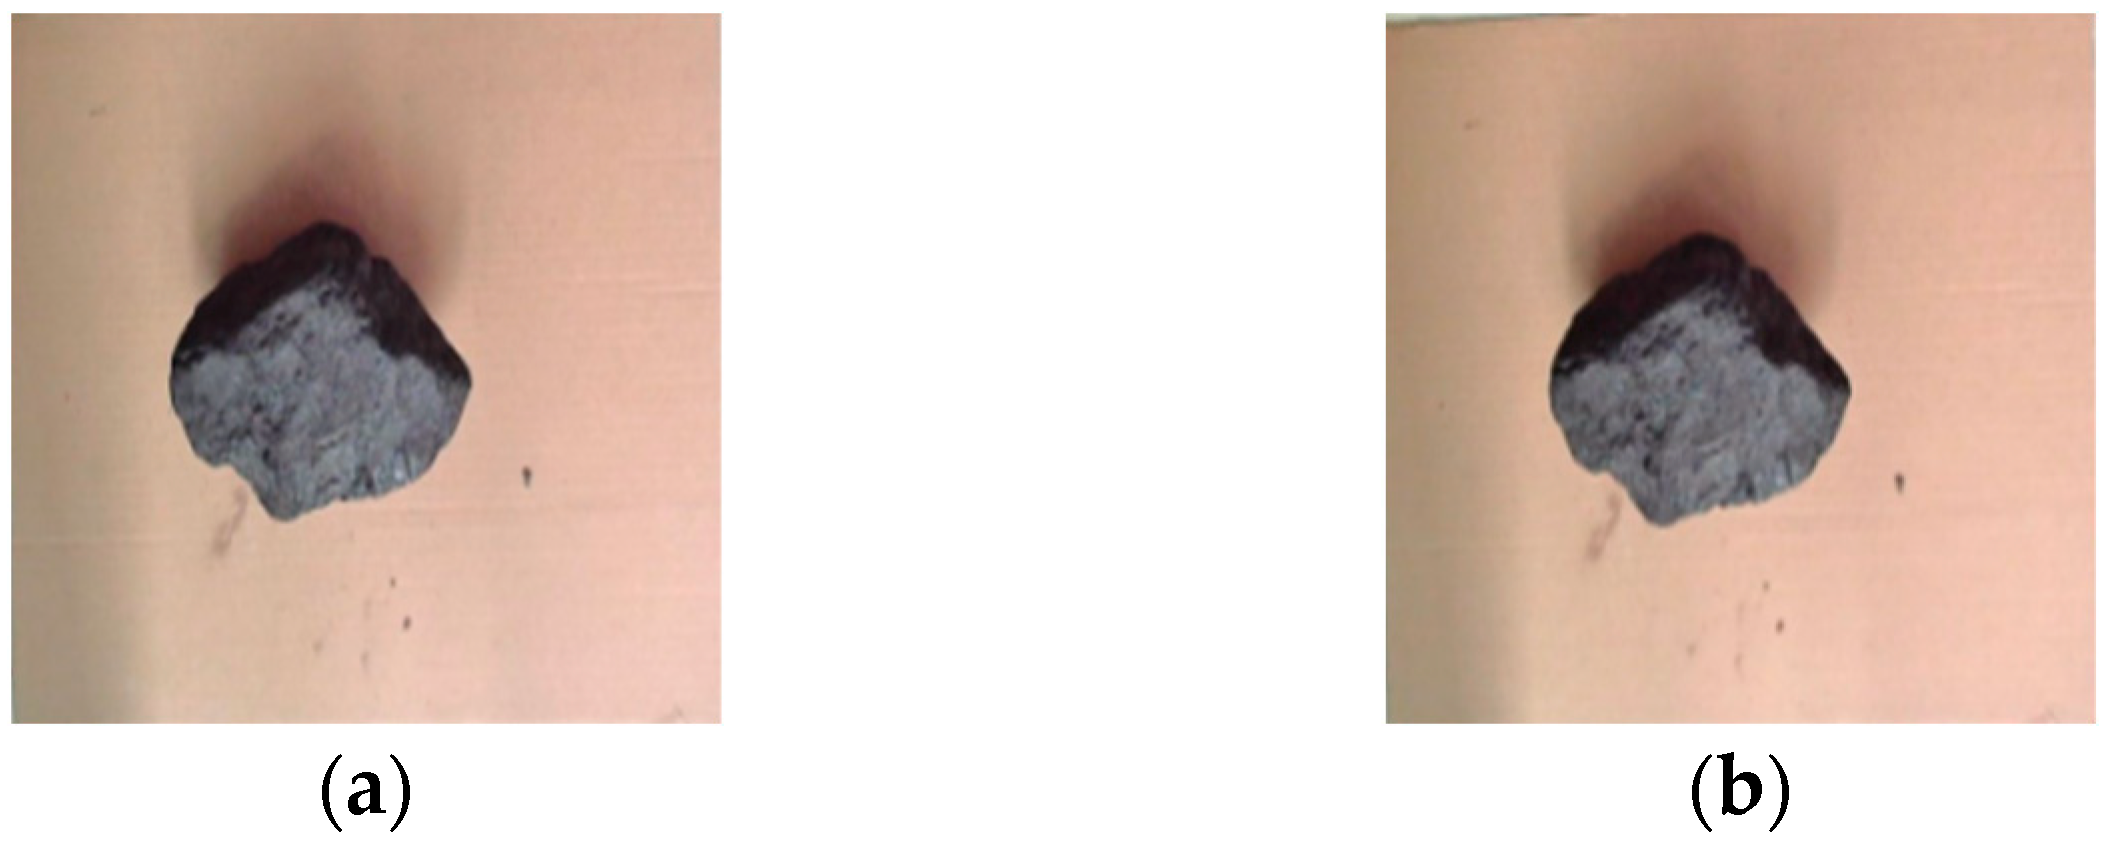
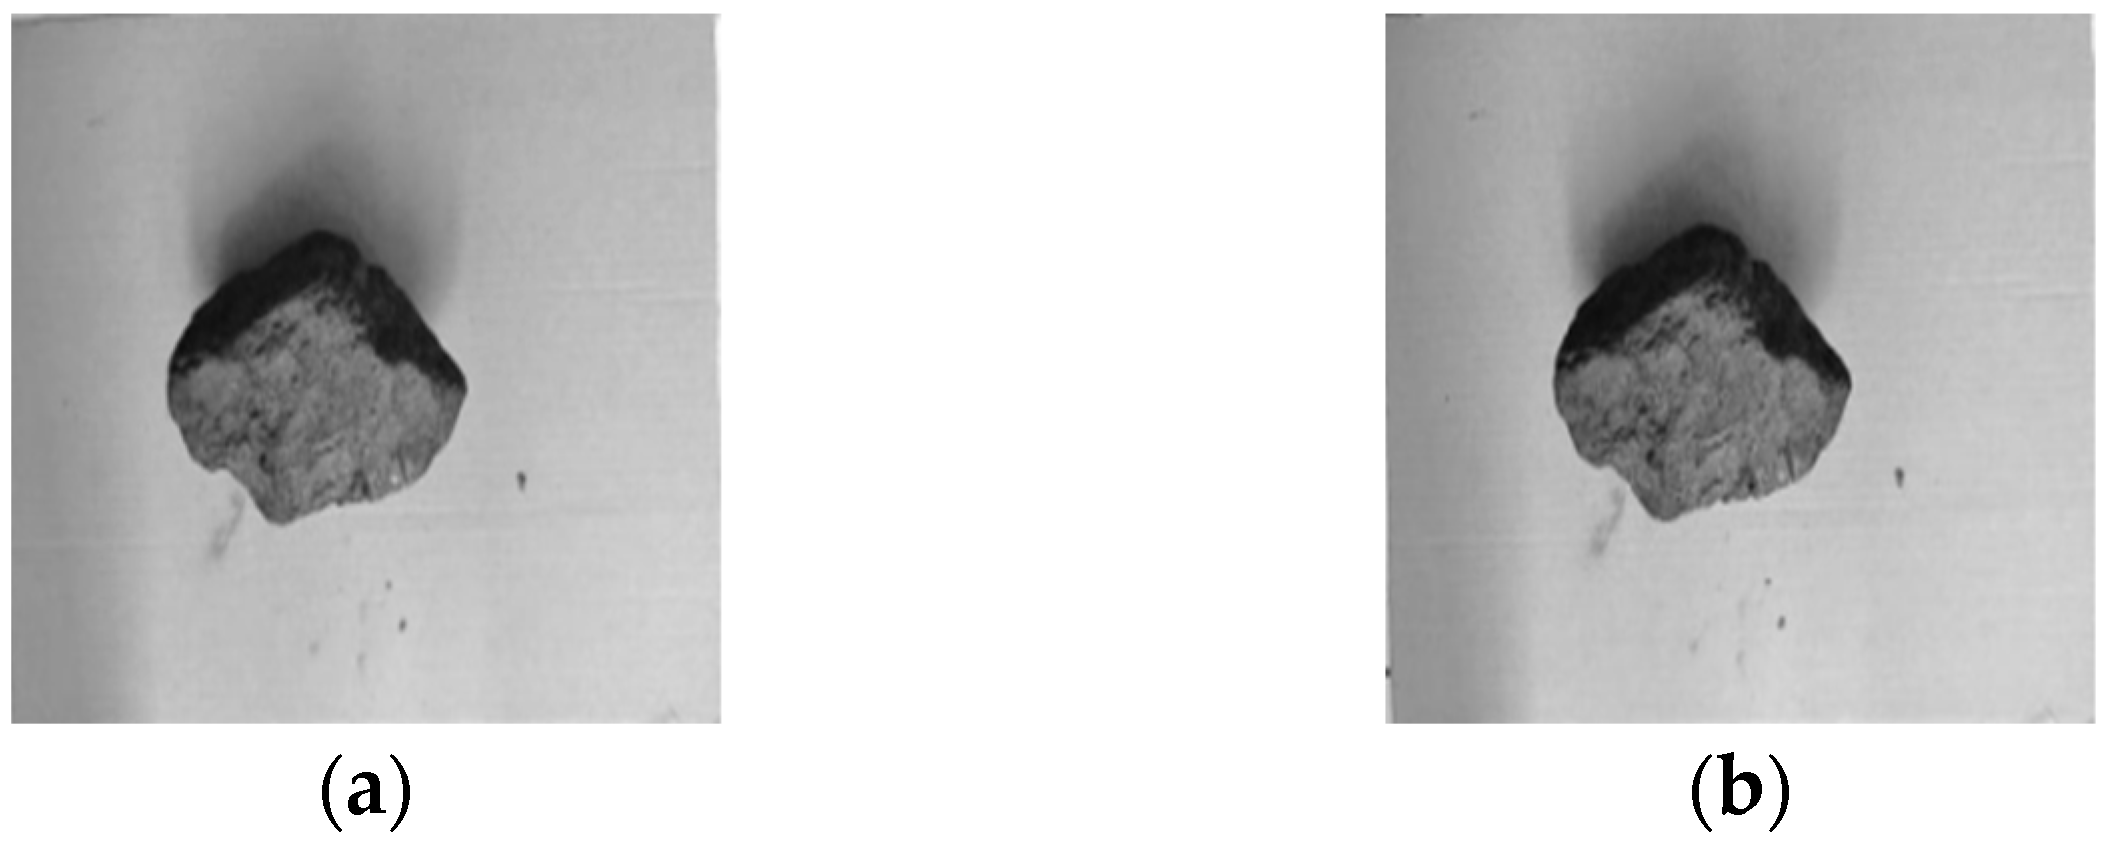
Figure 5 shows the original image of the object to be tested collected by the binocular camera.
First of all, grayscale processing is used. The process of compressing and expressing image information is grayscale processing. The grayscale pixel information is single channel, which greatly compresses the data volume of the image and replaces the color information of the RGB three channels. The grayscale rendering is shown in Figure 6.
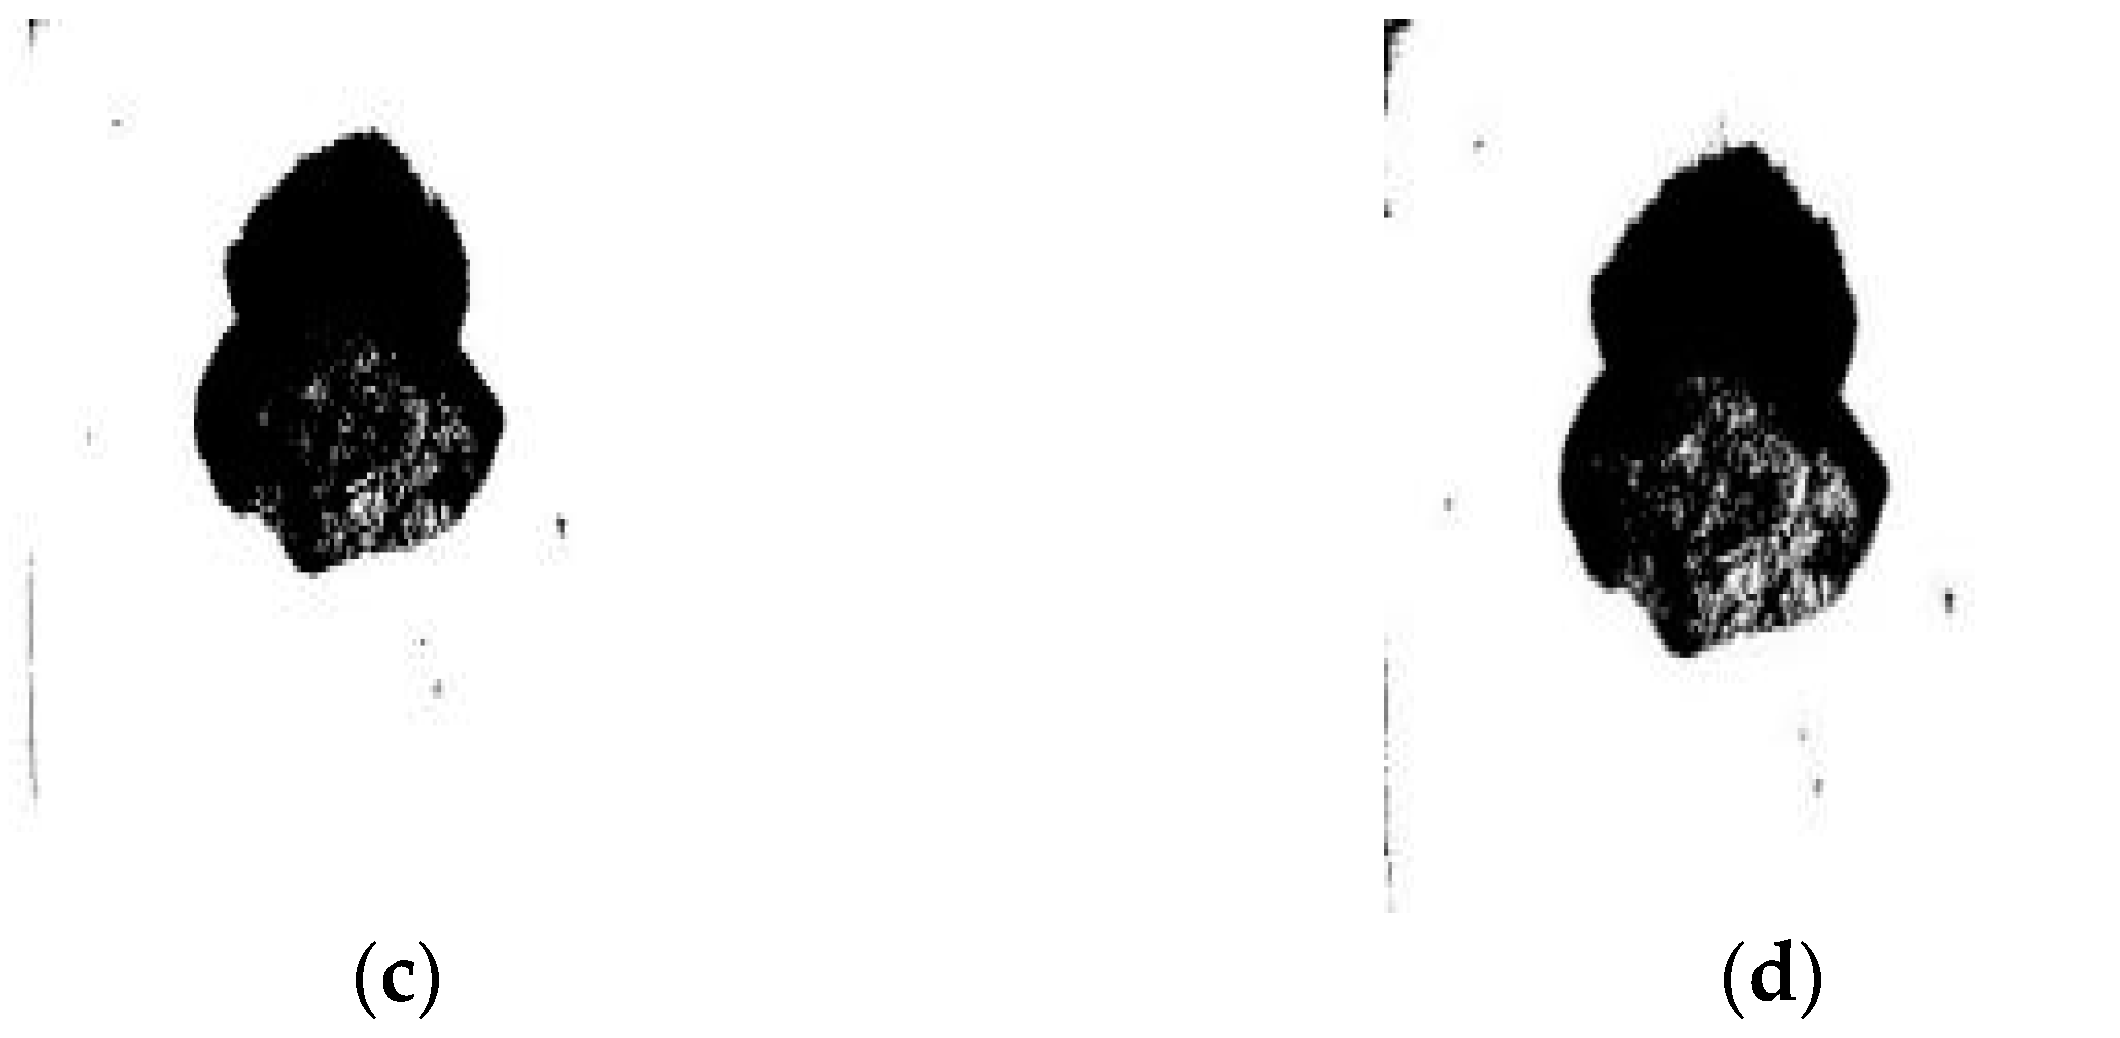
Then binarization is based on grayscale, directly discarding the detailed information of the grayscale change of the image and only retaining the two grayscale values of black and white in the picture, which greatly simplifies the image information. Commonly used are the OTSU threshold segmentation method, adaptive threshold segmentation, etc. OTSU threshold segmentation is an efficient algorithm that uses thresholds to divide the original image into foreground and background images, and maximizing the inter-class variance is its essential idea. The adaptive threshold segmentation method used in this paper is a local threshold segmentation method. The segmentation object is the domain window on the image, which can clearly distinguish the coal block from the background area and can better deal with images with large differences in light and shade. The binarization effect diagram is shown in Figure 7. Compared with the adaptive threshold segmentation method, the OTSU algorithm cannot better highlight the coal block edge.
Mean filtering uses the mean value of the gray values of all pixels in the window instead, while Gaussian filtering uses a Gaussian function to calculate the weighted average coefficient of the filtering window. Since the weighted average coefficient is calculated according to the Gaussian function, the closer to the center of the filter window, the greater the weight, and the greater blurring of the image will not be produced. The effect after filtering is shown in Figure 8. Compared with Gaussian filtering, the average filtering image is blurred, and the feature points of the detected object are lost.
Finally, edge detection is performed on the image [13] to highlight the details of the target contour. Common methods include Canny and Sobel operators. The Canny operator calculates the gradient value of the image for the horizontal and vertical gradients, respectively, and performs non-maximum suppression and elimination. With duplicate data, two thresholds with different heights are preset, and the pixels that are smaller than the lowest threshold and those that are higher than the highest threshold are removed.
The Sobel operator finds the edge of the image by calculating the first-order gradient among the pixels. The gradient calculation direction is divided into vertical and horizontal directions. The detection process of the Sobel operator mainly refers to the convolution operation between the pair of operators and the image window, as shown in Equations (5)–(7).
G x = ( z 7 + z 8 + z 9 ) ( z 1 + 2 z 2 + z 3 )
G y = ( z 3 + 2 z 6 + z 9 ) ( z 1 + 2 z 4 + z 7 )
f = G x 2 + G y 2
where z1, z2, …, z9 are the pixel values in the window, Gx and Gy are the horizontal and vertical convolution results, respectively, and ▽f is the new pixel in the center of the window. The comparison chart of the edge-detection effect is shown in Figure 9. It can be seen that the Canny operator cannot better reflect the detailed outline of the coal block surface compared with the Sobel operator.

3.2. Stereo Correction

The main purpose of stereo correction is to correct the left and right images and remove distortion, so that the two are on the exact same plane. Correction was performed in OpenCV using Bouguet limit correction [14]. The composite rotation matrices Rl and Rr of the left camera and the right camera, respectively, can be obtained by decomposing the rotation matrix of the right camera relative to the left camera.
To make the baseline and the image parallel, a transformation matrix Rrect can be established. The method is implemented by the offset matrix T of the binocular camera [15]. In e1, to make the epipolar line in a horizontal state, Rrect shifts the pole of the left view to infinity. It can be seen that the direction of the pole of the left view is the translation vector of the left and right cameras.
e 1 = T T
T = [ T x T y T z ] T
e 2 = [ T y T x 0 ] T x 2 + T y 2
In the case of obtaining the directions of e1 and e2, the direction of e3 is perpendicular to e1 and e2, and their cross product is e1. The matrix Rrect can be obtained by moving the pole of the left camera to infinity, as shown in Equation (11):
R r e c t = [ e 1 T e 2 T e 3 T ]
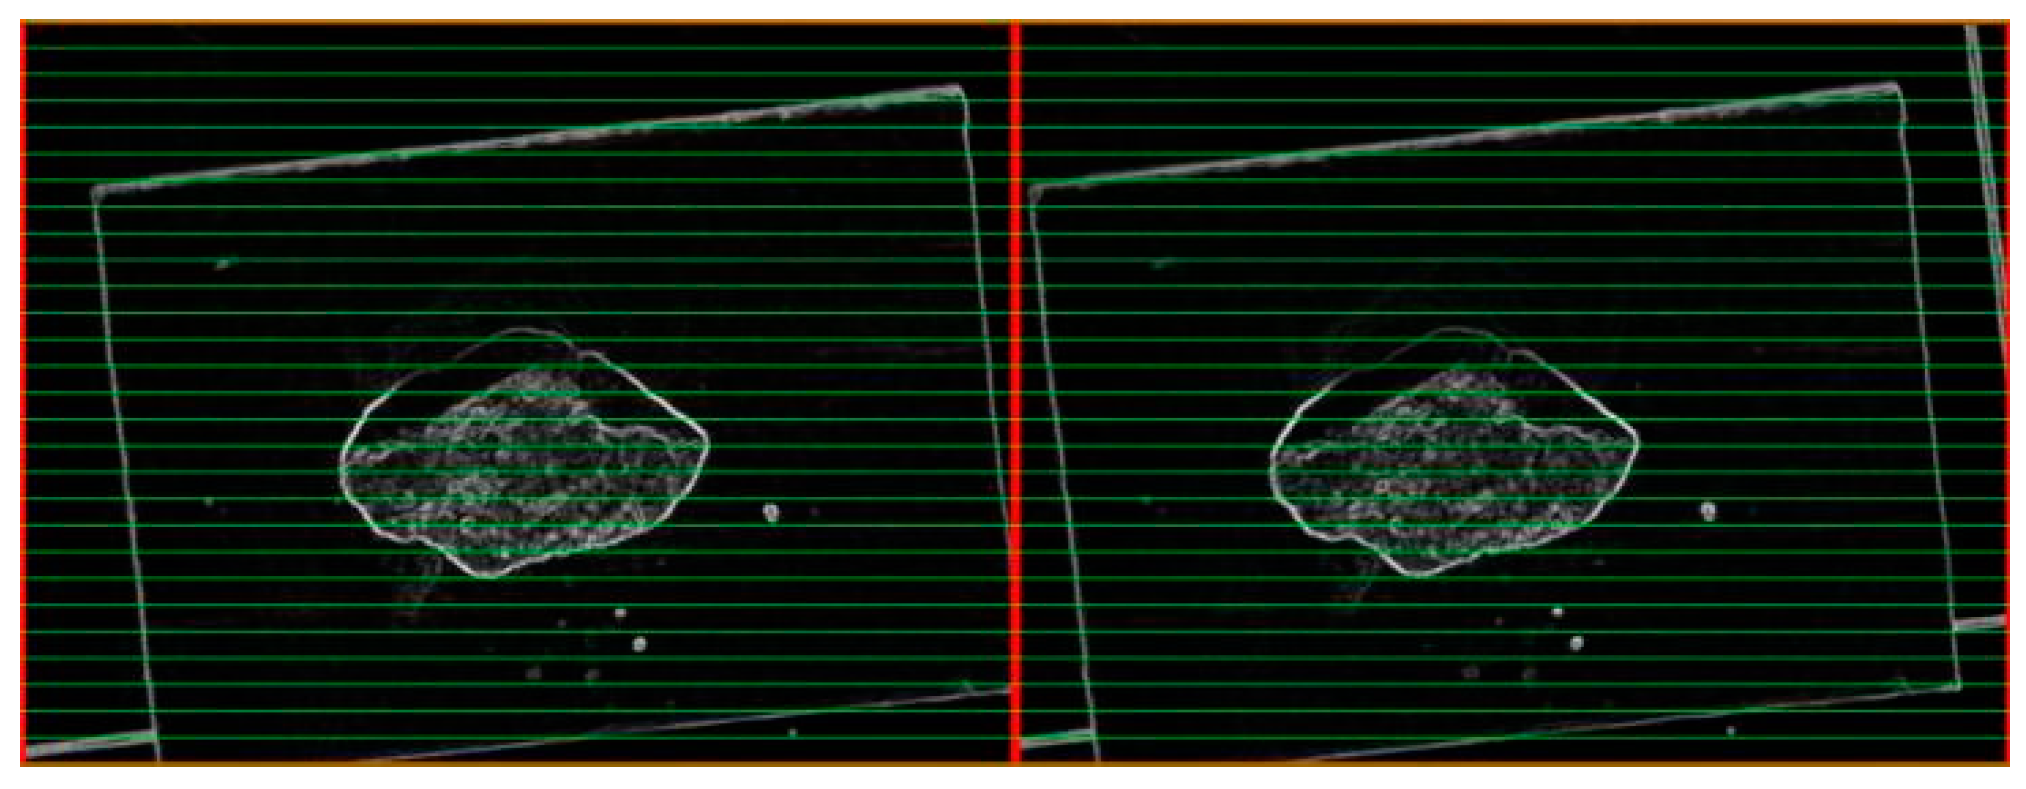
After correction, the corresponding points in the image are on the same horizontal line, and the effect is shown in Figure 10:

4. Stereo-Matching Algorithm

SAD (sum of absolute differences), BM (block matching), and SGBM algorithms are three commonly used algorithms in OpenCV.
The SAD algorithm is to take the source-matching point of the image acquired by the left camera as the center point, and then define a window D, calculate the sum of the gray values in D, and then determine the window according to the corresponding point of the right-eye image along the polar direction, according to different inspections, and calculate the difference between the gray value and the difference between the gray level of the left and right windows one by one, and determine the central pixel of the area with the smallest difference as the matching point [16].
The basic idea of the BM method is to divide the frames of the left and right cameras into multiple small cubes, then move a small cube to compare the pixel position of the small cube in another graph, and then calculate the parallax information from the calibration results of the binocular camera.
The SGBM algorithm breaks the matching cost algorithm of mutual trust in the SGM (semi-global matching) algorithm and uses the BT algorithm that approximates the global two-dimensional smoothness constraint, so that it has the characteristics of good parallax effect and fast speed [17].
The gradient parallax plot of the image is obtained by using the Sobel operator, which has the influence on the image to reduce the uneven lighting and noise.
s ( x , y ) = 2 [ P ( x + 1 , y ) P ( x 1 , y ) ] + P ( x + 1 , y 1 ) P ( x + 1 , y + 1 ) P ( x 1 , y + 1 )
where s(x, y) is the pixel value processed by the 3 × 3 operator, and P is the pixel value in the unprocessed image. After processing the horizontal Sobel operator, each pixel value on the image is processed by the following function.
P = { 0 ,   P < p r e F i l t e r C a p P + p r e F i l t e r C a p , p r e F i l t e r C a p P p r e F i l t e r C a p 2 + p r e F i l t e r C a p , P p r e F i l t e r C a p
where preFilterCap is a constant parameter, and the value is adjusted by example to obtain the image gradient information of the subsequent cost calculation [18].
According to Equation (14), the census transformation makes the pixel values of the traversal domain window against the pixel values of the center point of the window, and maps the resulting Boolean value on a little string, if the field window size is m × n (both odd), then m′ and n′ are positive integers.
C s ( u , v ) = i = n n j = m m ξ ( I ( u , v ) , I ( u + i , v + j ) )
ξ ( x , y ) = { 0 , x y 1 , x > y
where the census transformation value Cs is expressed as the value of the bit string, and where m and n are twice as great as m′ and n′.
The dynamic programming algorithm is ineffective for places where the parallax changes greatly, often resulting in matching errors, and it is difficult to avoid using the wrong parallax information for subsequent calculations, affecting the parallax accuracy. Its energy function is as follows:
E ( D ) = P ( C ( P , D P ) + q N p [ | D P D q | = 1 ] + q N p P 2 T [ | D P D q | > 1 ] )
where D is the pre-matching of the parallax graph, E(D) corresponds to the energy function of the parallax graph, p and q are certain pixels in the image, Np is the set of pixels in the field of pixel p, and C(p, Dp) is the matching cost [19].
In SGBM, the SGM algorithm proposes to combine information in multiple directions to minimize the impact of error and obtain the optimal energy function. SGM is a Markov-based energy equation that accumulates information in different directions and ends up with the winner-take-all (WTA) algorithm [20] determining the parallax size of each pixel, which will affect the accuracy of the method.
L r ( p , d ) = C ( p , d ) + min { L r ( p r , d ) L r ( p r , d 1 ) + P 1 L r ( p r , d + 1 ) + P 1 min L r i ( p r , i ) + P 2 } min L r ( p r , i )
S ( p , d ) = r L r ( p , d )
where Lr is the new path generation value; S is the result of the aggregation of the total path cost; both P1 and P2 are penalty coefficients, where P1 applies to those pixels in the field and the P-spot parallax is equivalent to 1, while P2 is those pixels that differ by more than 1. As for the role of I as a judgment function, if I is judged to be true, 1 is returned; otherwise, 0 is returned.
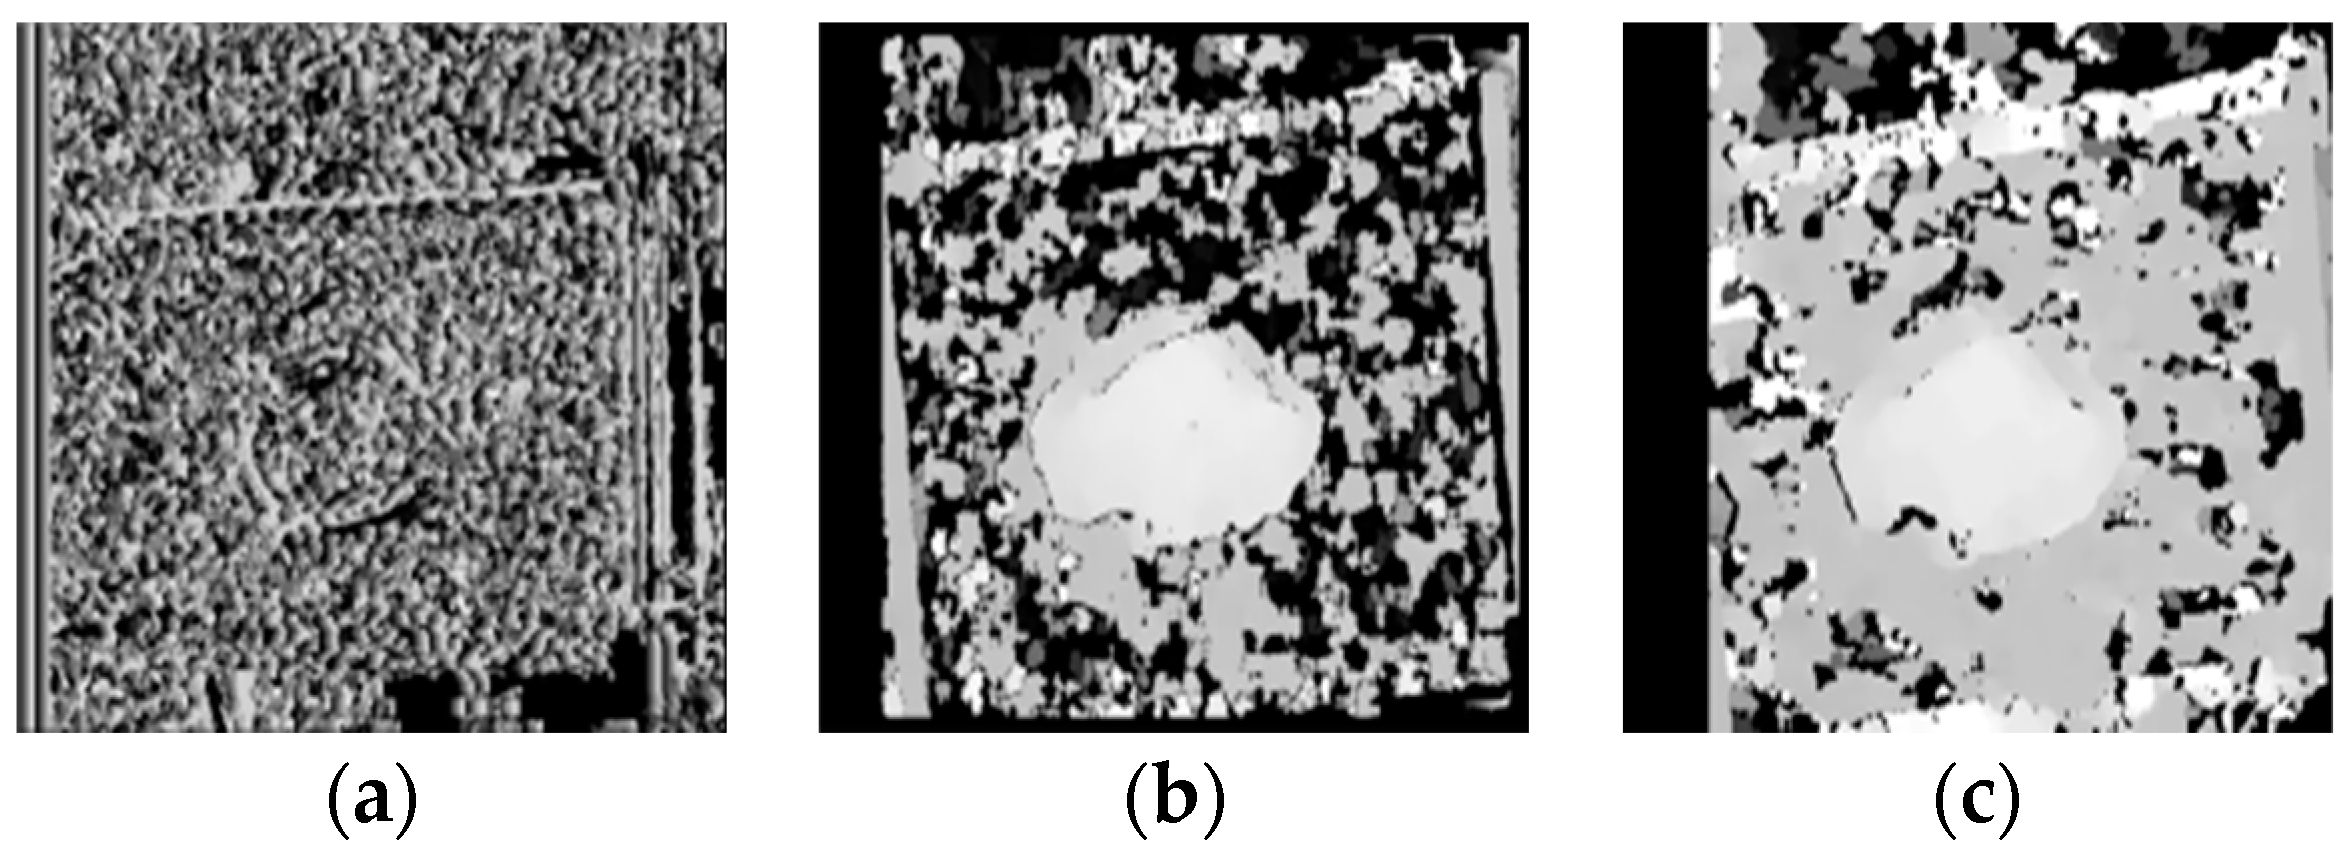
As shown in Figure 11, the three-dimensional matching-effect diagram, it can be clearly seen that the SAD algorithm divides the measured object, and it is difficult to see the general outline of the object to be tested. Moreover, under the SAD algorithm, the ground-depth-information collection is blurred, so the accurate distance between the binocular camera and the ground cannot be judged, and the effect is very poor. The BM algorithm has an obvious graph segmentation effect on the measured object. The outline of the object to be measured is very clear, but the processing of the ground-depth information is not excellent. There is still a large number of black areas that cannot be identified, but the running speed is fast. The image segmentation of the SGBM algorithm is not as effective as that under the BM algorithm, but it still can clearly identify the specific outline of the object to test, and, relative to the above two methods, the running speed is slower than the BM algorithm, but still within the accepted range. The ground-depth information processing is perfect; the black (where it cannot identify the area) is greatly reduced.

5. Calculation of Target Volume

This article uses a WSD-2022-V binocular camera (Shenzhen Weishida Technology Co., Ltd., Shenzhen, China), an Intel(R) Core-i5 laptop, and other supporting equipment. Under the Win10 system, MATLAB is used for raw-coal image processing, Visual Studio 2022 (VS) code writing platform is used, and the OpenCV4.1.0 visual open-source library is used. The camera used in the test is shown in Figure 12.
In this experiment, the extrinsic and extrinsic parameters of the camera are first obtained. Complete the preprocessing of the raw coal image in MATLAB, and then complete the stereo correction and matching work in the VS and OpenCV environment, analyze the acquired depth information, and realize the volume calculation.
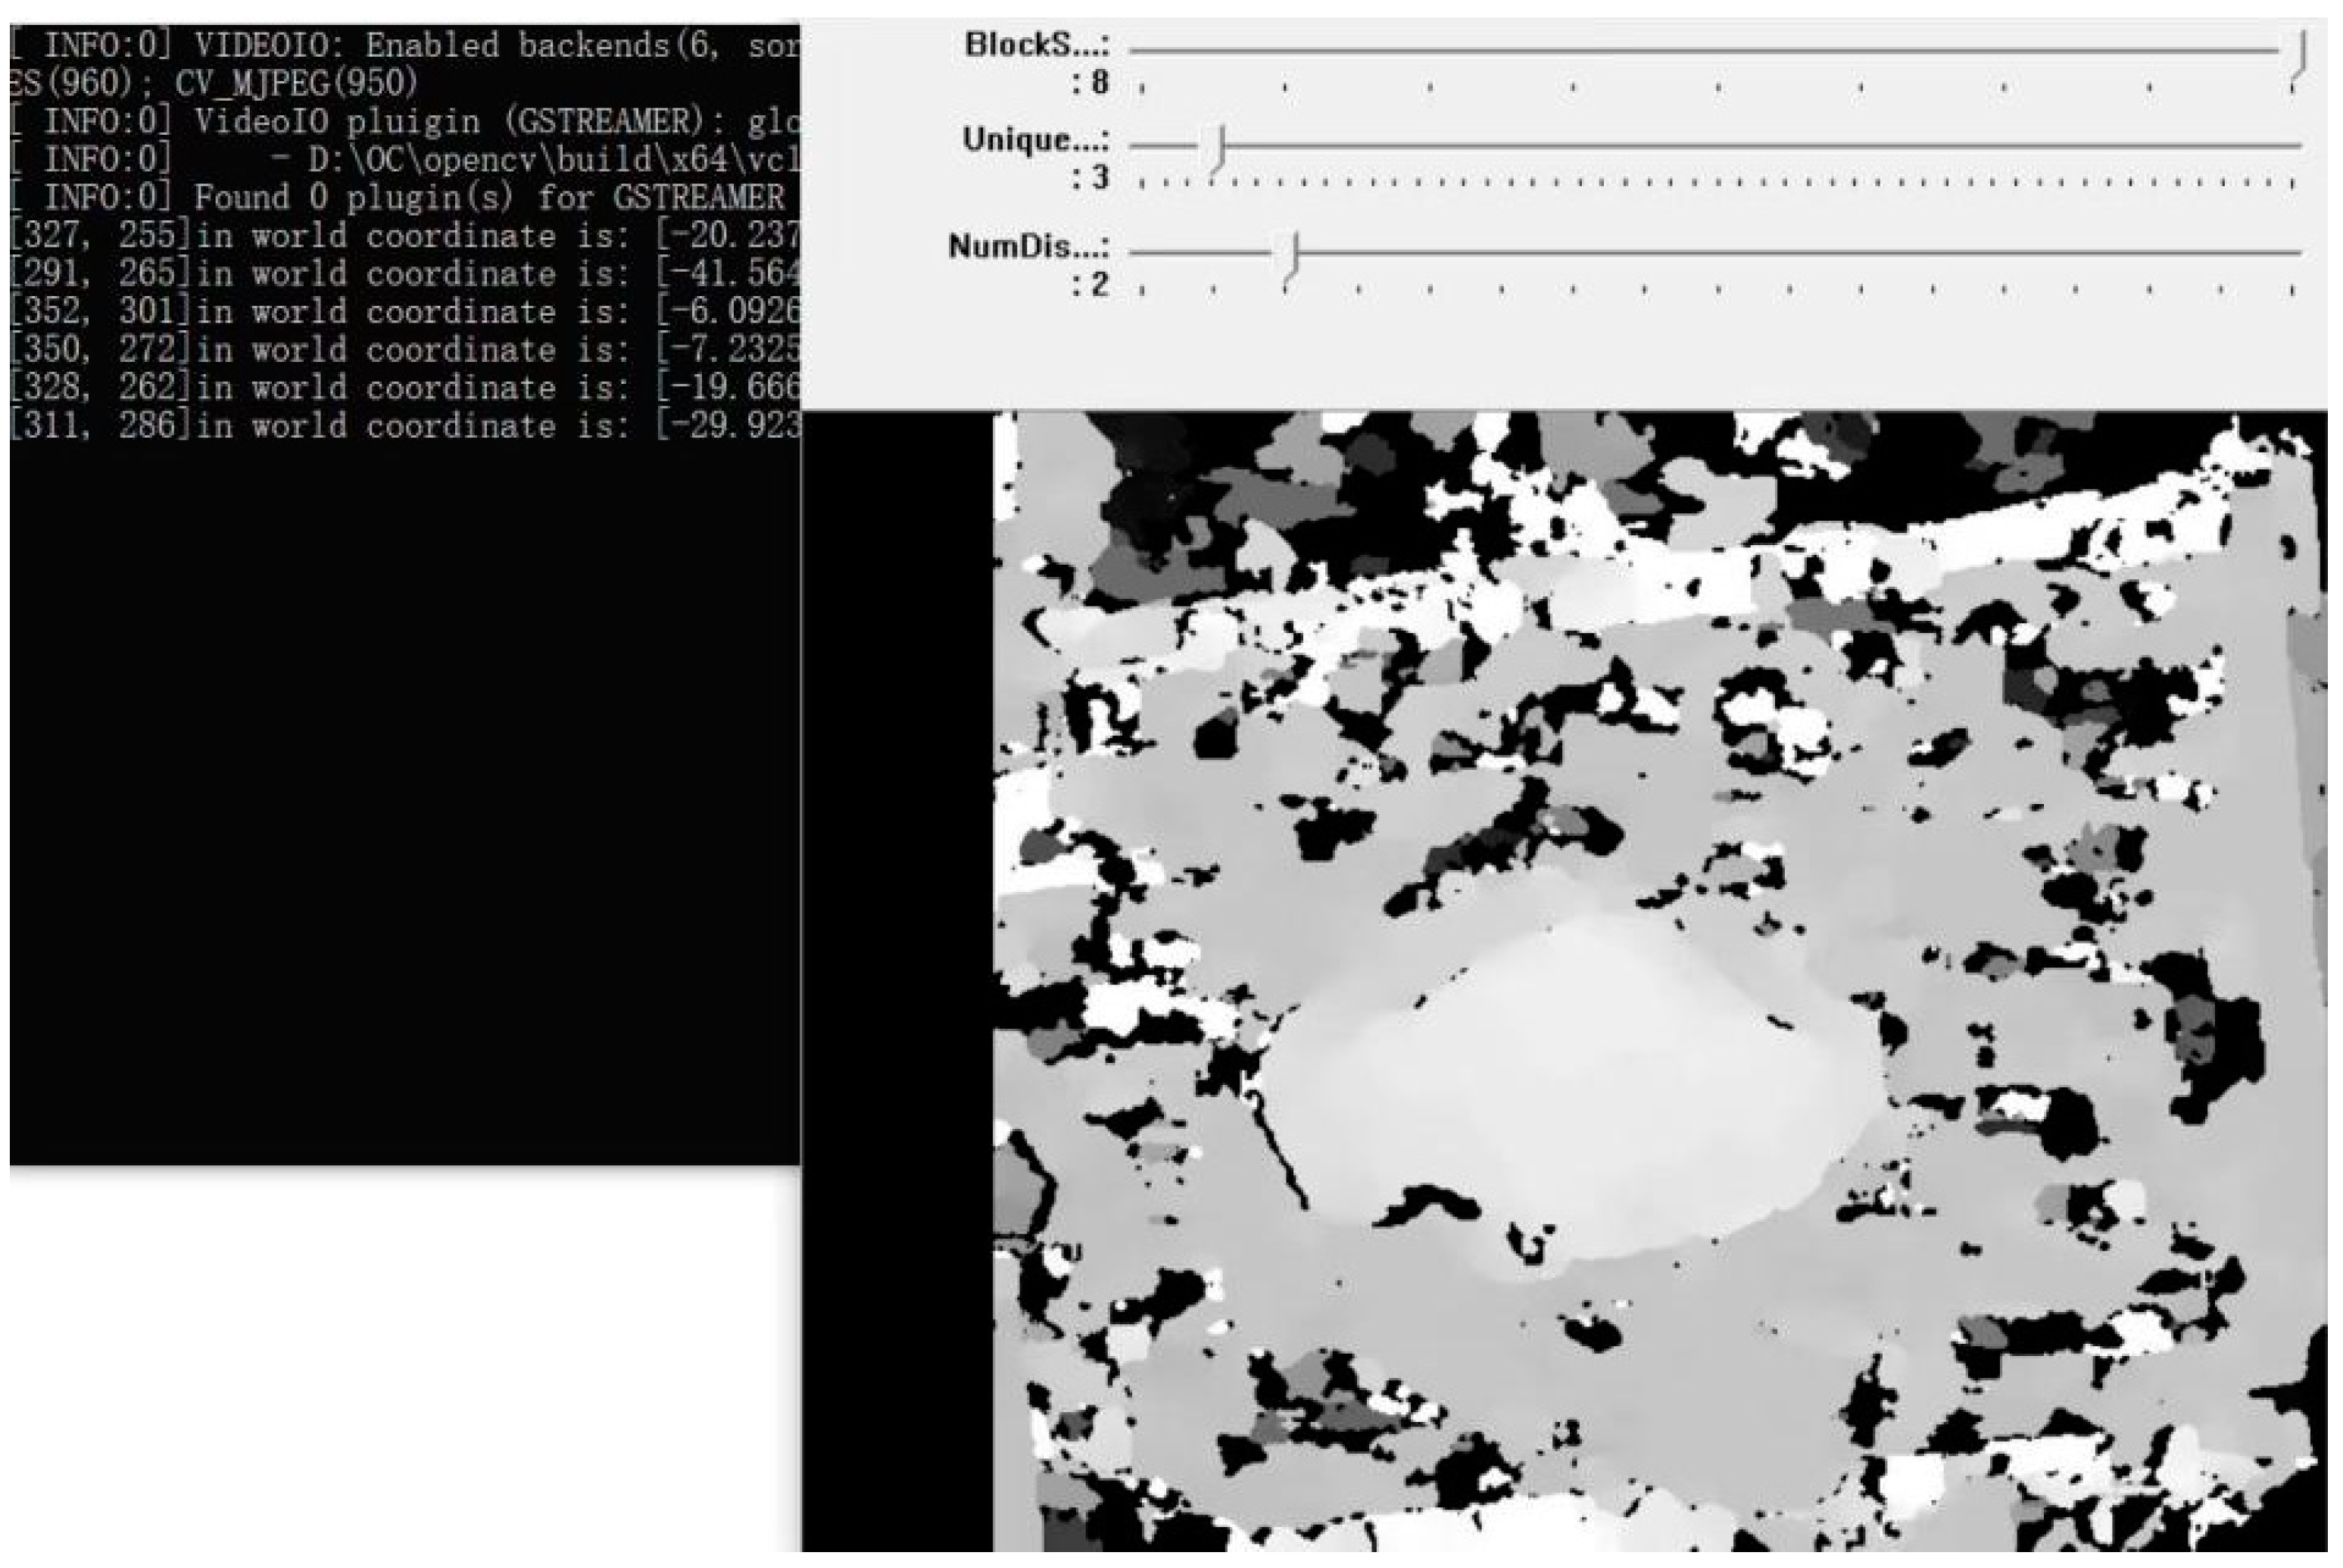
After the algorithm runs, adjust the image smoothing and other processing operations to make the object in the image stand out. Click the part of the object to be measured in the window with the mouse to obtain the target distance. The effect diagram is shown in Figure 13.
In the process of ranging, the binocular camera is kept horizontal, and the distance from the ground is always maintained at a height of 400 mm. For irregular coal blocks, 10 random points are taken on it, their heights are measured, and the actual average height of the coal blocks is obtained. Then, in the image after the algorithm runs, 10 points are collected and divided into five groups, and the average height of the measurement is calculated. The error measurement is shown in Table 3.
From this table, it can be seen that the error range of the height measurement of the object is about 0.37~3.68%, and the average error is about 1.93%. The reasons for the error are analyzed:
(1)
The accuracy of the camera is not high enough, and the camera used is an entry-level commercial camera, which is far lower than the accuracy of an industrial camera;
(2)
The irregular shape on the coal block and the reason why its color distinction is not obvious enough cause the disparity map generated by the coal block in the algorithm to be flawed;
(3)
The experimental environment is simple, which has a certain influence on the measurement accuracy of the binocular camera.
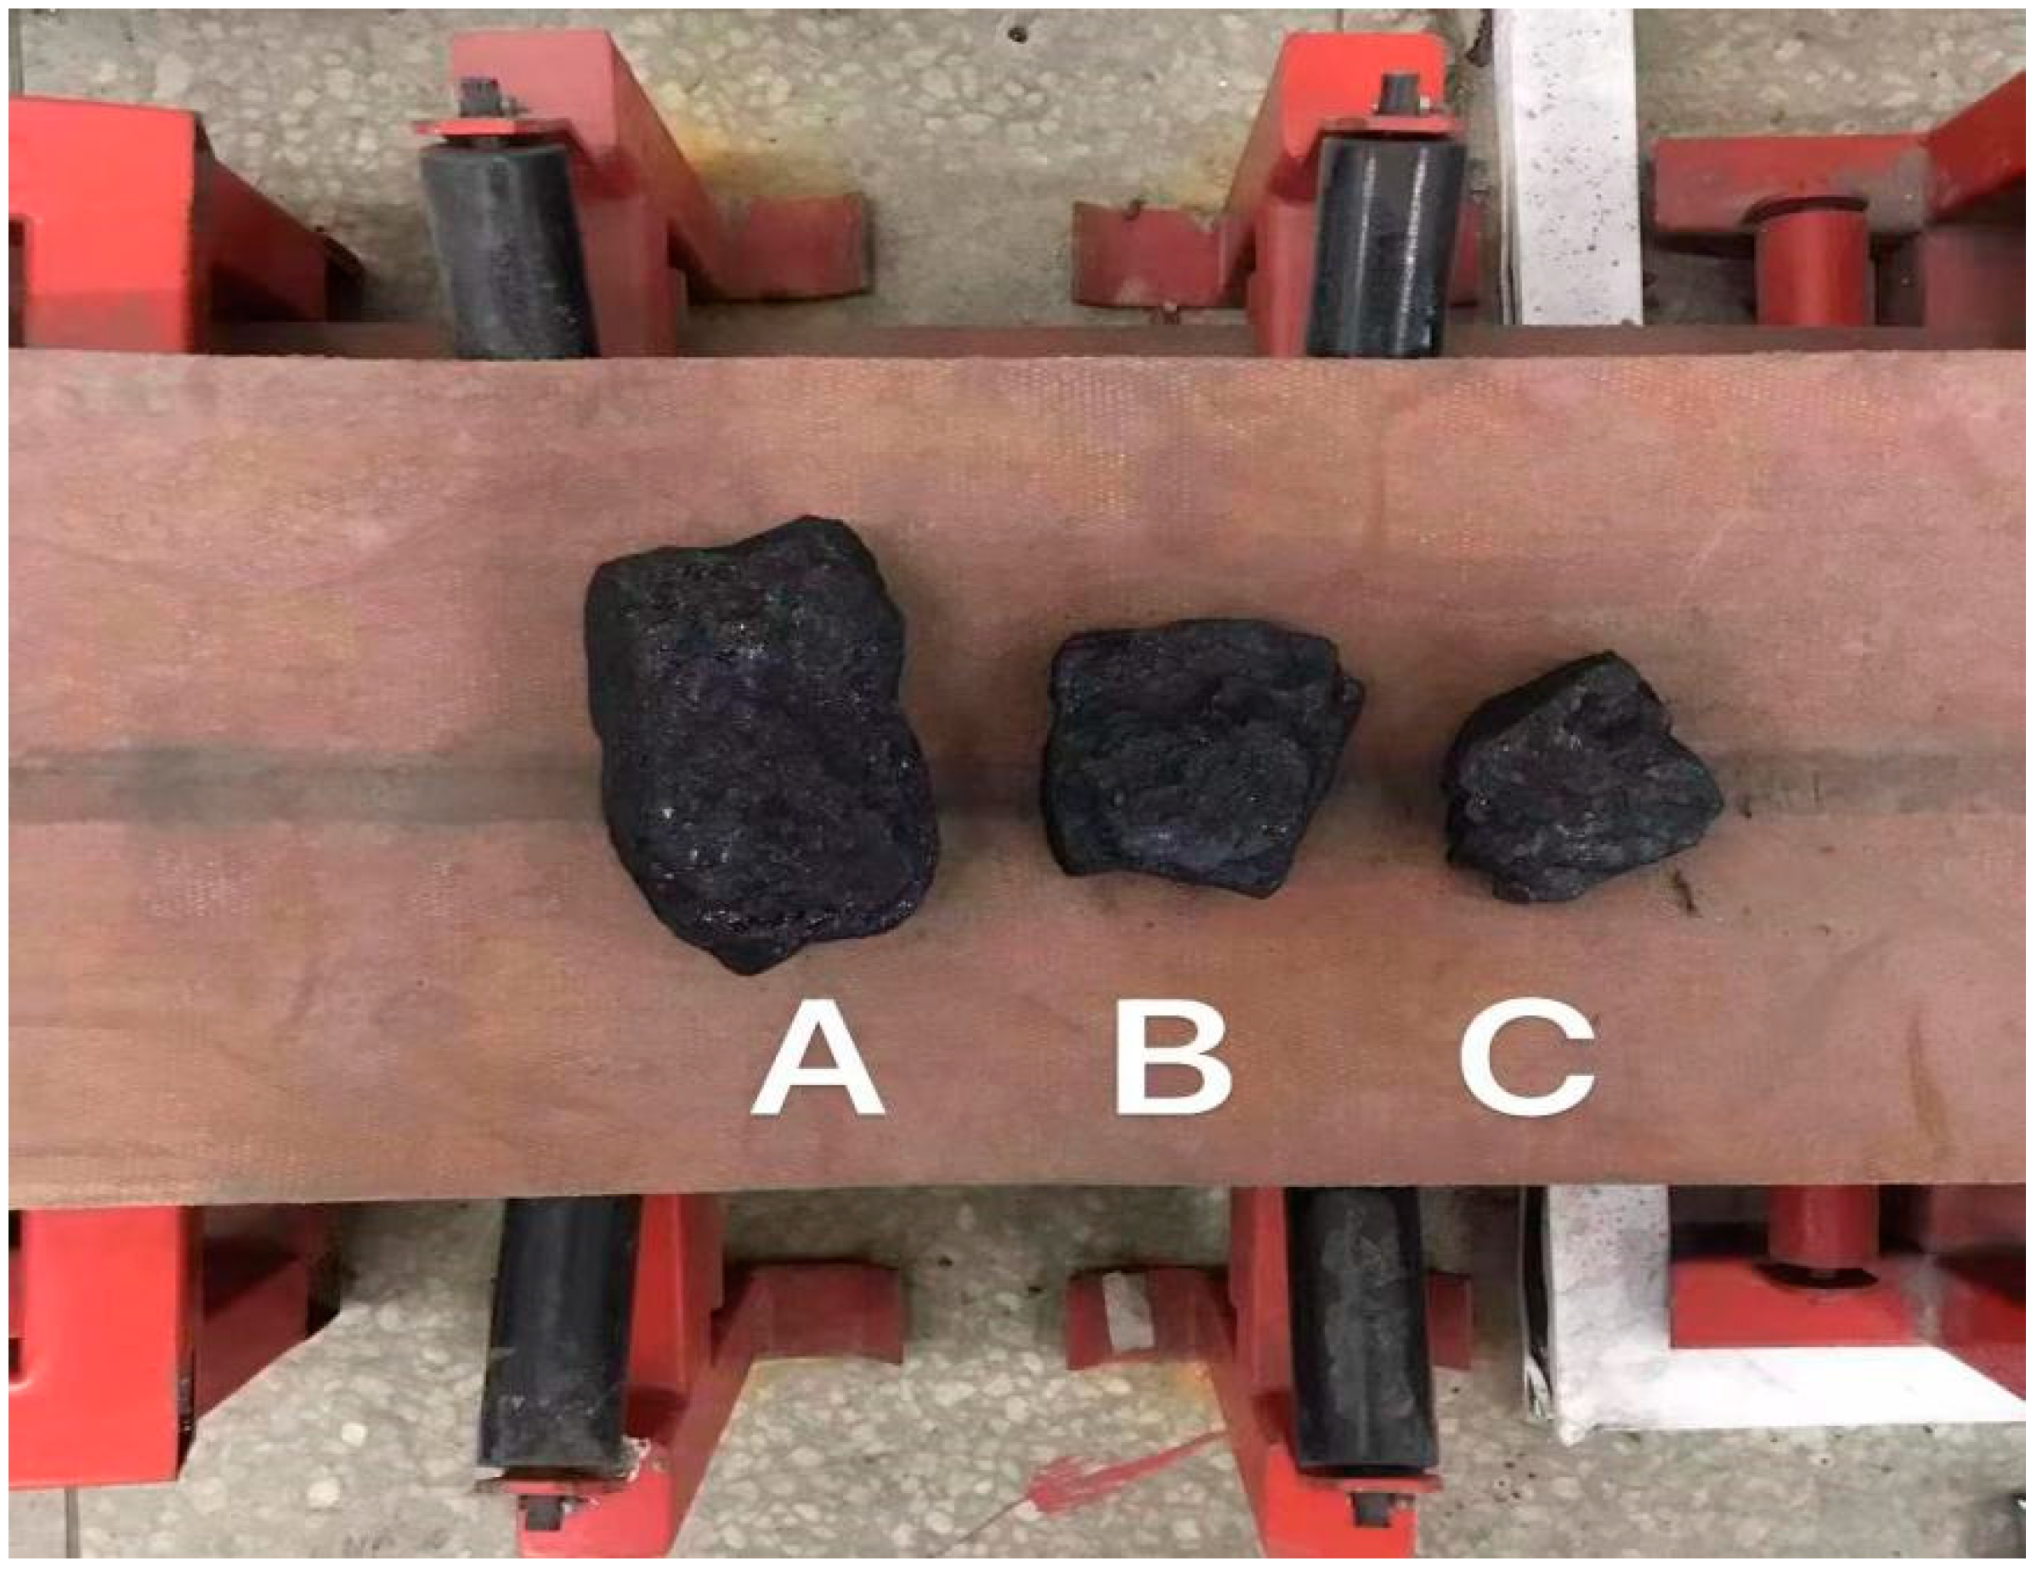
The origin of the coordinate system is mainly the left camera, the object area is set as the area to be measured, and the remaining area is the background area, which provides ground depth information for the camera’s measurement. Then, the area to be measured is divided and accumulated as the final volume of the target by the micro-element method. As shown in Figure 14, the laboratory mine conveyor belt and large raw coal block used in this paper are marked as A, B, and C, respectively from left to right. This experiment was carried out in the mining conveyor belt platform built in the laboratory.
Count the depth information in the background area, discard the maximum and minimum values, then calculate the average value of the remaining depth information, and then calculate the size of the object to be measured according to the horizontal and vertical coordinates of the pixels in the area to be measured, and divide the area into n sizes for the sub-region of i × j; the maximum and minimum values are also discarded, the depth value is obtained, the average depth value that can represent the region is calculated, and then the volume of the sub-region is obtained according to the formula, and finally the volume of the sub-region of the region to be measured is accumulated to obtain the total volume, such as in Equations (19)–(21):
V 1 = ( H 0 h ¯ 1 ) i j
V s = 1 m V m
V s = ( H 0 h )
where V1 is the volume of the sub-region; i and j represent the size of the sub-region; h ¯ 1 is the depth of the sub-region; Vs represents the sum of the accumulated sub-regions; and H0 represents the height of the current scene from the ground.
The volume of the coal block was obtained by binocular vision, and the actual volume was measured by the drainage method. The data are shown in Table 4.
It can be seen that the smaller the coal block, the greater the error, and when the two pieces of coal are put together, the error increases. Analyzing the above reasons for error, the distance makes small coal measurements more accurate than large coal measurements; the average error was calculated to be 5.65%. When two coal blocks are measured at the same time, the interference between objects and coal blocks are not rule bodies, and the uneven surface, coal and the ground gap, and coal surface color disparity are not obvious, the coal block is hollow on the side and top view occlusion of a series of factors such as false volume leads to error, but for irregular shapes of coal this still has a certain reference value.

6. Conclusions

This low-cost, noncontact method of coal-block volume measurement is adopted in this paper; image processing was performed using MATLAB, the Bouguet algorithm corrected for images acquired by binocular vision using VS and in OpenCV environment, the SGBM algorithm was used for stereo matching, and parallax maps were calculated and optimized to get depth information.
(1)
Experiments show that the measurement error is about 5.65%; on the basis of this error, the volume of foreign bodies such as irregular large coal blocks and gangue is the set threshold. In this way, a mine conveyor belt safety-warning system is designed to achieve the timely maintenance of the mine conveyor belt for the normal safety of mine production and to protect the life and safety of mine workers.
(2)
This design was performed in a laboratory environment, with low cost, and simple and easy operation as the basic idea to use. In the practical application process, in natural light situations, the recognition effect is quite good. Further research is still needed in actual mines.

Author Contributions

Conceptualization, L.Z. (China University of Mining and Technology; Shanxi Datong University), and S.H. (Shanxi Datong University); methodology, S.H. (Shanxi Datong University), H.W. (Shanxi Datong University), and L.Z.; formal analysis, C.G. (Shanxi Datong University), B.W. (Shanxi Datong University); investigation, J.L. (Shanxi Datong University), Y.S. (Shanxi Datong University); writing—original draft preparation, L.Z. (China University of Mining and Technology; Shanxi Datong University), and S.H. (Shanxi Datong University). All authors have read and agreed to the published version of the manuscript.

Funding

This paper is supported by the National Natural Science Foundation of China (52174137, 51704275); China Postdoctoral Science Foundation Project (2020T130697, 2019M661994); Shanxi Datong University Youth Scientific Research Fund Project (2020Q5); Shanxi Postgraduate Education Innovation Project (2021Y739, 2022Y766); Shanxi Datong University 2021 Industry-University-Research Project (2021CXZ2); Shanxi Datong University 2022 Campus level Opening Bidding Project (2021ZBZX3); and Shanxi Datong University Graduate Education Innovation Project (21CX02, 22CX07, 22CX34, 22CX42, 22CX44).

Institutional Review Board Statement

Not applicable.

Informed Consent Statement

Not applicable.

Data Availability Statement

Data and materials are available from the authors upon request.

Acknowledgments

The authors would like to thank everyone who helped with this study for their insightful remarks.

Conflicts of Interest

The authors declare no conflict of interest.

References

  1. Lin, B.; Chang, J.; Zhai, C. Analysis on Coal Mine Safety Situation in China and Its Countermeasures. China Saf. Sci. J. 2006, 5, 42–46+146. [Google Scholar] [CrossRef]
  2. Chen, J.; Zeng, B.; Liu, L.; Tao, K.; Zhao, H.; Zhang, C.; Zhang, J.; Li, D. Investigating the anchorage performance of full-grouted anchor bolts with a modified numerical simulation method. Eng. Fail. Anal 2022, 141, 106640. [Google Scholar] [CrossRef]
  3. Chen, J.; Liu, P.; Liu, L.; Zeng, B.; Zhao, H.; Zhang, C.; Zhang, J.; Li, D. Anchorage performance of a modified cable anchor subjected to different joint opening conditions. Constr. Build. Mater. 2022, 336, 127558. [Google Scholar] [CrossRef]
  4. Chen, R.; Yang, J.; Fang, H.; Huang, W.; Lin, W.; Wang, H. Comparative Study on Measuring Method and Experoment of Optical Belt Weigher. J. Huaqiao Univ. Nat. Sci. 2019, 40, 14–19. [Google Scholar] [CrossRef]
  5. Bi, L.; Wang, J. Construction Target, Task and Method of Digital Mine. Met. Mine 2019, 6, 148–156. [Google Scholar] [CrossRef]
  6. Mi, Y. Volume Measurement System of Express Parcel Based on Binocular Vision. Master’s Thesis, Hefei University of Technology, Hefei, China, 2017. [Google Scholar]
  7. Shao, B. Research of Dimensional Measurement of Cargo Based on Point Laser and Binocular Vision. Master’s Thesis, Dalian University of Technology, Dalian, China, 2016. [Google Scholar]
  8. Gao, R.; Wang, J. Volume Measurement of Coal Based on Binocular Stereo Vision. Comput. Syst. Appl. 2014, 23, 126–133. [Google Scholar]
  9. Hibert, P. Introduction to 3D Computer Vision Technology and Algorithms; National Defense Industry Press: Beijing, China, 2014. [Google Scholar]
  10. Zhang, Z. A Flexible New Technique for Camera Calibration. IEEE Trans. Pattern Anal. Mach. Intell. 2000, 22, 1330–1334. [Google Scholar] [CrossRef] [Green Version]
  11. Zheng, K. Research on Camera Calibration and Stereo Matching Technology. Master’s Thesis, Nanjing University of Science and Technology, Nanjing, China, 2017. [Google Scholar]
  12. Ma, B. Study on Ore Volume Measurement Based on Binocular Vision. Master’s Thesis, Jiangxi University of Science and Technology, Jiangxi, China, 2021. [Google Scholar]
  13. Dong, M.; Liu, B.; Li, H.; Zhao, R. Research on Medical Image Segmentation. Inf. Rec. Mater. 2020, 21, 8–10. [Google Scholar] [CrossRef]
  14. Bradski, G.; Kaehler, A. Learning OpenCV, 2nd ed.; O’Reilly Media, Inc.: Sebastopol, CA, USA, 2014. [Google Scholar]
  15. Yuan, P.; Cai, D.; Cao, W.; Chen, C. Train Target Recognition and Ranging Technology Based on BinocularStereoscopic Vision. J. Northeast. Univ. Nat. Sci. 2022, 43, 335–343. [Google Scholar] [CrossRef]
  16. Martin, D.R.; Fowlkes, C.C.; Malik, J. Learning to detect natural image boundaries using local brightness, color, and texture cues. IEEE Trans. Pattern Anal. Mach. Intell. 2004, 26, 530–549. [Google Scholar] [CrossRef] [PubMed]
  17. Feng, C.T. Research and Implementation of SLAM Algorithm Based on Binocualr Vision. Master’s Thesis, Zhejiang University of Technology, Hangzhou, China, 2020. [Google Scholar]
  18. Peng, L. Design of Volume Monitoring System for Coal Stacking in Transmission Belt on Vision. Master’s Thesis, North University of China, Taiyuan, China, 2021. [Google Scholar]
  19. Li, H.; Shi, J.; Tian, C. A Laser Map-aided Visual Location in Outdoor Based on Depth Characteristics. Sci. Technol. Eng. 2020, 20, 5192–5197. Available online: http://www.stae.com.cn/jsygc/article/abstract/1908235 (accessed on 18 September 2022).
  20. Liang, L. Research on Measurement Method of Irregular Object Volume Based on Bimocular Stereo Vision. Master’s Thesis, Xi’an University of Technology, Xi’an, China, 2019. [Google Scholar]
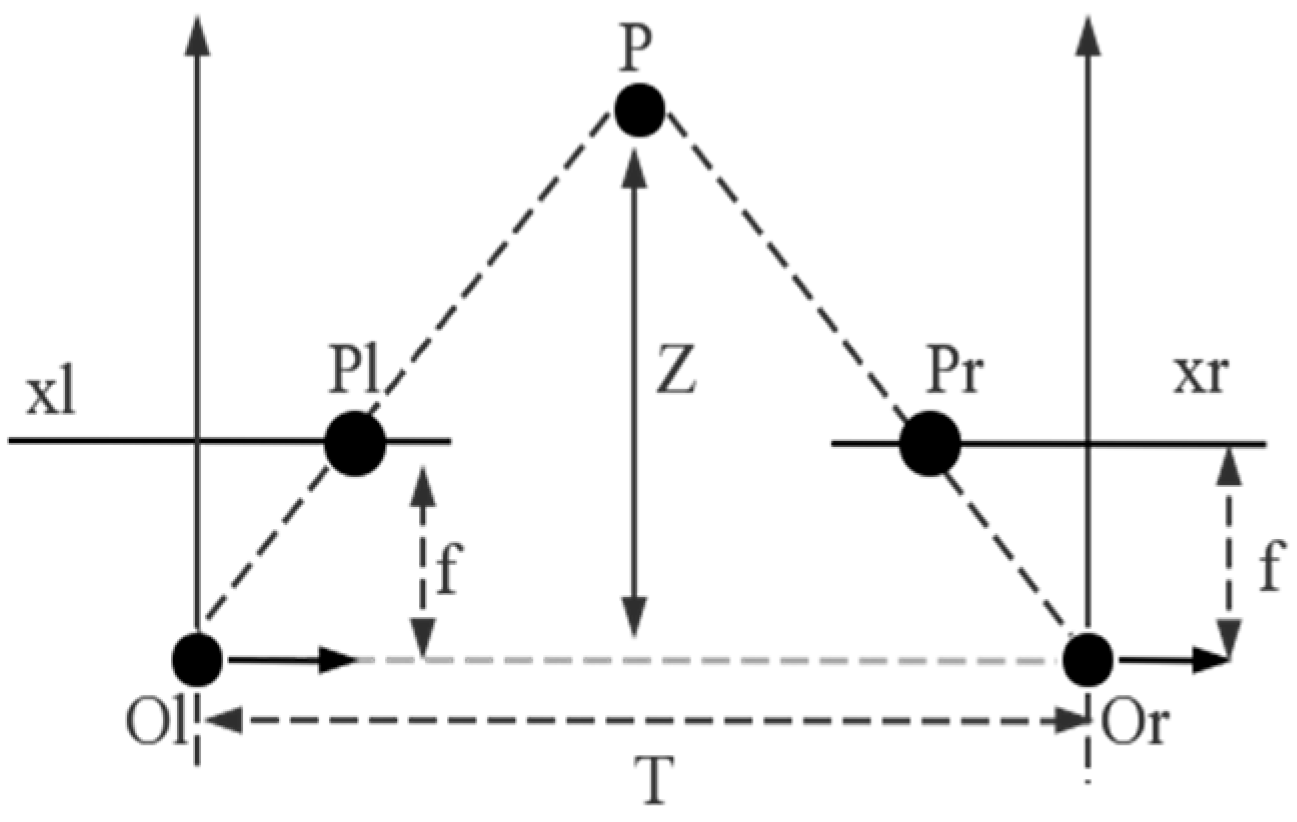
Figure 1. Schematic Diagram of Binocular Ranging.
Sustainability 14 13276 g001
Figure 2. The calibration plate used in this study.
Sustainability 14 13276 g002
Figure 3. Detection angle and extraction of the calibration plate.
Sustainability 14 13276 g003
Figure 4. Flow Chart of Image Processing.
Sustainability 14 13276 g004
Figure 5. Image processing samples: (a) left camera image; (b) right camera image.
Sustainability 14 13276 g005
Figure 6. Grayscale renderings: (a) grayscale image on the left; (b) grayscale image on the right;
Sustainability 14 13276 g006
Figure 7. Binarized renderings: (a) left OTSU thresholding; (b) left adaptive thresholding; (c) right OTSU thresholding; (d) right adaptive thresholding.
Sustainability 14 13276 g007aSustainability 14 13276 g007b
Figure 8. Filter effect map: (a) mean filtering on the left image; (b) Gaussian filtering on the left image; (c) mean filtering on the right image; (d) Gaussian filtering on the right image.
Sustainability 14 13276 g008
Figure 9. Edge detection: (a) Canny operator on the left; (b) Sobel operator on the left; (c) Canny operator on the right; (d) Sobel operator on the right.
Sustainability 14 13276 g009
Figure 10. Bouguet stereo-corrected images.
Sustainability 14 13276 g010
Figure 11. Stereo-matching rendering diagram: (a) SAD algorithm; (b) BM algorithm; (c) SGBM algorithm.
Sustainability 14 13276 g011
Figure 12. The binocular camera used in this experiment.
Sustainability 14 13276 g012
Figure 13. Parallax diagram of experimental coal block.
Sustainability 14 13276 g013
Figure 14. Samples used in the experiment.From left to right coal blocks from large to small, successively marked A, B and C
Sustainability 14 13276 g014
Table 1. The calibration result of the camera.
Internal Parameter MatrixDistortion Parameter
left camera M l = [ 459.349 1.143 329.263 0 456.678 225.593 0 0 1 ] k l = [ 0.0154 0.0344 0.00385 0.00033 0 ]
right
camera
M r = [ 461.474 0.893 321.159 0 458.286 254.798 0 0 1 ] k r = [ 0.0125 0.0303 0.0038 0.00033 0 ]
Table 2. The rotation matrix of the binocular camera works with the translation vector.
R = [ 1.000 0.000959 0.000867 0.000958 1.000 0.00105 0.000868 0.00105 1.000 ]
T = [ 25.586 2.2287 1.387 ]
Table 3. Data results for the target ranging.
Height from Coal Block/mmHeight above Ground/mmObject Height Measurement/mmRelative Error
Group One 338.313397.3459.0271.79%
Group Two345.335406.01960.6840.97%
Group Three338.994401.3162.3163.68%
Group Four337.066397.3860.3140.37%
Group Five344.435402.82358.3882.85%
Table 4. Results of the target volume measurements.
Coal Measurement Volume/(mm3)Actual Volume of Coal/(mm3)Relative Error/%
A674,177.828945650,0002.95%
B455,641.367206430,0005.96%
C244,690.001879230,0006.39%
B + C708,409.589607660,0007.33%
Publisher’s Note: MDPI stays neutral with regard to jurisdictional claims in published maps and institutional affiliations.