

Influence of Triangle-Shaped Obstacles on the Energy and Exergy Performance of an Air-Cooled Photovoltaic Thermal (PVT) Collector


Abstract
1. Introduction
2. Mathematical Modeling
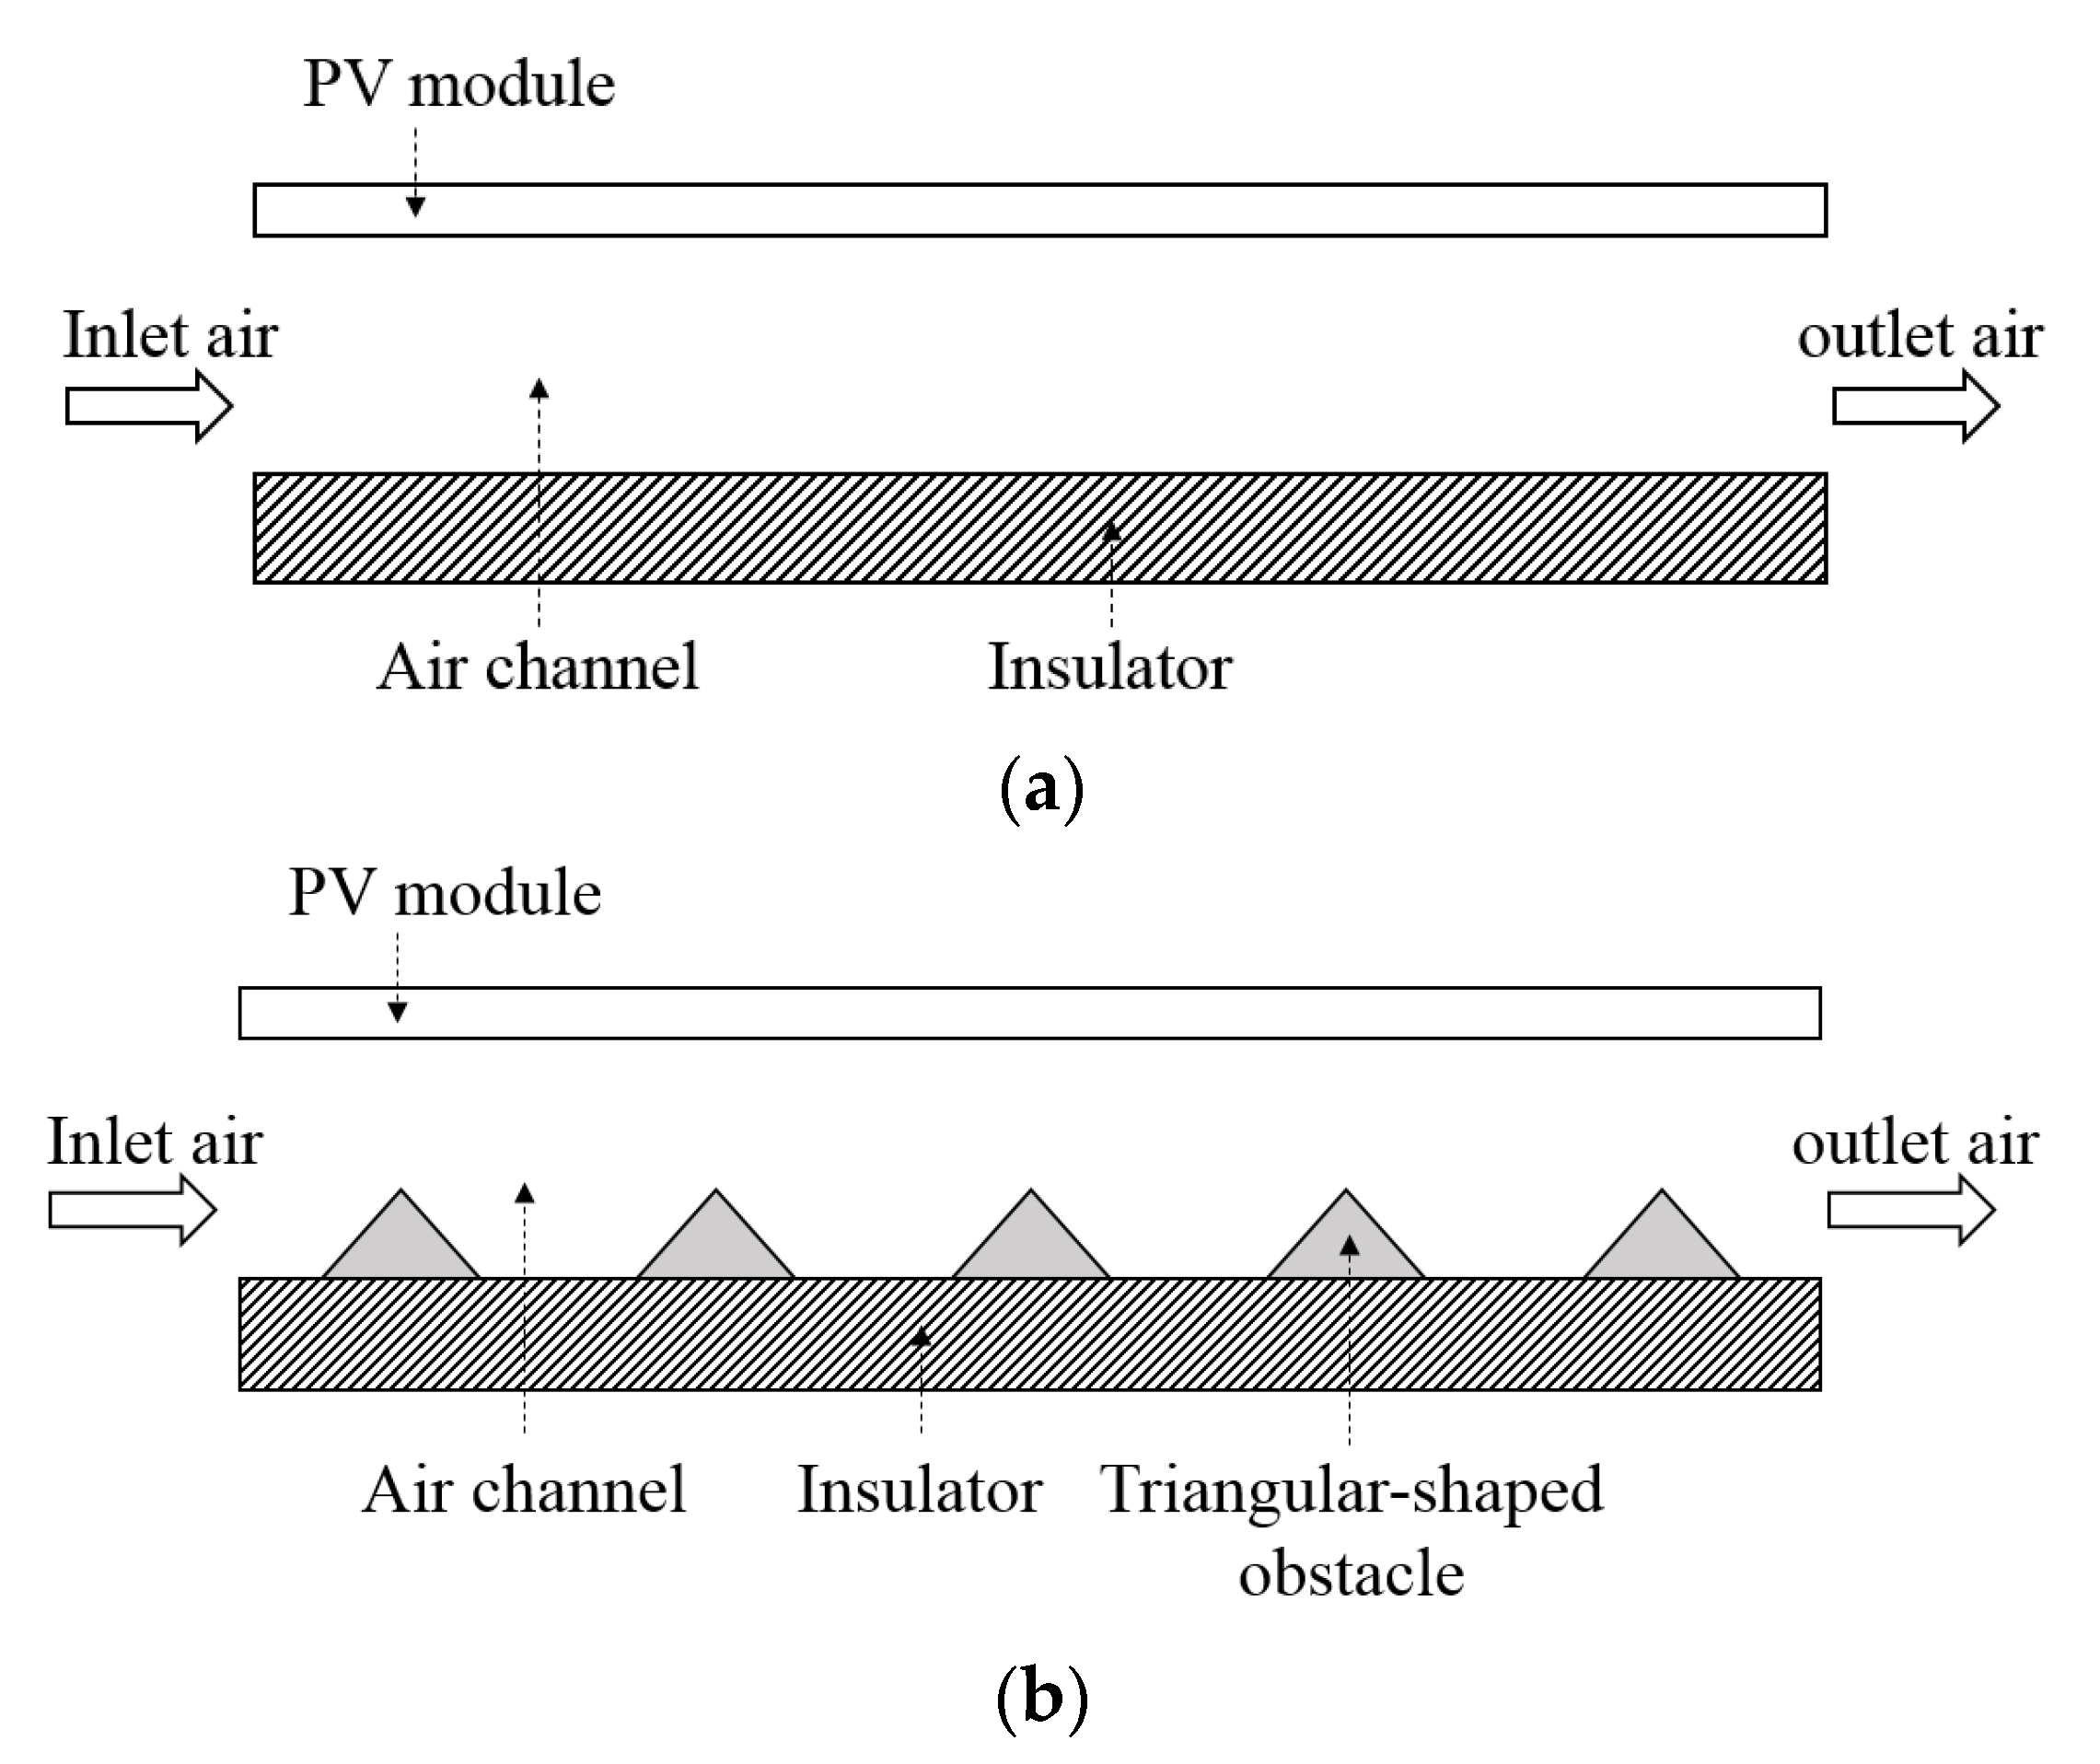
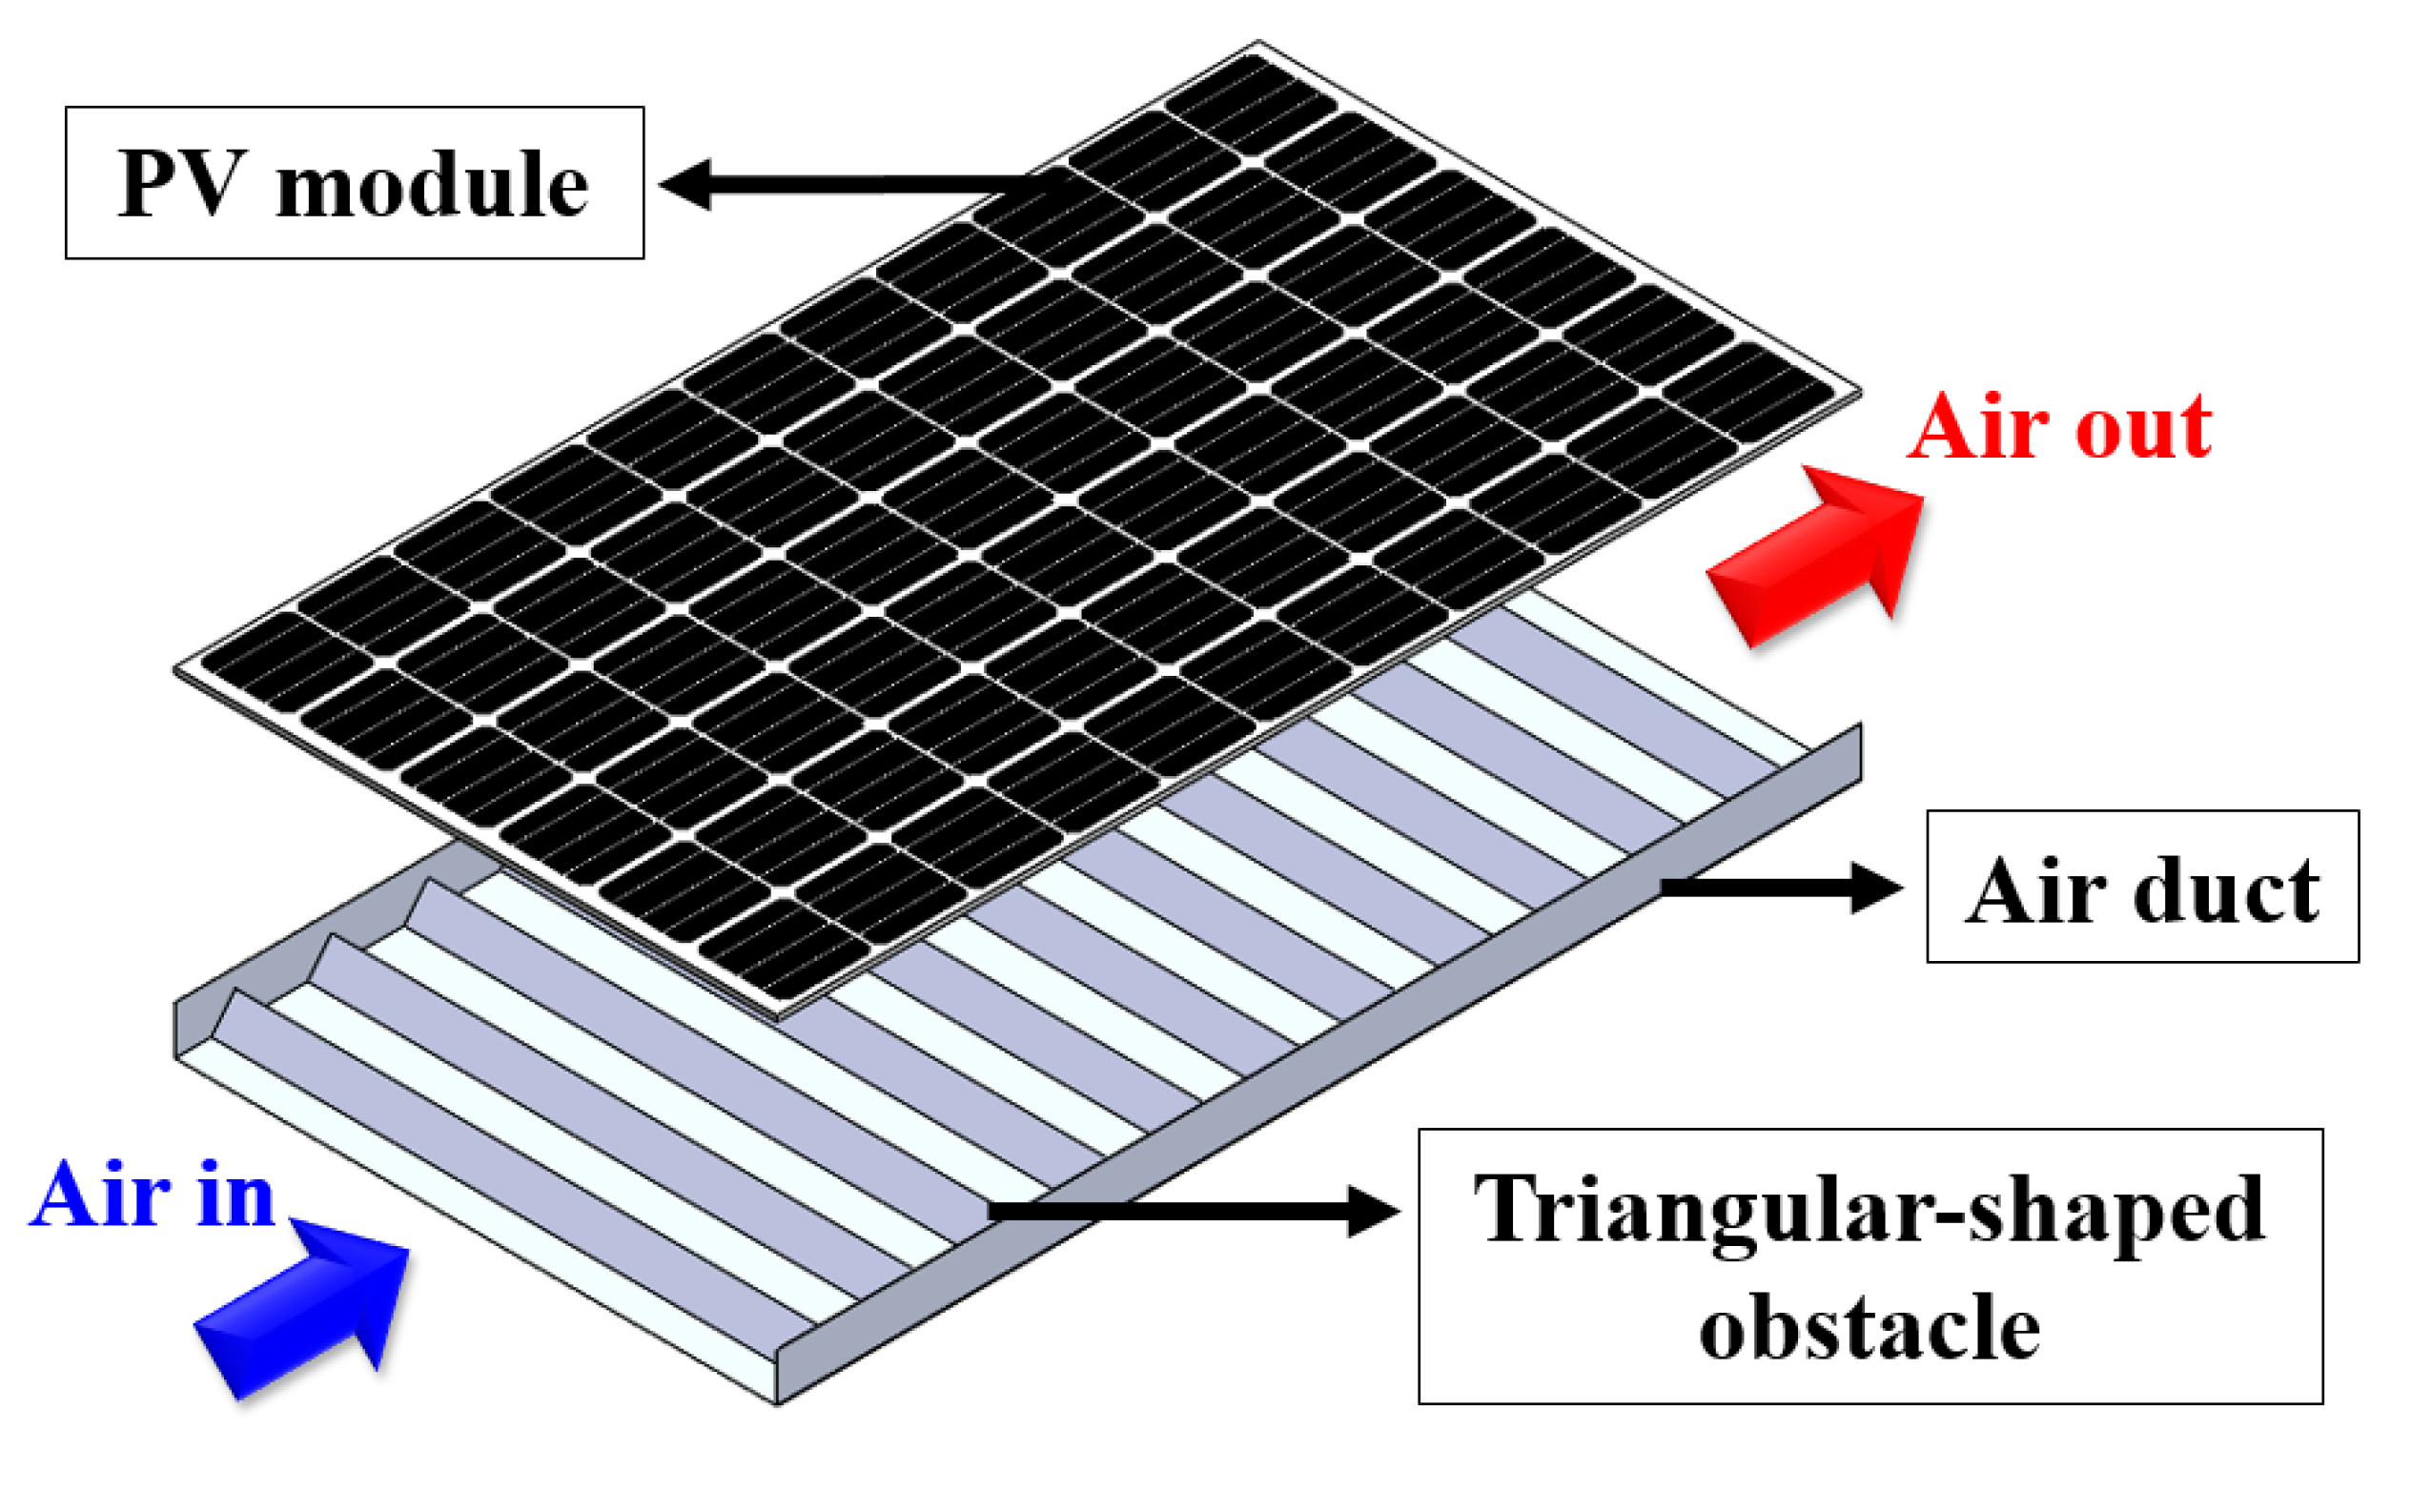
2.1. Theoretical Model of the Air-Cooled PVT Collector
- The PVT collector was assumed to be in a steady-state condition.
- Conduction heat transfer along the thickness of the solid layer was neglected due to their low thickness.
- The ambient air temperature was equal to the inlet air temperature of the collector.
- Since the side and bottom surfaces of the PVT collector were well insulated, heat loss at the side and bottom surfaces were ignored.
- The design parameters and properties of air were assumed to be constant.
2.2. Thermal Resistance
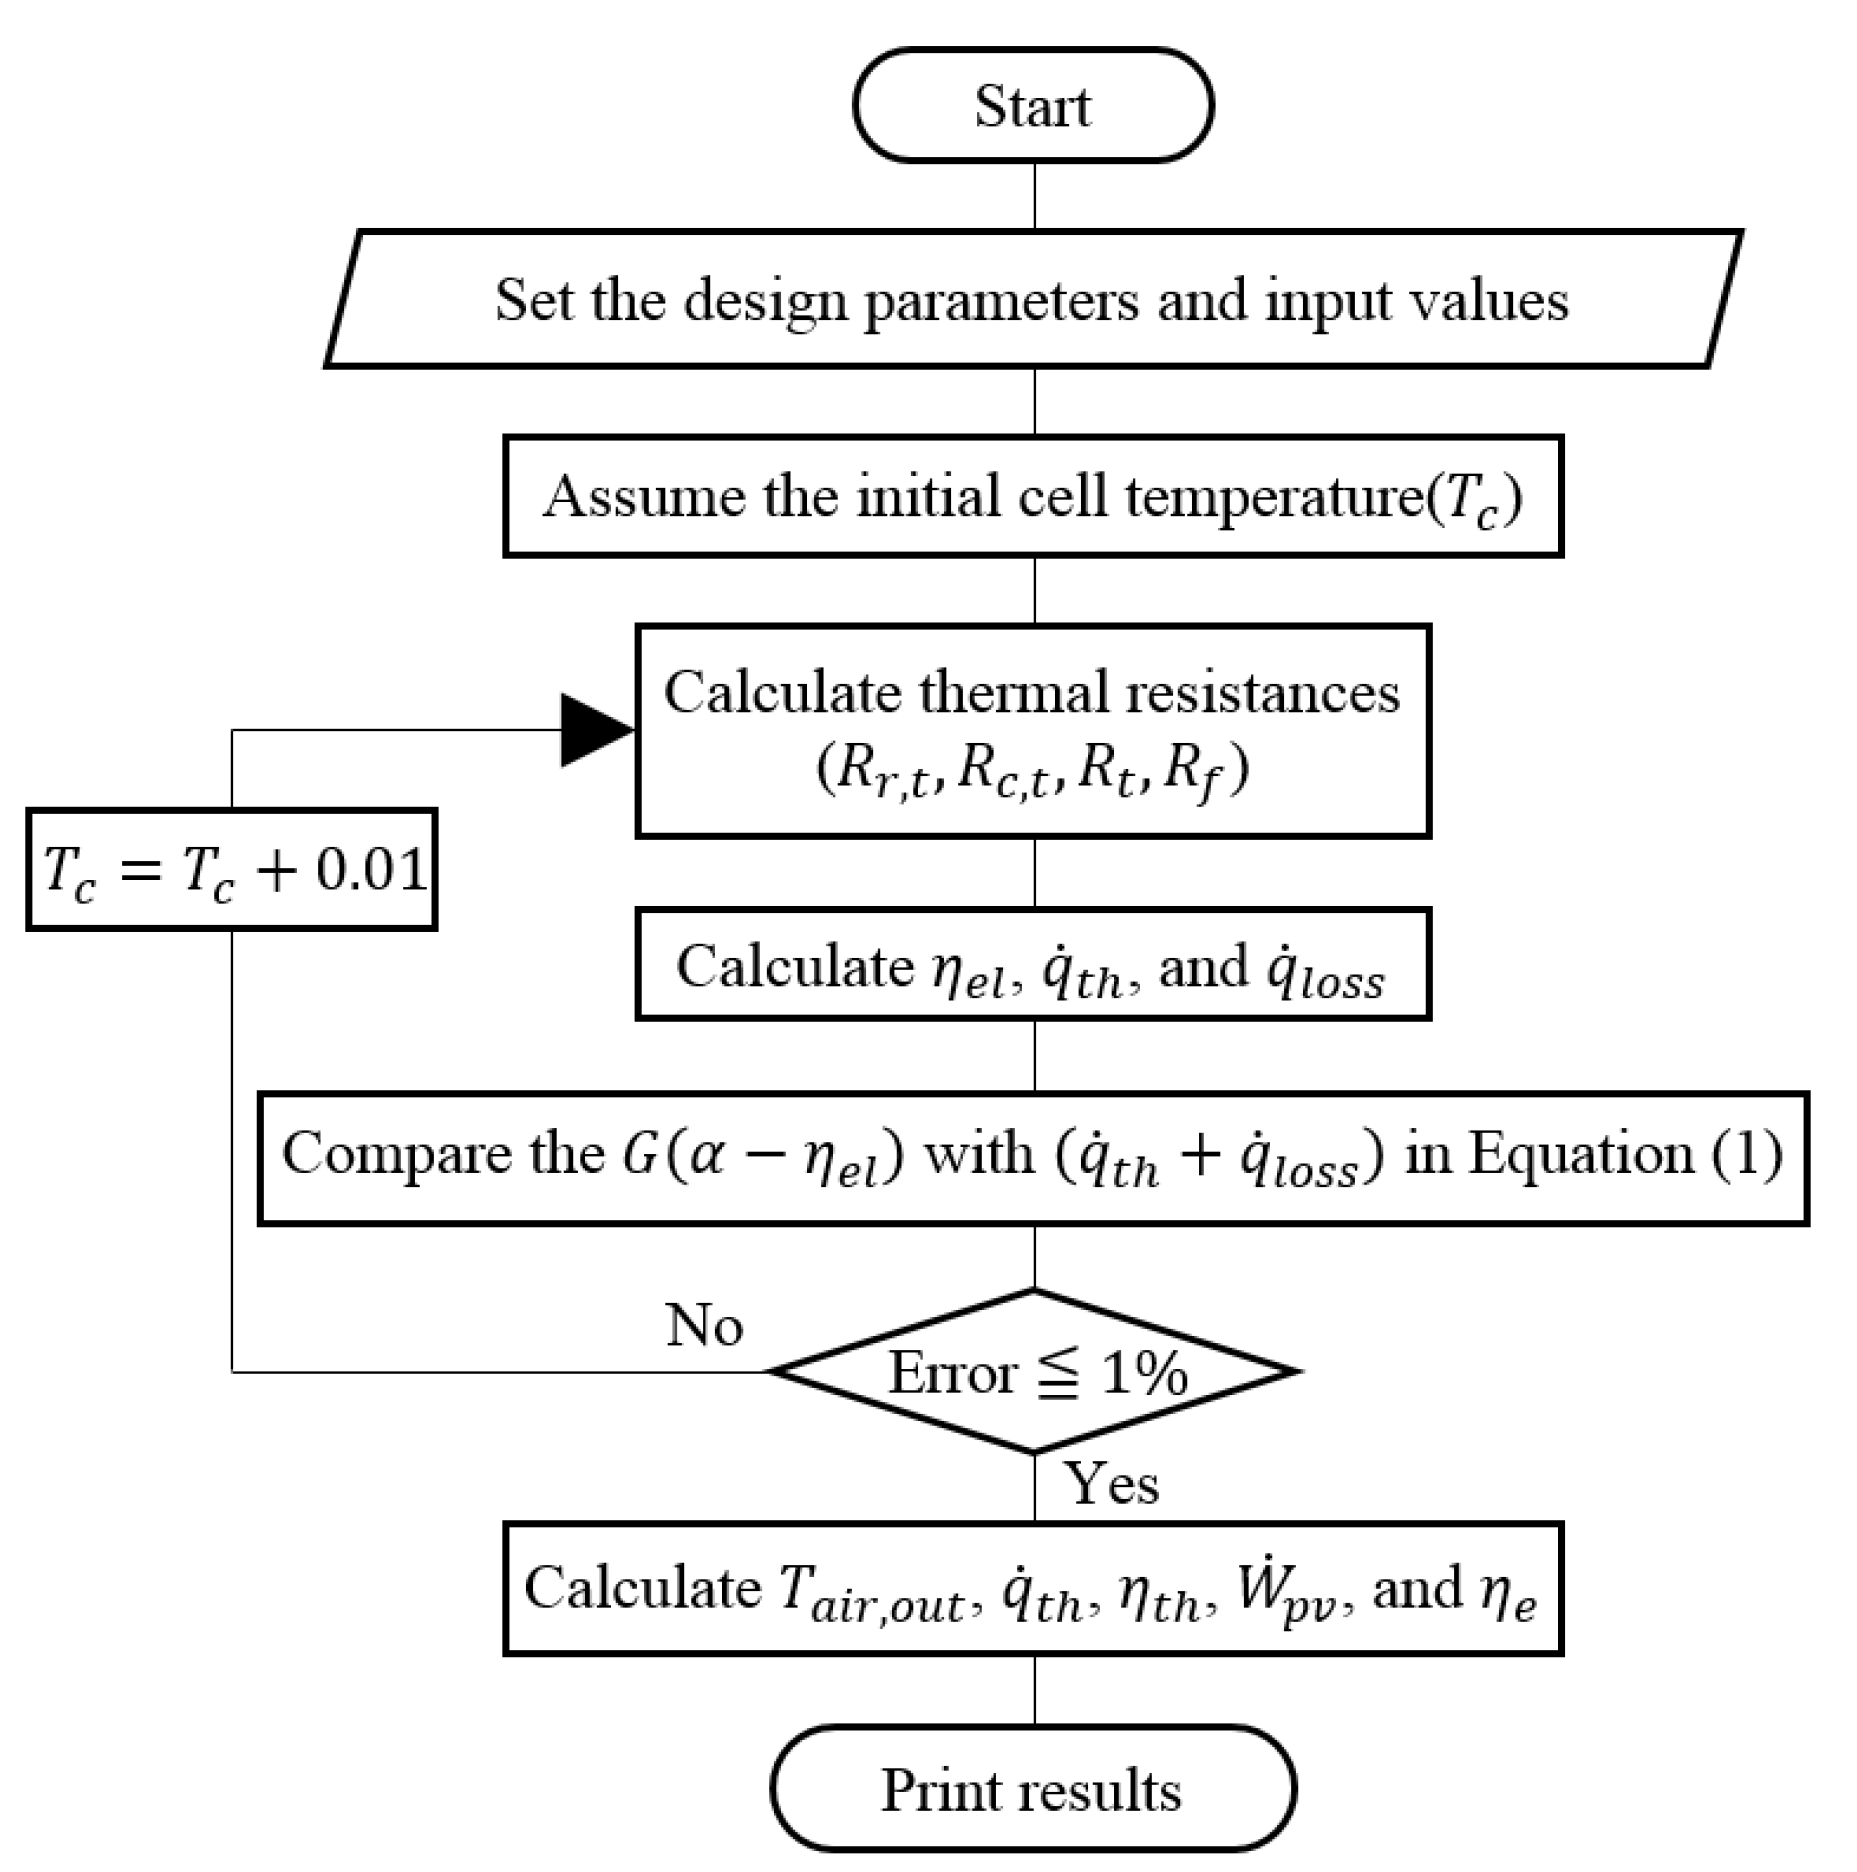
2.3. Solution Process
- First, the cell temperature of the PVT collector was assumed to be 0.01 °C higher than the ambient temperature.
- Second, the thermal resistances were calculated with the assumed cell temperature.
- Third, electrical efficiency, thermal output, and total heat loss were obtained based on the calculated thermal resistances.
- Fourth, the left- and right-hand side terms in Equation (1) were compared.
3. Energy and Exergy Analysis
3.1. Energy Analysis
3.2. Exergy Analysis
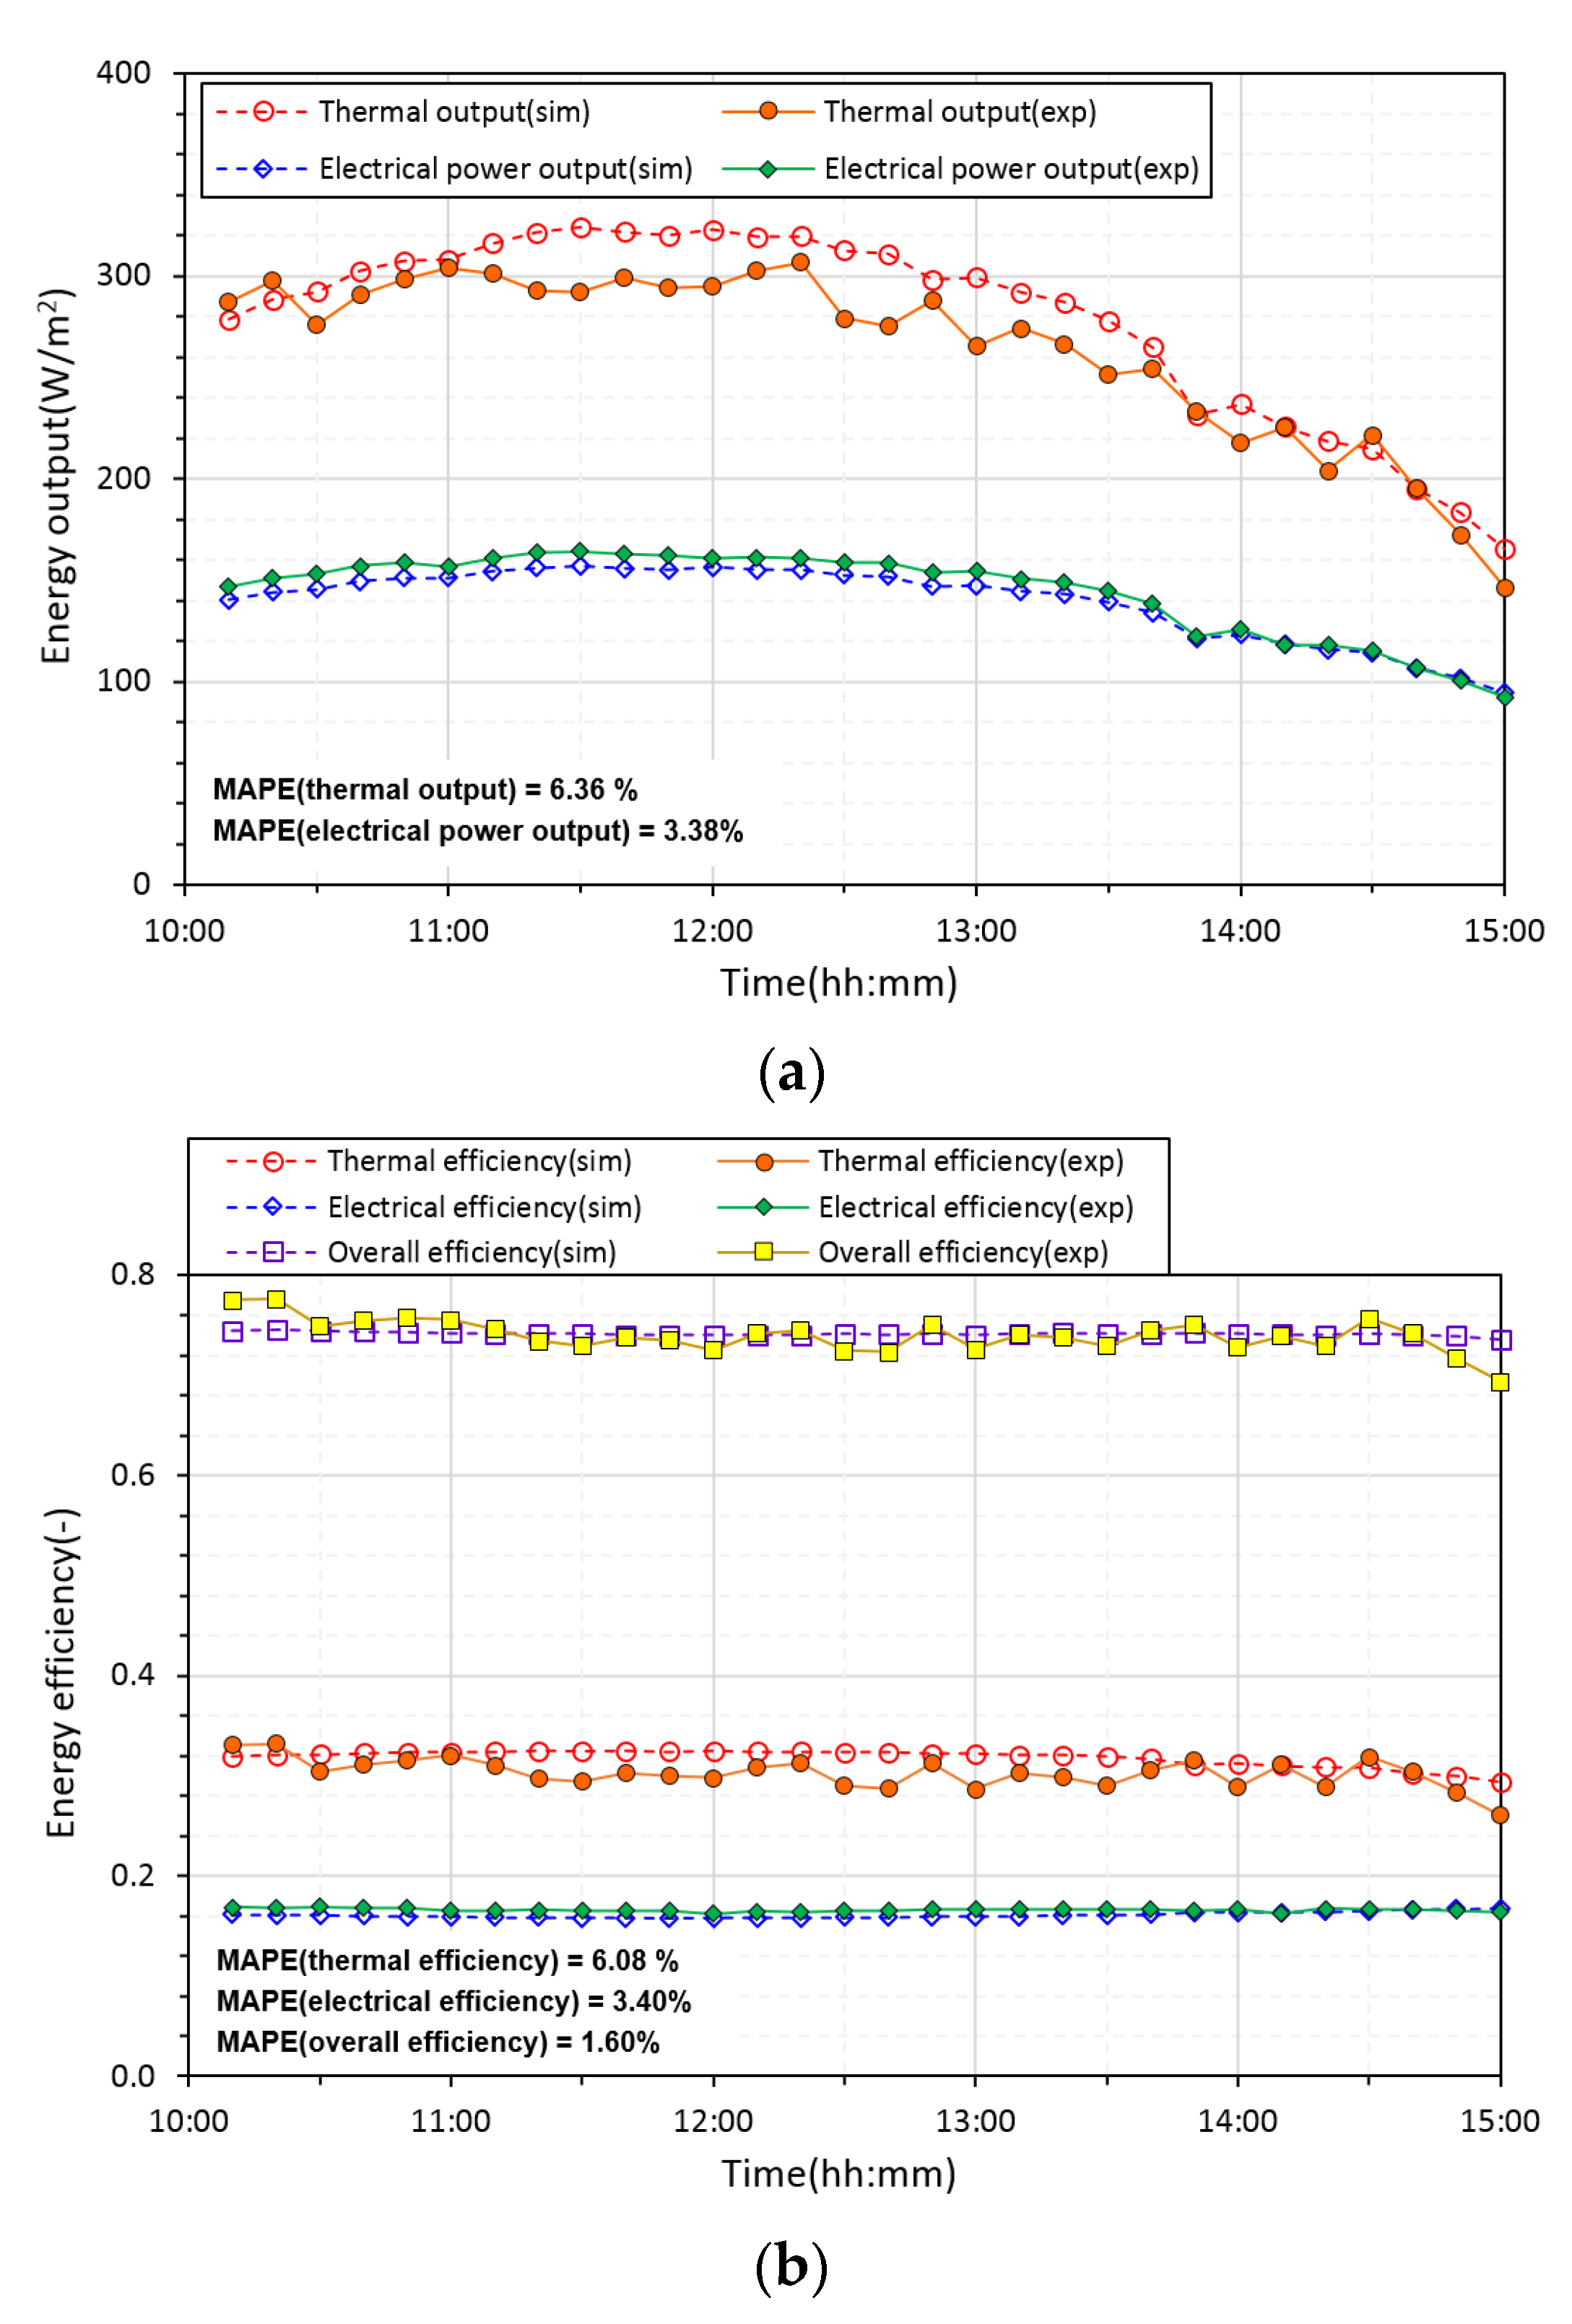
4. Validation
5. Methodology
6. Results and Discussion
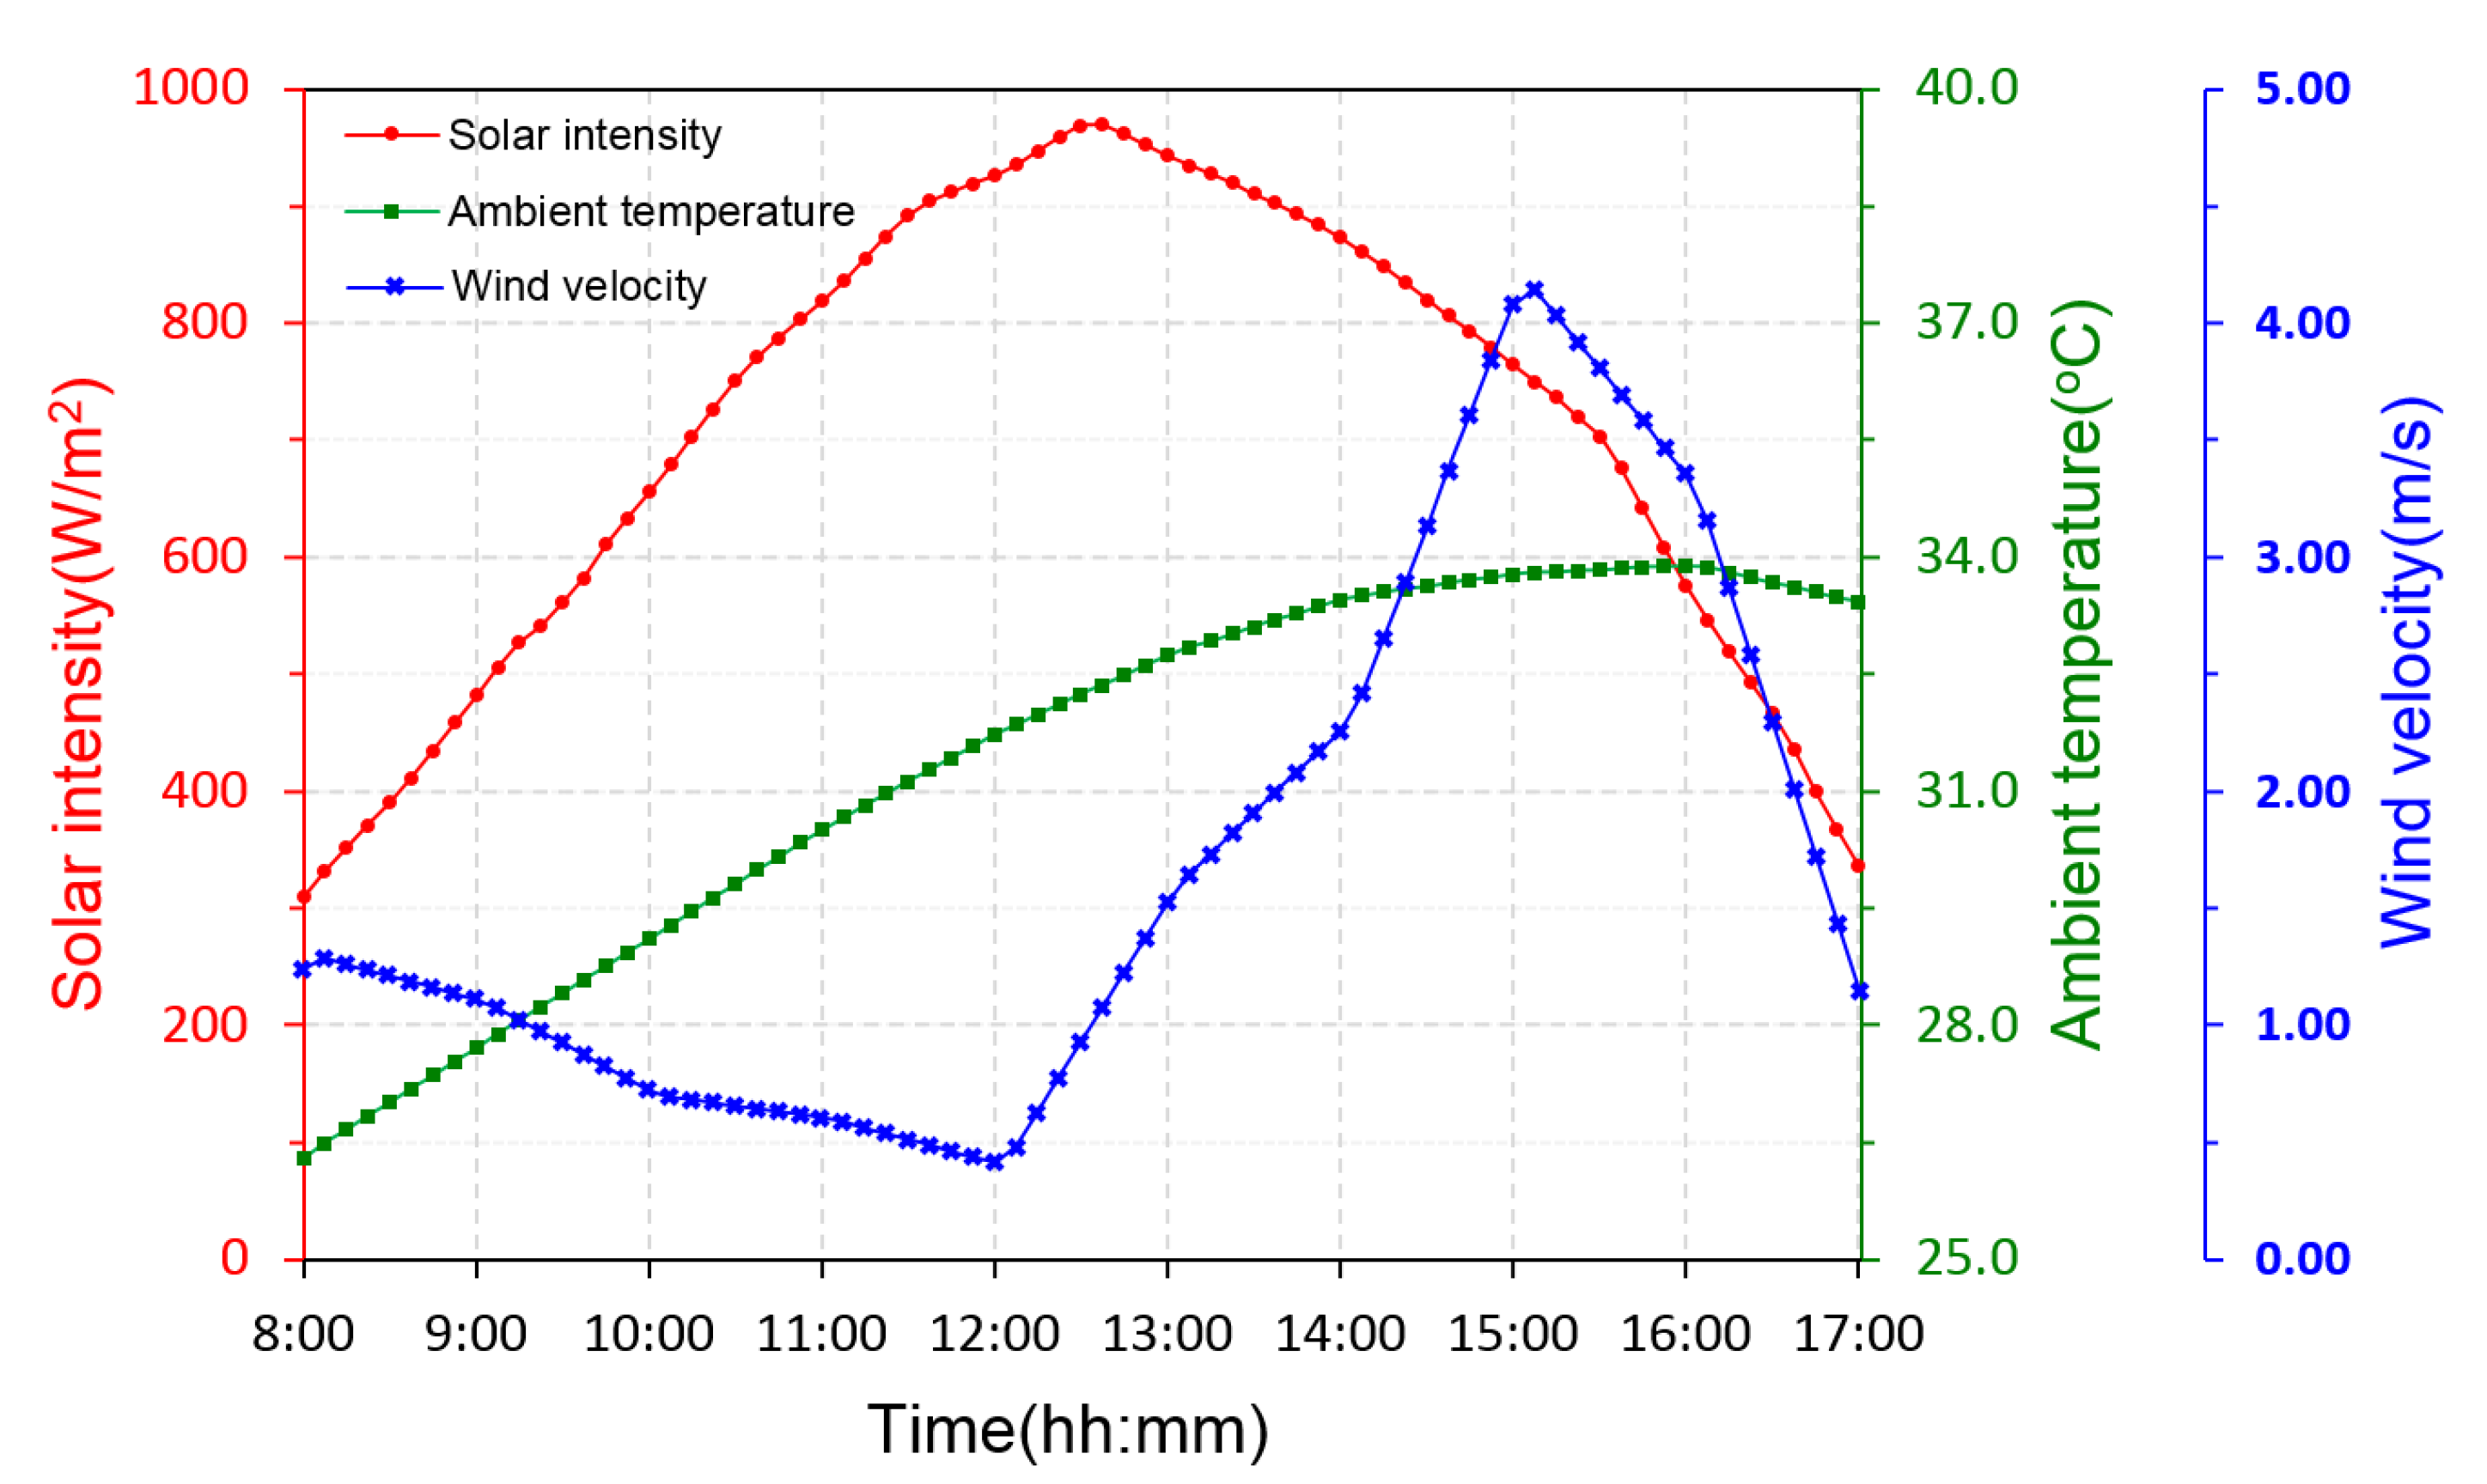
6.1. Daily Performance
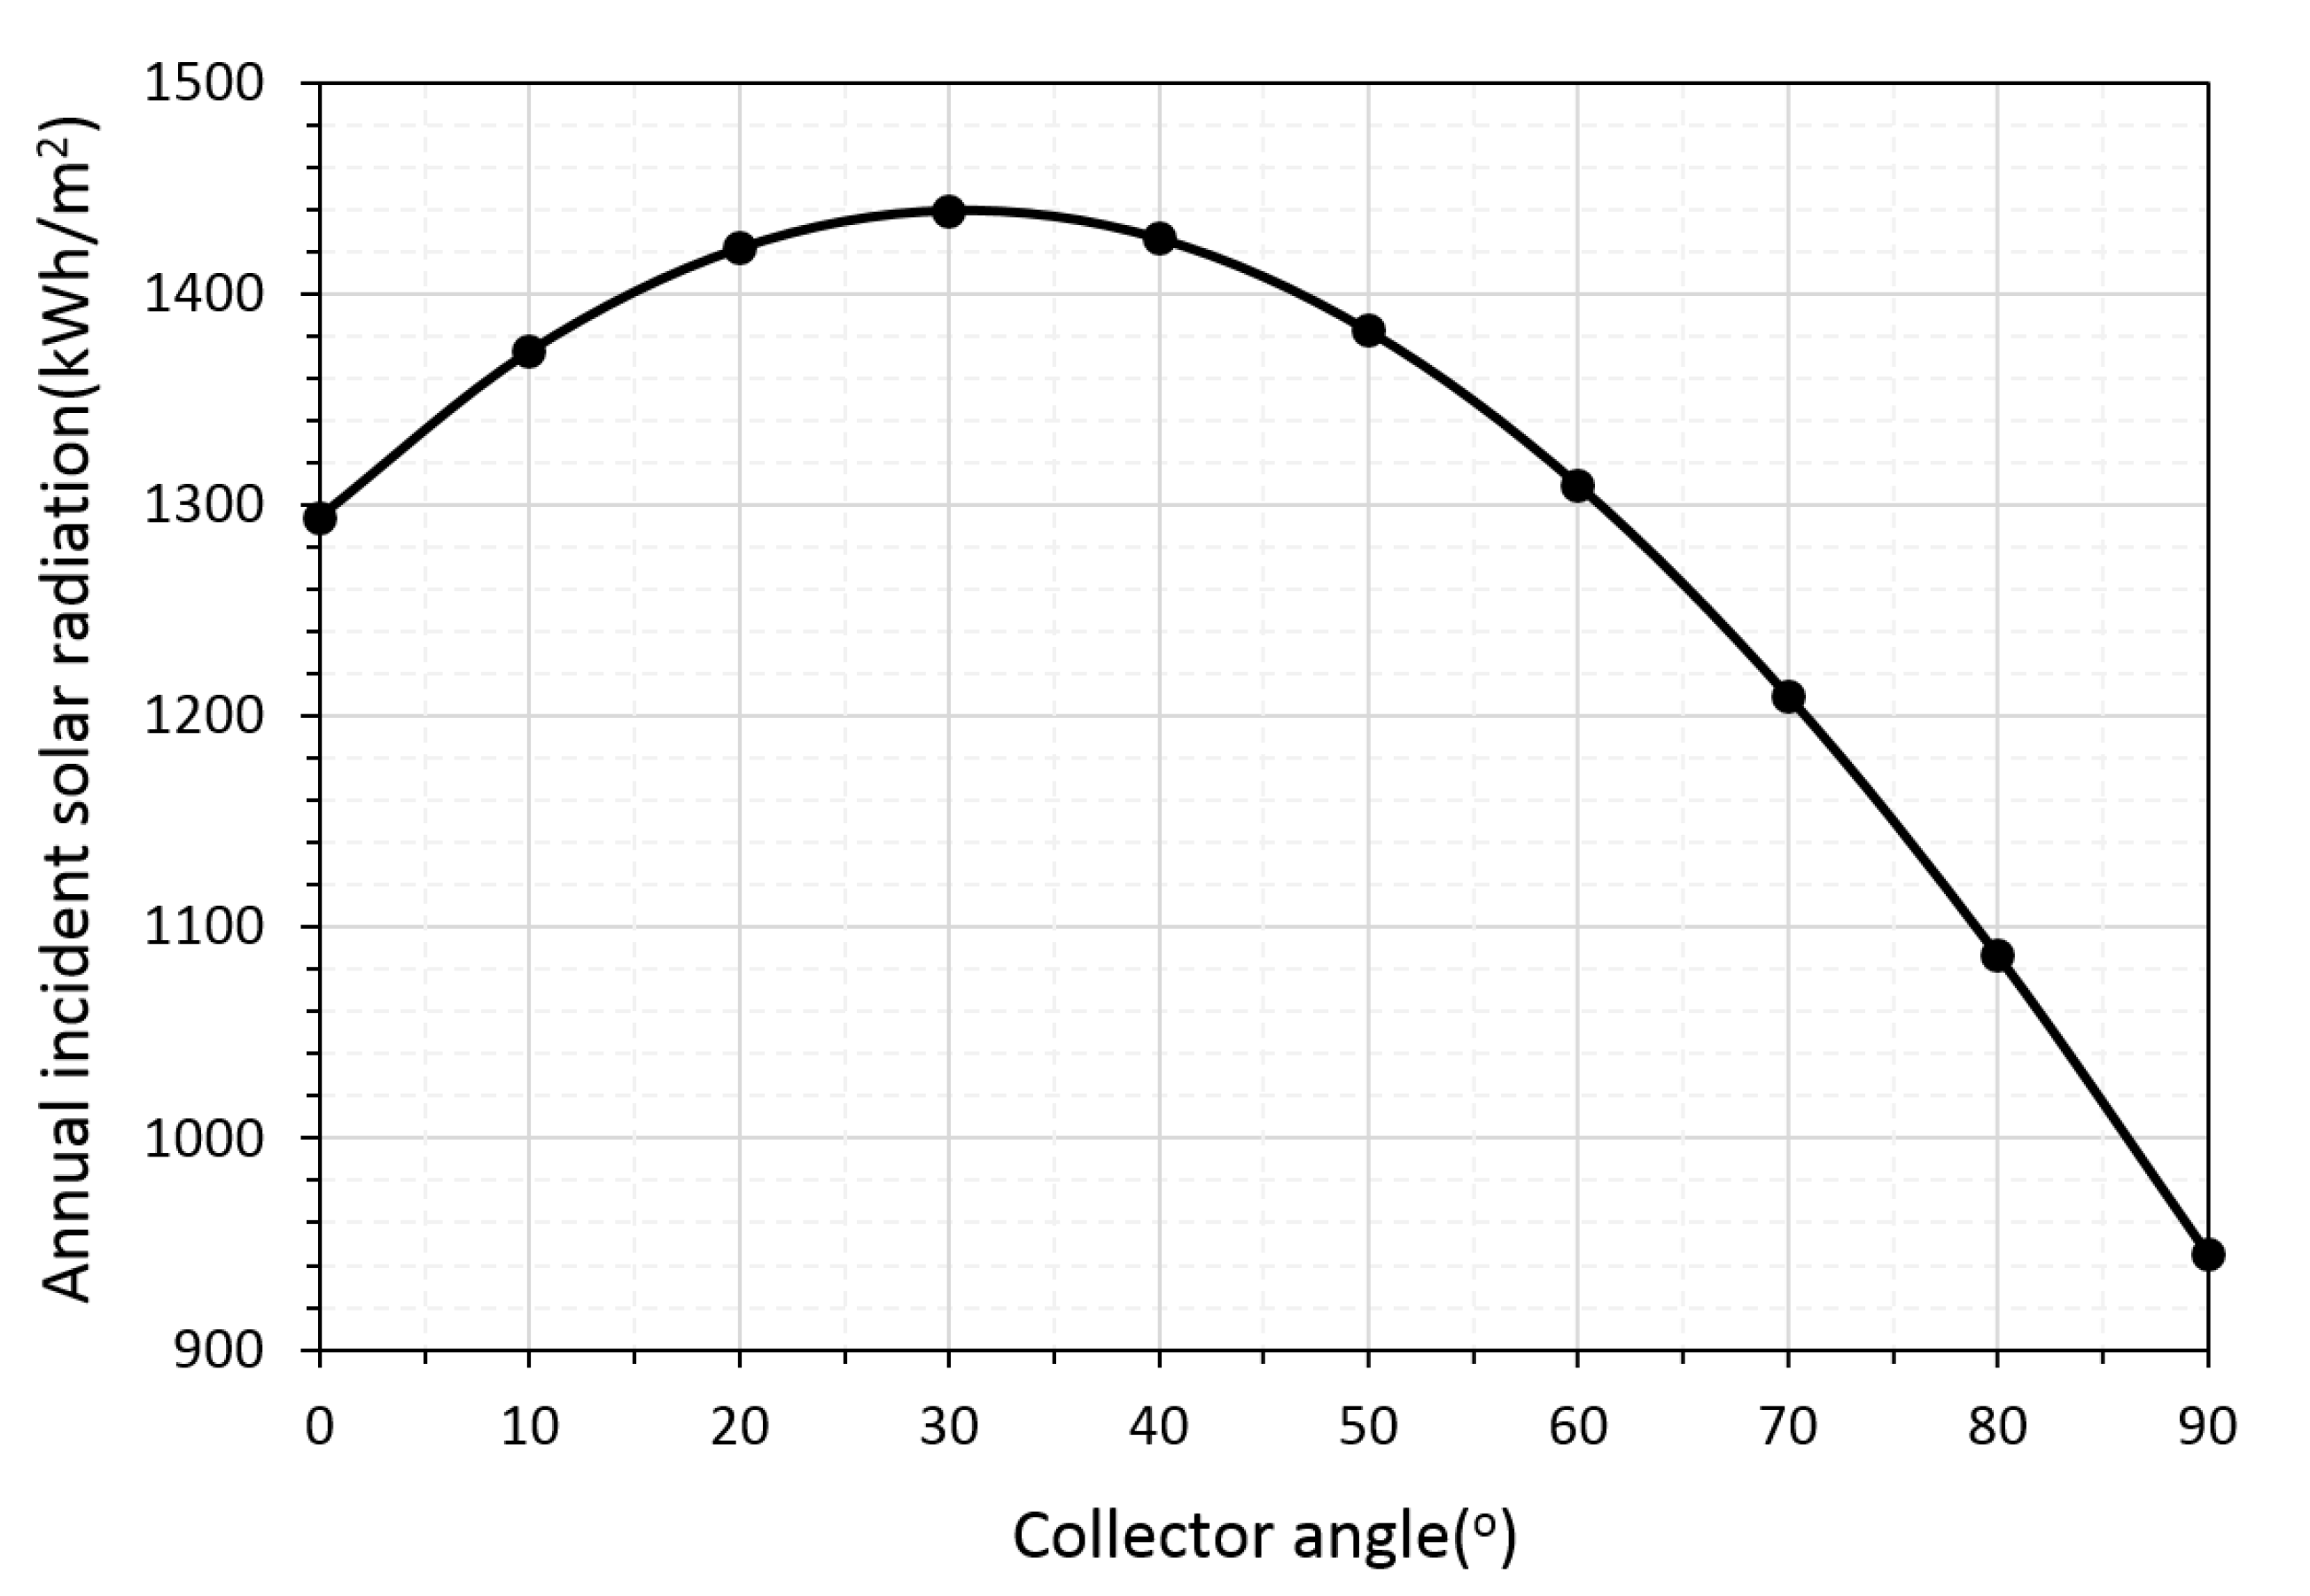
6.2. Annual Performance
7. Conclusions
- (1)
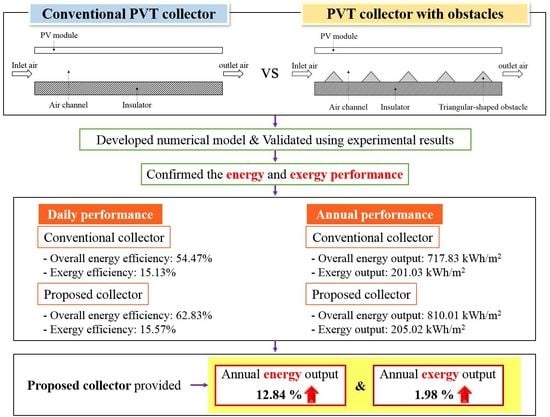
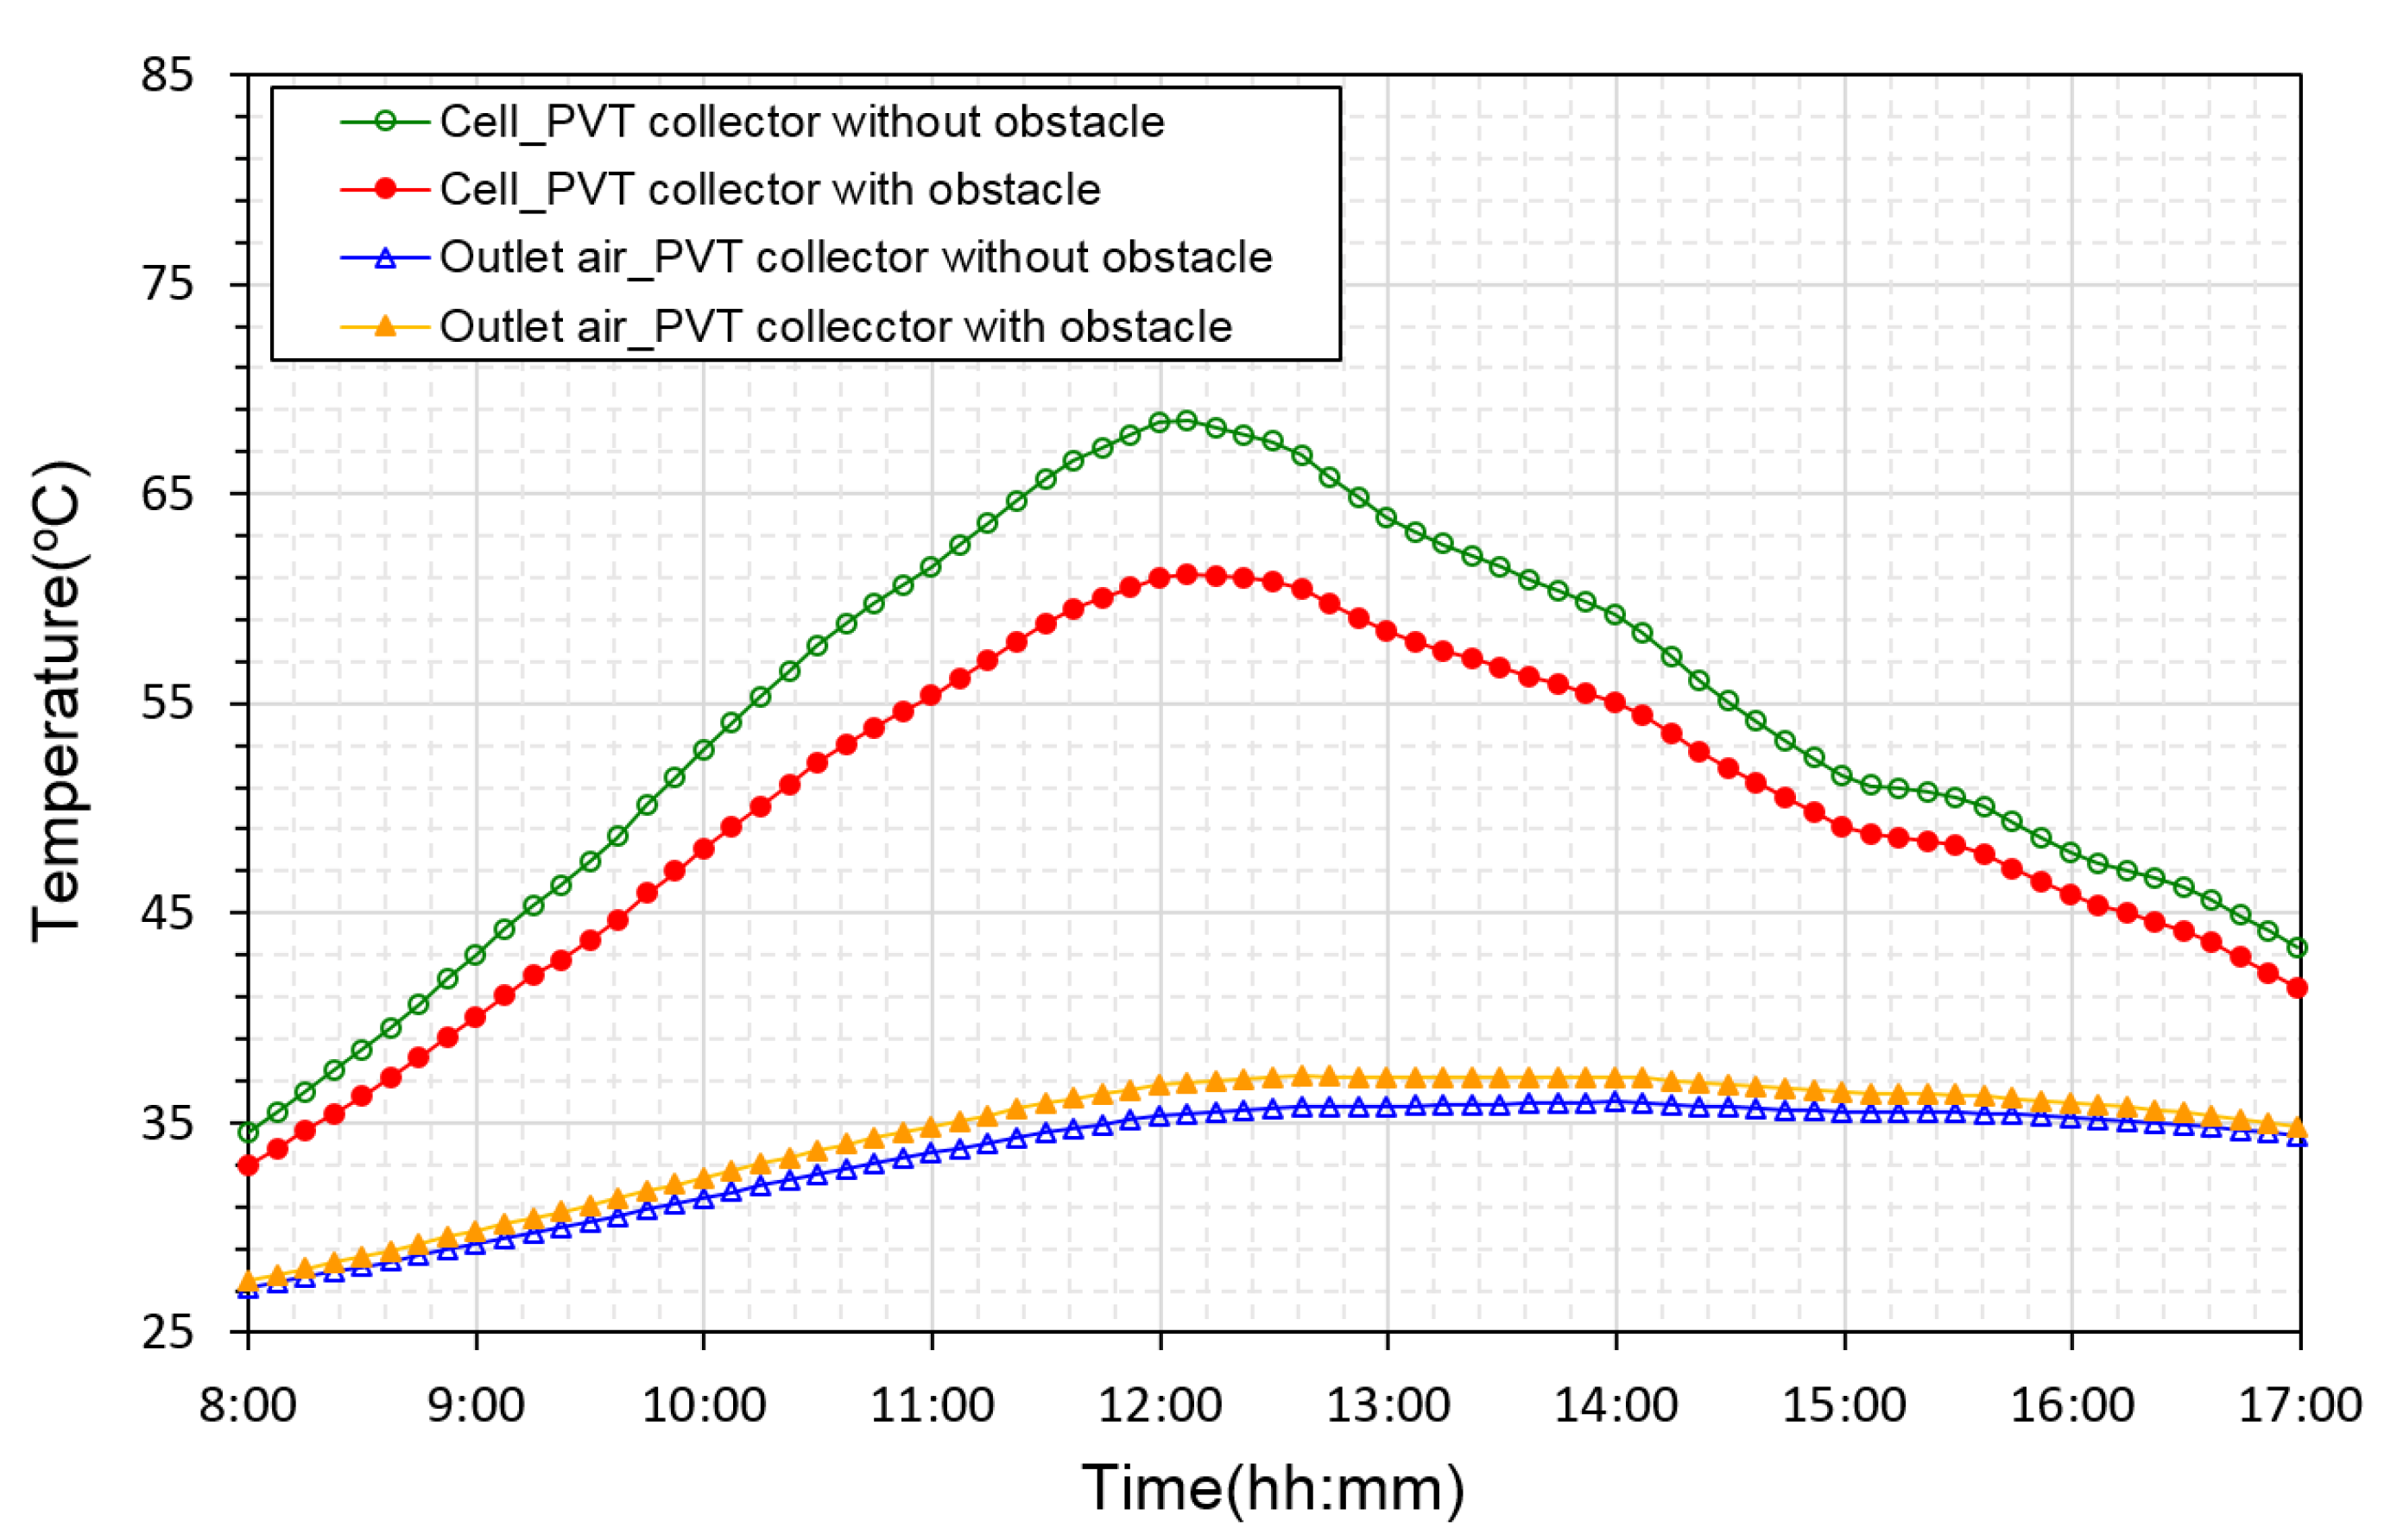
- From the daily operation, it was confirmed that the installation of triangle-shaped obstacles leads to a reduction in the cell temperature and an increase in the outlet air temperature of the air-cooled PVT collector.
- (2)
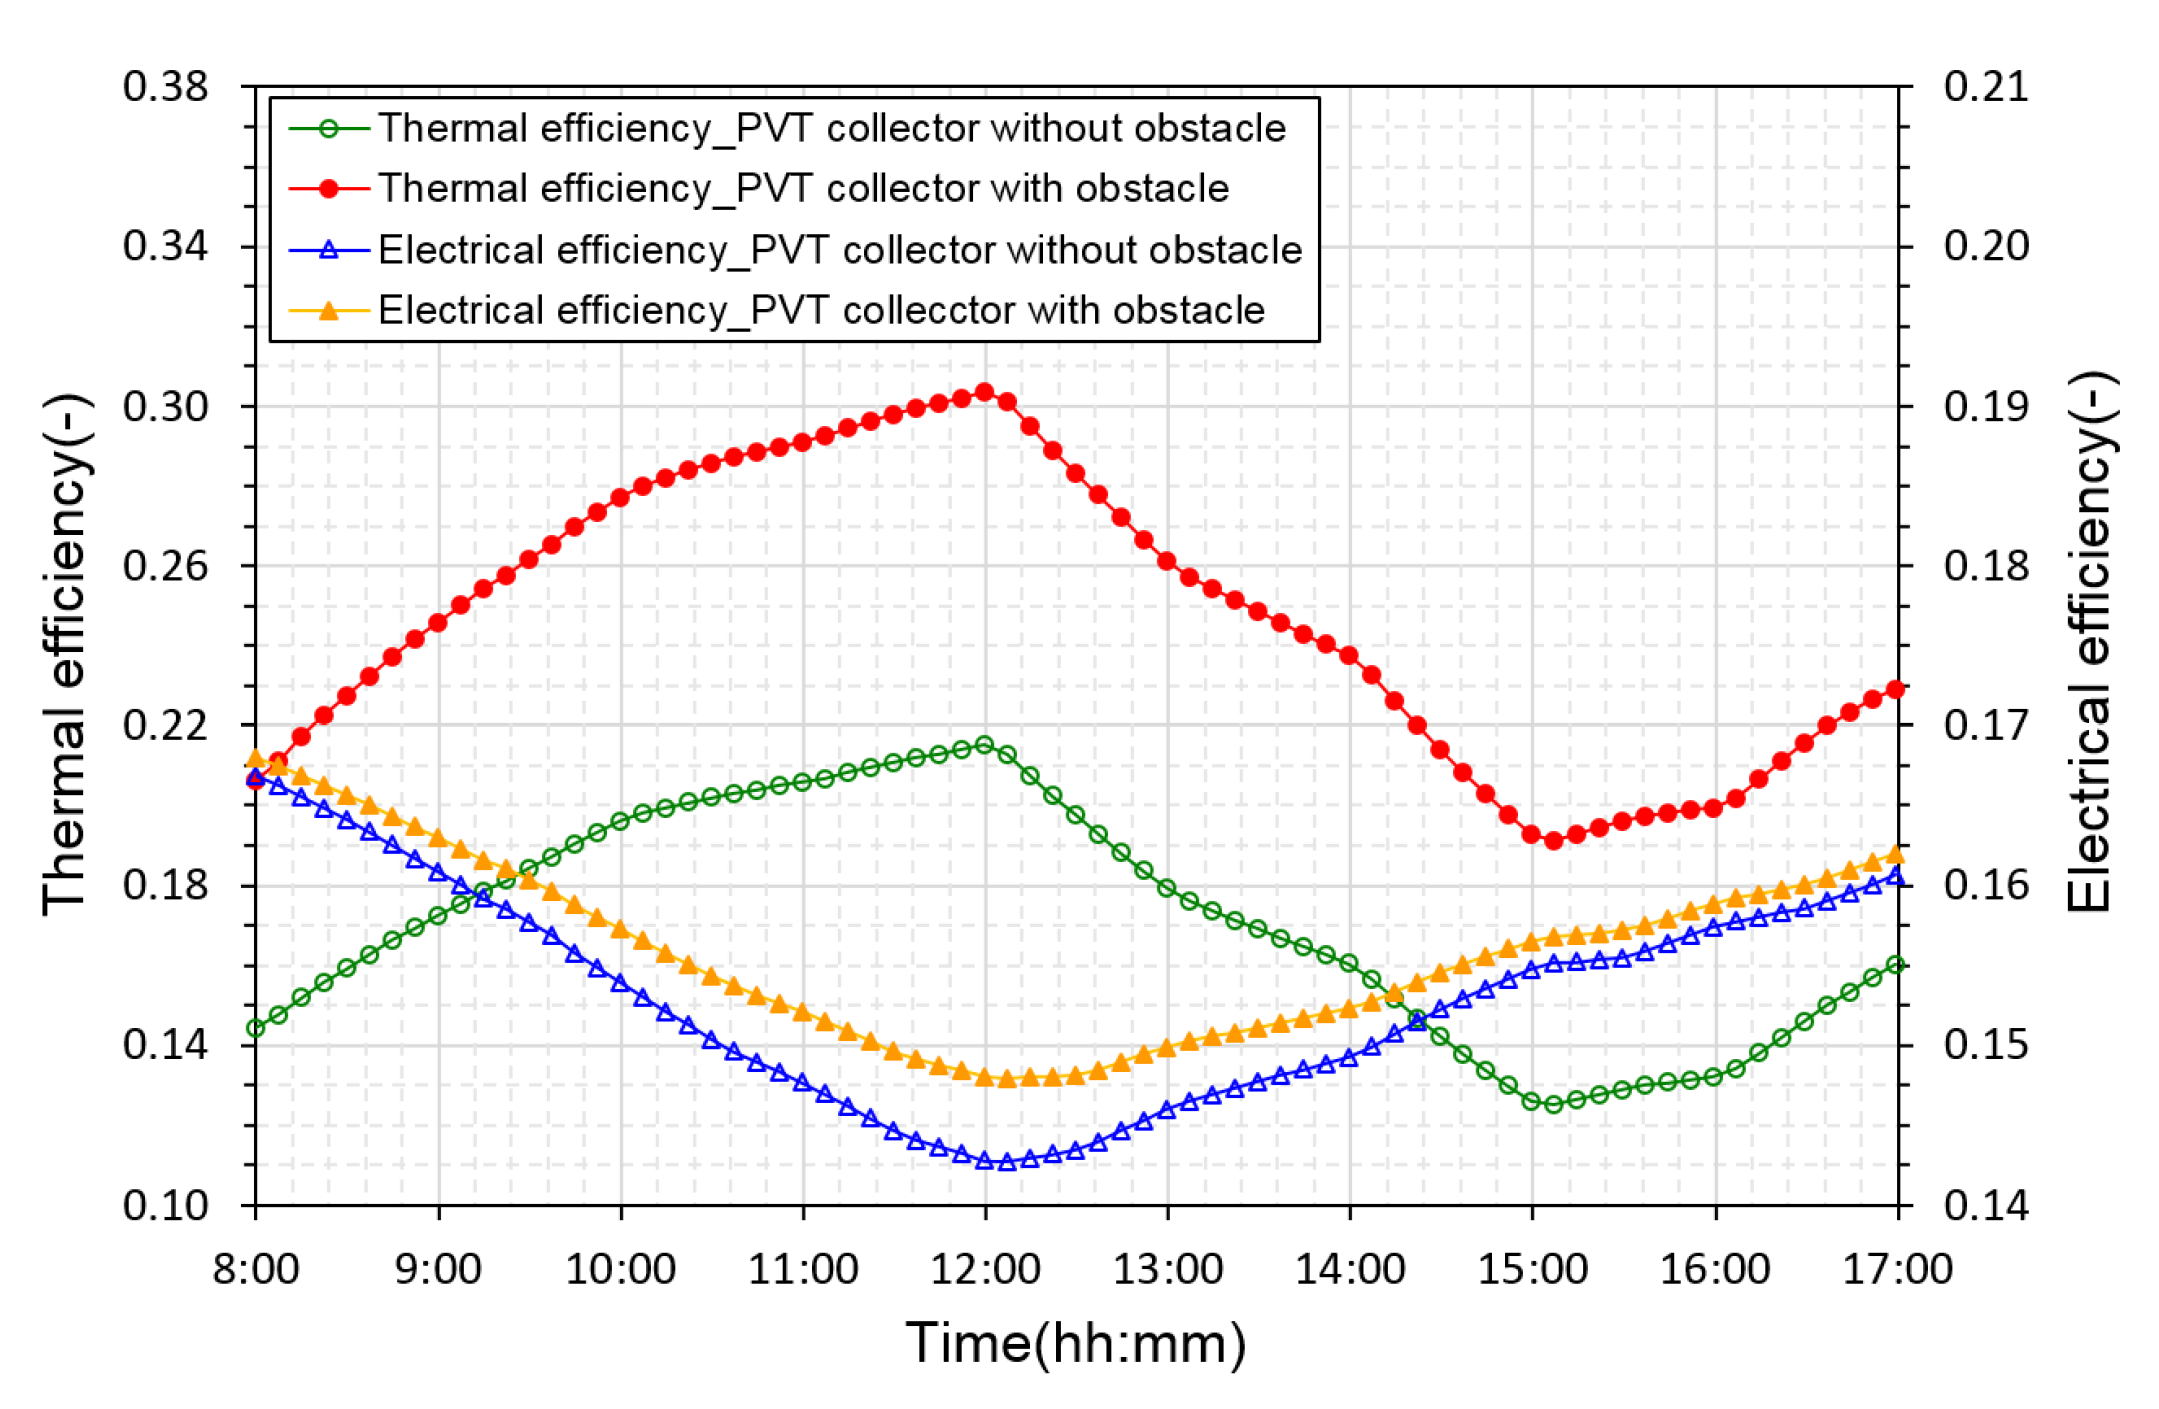
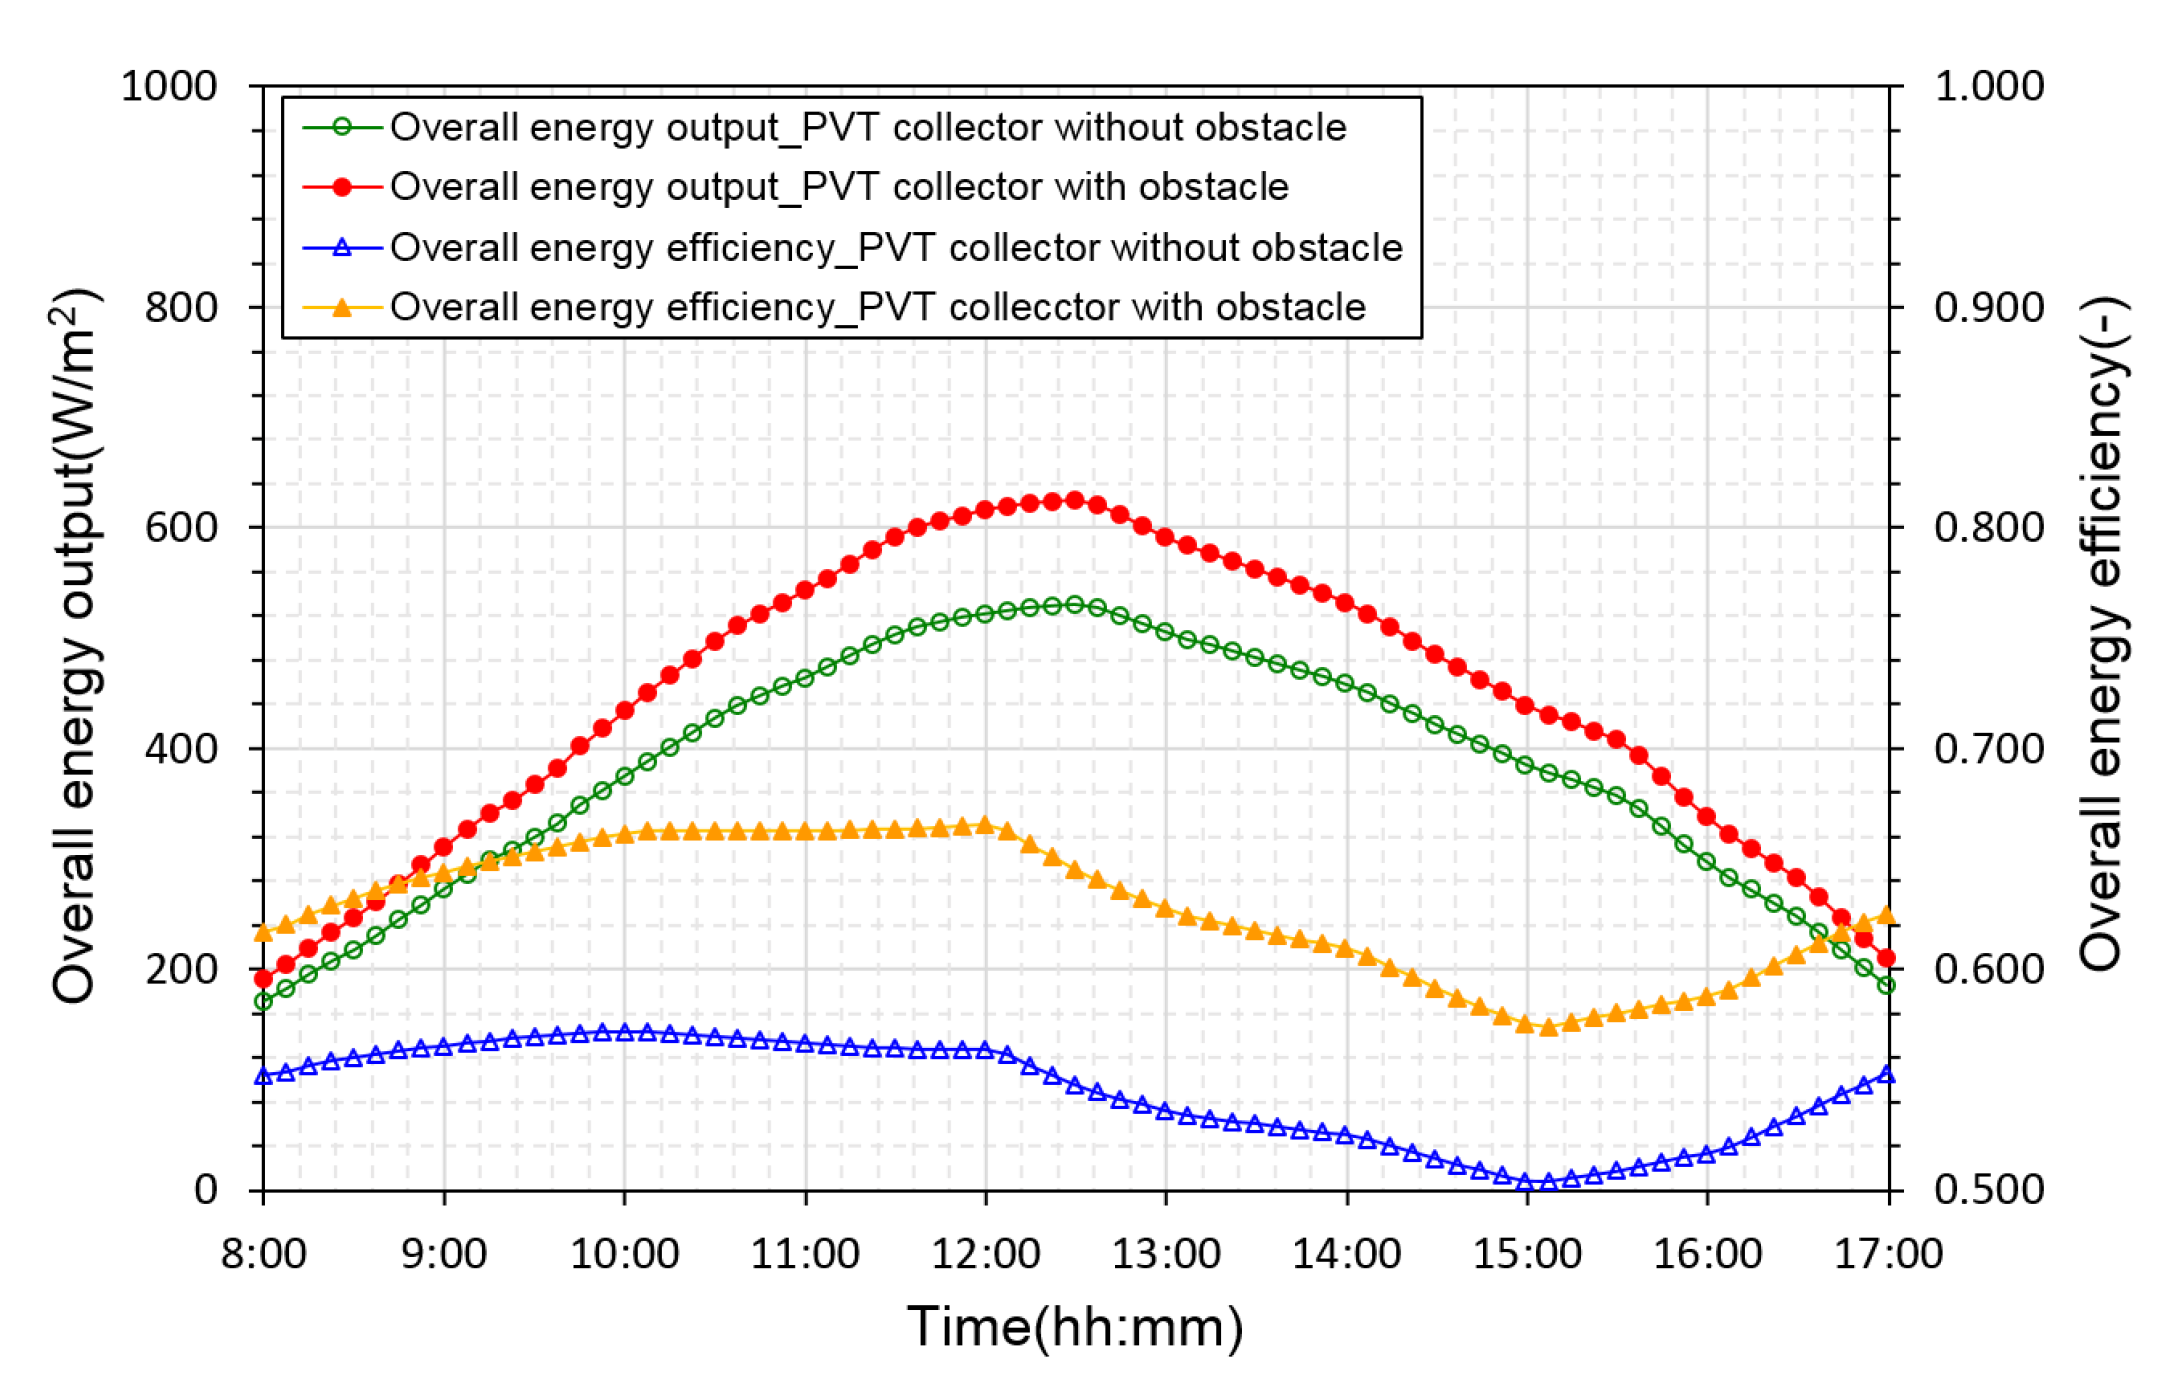
- The daily average thermal, electrical, and overall energy efficiencies were found to be 24.73%, 15.59%, and 62.83%, respectively, for the PVT collector with triangle-shaped obstacles, while those of the conventional PVT collector were 17.08%, 15.30%, and 54.47%, respectively. The daily overall efficiency could be improved by 15.35% as a result of the installation of obstacles.
- (3)
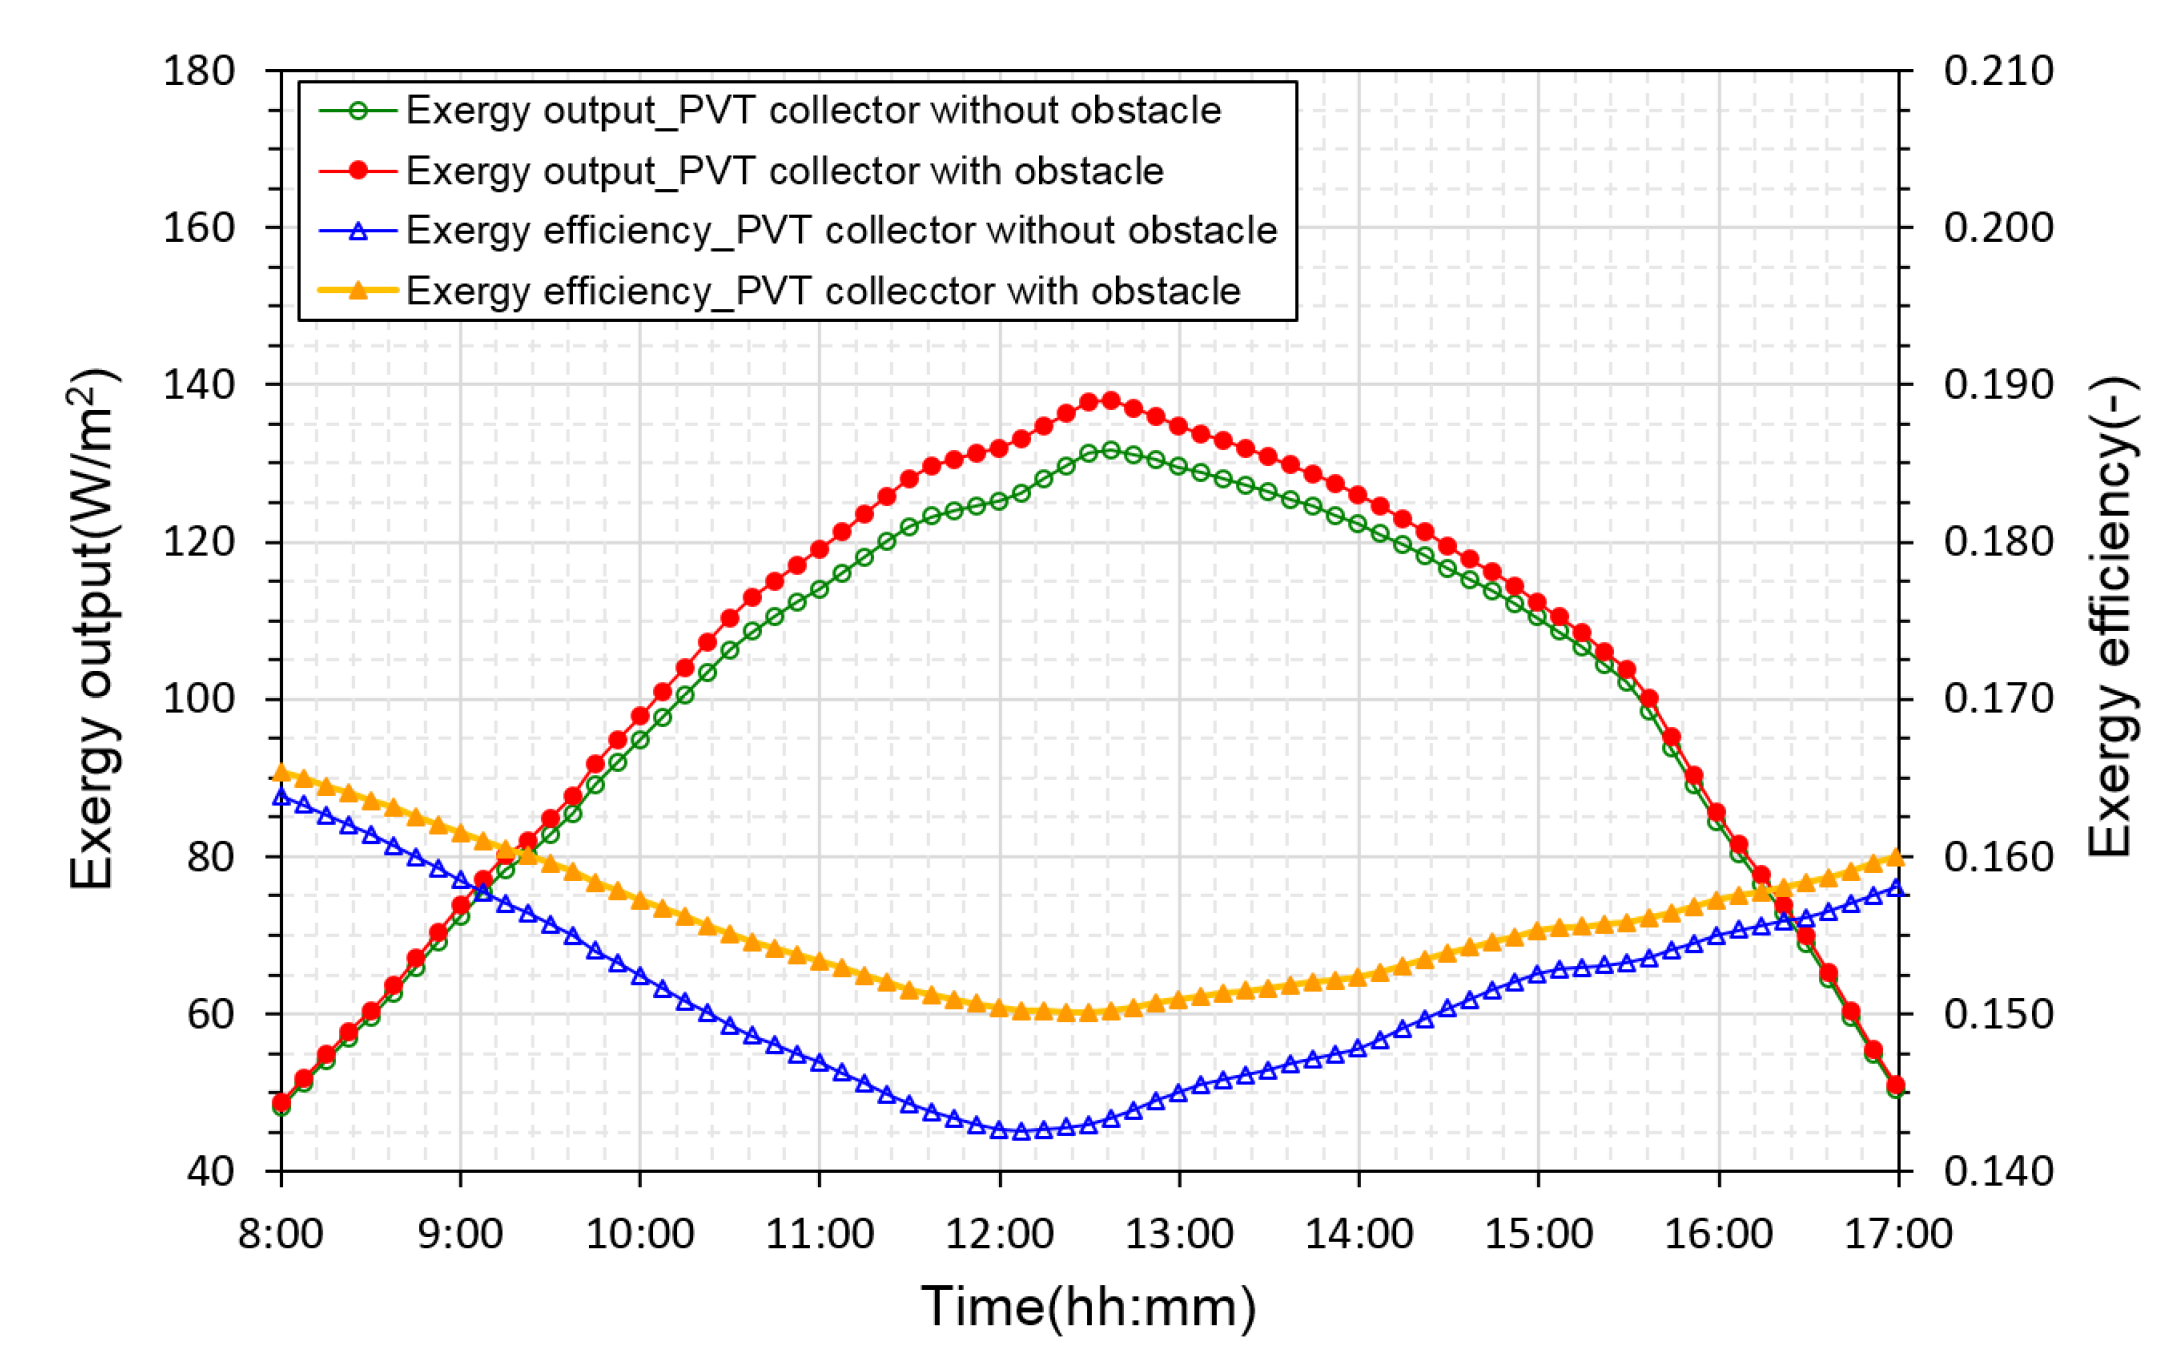
- The daily average exergy efficiency was 15.13% for the conventional PVT collector and 15.57% for the PVT collector with triangle-shaped obstacles. The presence of the obstacle leads to an increase of about 2.91% in the exergy efficiency of the collector.
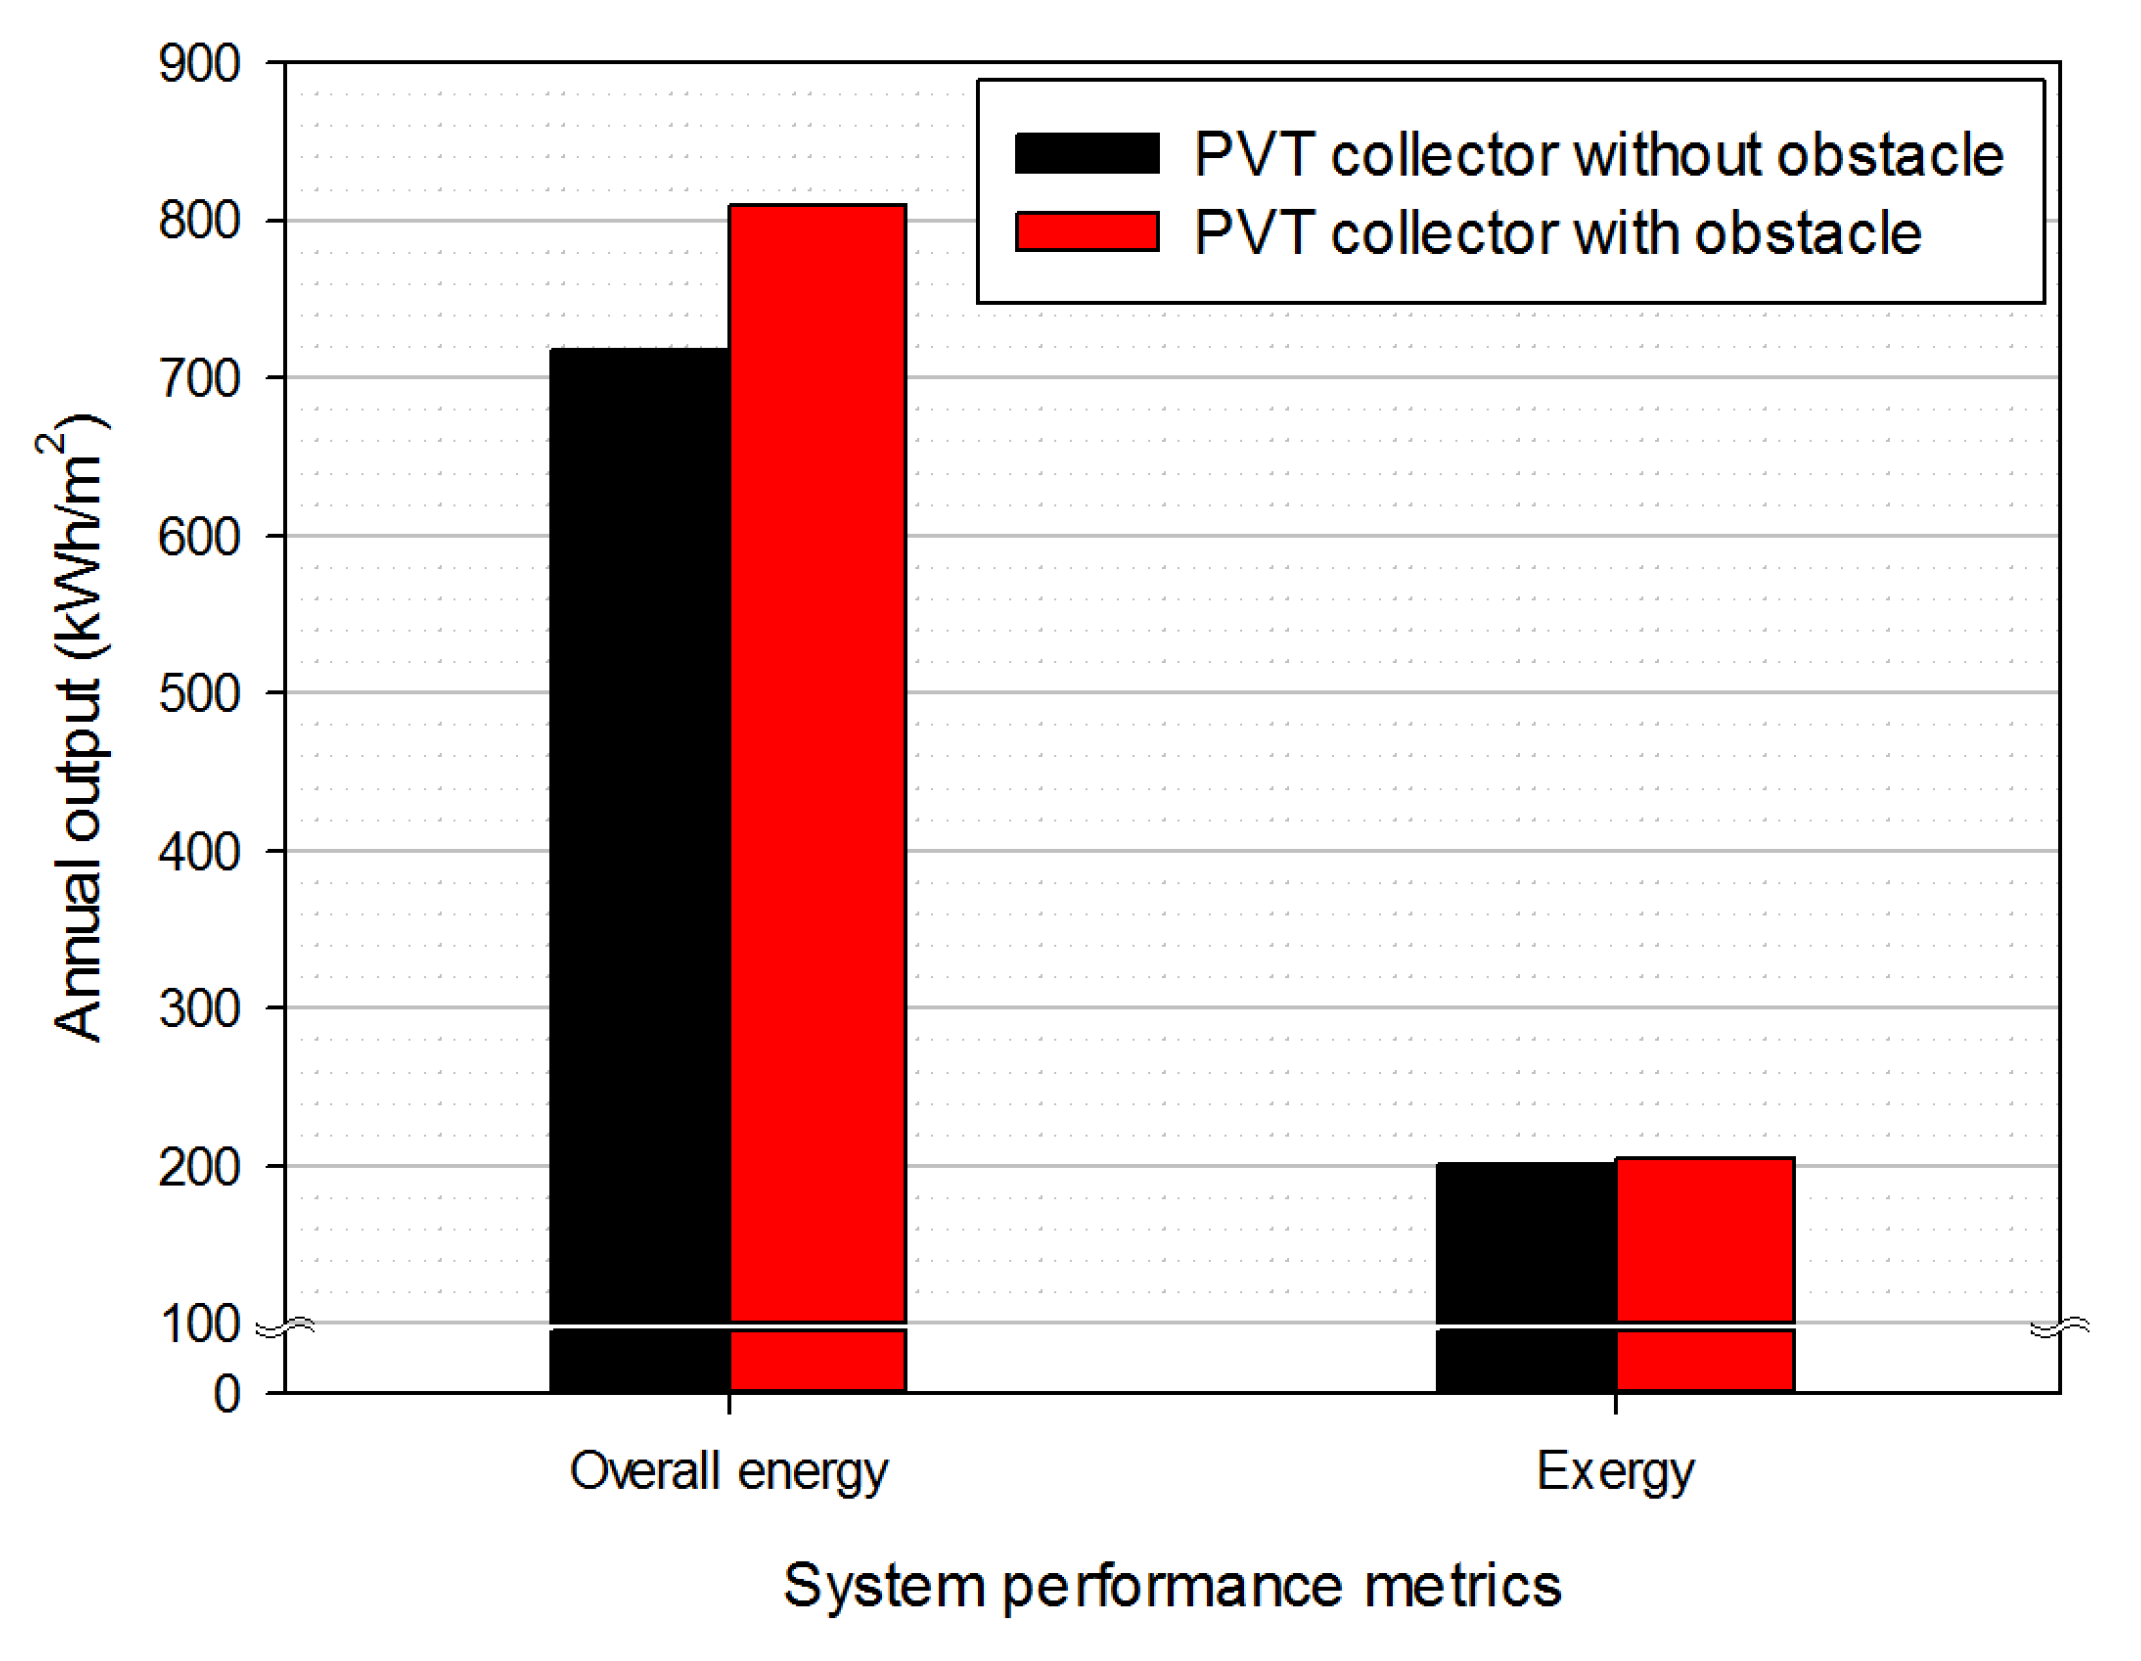
- (4)
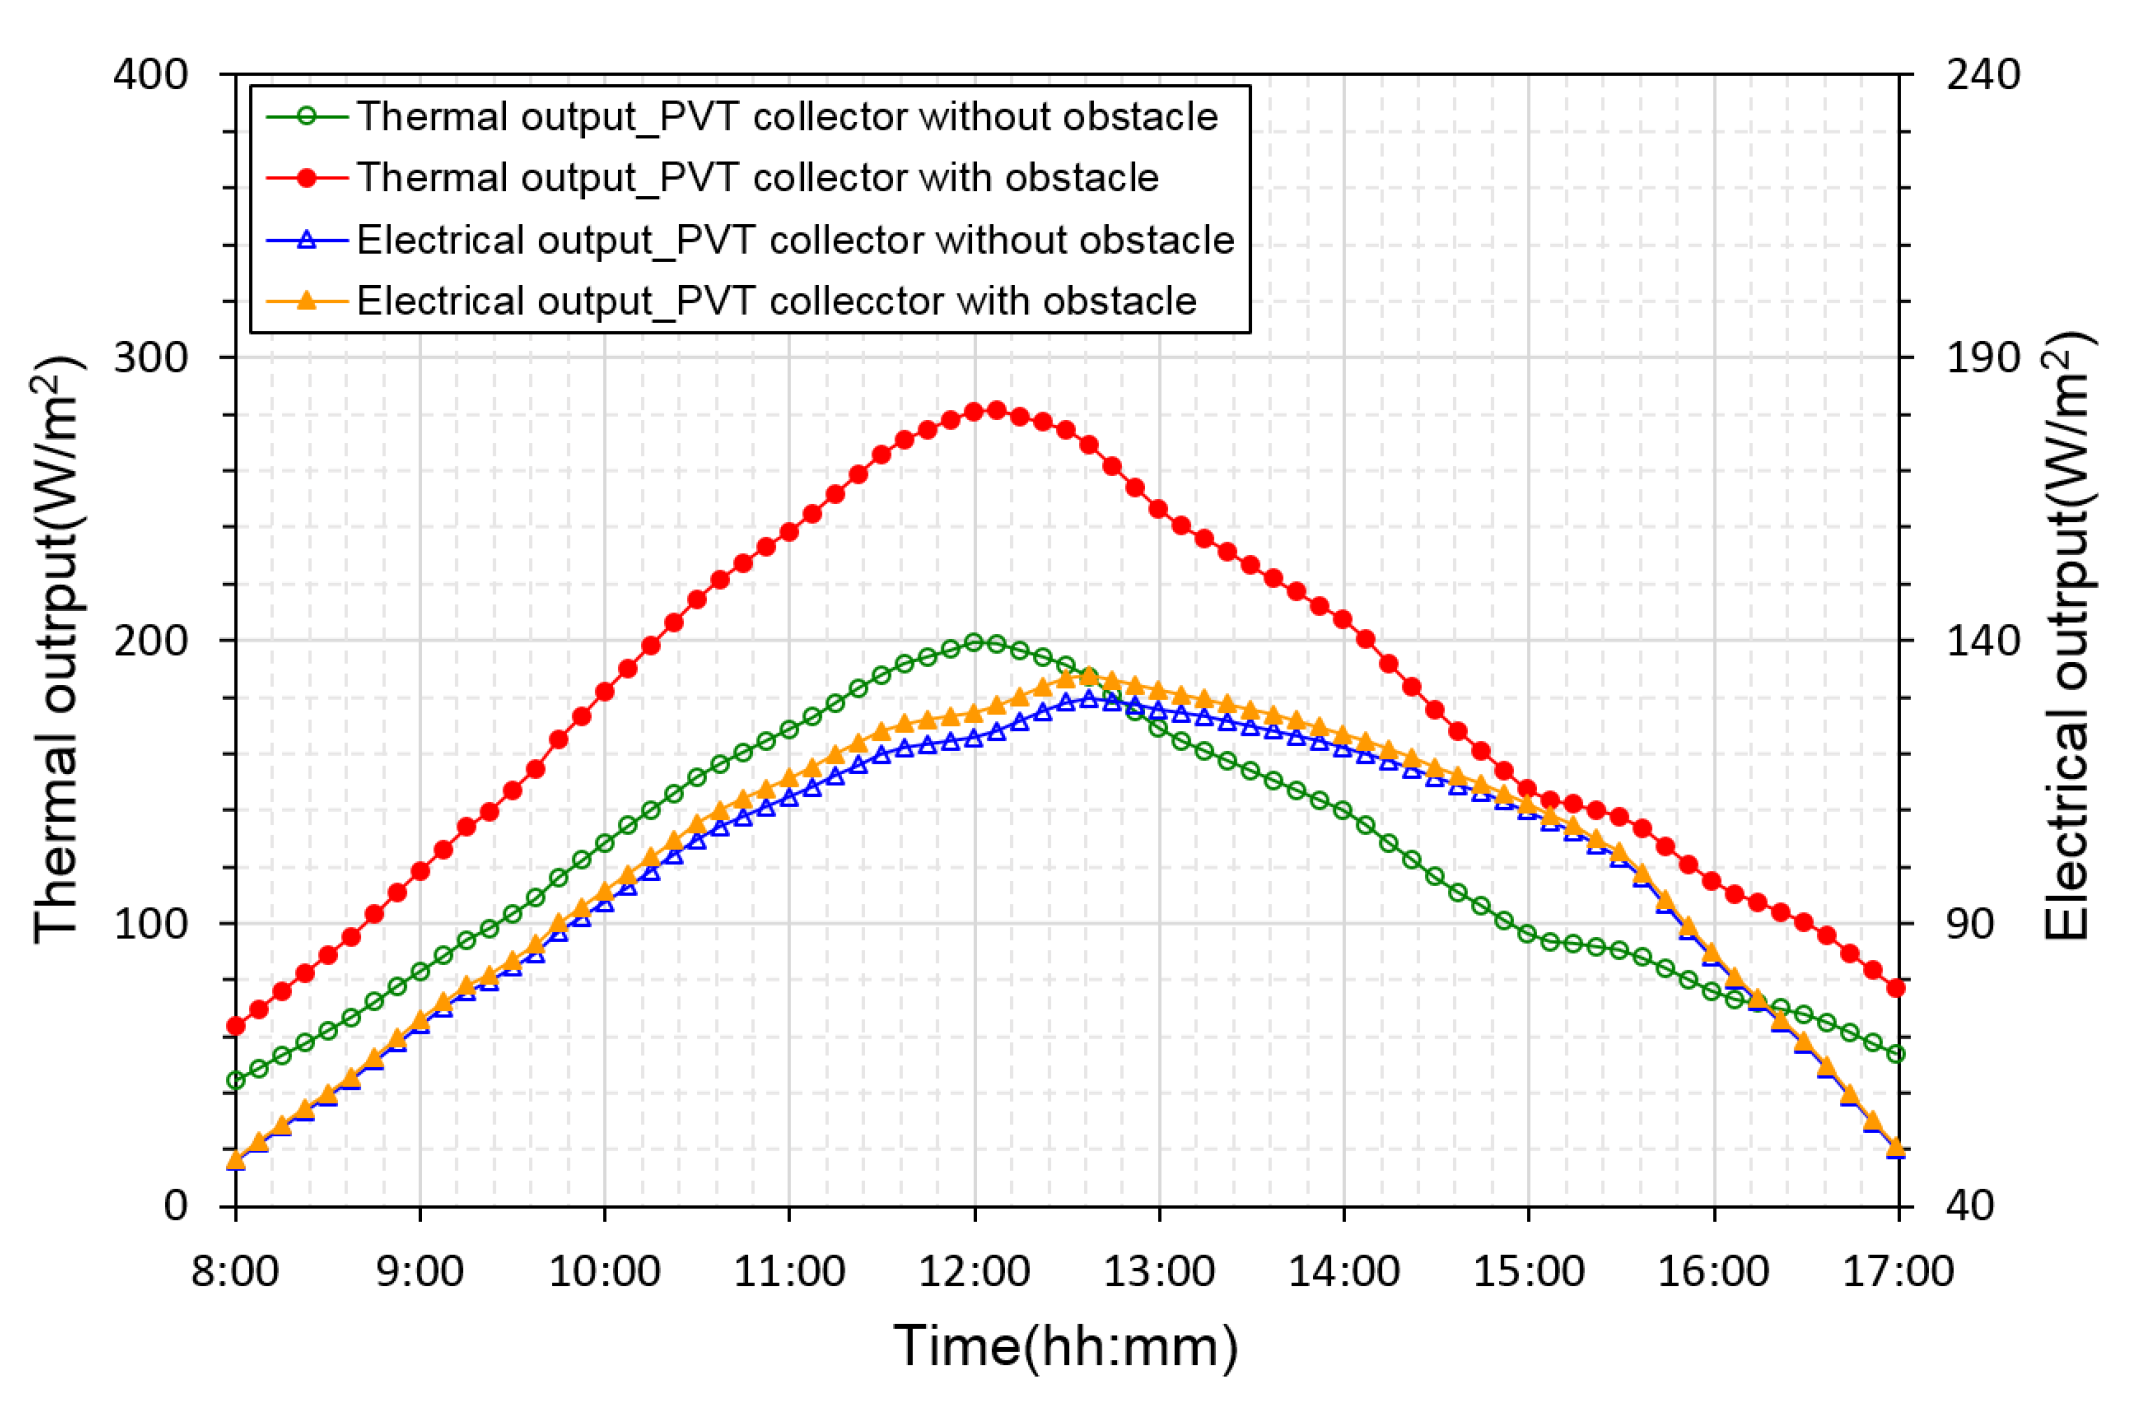
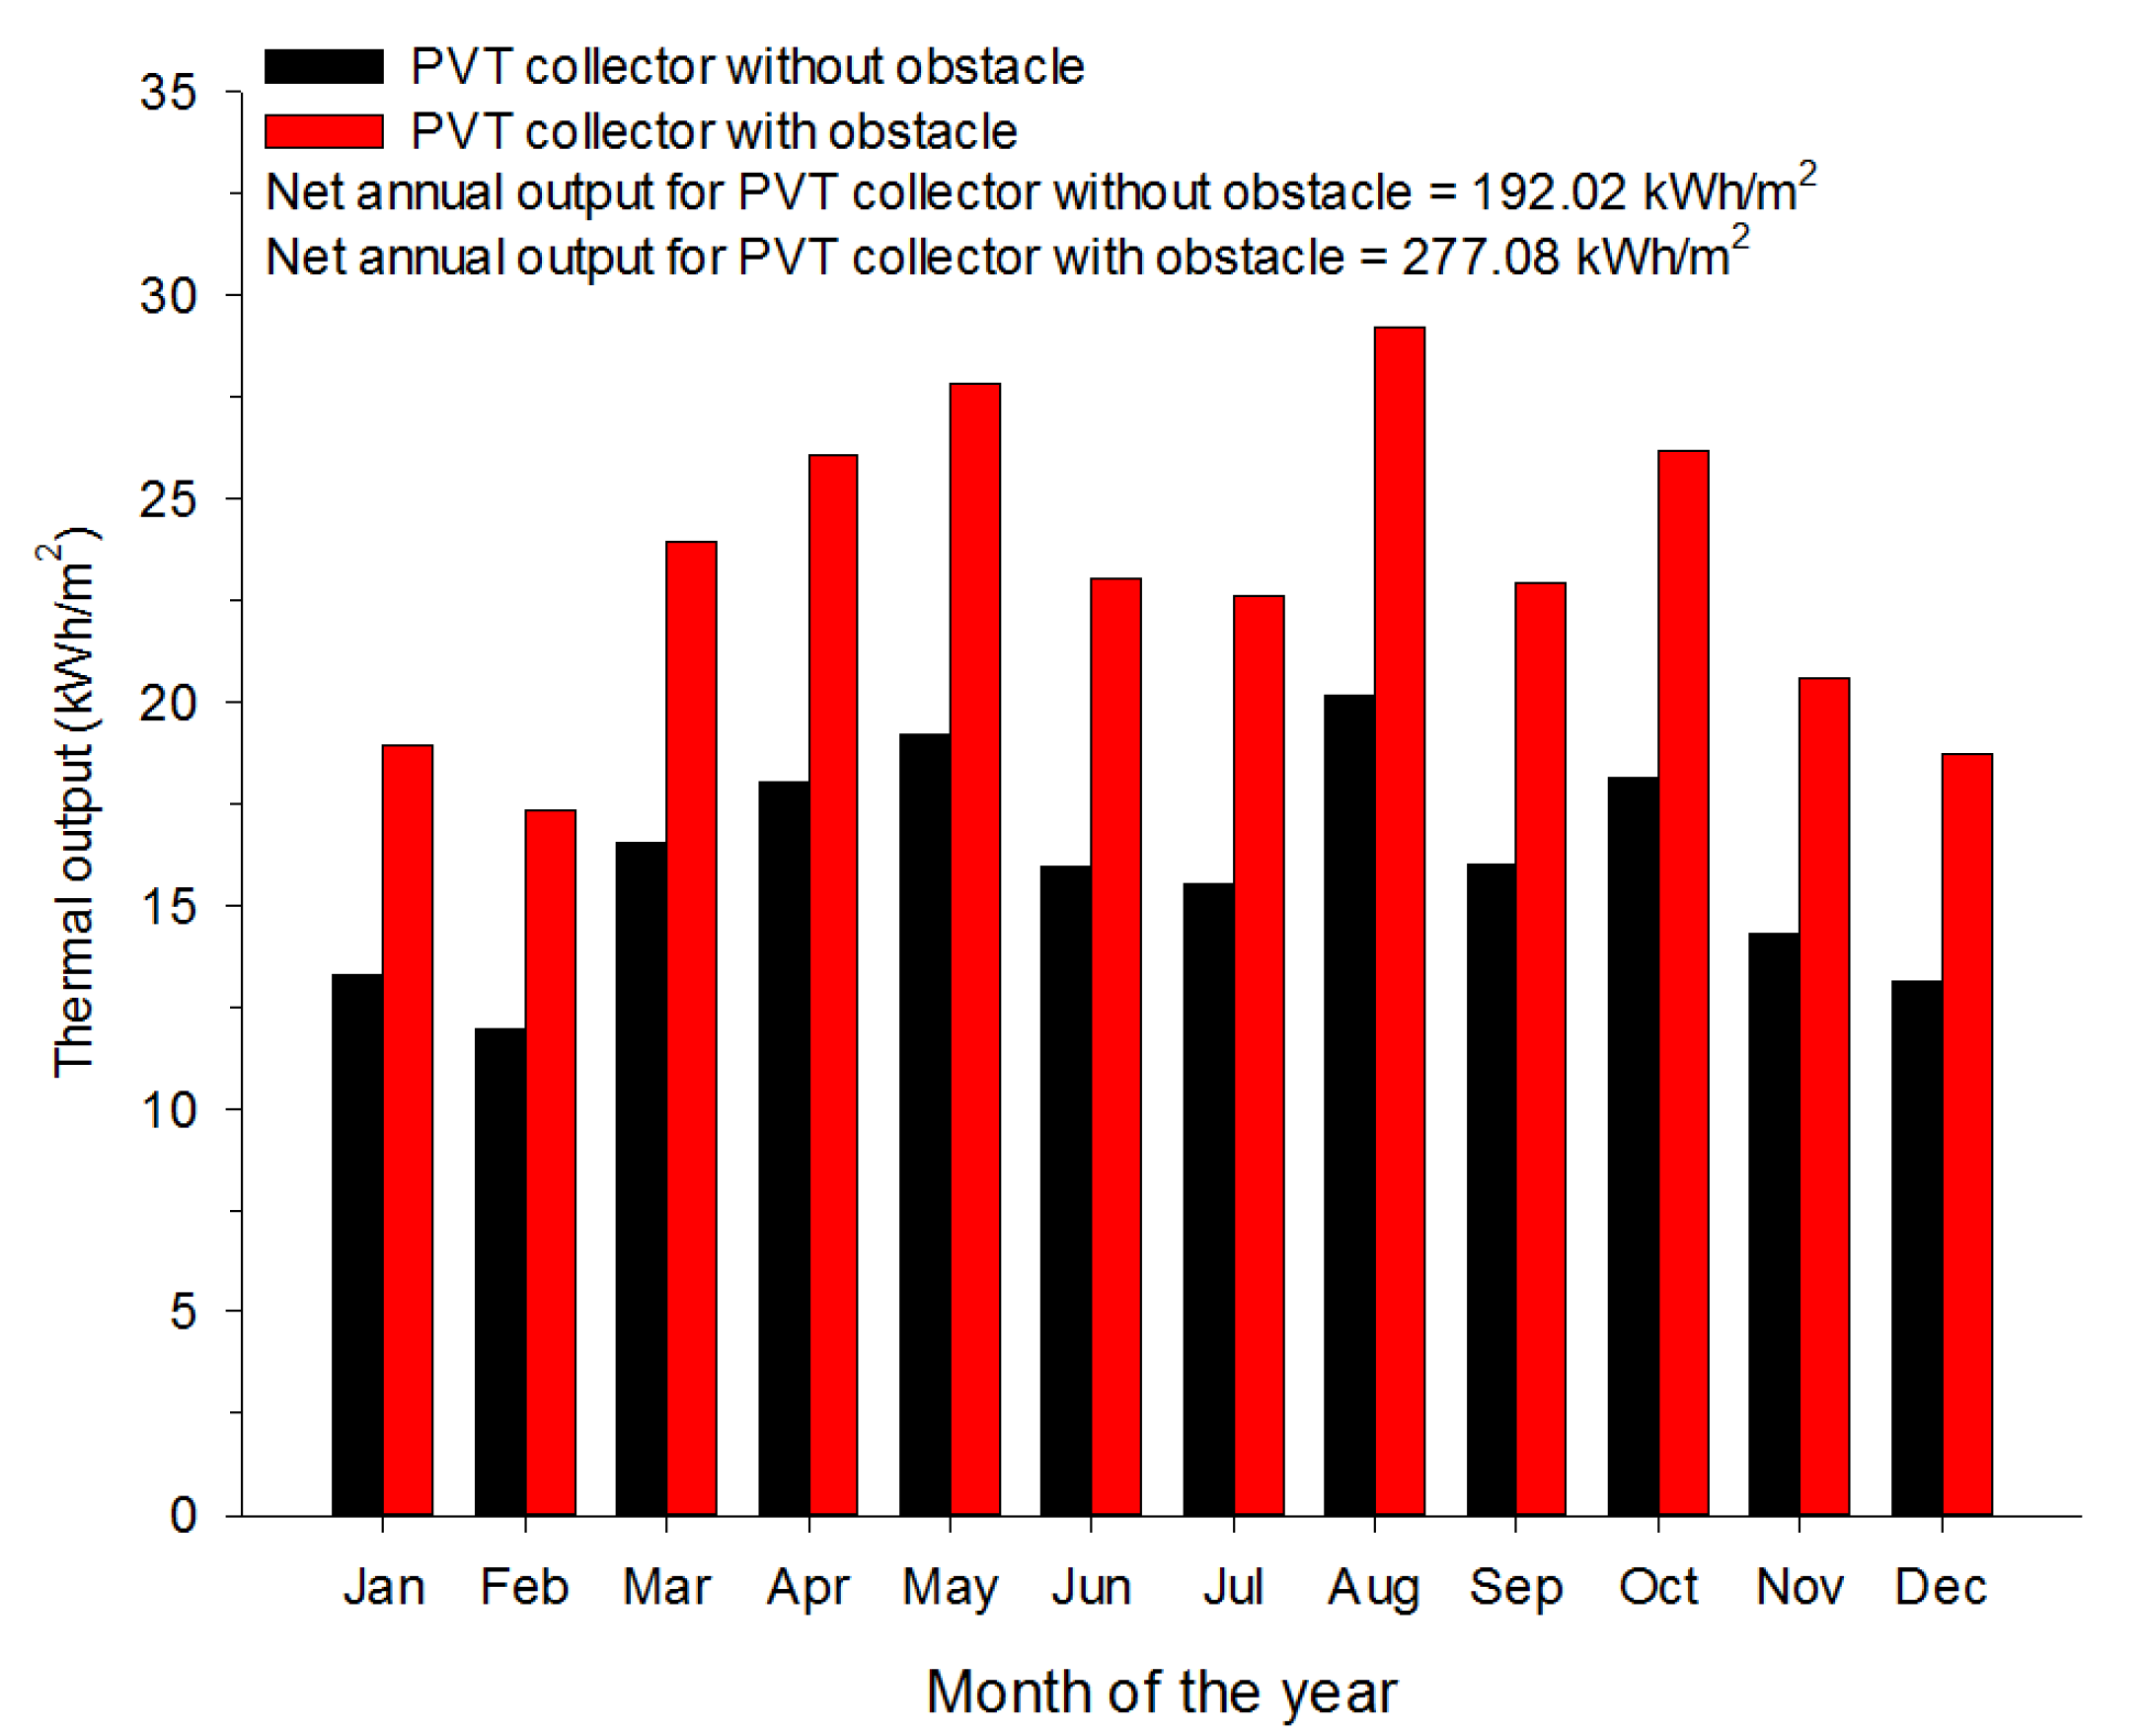
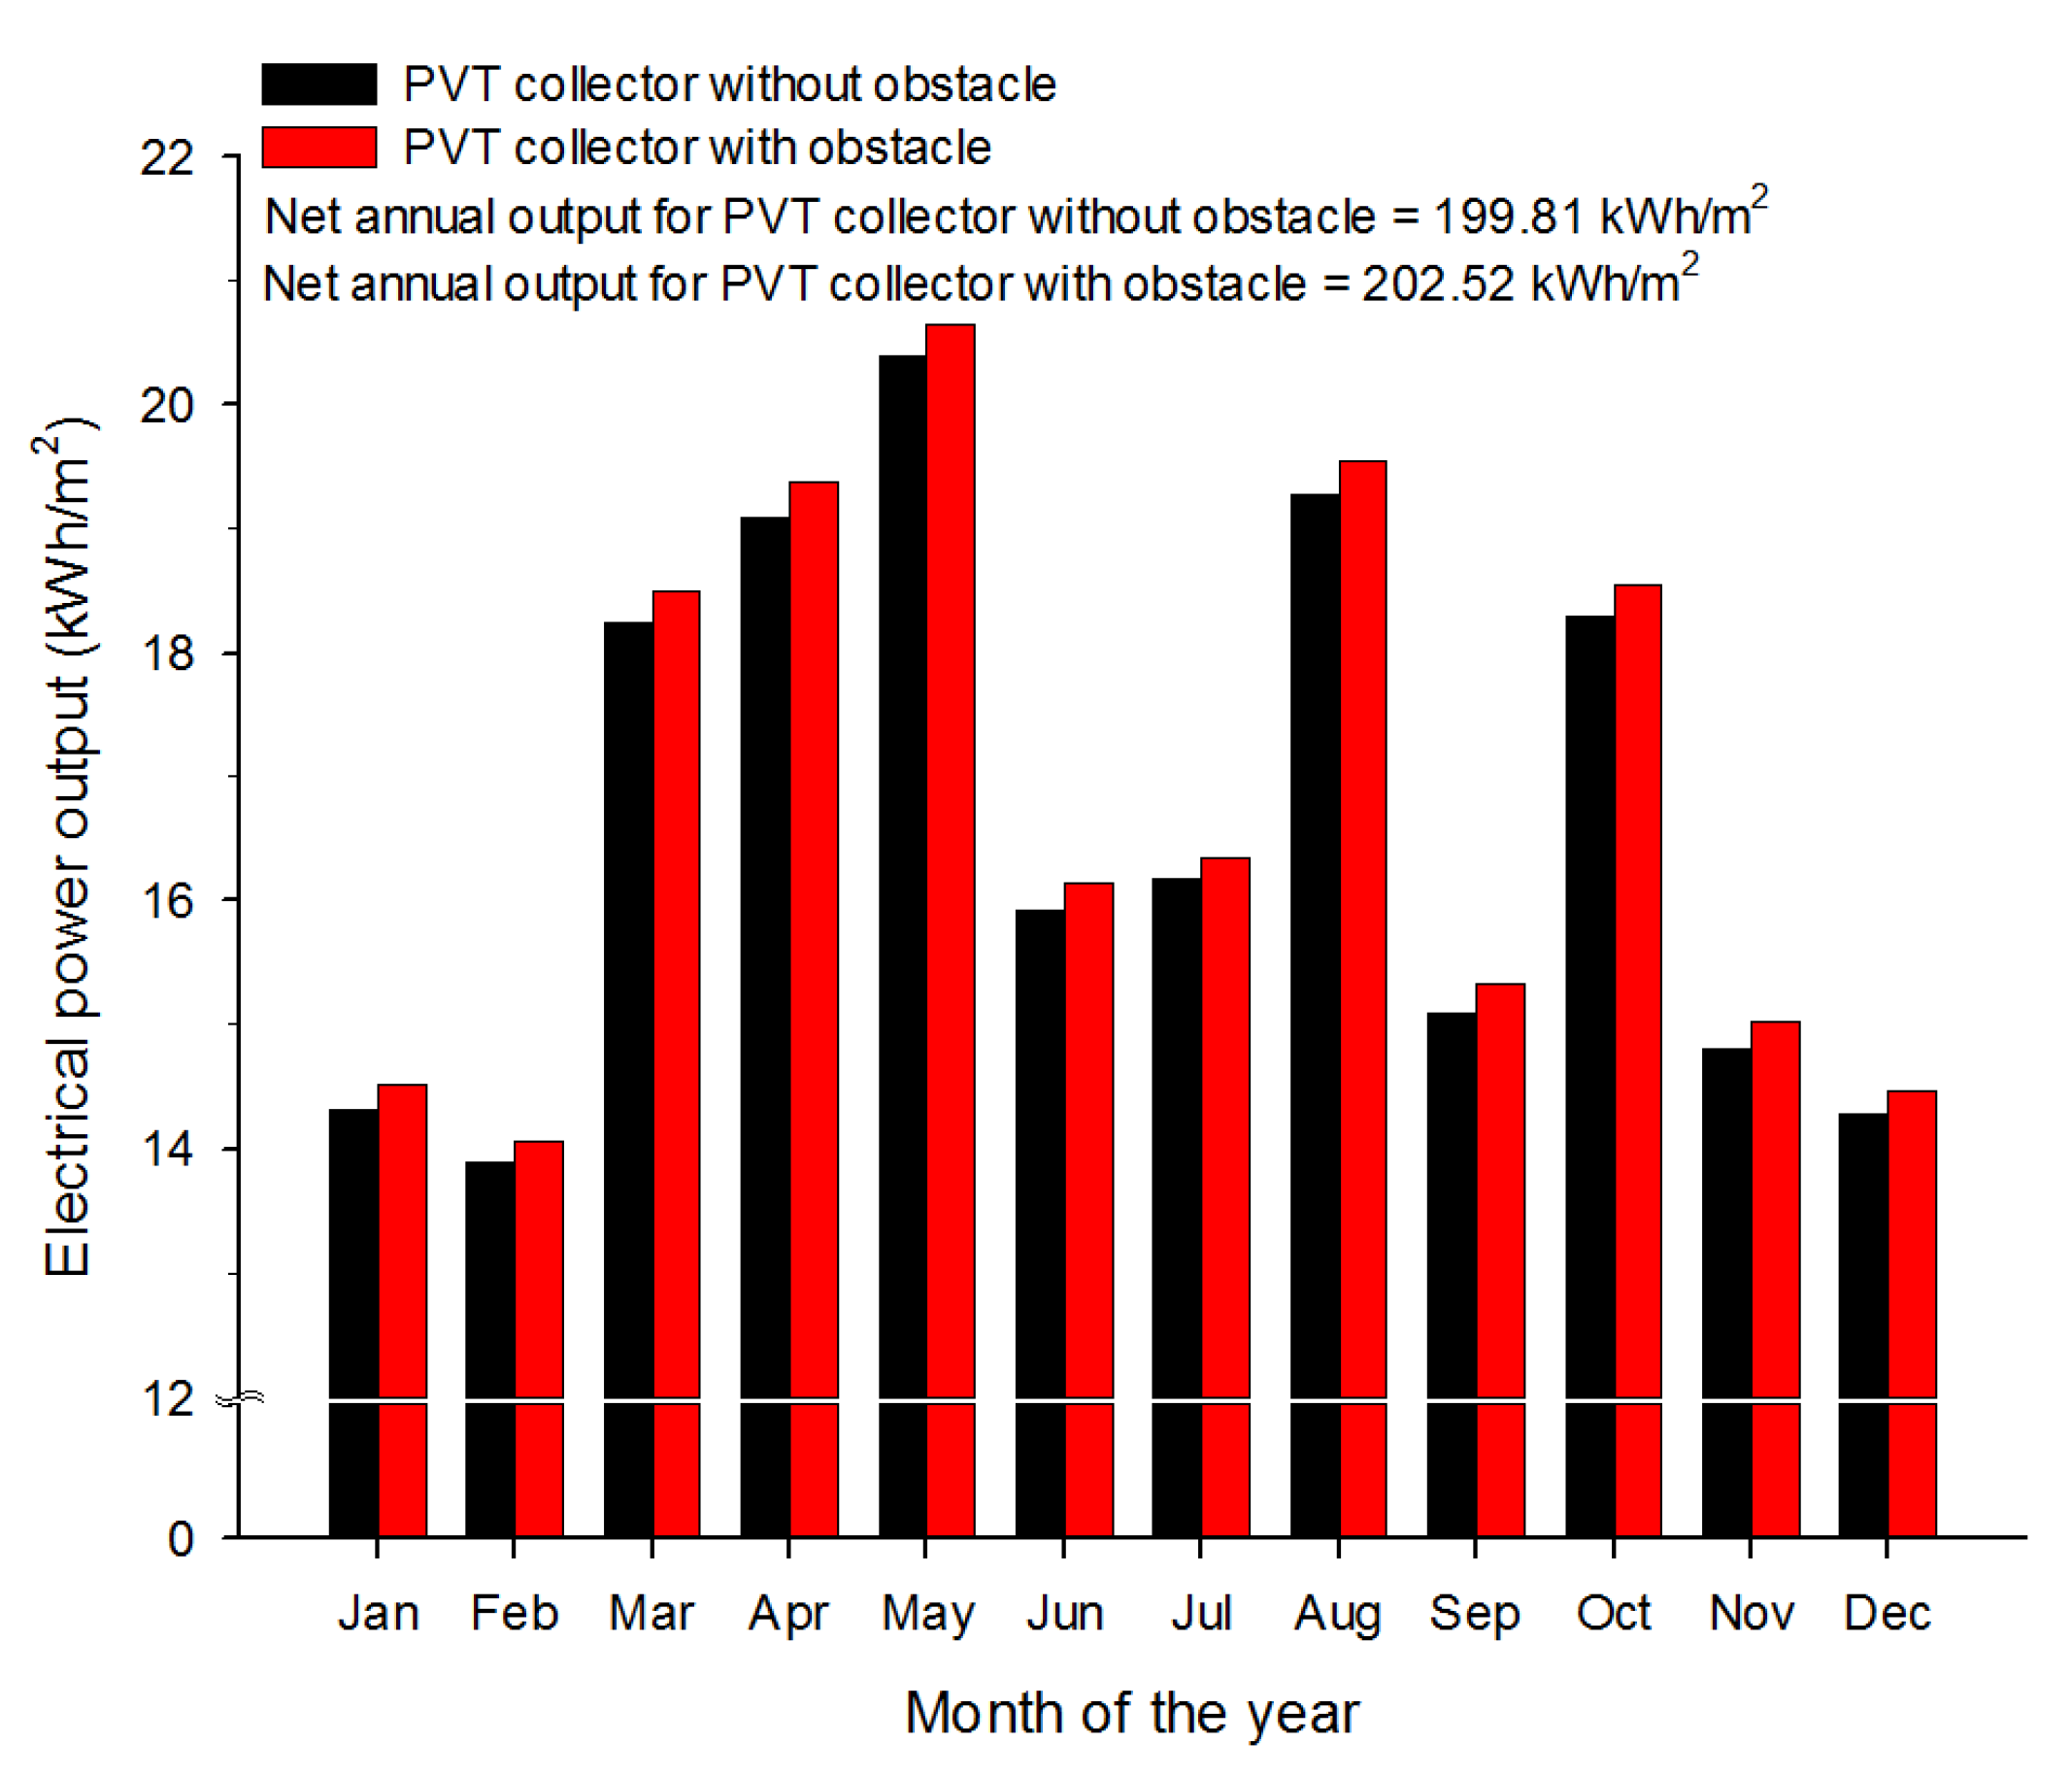
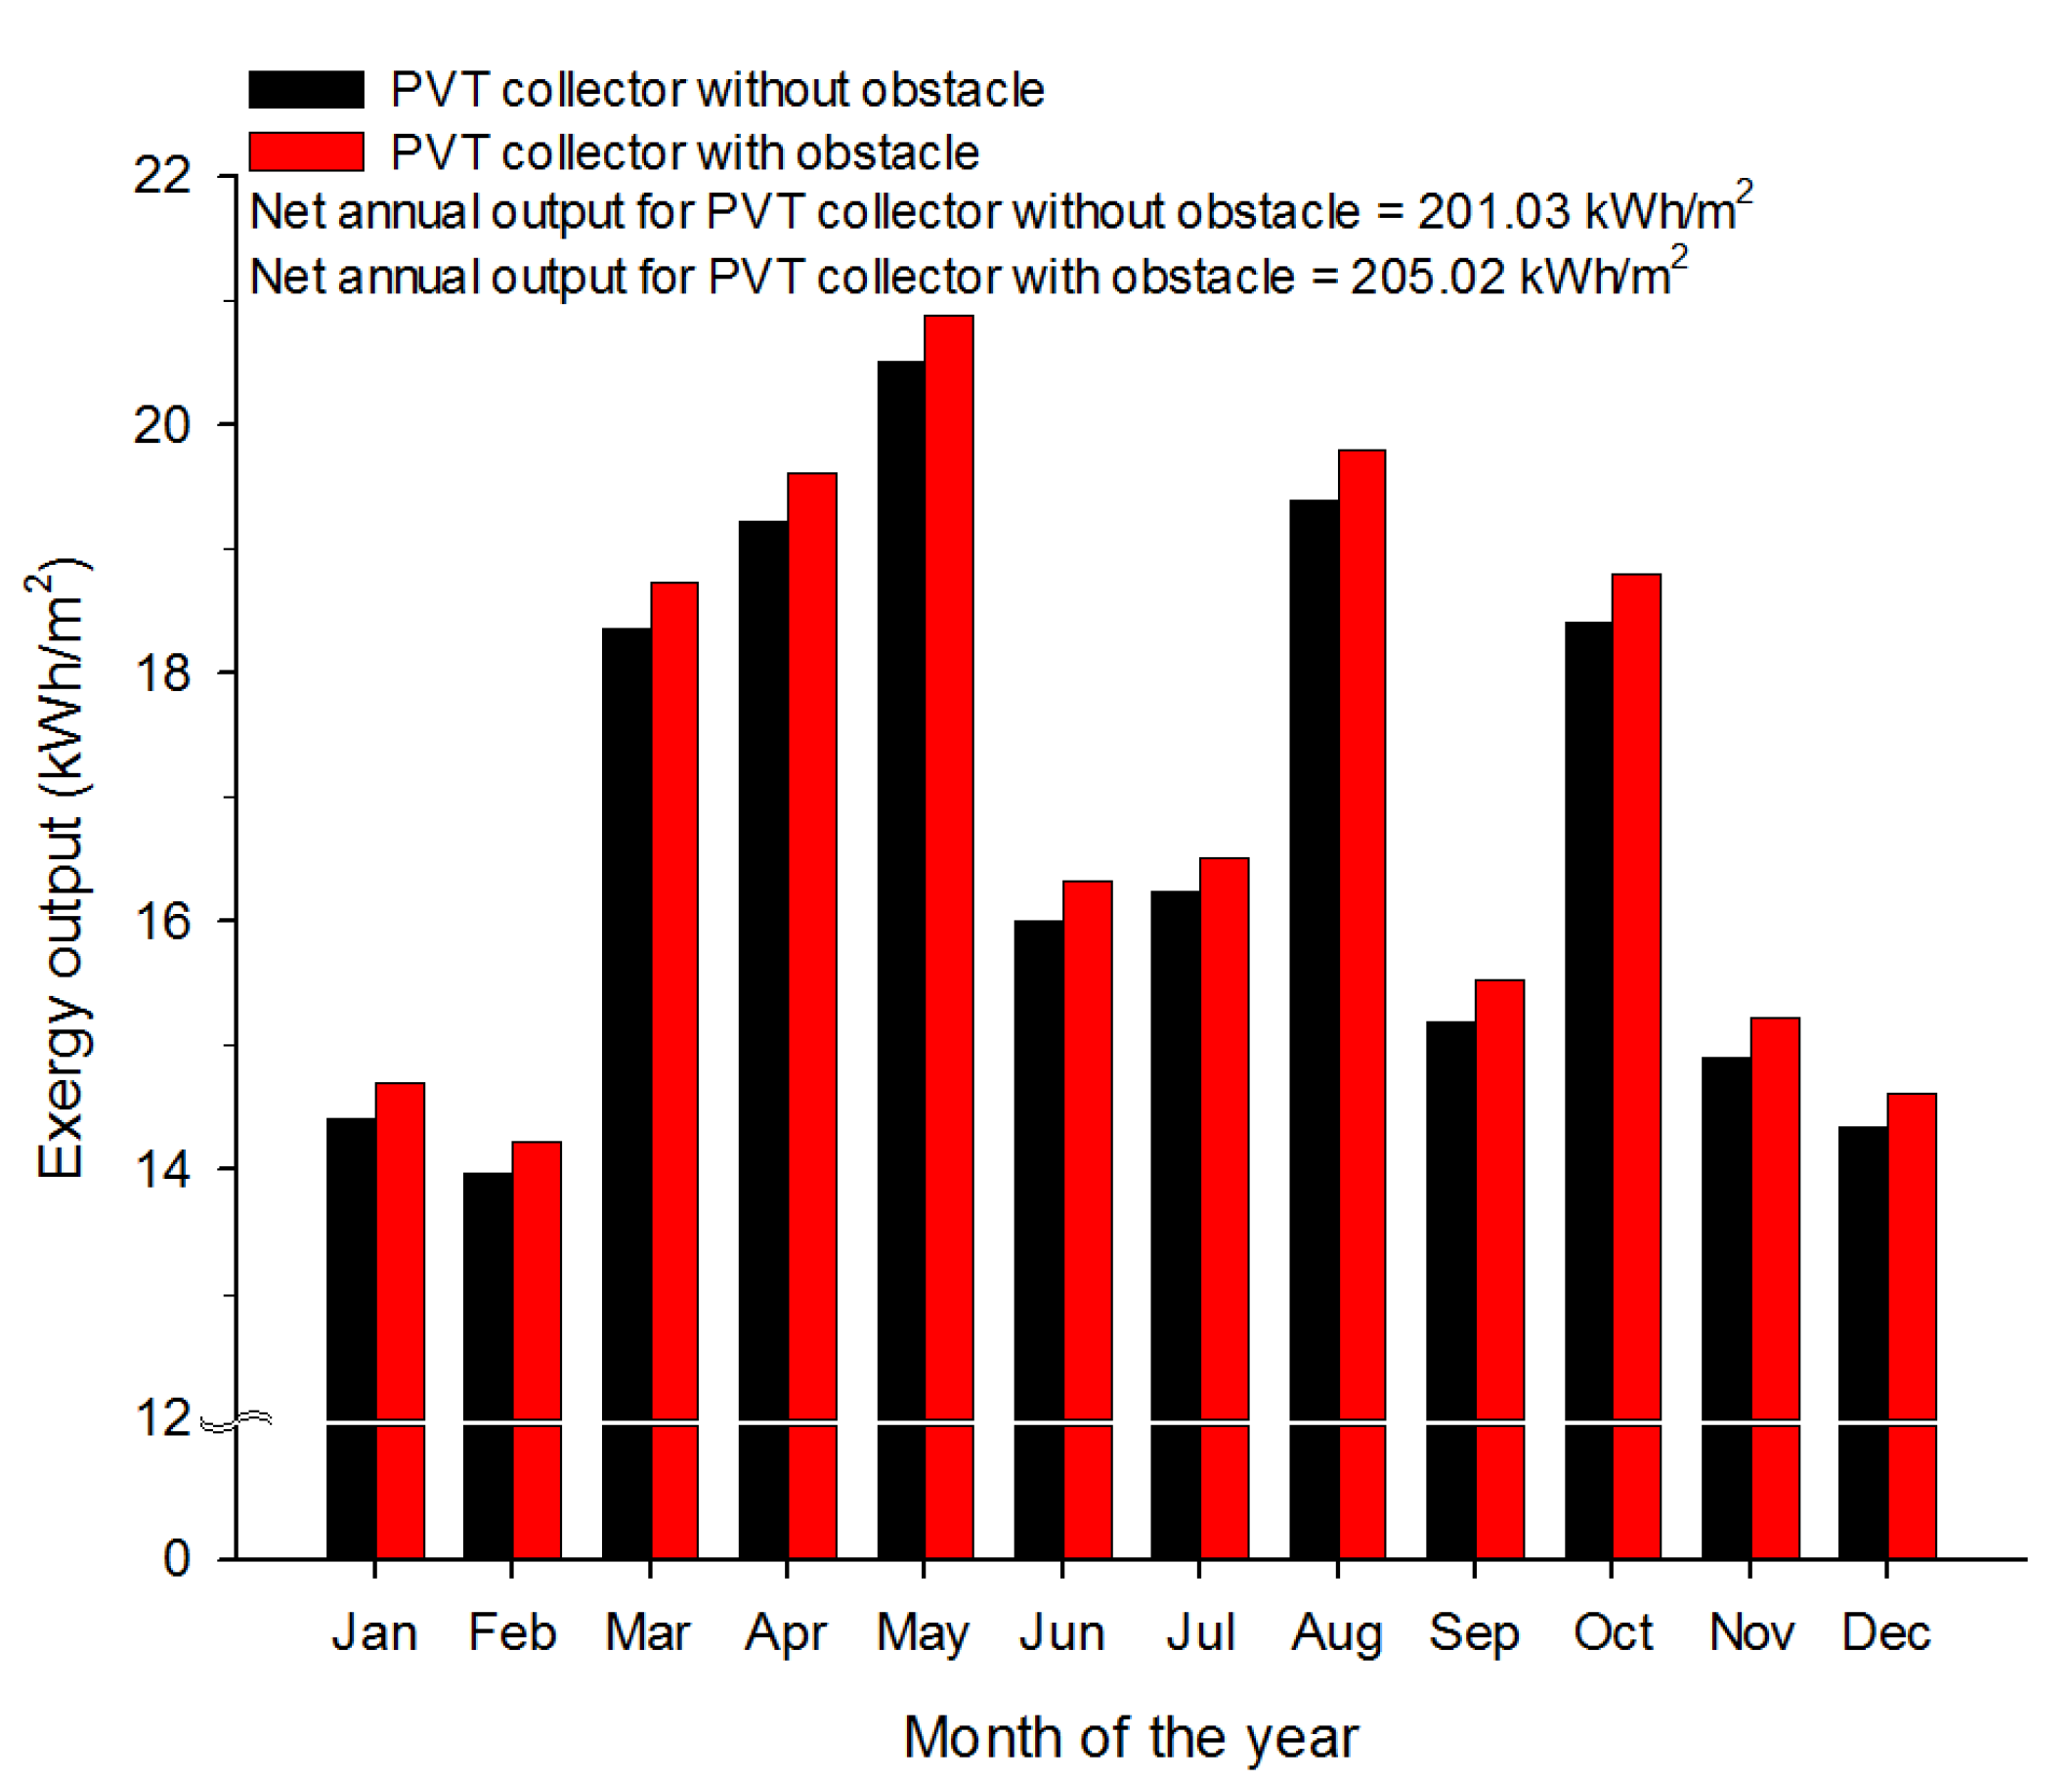
- The PVT collector with triangle-shaped obstacles could achieve about 44.3% and 1.36% more in the net annual thermal and electrical outputs, respectively, compared to those of the conventional PVT collector. In addition, the net annual overall energy output and exergy output of the PVT collector with triangle-shaped obstacles were found to be 12.84% and 1.98% greater than those of the conventional PVT collector, respectively.
Author Contributions
Funding
Institutional Review Board Statement
Informed Consent Statement
Data Availability Statement
Conflicts of Interest
Nomenclature
| collector area (m2) | |
| air mass flow rate (kg/s) | |
| specific heat of air (J/kg K) | |
| hydraulic diameter (m) | |
| solar intensity (W/m2) | |
| temperature (°C) | |
| temperature at the standard test condition (°C) | |
| average temperature of the PV cell (°C) | |
| effective air temperature (K) | |
| heat transfer coefficient (W/m2 K) | |
| thermal resistance (m2 K/W) | |
| overall thermal resistance (m2 K/W) | |
| wind velocity (m/s) | |
| average air velocity in an air channel (m/s) | |
| thermal output (W/m2) | |
| overall energy output (W/m2) | |
| electrical power output (W/m2) | |
| exergy rate (W/m2) | |
| thermal conductivity of air (W/m K) | |
| H | height of the air duct (mm) |
| height of a triangle-shaped obstacle (mm) | |
| length of a triangle-shaped obstacle (mm) | |
| pitch of a triangle-shaped obstacle (mm) | |
| conversion factor for the equivalent thermal efficiency (-) | |
| Nusselt number (-) | |
| Reynolds number (-) | |
| Prandtl number (-) | |
| Greek symbols | |
| absorptivity (-) | |
| ε | emissivity (-) |
| Stefan–Boltzmann constant (W/m2 K4) | |
| efficiency (-) | |
| overall energy efficiency (-) | |
| exergy efficiency (-) | |
| electrical efficiency at the standard test conditions (%) | |
| temperature coefficient (%/°C) | |
| Subscripts | |
| α | ambient |
| air | |
| convection | |
| radiation | |
| top surface | |
| inflow | |
| outflow | |
| destruction | |
| fluid | |
| sun | |
| sky | |
| thermal | |
| el | electrical |
| PV | PV module |
| PVT collector |
References
- Wolf, M. Performance Analyses of Combined Heating and Photovoltaic Power Systems for Residences. Energy Convers. Manag. 1976, 16, 79–90. [Google Scholar] [CrossRef]
- Dupeyrat, P.; Ménézo, C.; Rommel, M.; Henning, H.M. Efficient Single Glazed Flat Plate Photovoltaic-Thermal Hybrid Collector for Domestic Hot Water System. Sol. Energy 2011, 85, 1457–1468. [Google Scholar] [CrossRef]
- Jahromi, S.N.; Vadiee, A.; Yaghoubi, M. Exergy and Economic Evaluation of a Commercially Available PV/T Collector for Different Climates in Iran. Energy Procedia 2015, 75, 444–456. [Google Scholar] [CrossRef]
- Aste, N.; Leonforte, F.; Del Pero, C. Design, Modeling and Performance Monitoring of a Photovoltaic-Thermal (PVT) Water Collector. Sol. Energy 2015, 112, 85–99. [Google Scholar] [CrossRef]
- Kazem, H.A. Evaluation and Analysis of Water-Based Photovoltaic/Thermal (PV/T) System. Case Stud. Therm. Eng. 2019, 13, 100401. [Google Scholar] [CrossRef]
- Hasan, H.A.; Sherza, J.S.; Mahdi, J.M.; Togun, H.; Abed, A.M.; Ibrahim, R.K.; Yaïci, W. Experimental Evaluation of the Thermoelectrical Performance of Photovoltaic-Thermal Systems with a Water-Cooled Heat Sink. Sustainability 2022, 14, 10231. [Google Scholar] [CrossRef]
- Yan, B.; Wu, Q.; Chi, X.; Wu, C.; Luo, P.; Luo, Y.; Zeng, P. Numerical and Experimental Investigation of Photovoltaic/Thermal Systems: Parameter Analysis and Determination of Optimum Flow. Sustainability 2022, 14, 10156. [Google Scholar] [CrossRef]
- Al-Waeli, A.H.A.; Sopian, K.; Kazem, H.A.; Yousif, J.H.; Chaichan, M.T.; Ibrahim, A.; Mat, S.; Ruslan, M.H. Comparison of Prediction Methods of PV/T Nanofluid and Nano-PCM System Using a Measured Dataset and Artificial Neural Network. Sol. Energy 2018, 162, 378–396. [Google Scholar] [CrossRef]
- Fayaz, H.; Rahim, N.A.; Hasanuzzaman, M.; Rivai, A.; Nasrin, R. Numerical and Outdoor Real Time Experimental Investigation of Performance of PCM Based PVT System. Sol. Energy 2019, 179, 135–150. [Google Scholar] [CrossRef]
- Xu, Z.; Kleinstreuer, C. Concentration Photovoltaic-Thermal Energy Co-Generation System Using Nanofluids for Cooling and Heating. Energy Convers. Manag. 2014, 87, 504–512. [Google Scholar] [CrossRef]
- Al-Waeli, A.H.A.; Sopian, K.; Kazem, H.A.; Chaichan, M.T. Evaluation of the Electrical Performance of a Photovoltaic Thermal System Using Nano-Enhanced Paraffin and Nanofluids. Case Stud. Therm. Eng. 2020, 21, 100678. [Google Scholar] [CrossRef]
- Hussain, M.I.; Lee, G.H.; Kim, J.T. A Comprehensive Performance Characterization of a Nanofluid-Powered Dual-Fluid Pv/t System under Outdoor Steady State Conditions. Sustainability 2021, 13, 3134. [Google Scholar] [CrossRef]
- Sopian, K.; Yigit, K.S.; Liu, H.T.; Kakaç, S.; Veziroglu, T.N. Performance Analysis of Photovoltaic Thermal Air Heaters. Energy Convers. Manag. 1996, 37, 1657–1670. [Google Scholar] [CrossRef]
- Agrawal, S.; Tiwari, G.N. Energy and Exergy Analysis of Hybrid Micro-Channel Photovoltaic Thermal Module. Sol. Energy 2011, 85, 356–370. [Google Scholar] [CrossRef]
- Amori, K.E.; Abd-AlRaheem, M.A. Field Study of Various Air Based Photovoltaic/Thermal Hybrid Solar Collectors. Renew. Energy 2014, 63, 402–414. [Google Scholar] [CrossRef]
- Farshchimonfared, M.; Bilbao, J.I.; Sproul, A.B. Channel Depth, Air Mass Flow Rate and Air Distribution Duct Diameter Optimization of Photovoltaic Thermal (PV/T) Air Collectors Linked to Residential Buildings. Renew. Energy 2015, 76, 27–35. [Google Scholar] [CrossRef]
- Slimani, M.E.A.; Amirat, M.; Kurucz, I.; Bahria, S.; Hamidat, A.; Chaouch, W.B. A Detailed Thermal-Electrical Model of Three Photovoltaic/Thermal (PV/T) Hybrid Air Collectors and Photovoltaic (PV) Module: Comparative Study under Algiers Climatic Conditions. Energy Convers. Manag. 2017, 133, 458–476. [Google Scholar] [CrossRef]
- Jin, G.L.; Ibrahim, A.; Chean, Y.K.; Daghigh, R.; Ruslan, H.; Mat, S.; Othman, M.Y.; Sopian, K. Evaluation of Single-Pass Photovoltaic-Thermal Air Collector with Rectangle Tunnel Absorber. Am. J. Appl. Sci. 2010, 7, 277–282. [Google Scholar] [CrossRef]
- Hussain, F.; Othman, M.Y.H.; Yatim, B.; Ruslan, H.; Sopian, K.; Anuar, Z.; Khairuddin, S. An Improved Design of Photovoltaic/Thermal Solar Collector. Sol. Energy 2015, 122, 885–891. [Google Scholar] [CrossRef]
- Fudholi, A.; Zohri, M.; Jin, G.L.; Ibrahim, A.; Yen, C.H.; Othman, M.Y.; Ruslan, M.H.; Sopian, K. Energy and Exergy Analyses of Photovoltaic Thermal Collector with ∇-Groove. Sol. Energy 2018, 159, 742–750. [Google Scholar] [CrossRef]
- Ahmad, E.Z.; Fazlizan, A.; Jarimi, H.; Sopian, K.; Ibrahim, A. Enhanced Heat Dissipation of Truncated Multi-Level Fin Heat Sink (MLFHS) in Case of Natural Convection for Photovoltaic Cooling. Case Stud. Therm. Eng. 2021, 28, 101578. [Google Scholar] [CrossRef]
- Fudholi, A.; Sopian, K.; Othman, M.Y.; Ruslan, M.H.; Bakhtyar, B. Energy Analysis and Improvement Potential of Finned Double-Pass Solar Collector. Energy Convers. Manag. 2013, 75, 234–240. [Google Scholar] [CrossRef]
- Othman, M.Y.; Yatim, B.; Sopian, K.; Abu Bakar, M.N. Performance Studies on a Finned Double-Pass Photovoltaic-Thermal (PV/T) Solar Collector. Desalination 2007, 209, 43–49. [Google Scholar] [CrossRef]
- Kang, Z.; Lu, Z.; Song, G.; Yao, Q. A Numerical Study of Dual-Inlet Air-Cooled PV/T Solar Collectors with Various Airflow Channel Configurations. Sustainability 2022, 14, 9897. [Google Scholar] [CrossRef]
- Fan, W.; Kokogiannakis, G.; Ma, Z. A Multi-Objective Design Optimisation Strategy for Hybrid Photovoltaic Thermal Collector (PVT)-Solar Air Heater (SAH) Systems with Fins. Sol. Energy 2018, 163, 315–328. [Google Scholar] [CrossRef]
- Choi, H.U.; Choi, K.H. Performance Evaluation of PV/T Air Collector Having a Single-Pass Double-Flow Air Channel and Non-Uniform Cross-Section Transverse Rib. Energies 2020, 13, 2203. [Google Scholar] [CrossRef]
- Özakin, A.N.; Kaya, F. Effect on the Exergy of the PVT System of Fins Added to an Air-Cooled Channel: A Study on Temperature and Air Velocity with ANSYS Fluent. Sol. Energy 2019, 184, 561–569. [Google Scholar] [CrossRef]
- Fan, W.; Kokogiannakis, G.; Ma, Z.; Cooper, P. Development of a Dynamic Model for a Hybrid Photovoltaic Thermal Collector—Solar Air Heater with Fins. Renew. Energy 2017, 101, 816–834. [Google Scholar] [CrossRef]
- Kim, S.M.; Kim, J.H.; Kim, J.T. Experimental Study on the Thermal and Electrical Characteristics of an Air-Based Photovoltaic Thermal Collector. Energies 2019, 12, 2661. [Google Scholar] [CrossRef]
- Choi, H.U.; Kim, Y.B.; Son, C.H.; Yoon, J.I.; Choi, K.H. Experimental Study on the Performance of Heat Pump Water Heating System Coupled with Air Type PV/T Collector. Appl. Therm. Eng. 2020, 178, 115427. [Google Scholar] [CrossRef]
- Choi, H.U.; Choi, K.H. Performance Evaluation of PVT Air Collector Coupled with a Triangular Block in Actual Climate Conditions in Korea. Energies 2022, 15, 4150. [Google Scholar] [CrossRef]
- Yu, J.S.; Kim, J.H.; Kim, J.T. Effect of Triangular Baffle Arrangement on Heat Transfer Enhancement of Air-Type PVT Collector. Sustainability 2020, 12, 7469. [Google Scholar] [CrossRef]
- Bambrook, S.M. Investigation of Photovoltaic/Thermal Air System to Create a Zero Energy House in Sydney. Ph.D. Thesis, University of New South Wales, Sydney, Australia, 2011. [Google Scholar]
- Sproul, A.B.; Bilbao, J.I.; Bambrook, S.M. A Novel Thermal Circuit Analysis of Solar Thermal Collectors. In Proceedings of the 50th Annual Conference of the Australian Solar Energy Society, Melbourne, Australia, 2–4 December 2012. [Google Scholar]
- Bilbao, J.I.; Sproul, A.B. Detailed PVT-Water Model for Transient Analysis Using RC Networks. Sol. Energy 2015, 115, 680–693. [Google Scholar] [CrossRef]
- Bambrook, S.M.; Sproul, A.B. A Solvable Thermal Circuit for Modelling PVT Air Collectors. Sol. Energy 2016, 138, 77–87. [Google Scholar] [CrossRef]
- Ong, K.S. Thermal Performance of Solar Air Heaters: Mathematical Model and Solution Procedure. Sol. Energy 1995, 55, 93–109. [Google Scholar] [CrossRef]
- Tonui, J.K.; Tripanagnostopoulos, Y. Air-Cooled PV/T Solar Collectors with Low Cost Performance Improvements. Sol. Energy 2007, 81, 498–511. [Google Scholar] [CrossRef]
- Cengel, Y.A.; Ghajar, A.J. Heat and Mass Transfer (SI Unit), 4th ed.; McGraw-Hill: London, UK, 2011. [Google Scholar]
- Aste, N.; Chiesa, G.; Verri, F. Design, Development and Performance Monitoring of a Photovoltaic-Thermal (PVT) Air Collector. Renew. Energy 2008, 33, 914–927. [Google Scholar] [CrossRef]
- Sarhaddi, F.; Farahat, S.; Ajam, H.; Behzadmehr, A.; Mahdavi Adeli, M. An Improved Thermal and Electrical Model for a Solar Photovoltaic Thermal (PV/T) Air Collector. Appl. Energy 2010, 87, 2328–2339. [Google Scholar] [CrossRef]
- Choi, H.U.; Choi, K.H. CFD Analysis on the Heat Transfer and Fluid Flow of Solar Air Heater Having Transverse Triangular Block at the Bottom of Air Duct. Energies 2020, 13, 1099. [Google Scholar] [CrossRef]
- Huang, B.H.; Lin, T.H.; Hung, W.C.; Sun, F.S. Performance evaluation of solar photovoltaic/thermal systems. Sol. Energy 2001, 70, 443–448. [Google Scholar] [CrossRef]
- Tiwari, A.; Sodha, M.S. Parametric Study of Various Configurations of Hybrid PV/Thermal Air Collector: Experimental Validation of Theoretical Model. Sol. Energy Mater. Sol. Cells 2007, 91, 17–28. [Google Scholar] [CrossRef]
- Kumar, R.; Rosen, M.A. Performance Evaluation of a Double Pass PV/T Solar Air Heater with and without Fins. Appl. Therm. Eng. 2011, 31, 1402–1410. [Google Scholar] [CrossRef]
- Mojumder, J.C.; Ong, H.C.; Chong, W.T.; Shamshirband, S. Abdullah-Al-Mamoon Application of Support Vector Machine for Prediction of Electrical and Thermal Performance in PV/T System. Energy Build. 2016, 111, 267–277. [Google Scholar] [CrossRef]
- Agrawal, B.; Tiwari, G.N. Optimizing the Energy and Exergy of Building Integrated Photovoltaic Thermal (BIPVT) Systems under Cold Climatic Conditions. Appl. Energy 2010, 87, 417–426. [Google Scholar] [CrossRef]
- Sardarabadi, M.; Passandideh-Fard, M.; Zeinali Heris, S. Experimental Investigation of the Effects of Silica/Water Nanofluid OnPV/T (Photovoltaic Thermal Units). Energy 2014, 66, 264–272. [Google Scholar] [CrossRef]
- Tiwari, A.; Dubey, S.; Sandhu, G.S.; Sodha, M.S.; Anwar, S.I. Exergy Analysis of Integrated Photovoltaic Thermal Solar Water Heater under Constant Flow Rate and Constant Collection Temperature Modes. Appl. Energy 2009, 86, 2592–2597. [Google Scholar] [CrossRef]
- Ibrahim, A.; Fudholi, A.; Sopian, K.; Othman, M.Y.; Ruslan, M.H. Efficiencies and Improvement Potential of Building Integrated Photovoltaic Thermal (BIPVT) System. Energy Convers. Manag. 2014, 77, 527–534. [Google Scholar] [CrossRef]
- Sarhaddi, F.; Farahat, S.; Ajam, H.; Behzadmehr, A. Exergetic Performance Assessment of a Solar Photovoltaic Thermal (PV/T) Air Collector. Energy Build. 2010, 42, 2184–2199. [Google Scholar] [CrossRef]
- Jarimi, H.; Abu Bakar, M.N.; Othman, M.; Din, M.H. Bi-Fluid Photovoltaic/Thermal (PV/T) Solar Collector: Experimental Validation of a 2-D Theoretical Model. Renew. Energy 2016, 85, 1052–1067. [Google Scholar] [CrossRef]
- Amori, K.E.; Taqi Al-Najjar, H.M. Analysis of Thermal and Electrical Performance of a Hybrid (PVT) Air Based Solar Collector for Iraq. Appl. Energy 2012, 98, 384–395. [Google Scholar] [CrossRef]
- Senthilraja, S.; Gangadevi, R.; Marimuthu, R.; Baskaran, M. Performance Evaluation of Water and Air Based PVT Solar Collector for Hydrogen Production Application. Int. J. Hydrog. Energy 2020, 45, 7498–7507. [Google Scholar] [CrossRef]
- Joshi, A.S.; Tiwari, A. Energy and Exergy Efficiencies of a Hybrid Photovoltaic-Thermal (PV/T) Air Collector. Renew. Energy 2007, 32, 2223–2241. [Google Scholar] [CrossRef]


| Parameter | Value |
|---|---|
| Electrical efficiency at standard test condition (%), | 17.37 |
| Temperature coefficient (%/°C), | −0.41 |
| Temperature of the standard test condition (°C), | 25 |
| Absorption coefficient of the PV module (-), | 0.85 |
| Emissivity of the PVT collector, | 0.88 |
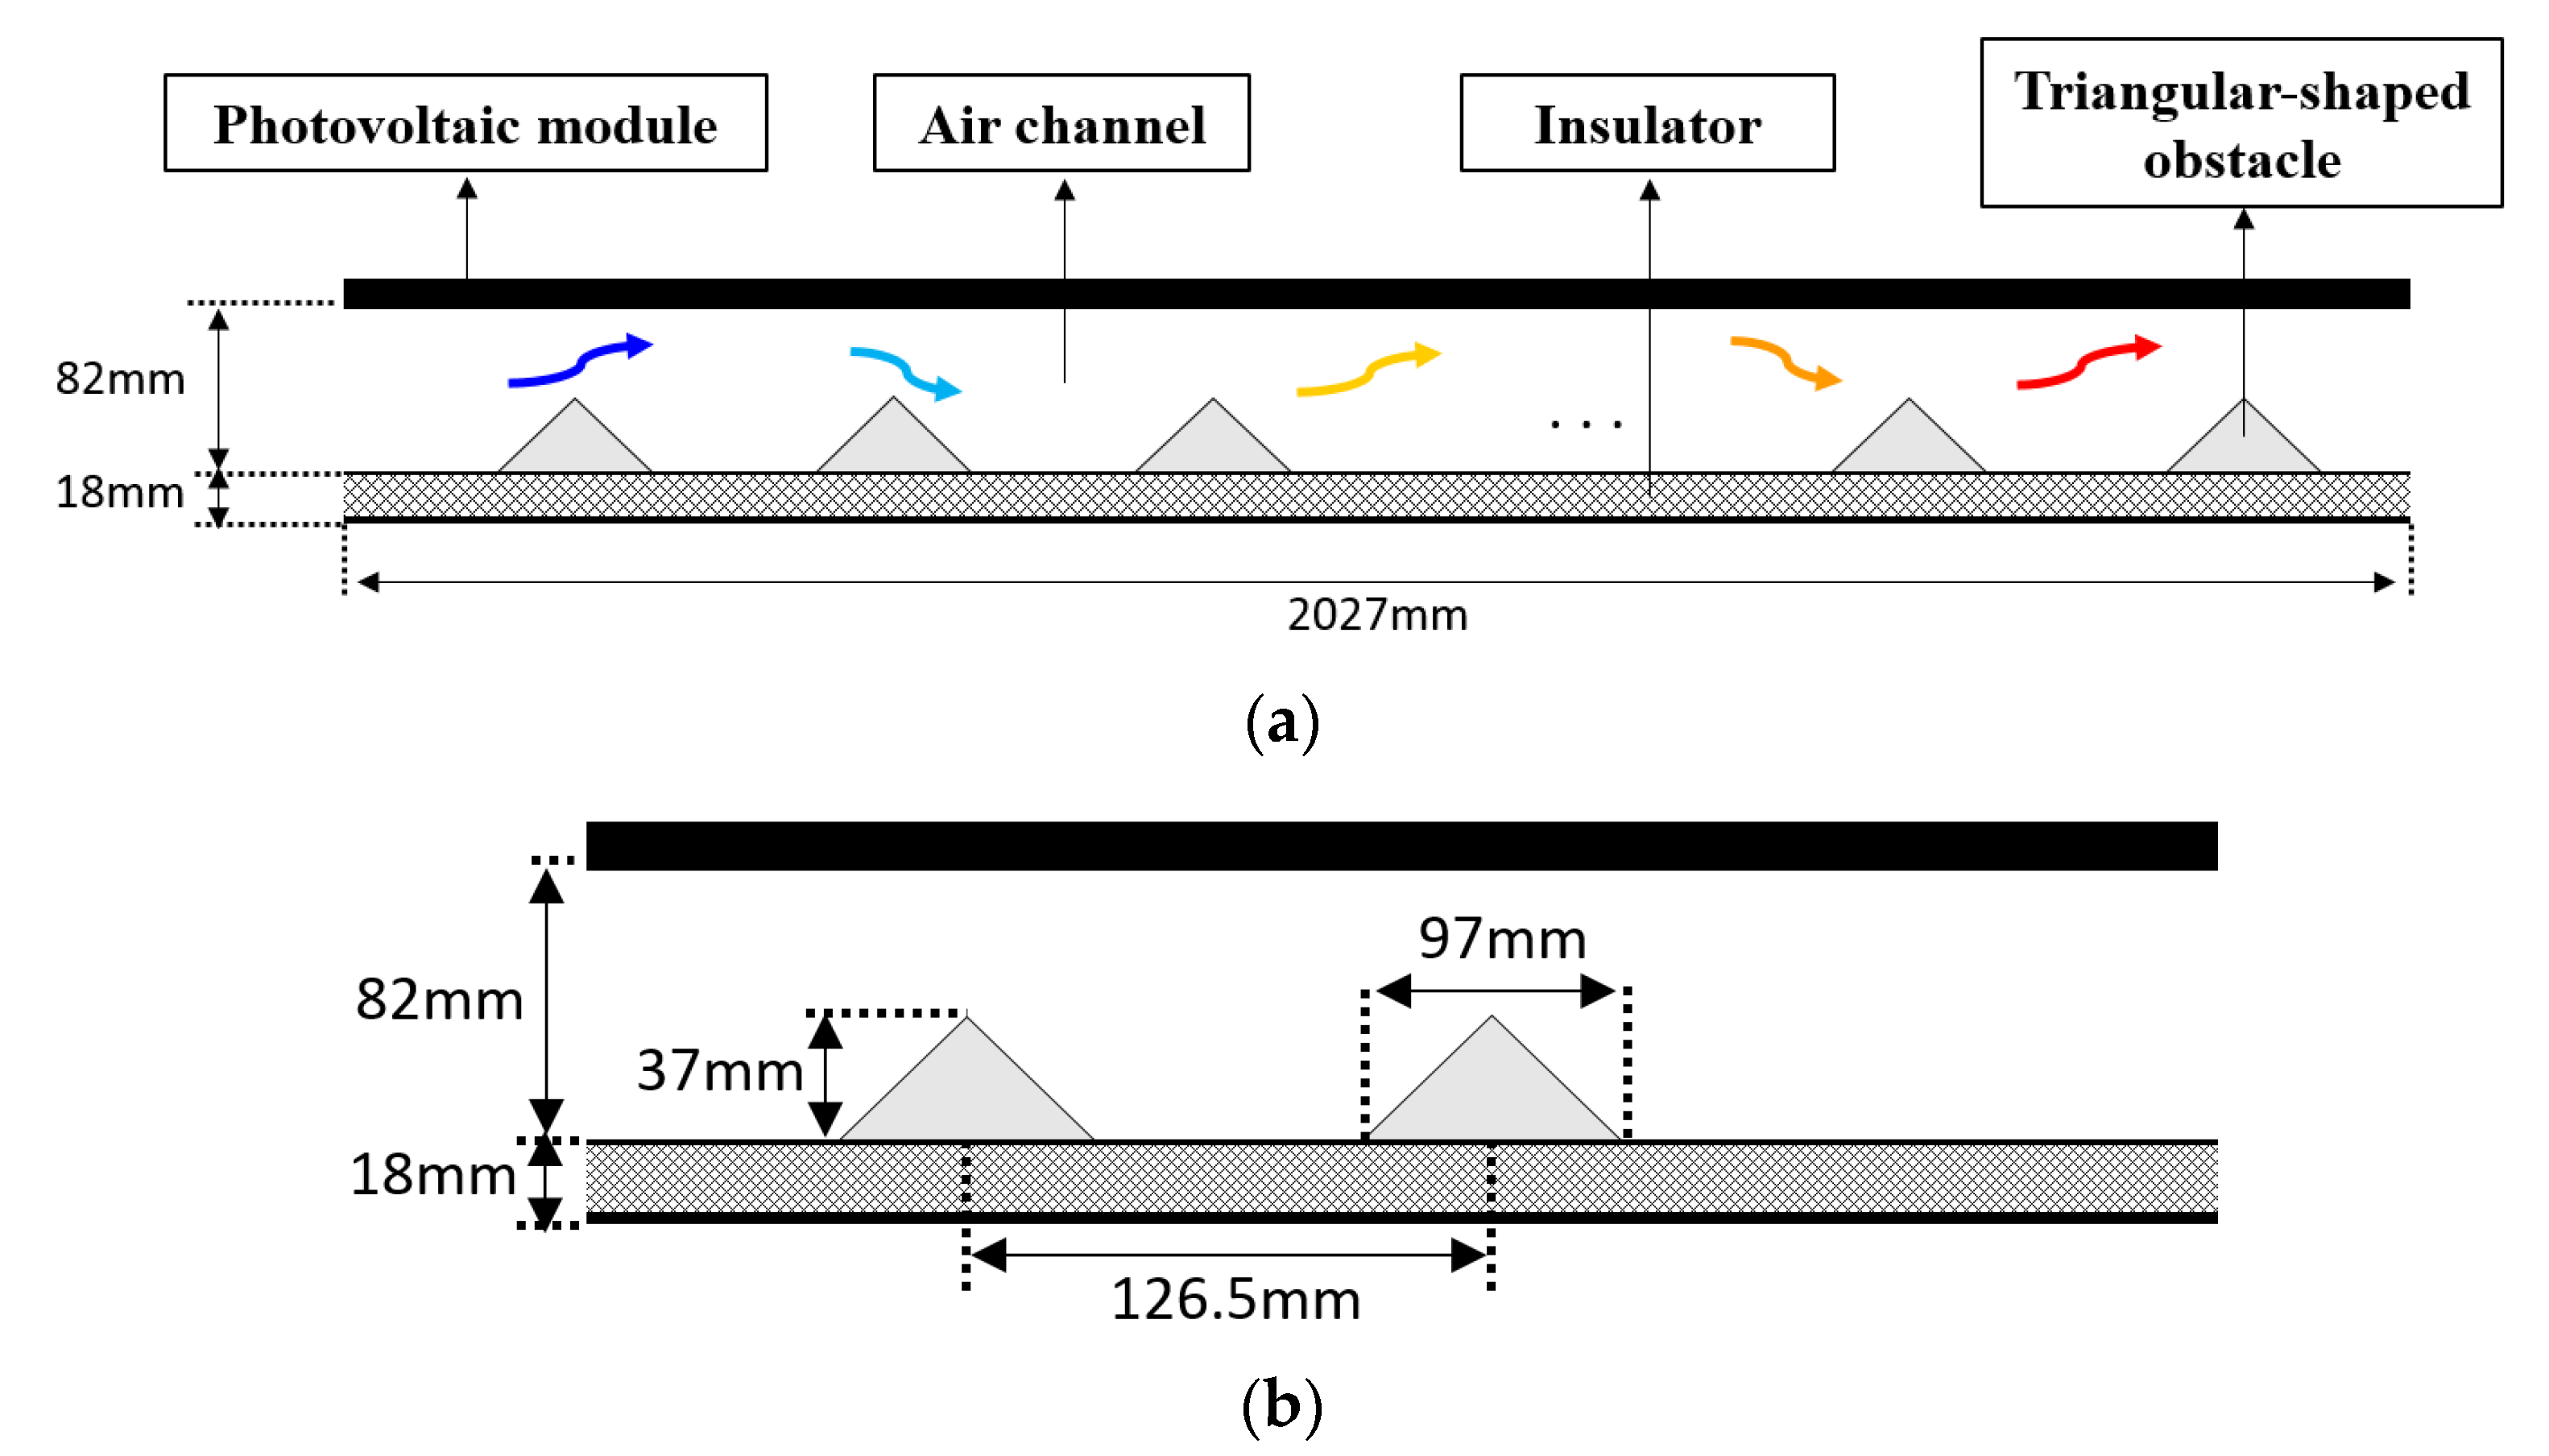
| Length of the air channel (mm), L | 2027 |
| Height of the air channel (mm), H | 83 |
| Width of the air channel (mm), w | 1000 |
| Height of a triangular obstacle (mm), | 37 |
| Length of a triangular obstacle (mm), | 97 |
| Pitch of a triangular obstacle (mm), | 126.5 |
| Area of the air-cooled PVT collector (m2), | 2.027 |
| Air flow rate (kg/m2s) | 0.05527 |
Publisher’s Note: MDPI stays neutral with regard to jurisdictional claims in published maps and institutional affiliations. |
© 2022 by the authors. Licensee MDPI, Basel, Switzerland. This article is an open access article distributed under the terms and conditions of the Creative Commons Attribution (CC BY) license (https://creativecommons.org/licenses/by/4.0/).
Share and Cite
An, B.-H.; Choi, K.-H.; Choi, H.-U. Influence of Triangle-Shaped Obstacles on the Energy and Exergy Performance of an Air-Cooled Photovoltaic Thermal (PVT) Collector. Sustainability 2022, 14, 13233. https://doi.org/10.3390/su142013233
An B-H, Choi K-H, Choi H-U. Influence of Triangle-Shaped Obstacles on the Energy and Exergy Performance of an Air-Cooled Photovoltaic Thermal (PVT) Collector. Sustainability. 2022; 14(20):13233. https://doi.org/10.3390/su142013233
Chicago/Turabian StyleAn, Byeong-Hwa, Kwang-Hwan Choi, and Hwi-Ung Choi. 2022. "Influence of Triangle-Shaped Obstacles on the Energy and Exergy Performance of an Air-Cooled Photovoltaic Thermal (PVT) Collector" Sustainability 14, no. 20: 13233. https://doi.org/10.3390/su142013233
APA StyleAn, B.-H., Choi, K.-H., & Choi, H.-U. (2022). Influence of Triangle-Shaped Obstacles on the Energy and Exergy Performance of an Air-Cooled Photovoltaic Thermal (PVT) Collector. Sustainability, 14(20), 13233. https://doi.org/10.3390/su142013233