Article

Analysis and Control of Chaos in the Boost Converter with ZAD, FPIC, and TDAS

by
Simeón Casanova Trujillo
1,*,
John E. Candelo-Becerra
2 and
Fredy E. Hoyos
2
1
Grupo de Investigación Cálculo Científico y Modelamiento Matemático, Universidad Nacional de Colombia, Sede Manizales, Manizales 170003, Colombia
2
Facultad de Minas, Departamento de Energía Eléctrica y Automática, Universidad Nacional de Colombia, Sede Medellín, Carrera 80 No. 65-223, Robledo, Medellín 050041, Colombia
*
Author to whom correspondence should be addressed.
Sustainability 2022, 14(20), 13170; https://doi.org/10.3390/su142013170
Submission received: 6 August 2022 / Revised: 27 September 2022 / Accepted: 9 October 2022 / Published: 14 October 2022

Abstract

:
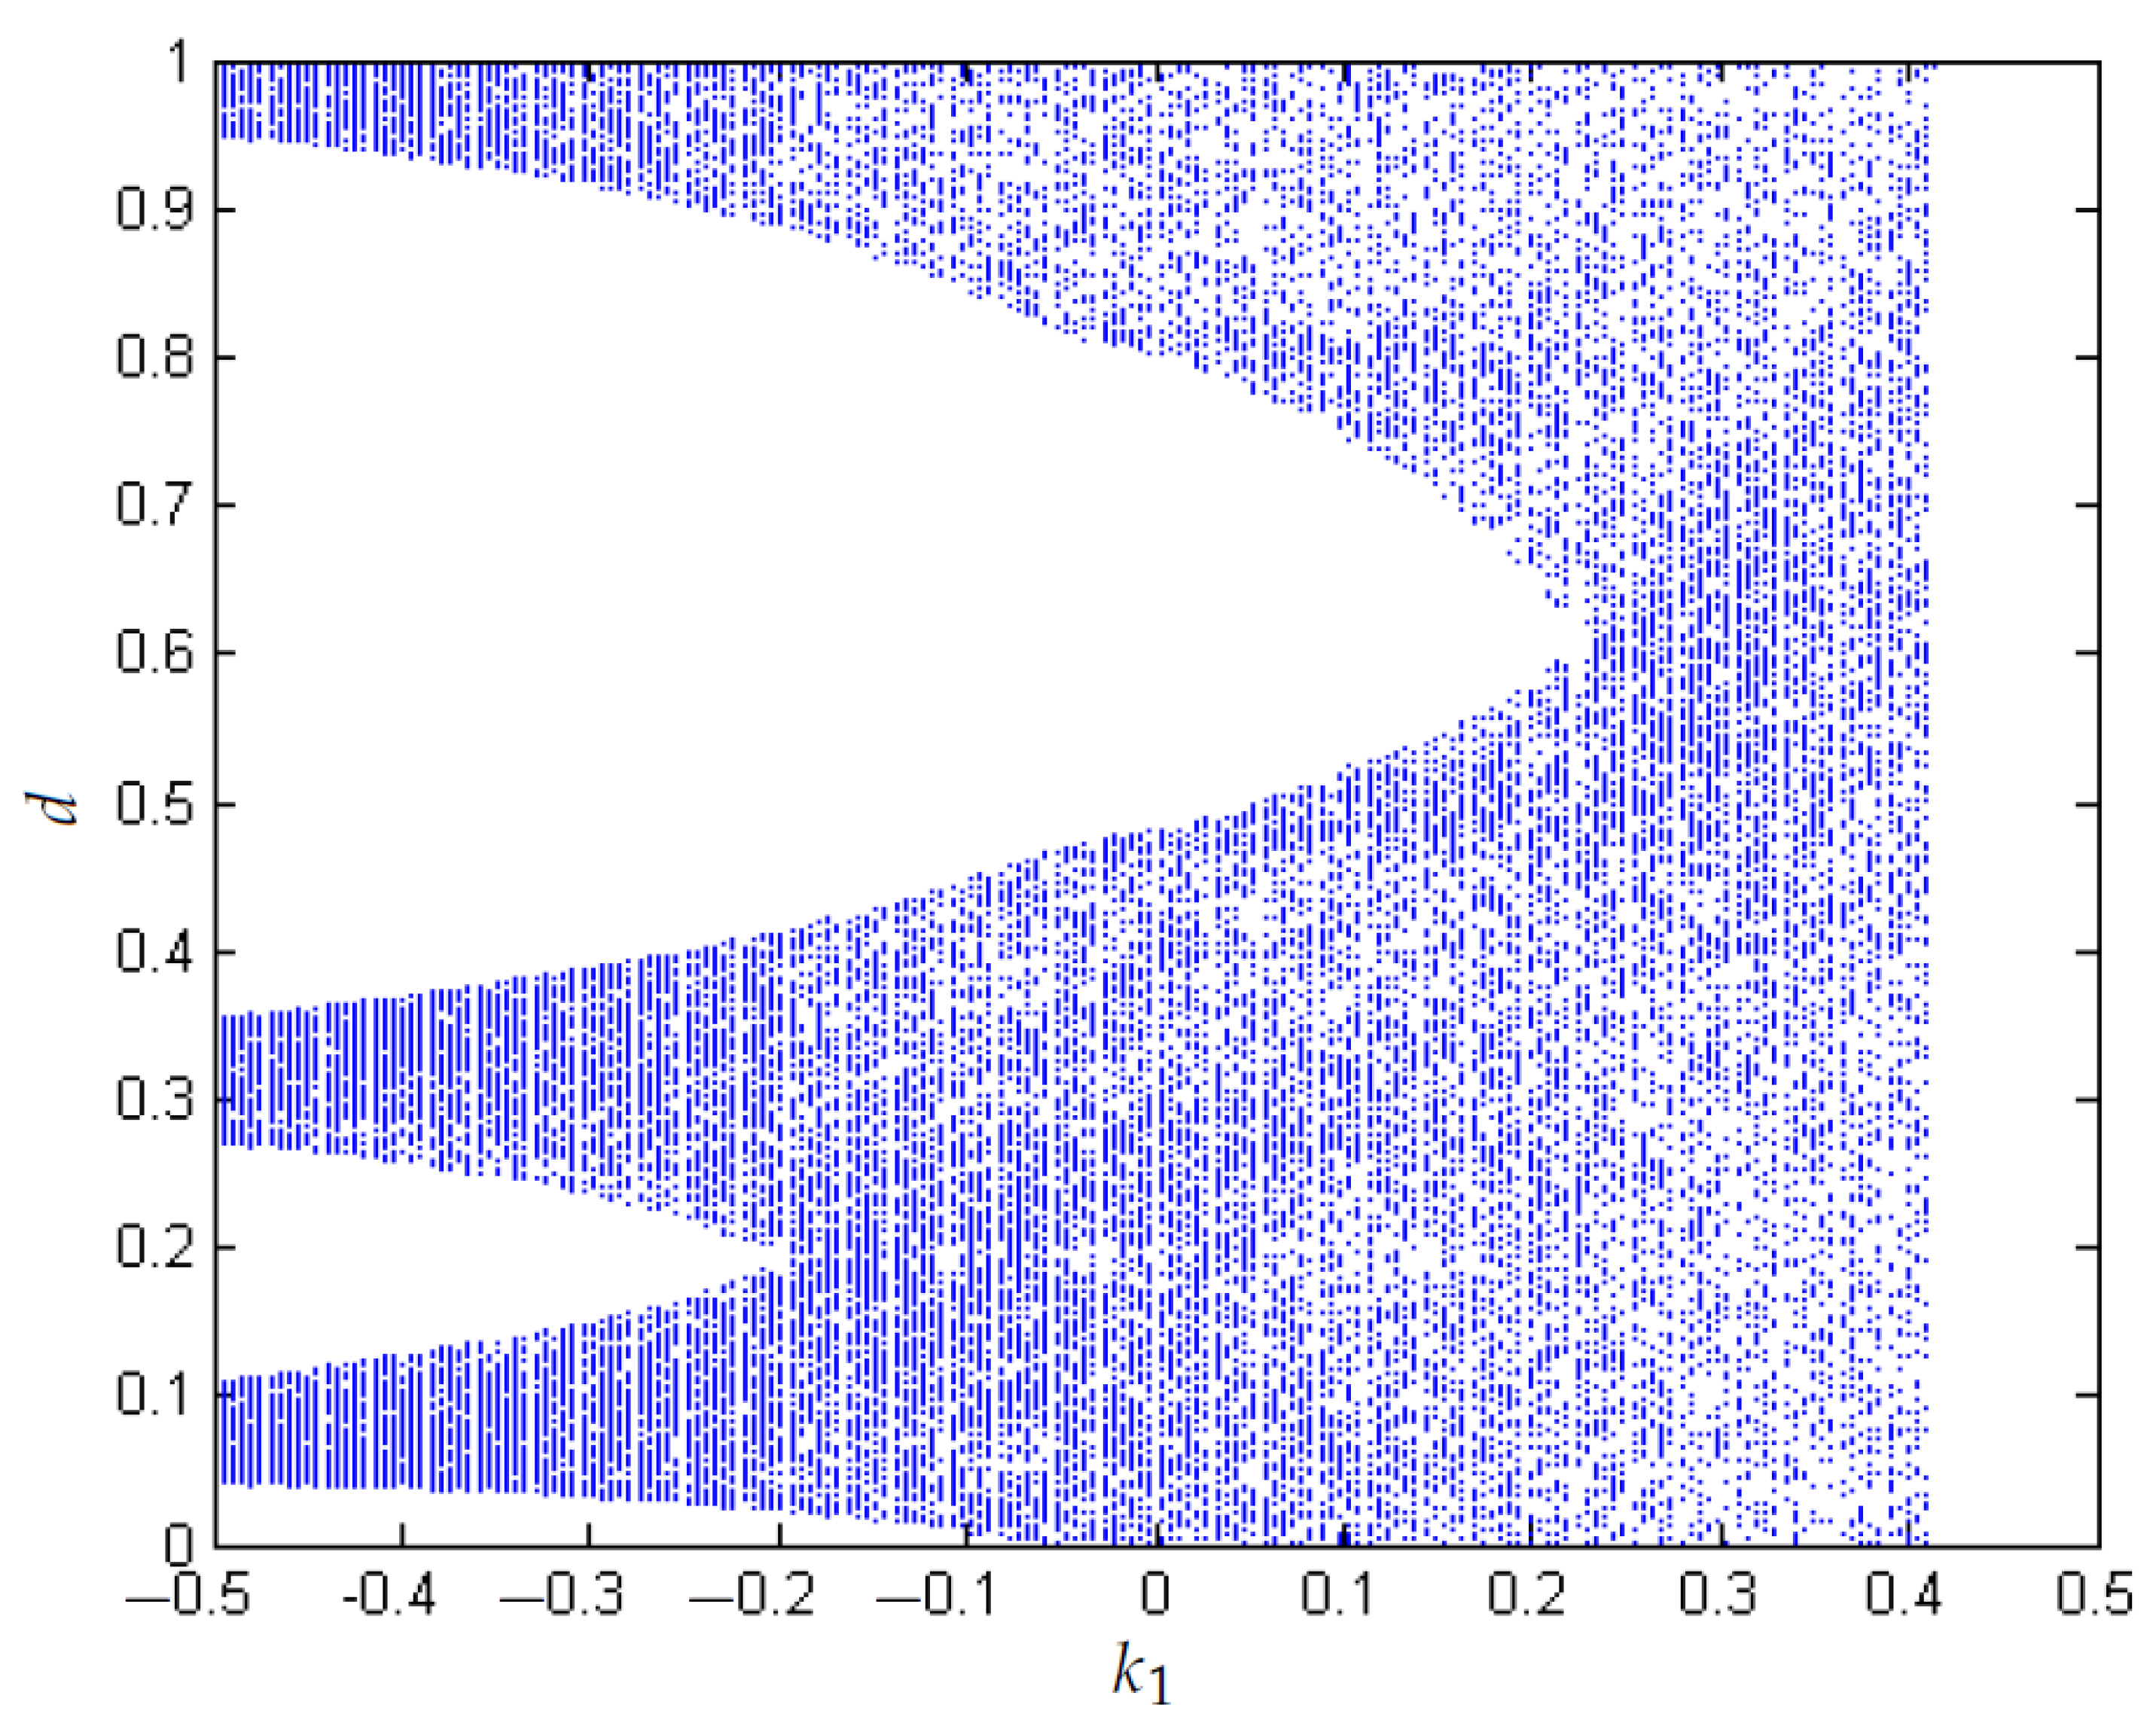
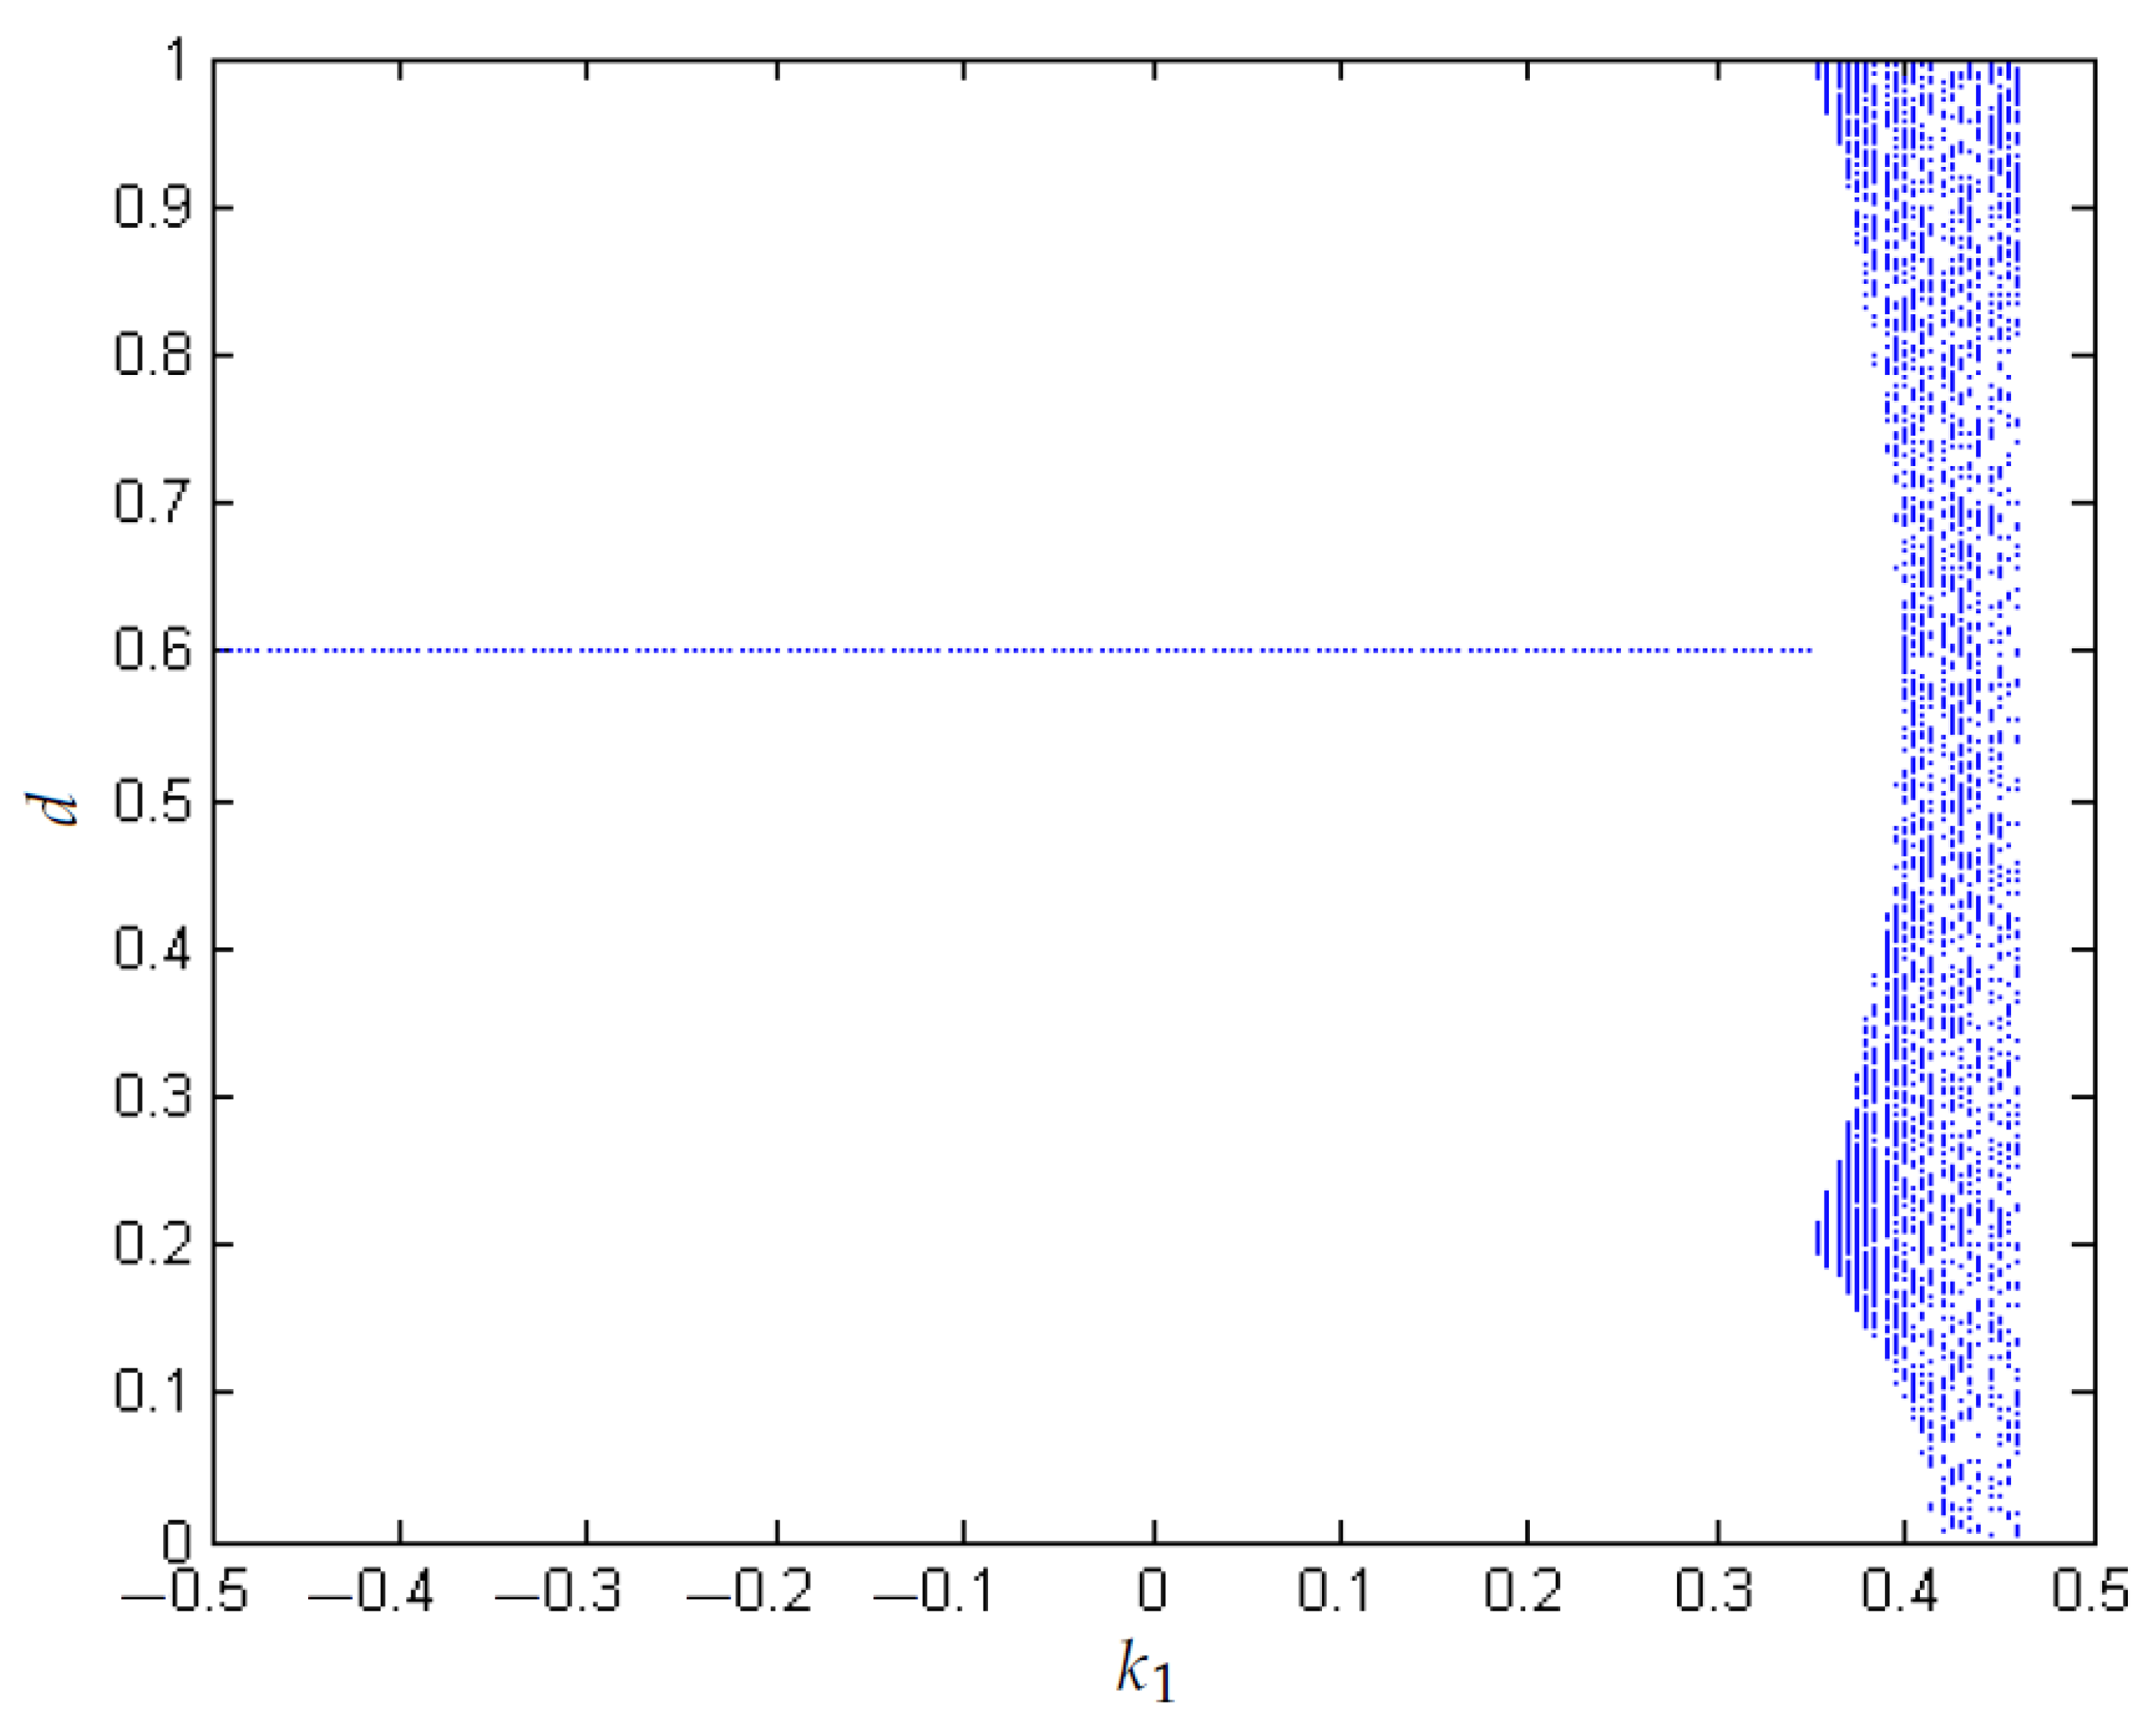
This paper presents an analysis and control of chaos in the boost converter controlled with zero average dynamics, fixed-point induced control, and time-delayed autosynchronization techniques. First, the existence of chaos is demonstrated numerically when positive Lyapunov exponents are found in the controlled system, for a range from k 1 = 0.26 to k 1 = 0.4387 , when k 2 = 0.5 . Additionally, chaos is also found for a range from k 1 = 0.435 to k 1 = 0.26 , when k 2 = 0.5 . Subsequently, fixed-point-induced control and time-delayed autosynchronization techniques are used to control the chaos. The results show that both techniques are useful to control the chaos in the boost converter. Furthermore, the fixed-point-induced control technique allows better regulation than the time-delayed autosynchronization technique. Moreover, when only the fixed-point induced control technique is used on the boost converter with a time delay, the results were not good enough to stabilize orbits. The stability is validated by calculating the Lyapunov exponents.

1. Introduction

Boost converters are devices used to step up the output voltage and deliver energy to the load. They are usually utilized to condition renewable energy sources like solar panels [1]; however, they are used in several applications such as computer power sources, battery chargers, automotive lighting systems, and power factor correction [2,3,4,5]. Static power converters are commonly used because of their efficiency, affordability, ease of implementation, programmability, and controllability [6].
These devices can be controlled with pulse-width modulation (PWM), a method to vary the duty cycle of a signal (defined as the time the switch is in the ON position), to control the output voltage with an equivalent fixed frequency. However, boost DC-DC converters are nonlinear systems because of their commutation device. The converter may slip into the discontinuous conduction mode in cases of low loads, which occurs when the inductor current crosses zero. Bifurcation and chaotic events have been demonstrated in DC-DC converters because of the nonlinear switching action and types of controllers [7,8,9,10]. Consequently, they show different behaviors when the parameters and operating conditions change or the system presents perturbations [11].
Some authors have studied the behavior of power converters and established the conditions when the system presents changes in stability or periodicity (periodic, quasi-periodic, or chaotic orbits) [12,13,14]. The implementation of various control techniques helps test modern controllers, such as nonlinear control techniques [15]. Recently, techniques such as Zero Average Dynamics (ZAD) have been used to control DC-DC converters, as presented in [15,16,17], both for the pulse to the center and the pulse to the side.
ZAD has been used to regulate different types of systems. For instance, in [15] the authors described the design, robustness analysis, and implementation of a ZAD and sliding mode control (ZAD–SMC) for a multiphase step-down converter. Hence, in [6], the authors studied a two-dimensional system defined by a boost converter controlled with ZAD. They discovered saturated periodic orbits and a period addition event. In [16], the authors use a boost converter to study the period addition phenomena in a model with parasitic resistances, similar to the results obtained from the experimental model. Additionally, the authors of [18] presented a switching surface that incorporates the current in the capacitor and a fixed-point induction control (FPIC) technique to respond to chaos.
Moreover, the boost converter can present saturated periodic orbits and period addition phenomena. This issue has been studied partially in [6] and reported in one-dimensional discrete dynamical systems. The boost converter controlled with ZAD has shown complex dynamics when the parameters change [11], and it is required to know the proper operating condition. Additionally, the time-delayed autosynchronization (TDAS) technique has been applied previously to stabilize any unstable balance [19], showing good results to control buck converters [12].
All these techniques have shown good results when applied to the buck and boost converter due to the benefit they offer. Hence, Table 1 presents the advantage and drawbacks of using these three techniques to control chaos in the boost converter.
From the literature reviewed it is observed that there is no numerical analysis that evaluates the behavior of the controlled system with ZAD and FPIC where a biparametric analysis is made, looking for the areas where there is chaos and where the system is stable. In addition, there is no analytical study of the ZAD-FPIC and ZAD-TDAS control, seeking to carry out an analysis of the behavior based on control parameters. Therefore, this paper presents an analysis and control of chaos in the boost converter with ZAD, FPIC, and TDAS. The contributions in this paper are as follows:
  • Existence of chaos is demonstrated numerically for positive Lyapunov exponents.
  • Chaos in the boost converter controlled with ZAD and FPIC is minimized, increasing the parameter N of the FPIC.
  • FPIC is used to control the system when there is a time delay in the sampling of signals.
  • Bifurcation diagrams are used to visualize the chaos is reduced when the value of N is increased from 0.1 to 0.6.
  • A biparametric diagram that considers N versus k 1 is used to study the boost behavior, showing that for greater values of N, the system is more stable. In addition, when k 1 , chaos can be presented for small values of N.
  • A biparametric diagram that considers the control constant TDAS versus the control parameter k 1 is used to show that for negative values of TDAS (close to −0.2) and small values of k 1 (close to 0) the system is stable.
The rest of the paper was divided into three more sections. Section 2 includes the mathematical formulation of the boost converter, the duty cycle for the three control techniques (ZAD, FPIC, and TDAS), and a definition of chaos. Subsequently, Section 3 presents the results and analysis, where simulations of chaos in the boost converter demonstrate the presence and control of chaos in the boost converter. Finally, in Section 4 the conclusions are presented.

2. Materials and Method

In this section, the materials and methods are focused on presenting the different mathematical models of the boost converter with the ZAD, FPIC, and TDAS.

2.1. Boost Converter

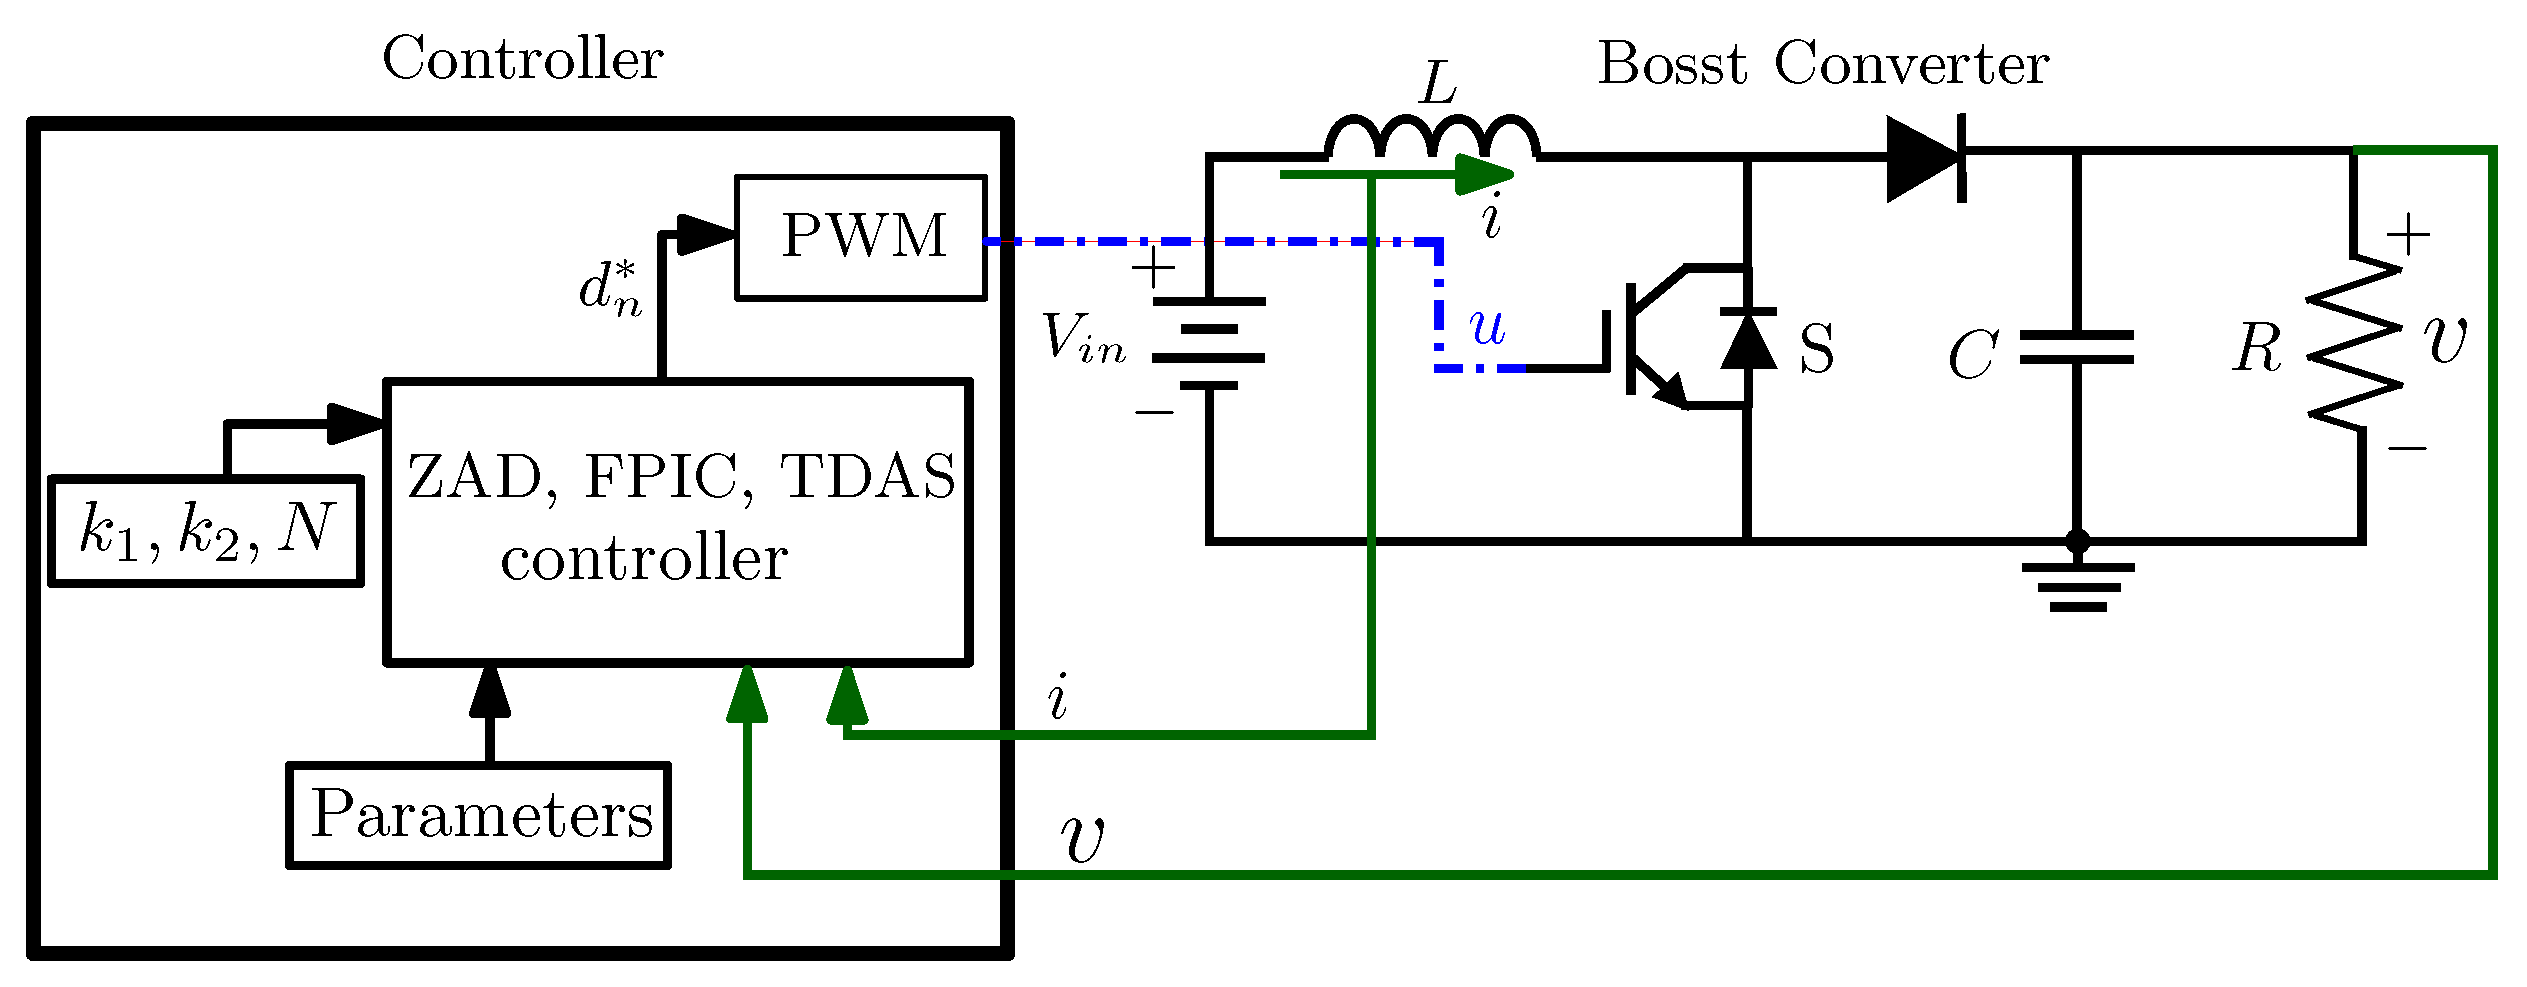
The studied system is a boost converter, which basic diagram can be represented as in Figure 1. In this figure, the term V i n is the input voltage, S is the switch, L is the inductor, C the capacitor, i is the current in the inductor, and v is the output voltage. When the switch S is closed (ON), the coil L stores energy from the voltage source V i n , while the load is supplied through the capacitor C. When the switch is open (OFF), the current passes through the diode D and feeds the capacitor C and the load R. In addition, k 1 and k 2 are the control parameters of the ZAD, N is the control parameter of the FPIC, and d n * is the duty cycle.
According to the diagram in Figure 1, the boost converter is governed by the following differential equations defined in Equations (1) and (2). The state space in which the system described by the boost converter evolves is a subset S 1 × R 2 (where S 1 is the unit circle).
d v d t = 1 R C v + 1 C i ( 1 u ) ,
d i d t = 1 L v ( 1 u ) + V i n L .
Equations (3)–(5) consider that x 1 , x 2 , and s are in function of the system variables V i n and i, the time response t, and the different parameters of the boost converter presented in Figure 1 and represented mathematically in Equations (1) and (2).
x 1 = v V i n ,
x 2 = L C i V i n ,
s = L C t .
Then, a new expression is obtained by performing the first derivative of the variables defined in Equation (3), and represented in Equation (4) as x ˙ 1 and x ˙ 2 . This equation can consider a parameter γ = L R 2 C to simplify the mathematical expression, as presented in Equation (6).
x ˙ 1 x ˙ 2 = γ 1 u u 1 0 x 1 x 2 + 0 1 .
From a theoretical standpoint, as the boost converter is a voltage booster, v > V i n , so x 1 > 1 . Therefore, when simulating the system, it is stated that the initial voltage condition must be strictly greater than 1. When u changes in the set { 0 , 1 } , a piecewise linear system is obtained. For instance, when u = 1 the result is Equation (7):
X ˙ ( t ) = A 1 X ( t ) + B ,
and when u = 0 the result is Equation (8):
X ˙ ( t ) = A 2 X ( t ) + B .
These two last expressions are simplified by considering that the matrices A 1 , A 1 , and B have the terms as presented in Equations (9)–(11). The terms consider the previously established parameter γ .
A 1 = γ 0 0 0 ,
A 2 = γ 1 1 0 ,
B = 0 1 .
The expressions represented in Equations (7) and (8) are differential equations given by the general Equation (12). The result of this expression is defined according to the system topology, as expressed in Equations (7) and (8).
X ˙ = A 1 X + B + ( A 2 A 1 ) X u .
The solution for each topology (u in the set { 0 , 1 } ) can establish a solution in time by integrating the terms between t 0 and t (Equation (13)), where ϕ i ( t t 0 ) = e A i ( t t 0 ) and ψ i ( t t 0 ) = t 0 t e A i ( t τ ) B d τ [28].
X i ( t ) = ϕ i ( t t 0 ) X ( t 0 ) + ψ i ( t t 0 ) .
With each topology and the calculation of the transition matrix, a new expression is established, as presented in Equation (14). Herein, the term I 2 is the identity matrix with a size of 2 × 2 .
ψ 1 ( t t 0 ) = B ( t t 0 ) and ψ 2 ( t t 0 ) = A 2 1 e A 2 ( t t 0 ) I 2 B .
Then, by considering the terms defined in Equation (6), two solutions are obtained when u changes in the set { 0 , 1 } and form two main topologies as follows:
For the topology 1 ( u = 1 ):
x 1 ( t ) = x 1 ( t 0 ) e γ ( t t 0 ) ,
x 2 ( t ) = x 2 ( t 0 ) + ( t t 0 ) . ,
For the topology 2 ( u = 0 ):
x 1 ( t ) = e γ 2 ( t t 0 ) [ x 1 ( t 0 ) 1 cos ω ( t t 0 ) γ 2 ω x 1 ( t 0 ) 1 2 γ x 2 ( t 0 ) sin ω ( t t 0 ) ] + 1 ,
x 2 ( t ) = e γ 2 ( t t 0 ) [ x 2 ( t 0 ) γ cos ω ( t t 0 ) + γ 2 ω x 2 ( t 0 ) γ 1 ω x 1 ( t 0 ) 1 sin ω ( t t 0 ) ] + γ .
In these two last expressions, the term ω = 1 2 4 γ 2 . In addition, it is assumed that 4 γ 2 > 0 ; otherwise, the solution will get unwanted solutions.
Moreover, a topology 3 is obtained when i = 0 , as expressed in the following equation:
x 1 ( t ) = x 1 ( t 0 ) e γ ( t t 0 ) ,
x 2 ( t ) = 0 .
However, this third topology corresponds to the discontinuous conduction mode, and it will not be considered in this research, as the work focuses on performing analysis in the continuous condition mode.

2.2. Duty Cycle

The duty cycle is the percentage of time the system works and is created by a switching system. The formulation of the duty cycle d c is presented in Equation (21) to determine the system operation, similar to that used in [29].
d c = 2 s ( x ( n T ) ) + T s ˙ 2 ( x ( n T ) ) s ˙ 2 ( x ( n T ) ) s ˙ 1 ( x ( n T ) ) .
A topology is obtained according to the duty cycle value calculated. Table 2 presents the different criteria evaluated according to the value of d c , the decision taken, and the resulting system topology. For example, if the duty cycle is lower than the minimum value, the system saturates, and the duty cycle must be equal to zero. In addition, if the duty cycle is greater than the maximum value T, the system saturates, and it is forced to be T. Other values in the range are accepted and the final decision is defined according to Equation (21).

2.3. Definition of Chaos

The study of chaos basically begins with the mathematical models developed by Edward N. Lorenz to study certain behaviors of convection. The most complete results on chaos have been obtained in nonlinear circuits because the design conditions facilitate their implementation and also because the circuits can be represented by ordinary differential equations or applications with few variables [28].
Hence, two types of chaos are differentiated: chaos and strong chaos. The first definition is easier to check numerically and can be found, for example, in [30]. The second definition is more complex, numerically and analytically, and can be found in [31]. However, there is no universally or scientifically accepted criterion for what chaos is. In this research, it is assumed that a system is chaotic if (1) it has positive Lyapunov exponents, (2) it has sensitive dependence on initial conditions in its domain, and (3) it is bounded [31].
Lyapunov exponents allow measuring the separation of two orbits that were initially very close. If the orbits are initially very close and, in the future, they are also close, then the associated Lyapunov exponents will be negative; and if the trajectories diverge, there will be at least one positive Lyapunov exponent. In this way, the Lyapunov exponents give a measure of the sensitivity of a system to initial conditions.
On the other hand, chaotic behavior is confirmed by the presence of a Lyapunov exponent in a system whose trajectories evolve in a confined region of the state space. Furthermore, in a chaotic attractor, the sum of all Lyapunov exponents is negative [32,33]. It is known that if a system is dissipative, then the sum of the Lyapunov exponents will be negative. Consequently, the study on the existence of chaos in the boost converter will be carried out through the numerical calculation of the Lyapunov exponents. Next, the definition of Lyapunov exponents is displayed as follows.
With D F ( x ) as the Jacobian matrix of the Poincaré application and q i D F ( x ) the i eigenvalue of D F ( x ) . The Lyapunov exponent λ i for each eigenvalue is given by
λ i = lim n 1 n k = 0 n log | q i D F ( x ( k ) ) | .

2.4. Control of Chaos with FPIC

In order to stabilize the unstable orbits, a chaos control approach must guarantee that the eigenvalues of the Jacobian matrix of the Poincaré application stay inside the unit circle (stability frontier). Therefore, some control techniques have been designed such as TDAS and FPIC which are used to control the chaos that the boost converter with ZAD. Then, the following discrete dynamic system given by Equation (23) is considered.
x k + 1 = f ( x k , u ( x k ) ) ,
where x k R n , u : R n R , f : R n + 1 R n , and u is an external signal that excites the system.
Now, suppose that the system has a fixed point:
x * , u ( x * ) : = x * , u * .
The following expression is obtained by computing the Jacobian of the system at this fixed point:
J = J x + J u ,
where
J x = f x x * , u * and J u = f u u x x * , u * .
If the spectral radius of the matrix J x is less than 1, that means, if ρ J x , a signal control exists. This guarantees the stability of the fixed point x * , u * for any N R + .
u ^ ( k ) = u ( x ( k ) ) + N u * N + 1 .
The discretization of the system corresponds to a sample of it every T seconds (Poincaré application). The Poincaré application together with its Jacobian can be expressed as in Equation (28).
x n + 1 = P x n , d n , J P = P x n + P d n · d n x n .
where y * = x * , d * is a fixed point of the Poincaré application. To apply the FPIC technique, the following equation must be considered:
ρ P x n y * < 1 .
If the relation in Equation (29) complies, then, the FPIC technique ensures the existence of a control signal.
d n * = d n + N d * N + 1 .
Therefore, the system:
x n + 1 = P x n , d n *
It has a y * as a stable fixed point. In Equation (30), d * corresponds to the duty cycle in the steady-state operation given by Equations (32)–(35):
d * = T k 1 ( γ x 1 r e f + x 2 r e f ) + k 2 ( x 1 r e f + 1 ) k 1 x 2 r e f k 2 x 1 r e f ,
d * = T ( k 1 x 2 r e f k 2 x 1 r e f ) γ k 1 x 1 r e f + k 2 k 1 x 2 r e f k 2 x 1 r e f ,
d * = T 1 γ k 1 x 1 r e f k 2 x 1 r e f γ k 1 x 1 r e f k 2 ,
d * = T 1 1 x 1 r e f .
It is important to find the spectral radius of the matrix to apply the FPIC technique:
P x n = ϕ 1 d n 2 ϕ 2 T d n ϕ 1 d n 2 .
This last equation is evaluated in a fixed point y * of the Poincaré application to verify if the value is less than 1.

2.5. Control of Chaos with TDAS

The technique is based on applying feedback to the variable delayed in time [23]. As the variable that induces instability is associated with the duty cycle, when applying the TDAS technique the following expression is written:
d ( n ) = d + η ( d ( n ) d ( n 1 ) ) ,
where d ( n ) is the duty cycle to be applied, d is the duty cycle given by Equation (21), d ( n 1 ) is the duty cycle in the previous iteration and η is the feedback factor. From Equation (37) is obtained the expression defined in Equation (38).
d ( n ) = d η d ( n 1 ) 1 η .
The Jacobian of the new system is calculated to numerically find the values of η that guarantee the stability of the 1 T -periodic orbit. By calculating the duty cycle using Equation (38), a new system with the Poincaré application has the form expressed in Equation (39).
X ( n + 1 ) = P X ( n ) , d X ( n ) , X ( n 1 ) .
where Z 1 = X ( n ) , Z 2 = X ( n 1 ) . A new signal is obtained from variable-dependent control Z 1 and Z 2 :
d ( n + 1 ) = d ( Z 1 ( n ) ) η d ( Z 2 ( n ) ) 1 η .
The following systems are obtained:
Z 1 ( n + 1 ) = P Z 1 ( n ) , d Z 1 ( n ) , Z 2 ( n ) ,
Z 2 ( n + 1 ) = Z 1 ( n ) .
The Jacobian of the new system defined in Equation (42) is given as in Equation (43).
J = P Z 1 + P d d Z 1 P d d Z 2 I O .
where I and O are the identities and the null matrices of size 2 × 2 , respectively. With this Jacobian (which will be implemented in Matlab) its eigenvalues are studied, which allows for determining the system stability.
All these equations presented in this section are used to control the boost converter with ZAD, FPIC, and TDAS. Starting from the duty cycle in Equation (21) that corresponds to the system controlled with ZAD, it is expected to vary the control parameter k 1 to find a zone where chaos is presented. In addition, with Equation (30) the system is controlled with ZAD and FPIC to seek to control the chaos. In addition, with Equation (40), the ZAD-TDAS control is performed, seeking to stabilize the chaos when there is a period of delay.

3. Results and Analysis

This section presents the results of the simulations performed on the boost converter to determine the chaos and control with the proposed techniques. First, the section presents the chaos in the boost converter. Next, chaos is controlled by using the FPIC. Then, the chaos is controlled by using the FPIC with a time delay. Even more, the chaos is controlled by considering TDAS. Finally, the results include an analysis with bifurcation diagrams.

3.1. Chaos in the Boost Converter

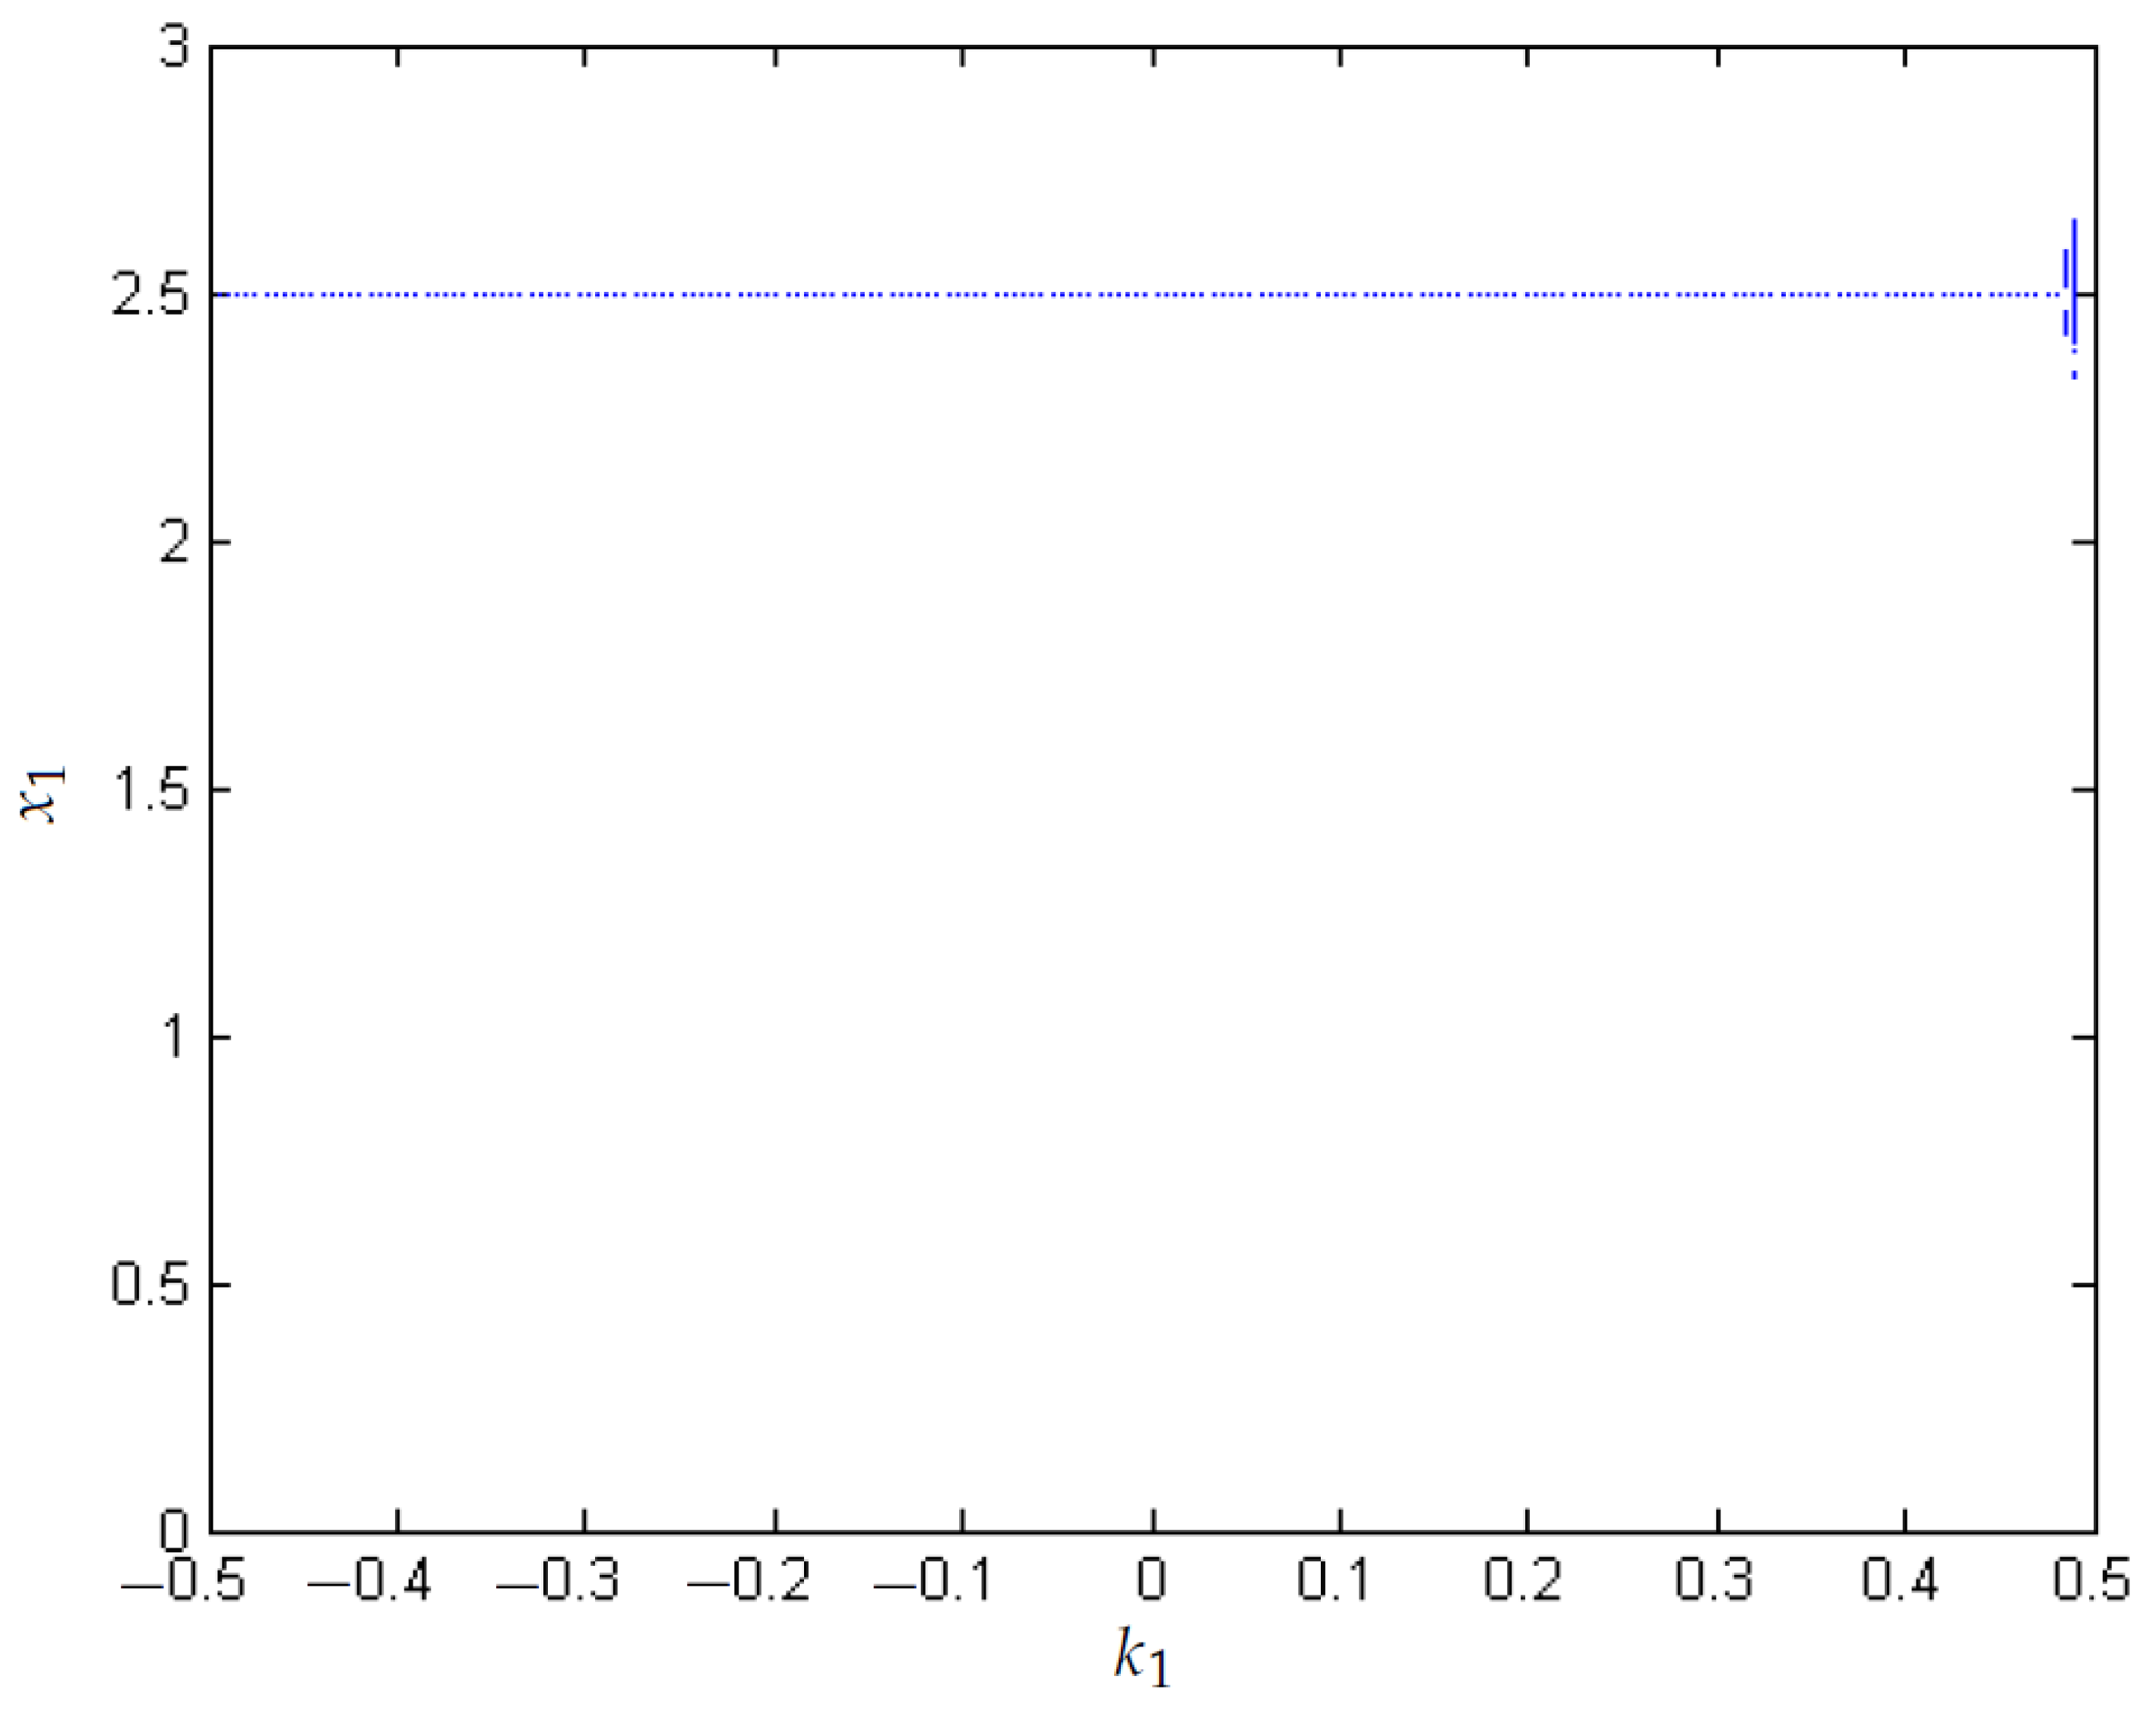
Figure 2 shows the presence of chaos in the boost converter in a certain range of variability of the parameter k 1 , due to the presence of positive Lyapunov exponents. This case is generated considering a positive parameter k 2 = 0.5 . The result shows that the stability is lost when the parameter k 1 = 0.26 and the values of the Lyapunov exponents increase.
In addition, Figure 3 confirms the existence of chaos in the boost converter for a range of the parameter k 1 , due to the presence of positive Lyapunov exponents. This case is generated considering a negative parameter k 2 = 0.5 . Similar to the previous figure, the result shows that the stability is lost when the parameter k 1 = 0.26 and the values of the Lyapunov exponents increase.

3.2. Control of Chaos with FPIC

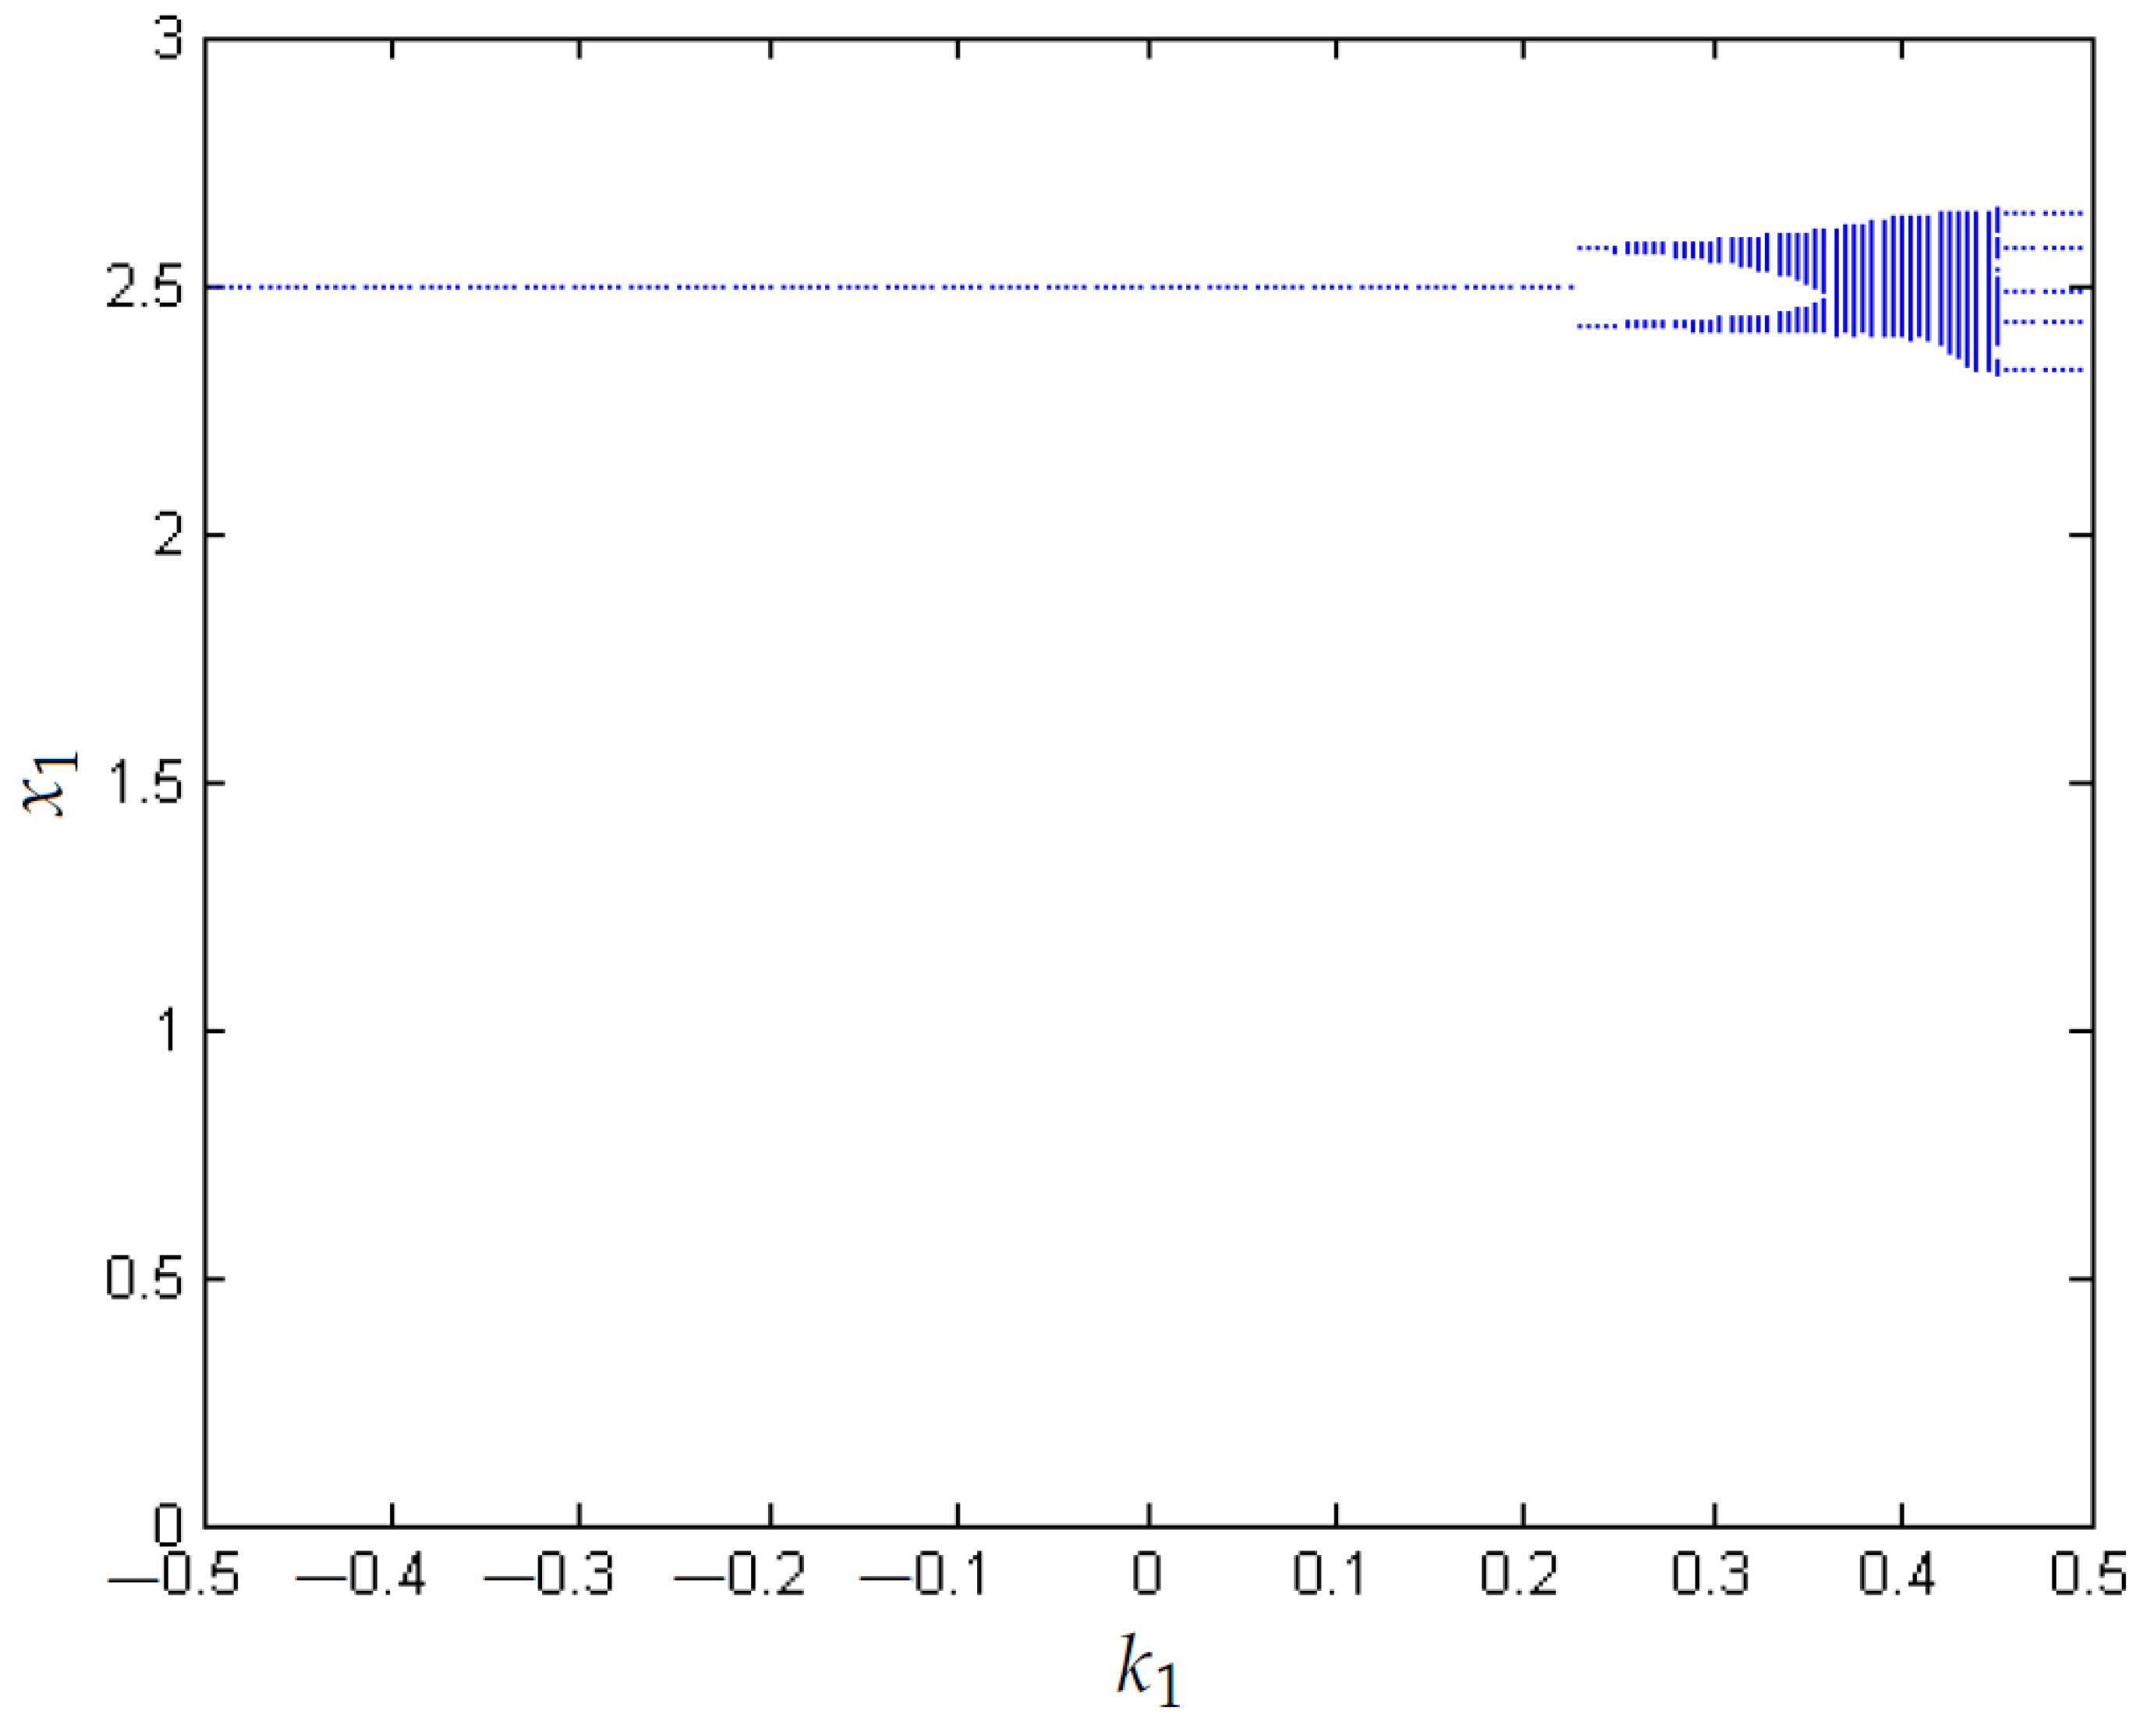
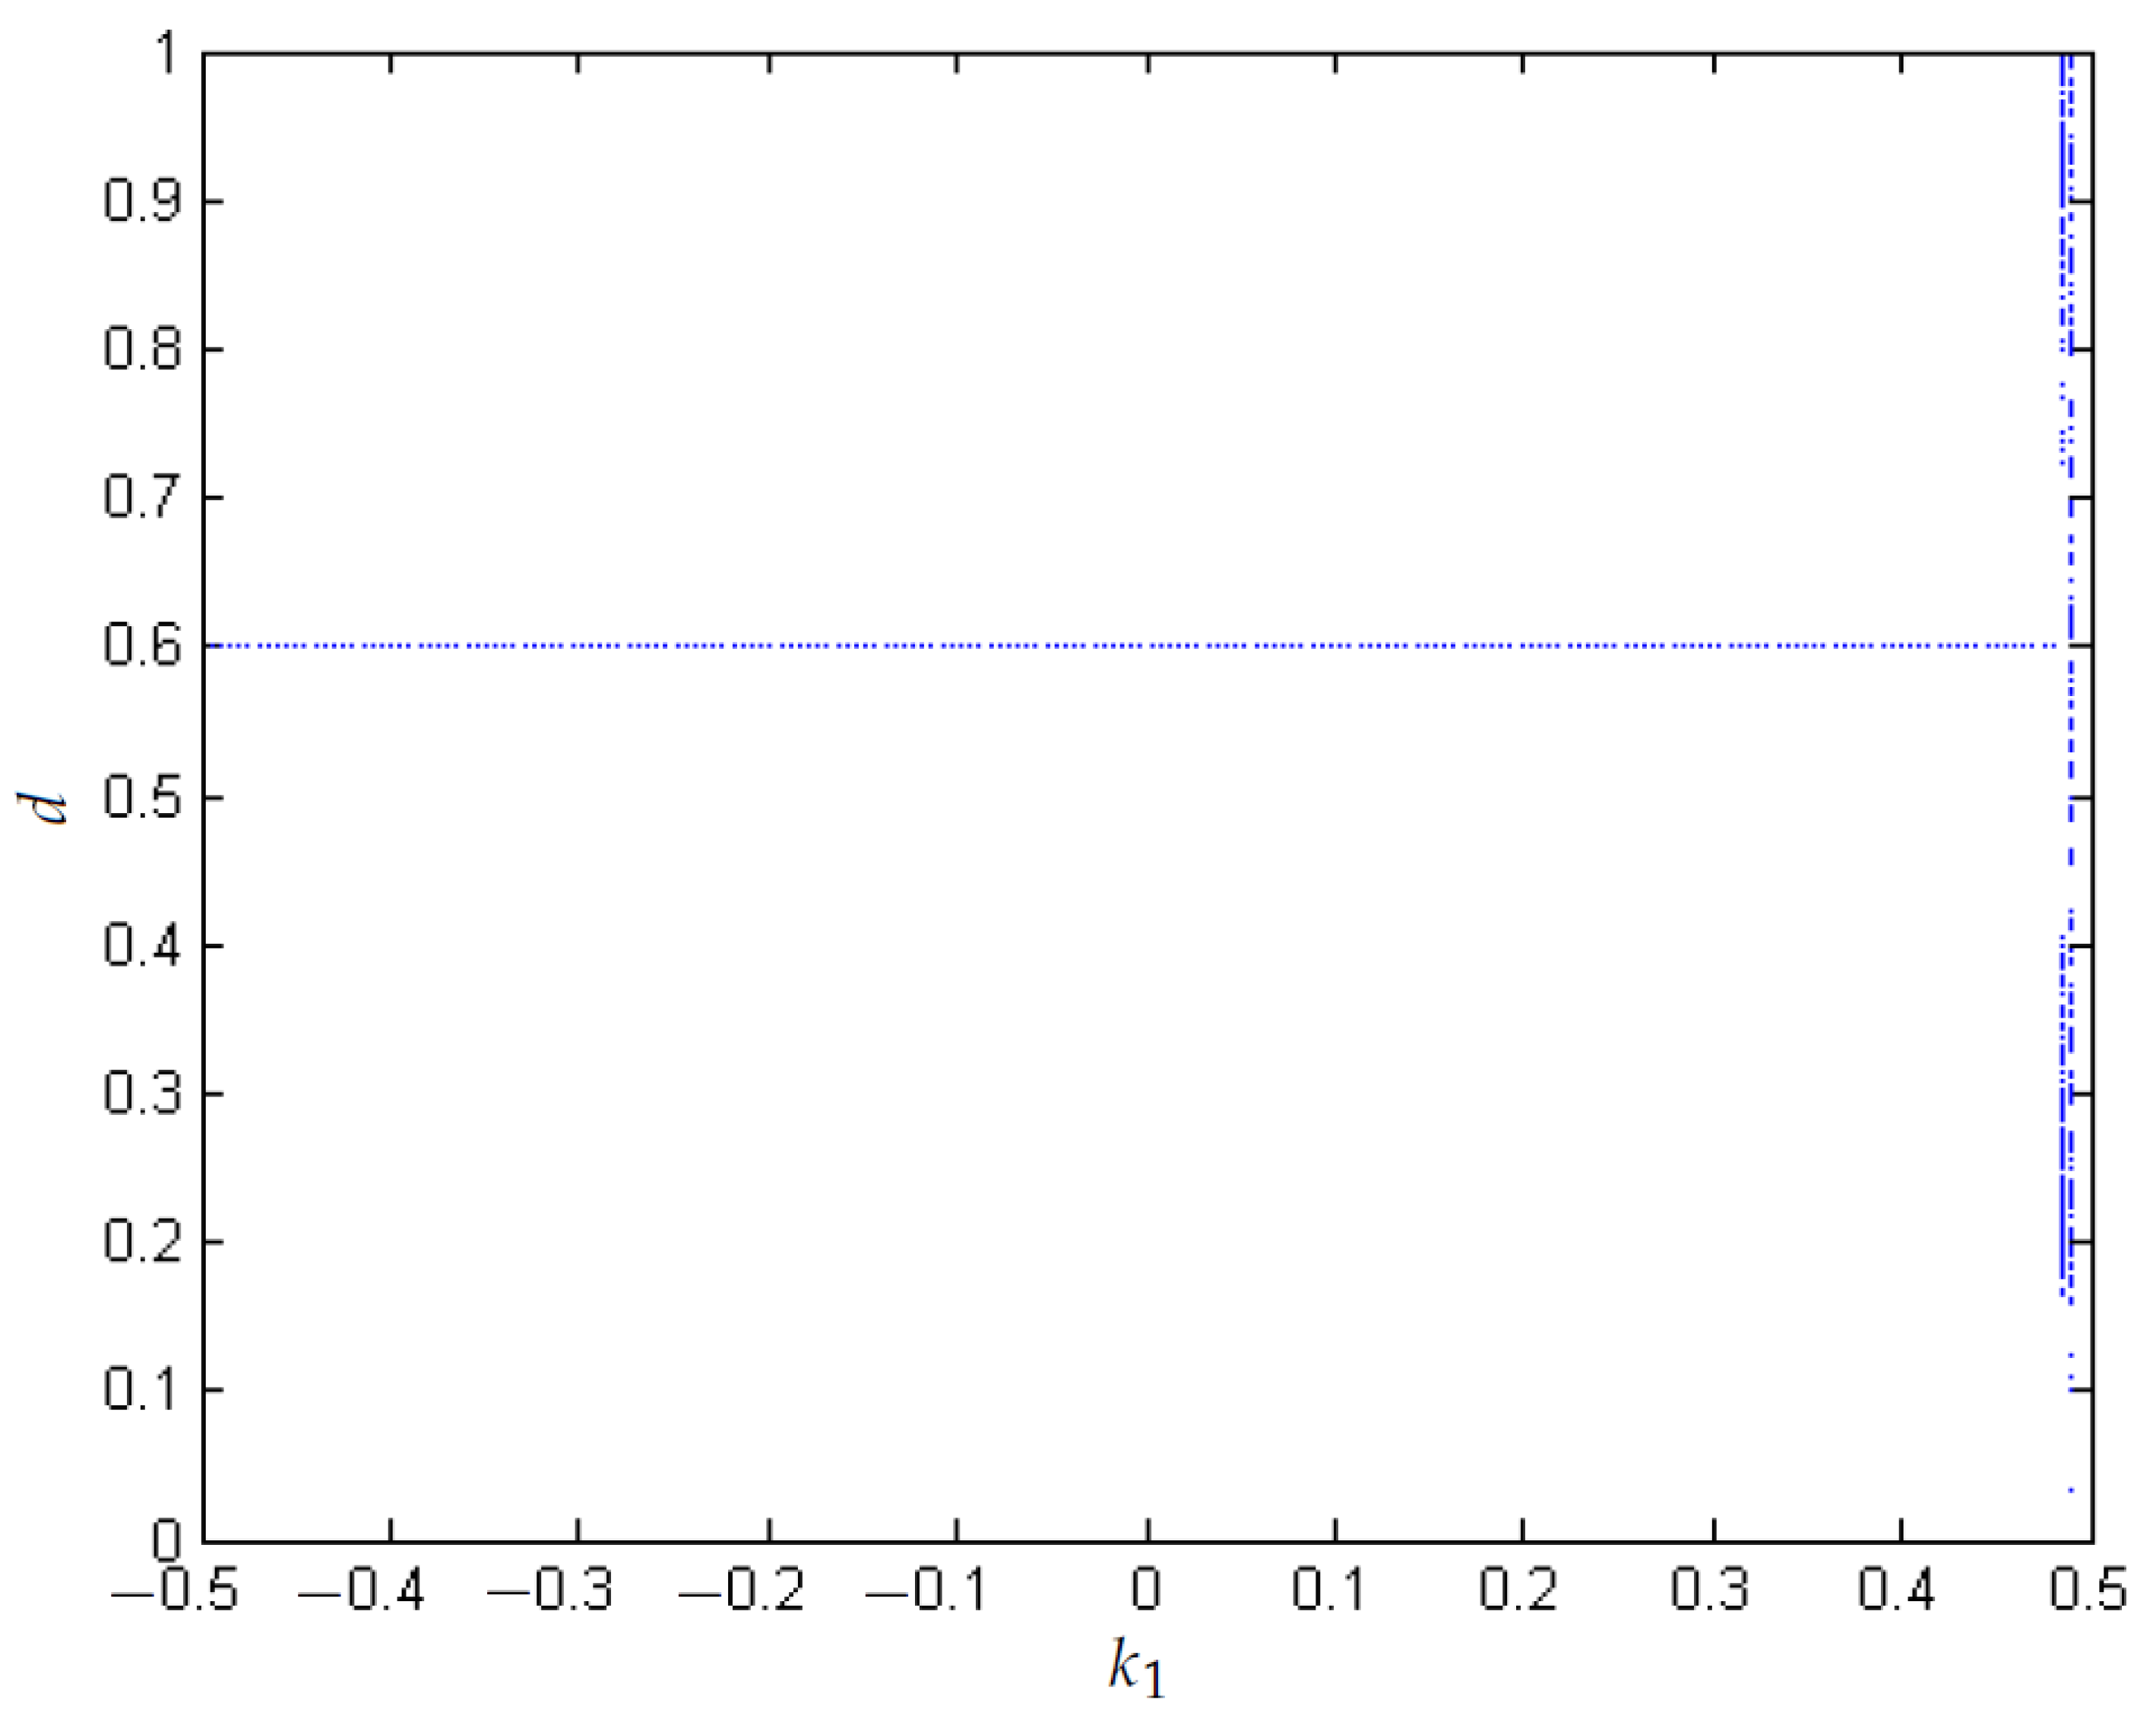
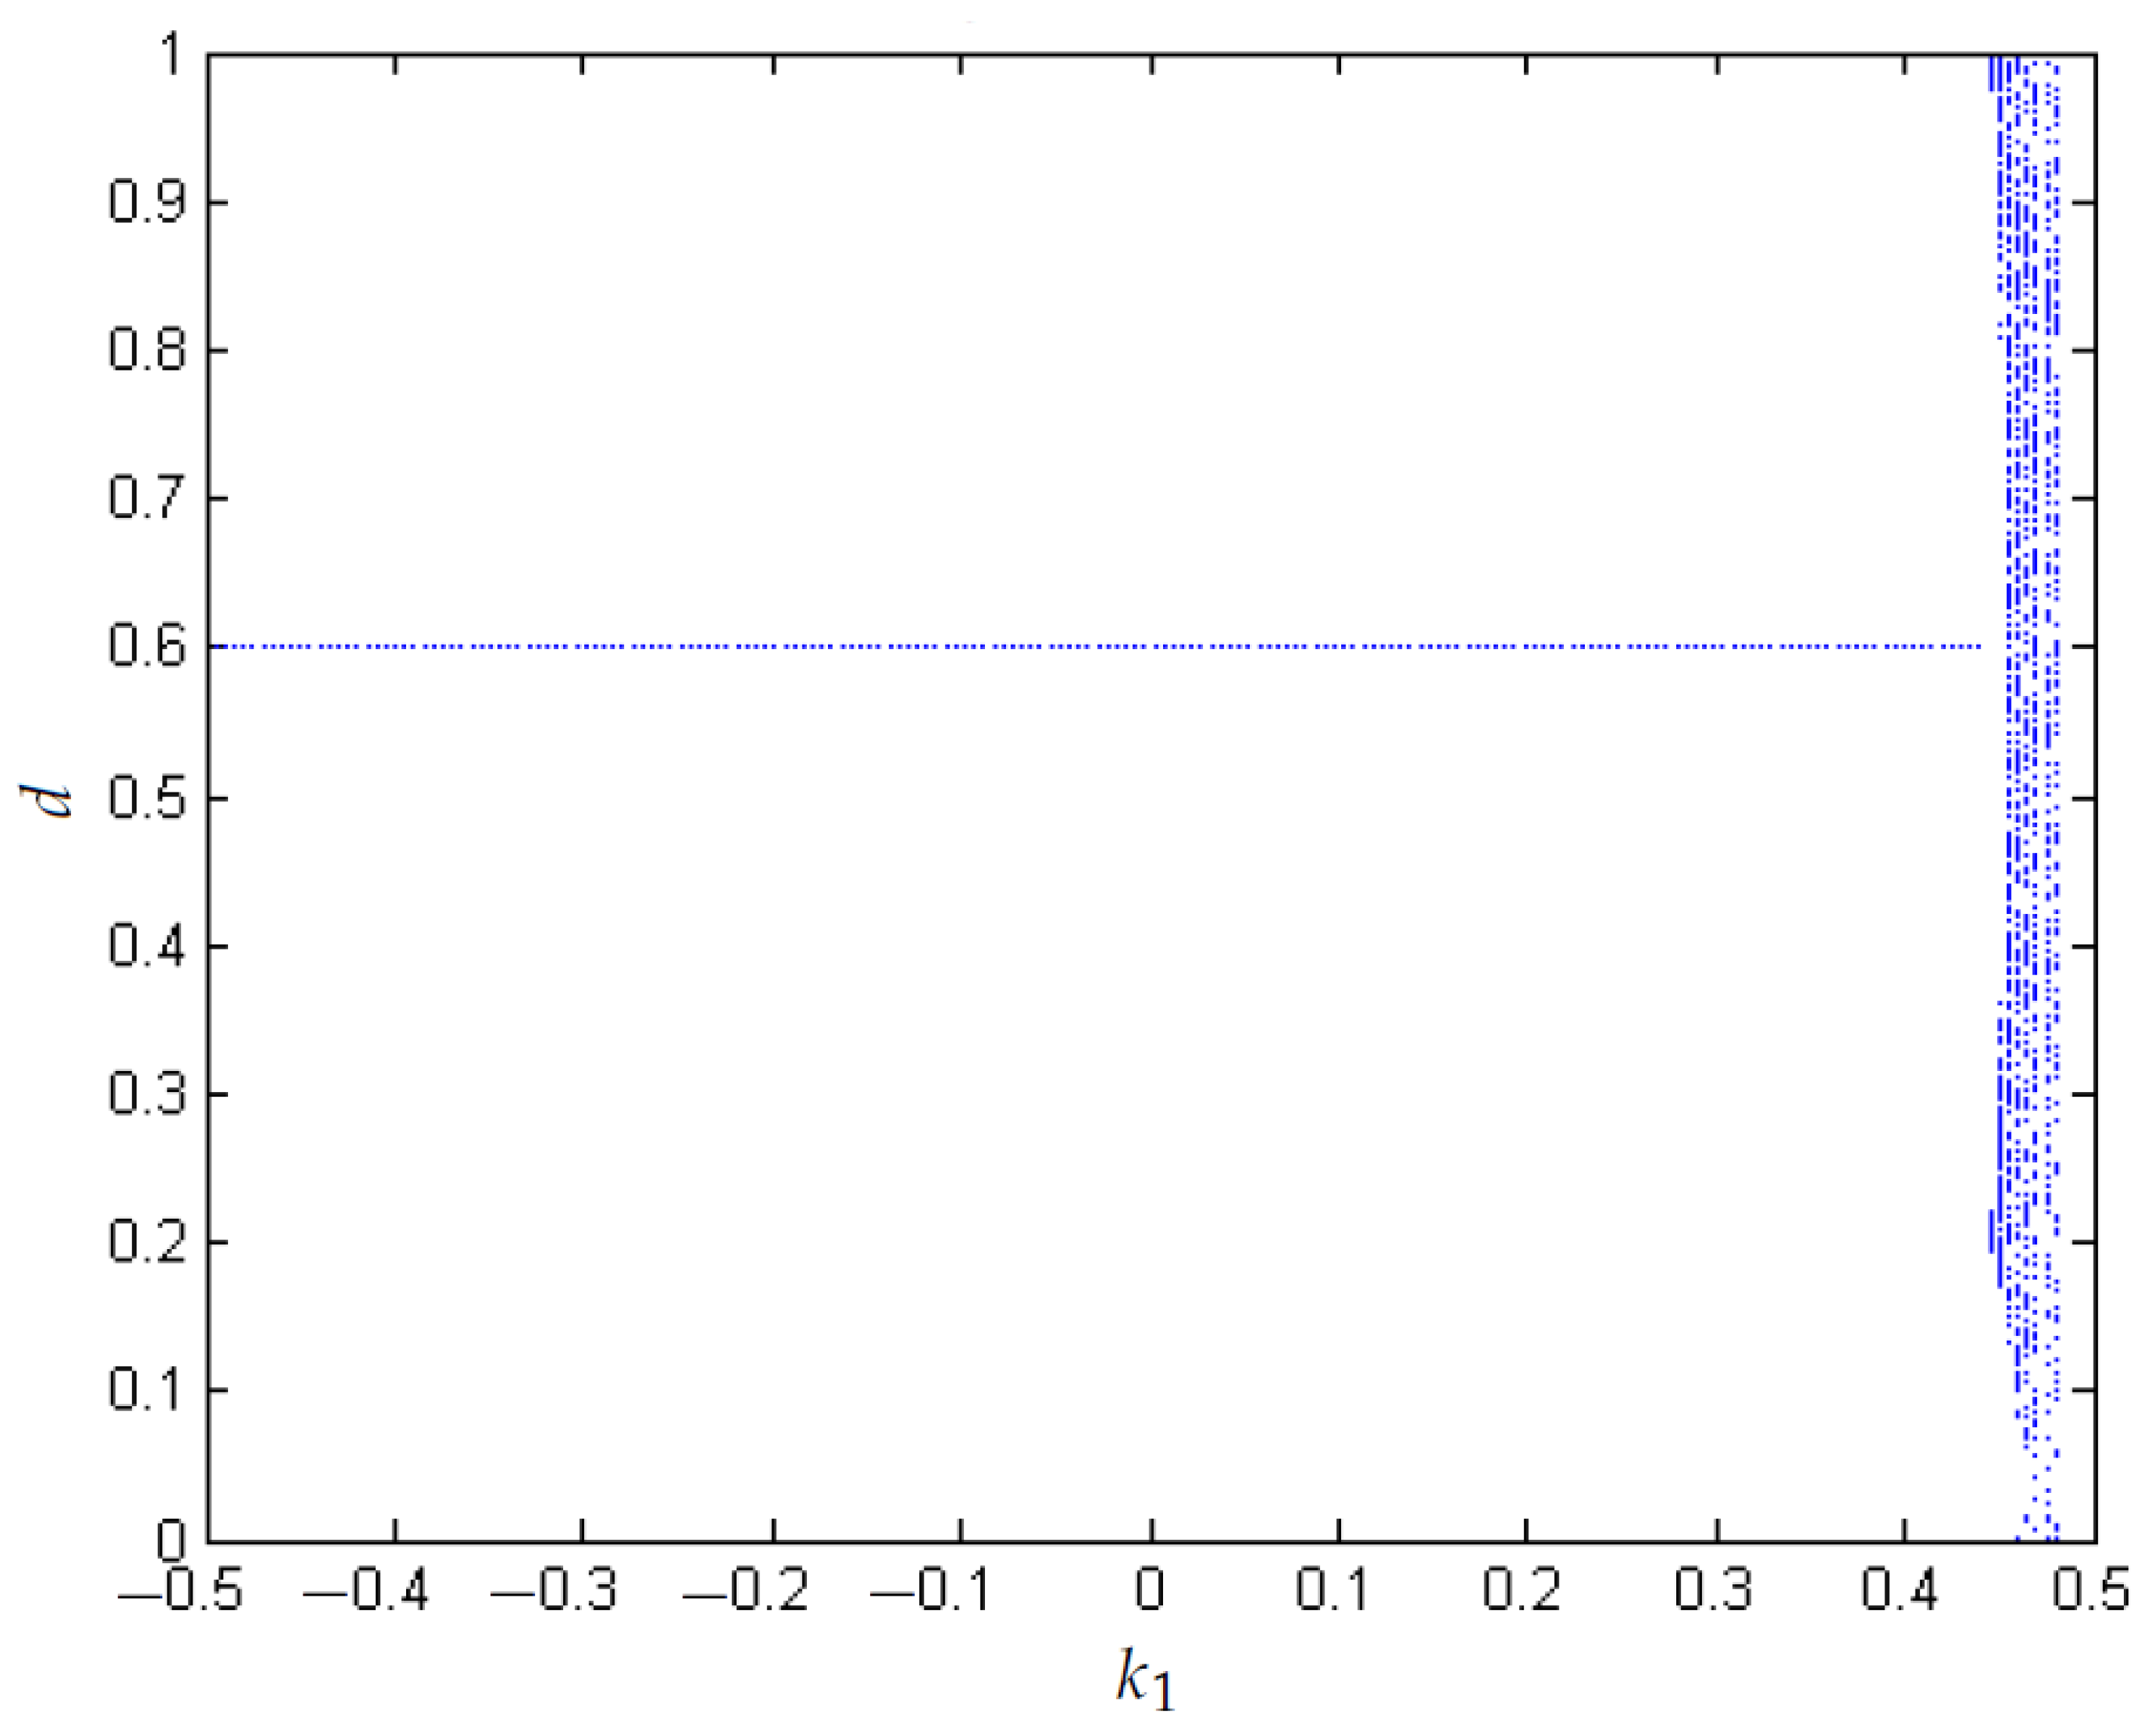
After detecting that the system presents chaos in zones of the parameters, then a control technique is used to determine the response. In this case, FPIC is applied to the boost converter controlled with ZAD. Hence, Figure 4 and Figure 5 show that the area with chaotic behavior decreases when N = 0.1 . These graphs show the stability of the system when the parameter k 1 is lower than the value 0.26. Then, when the parameter is higher than the value, the system losses stability, and chaos is presented.
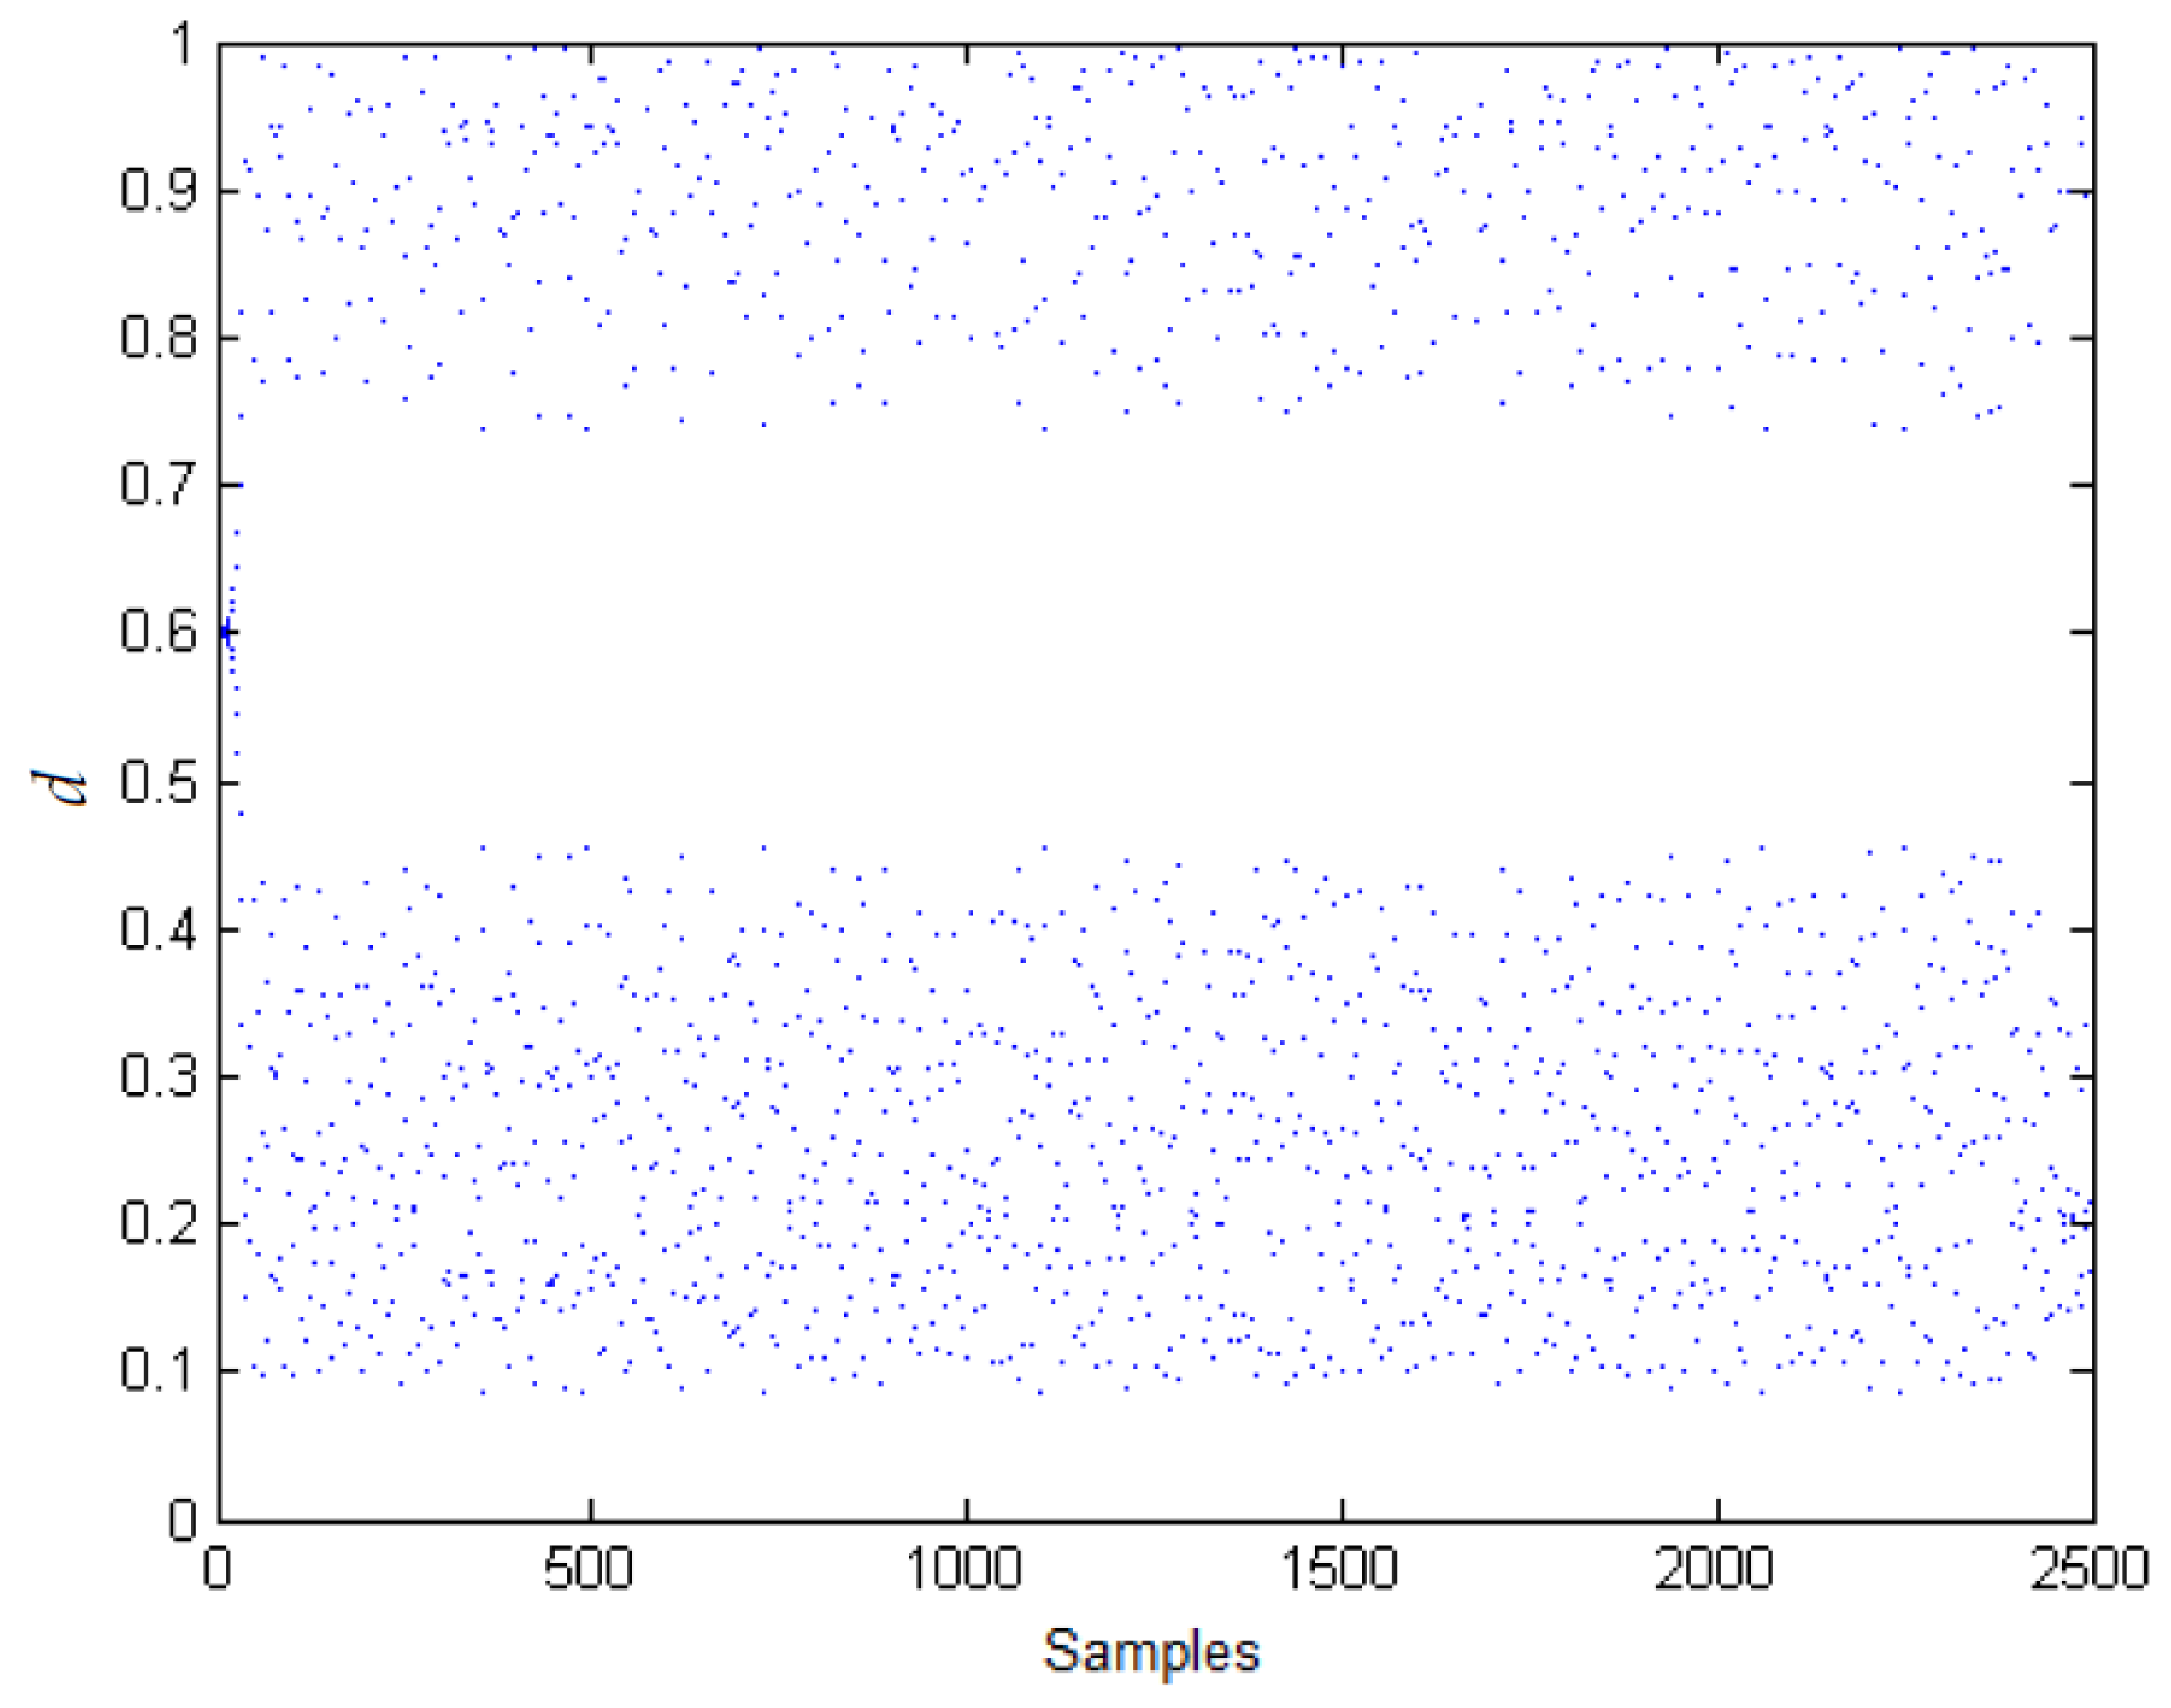
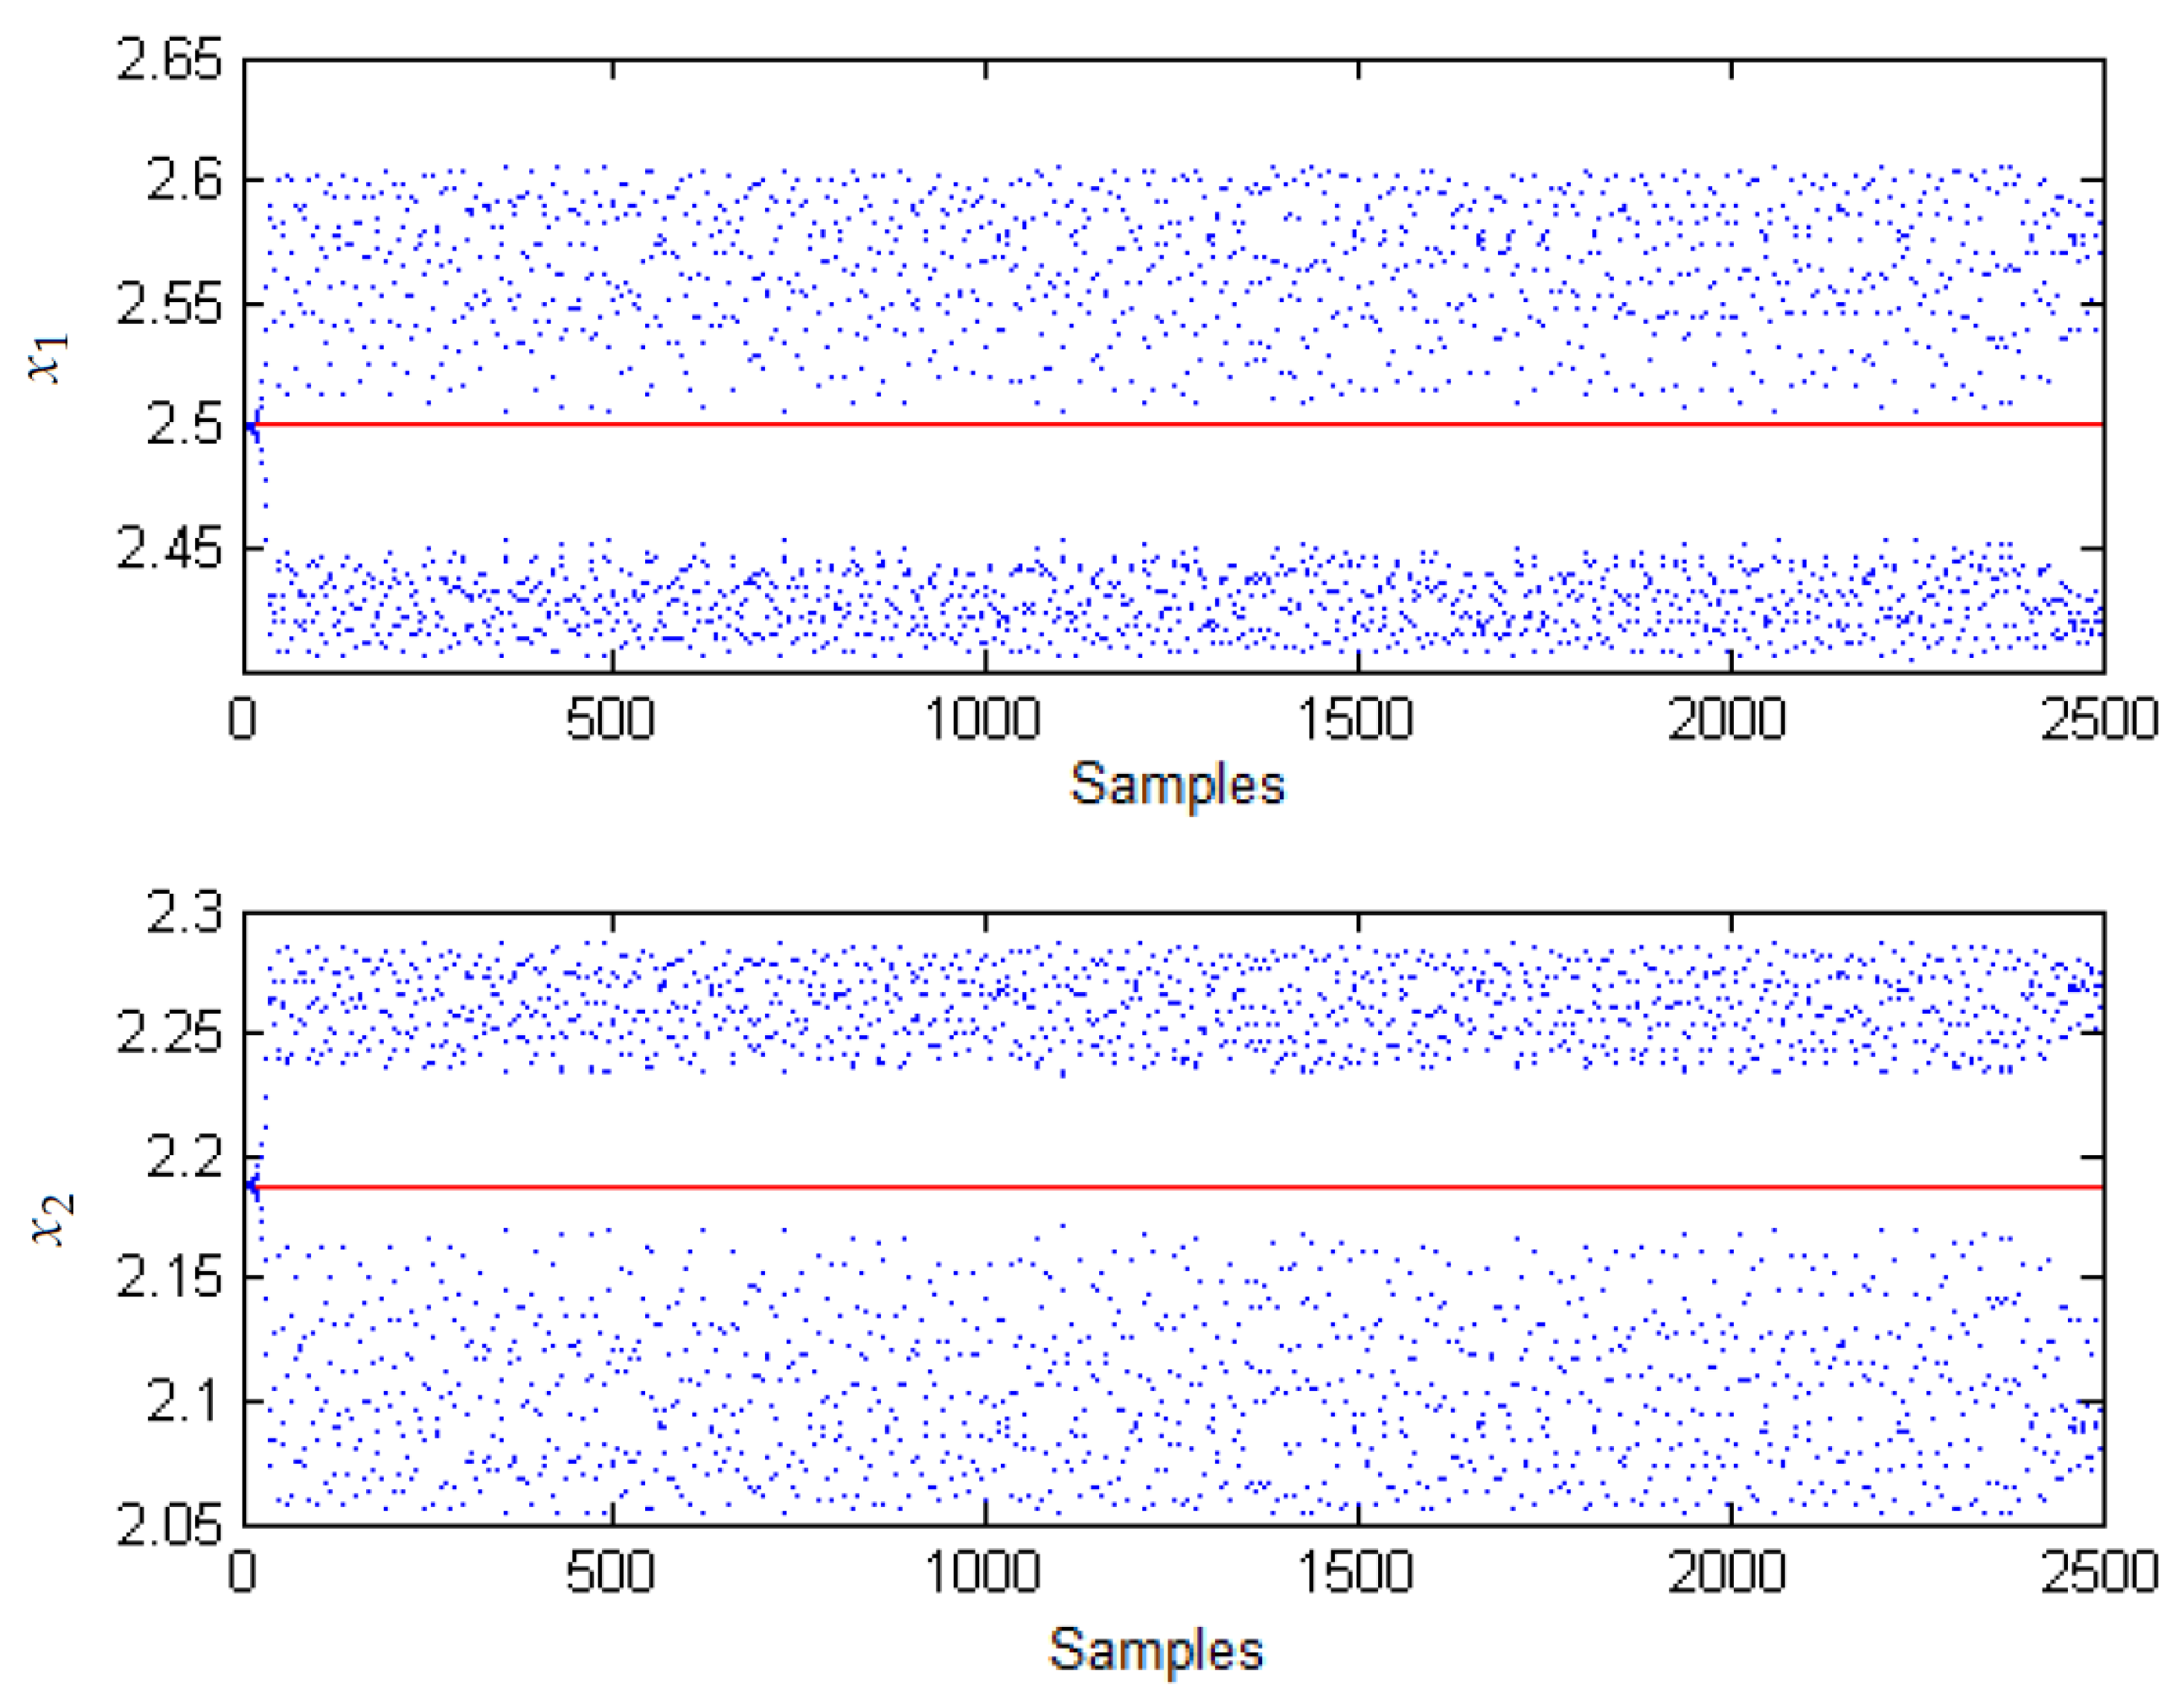
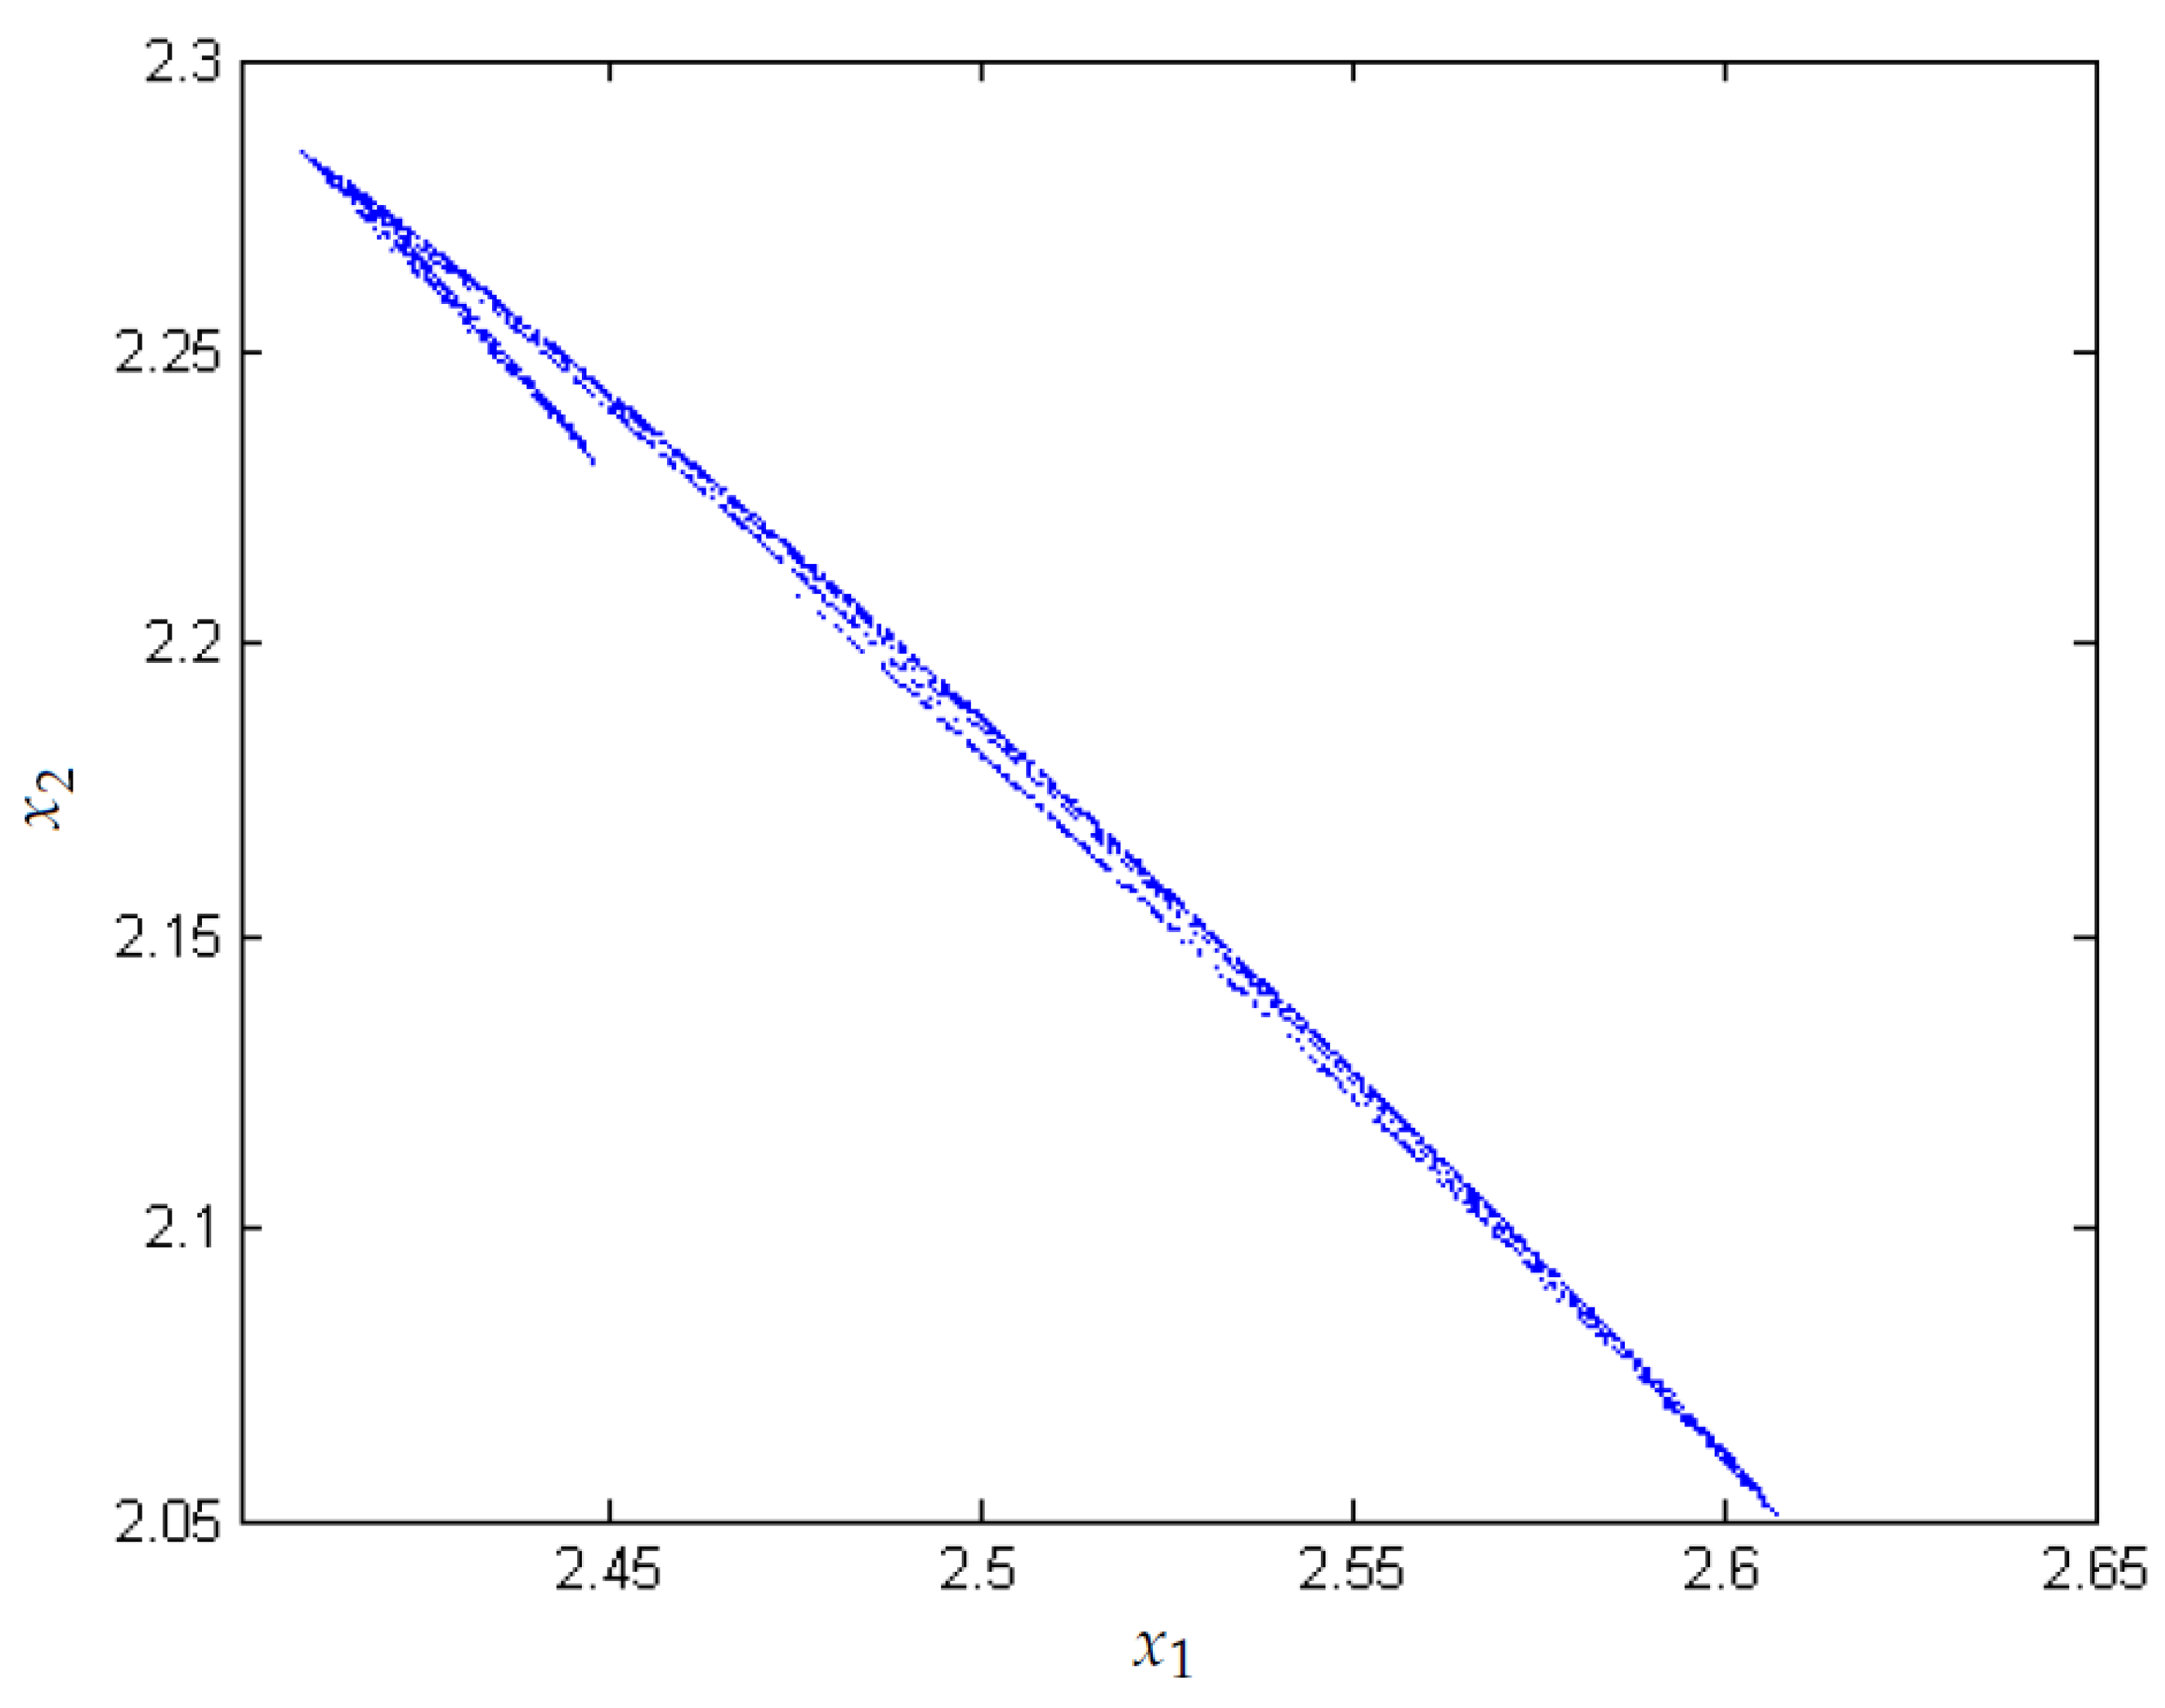
Figure 6 shows the evolution of the system in the state space when applying FPIC with N = 0.1 , and Figure 7 shows evolution of the duty cycle applying FPIC with N = 0.1 .
Figure 8 considers the regulation capacity improvement when the FPIC is applied.
From Figure 9 and Figure 10, the area where the system exhibits chaotic behavior has considerably decreased for N = 0.2 . In addition, the 1 T -periodic orbit is stable over a larger range of the parameter k 1 .
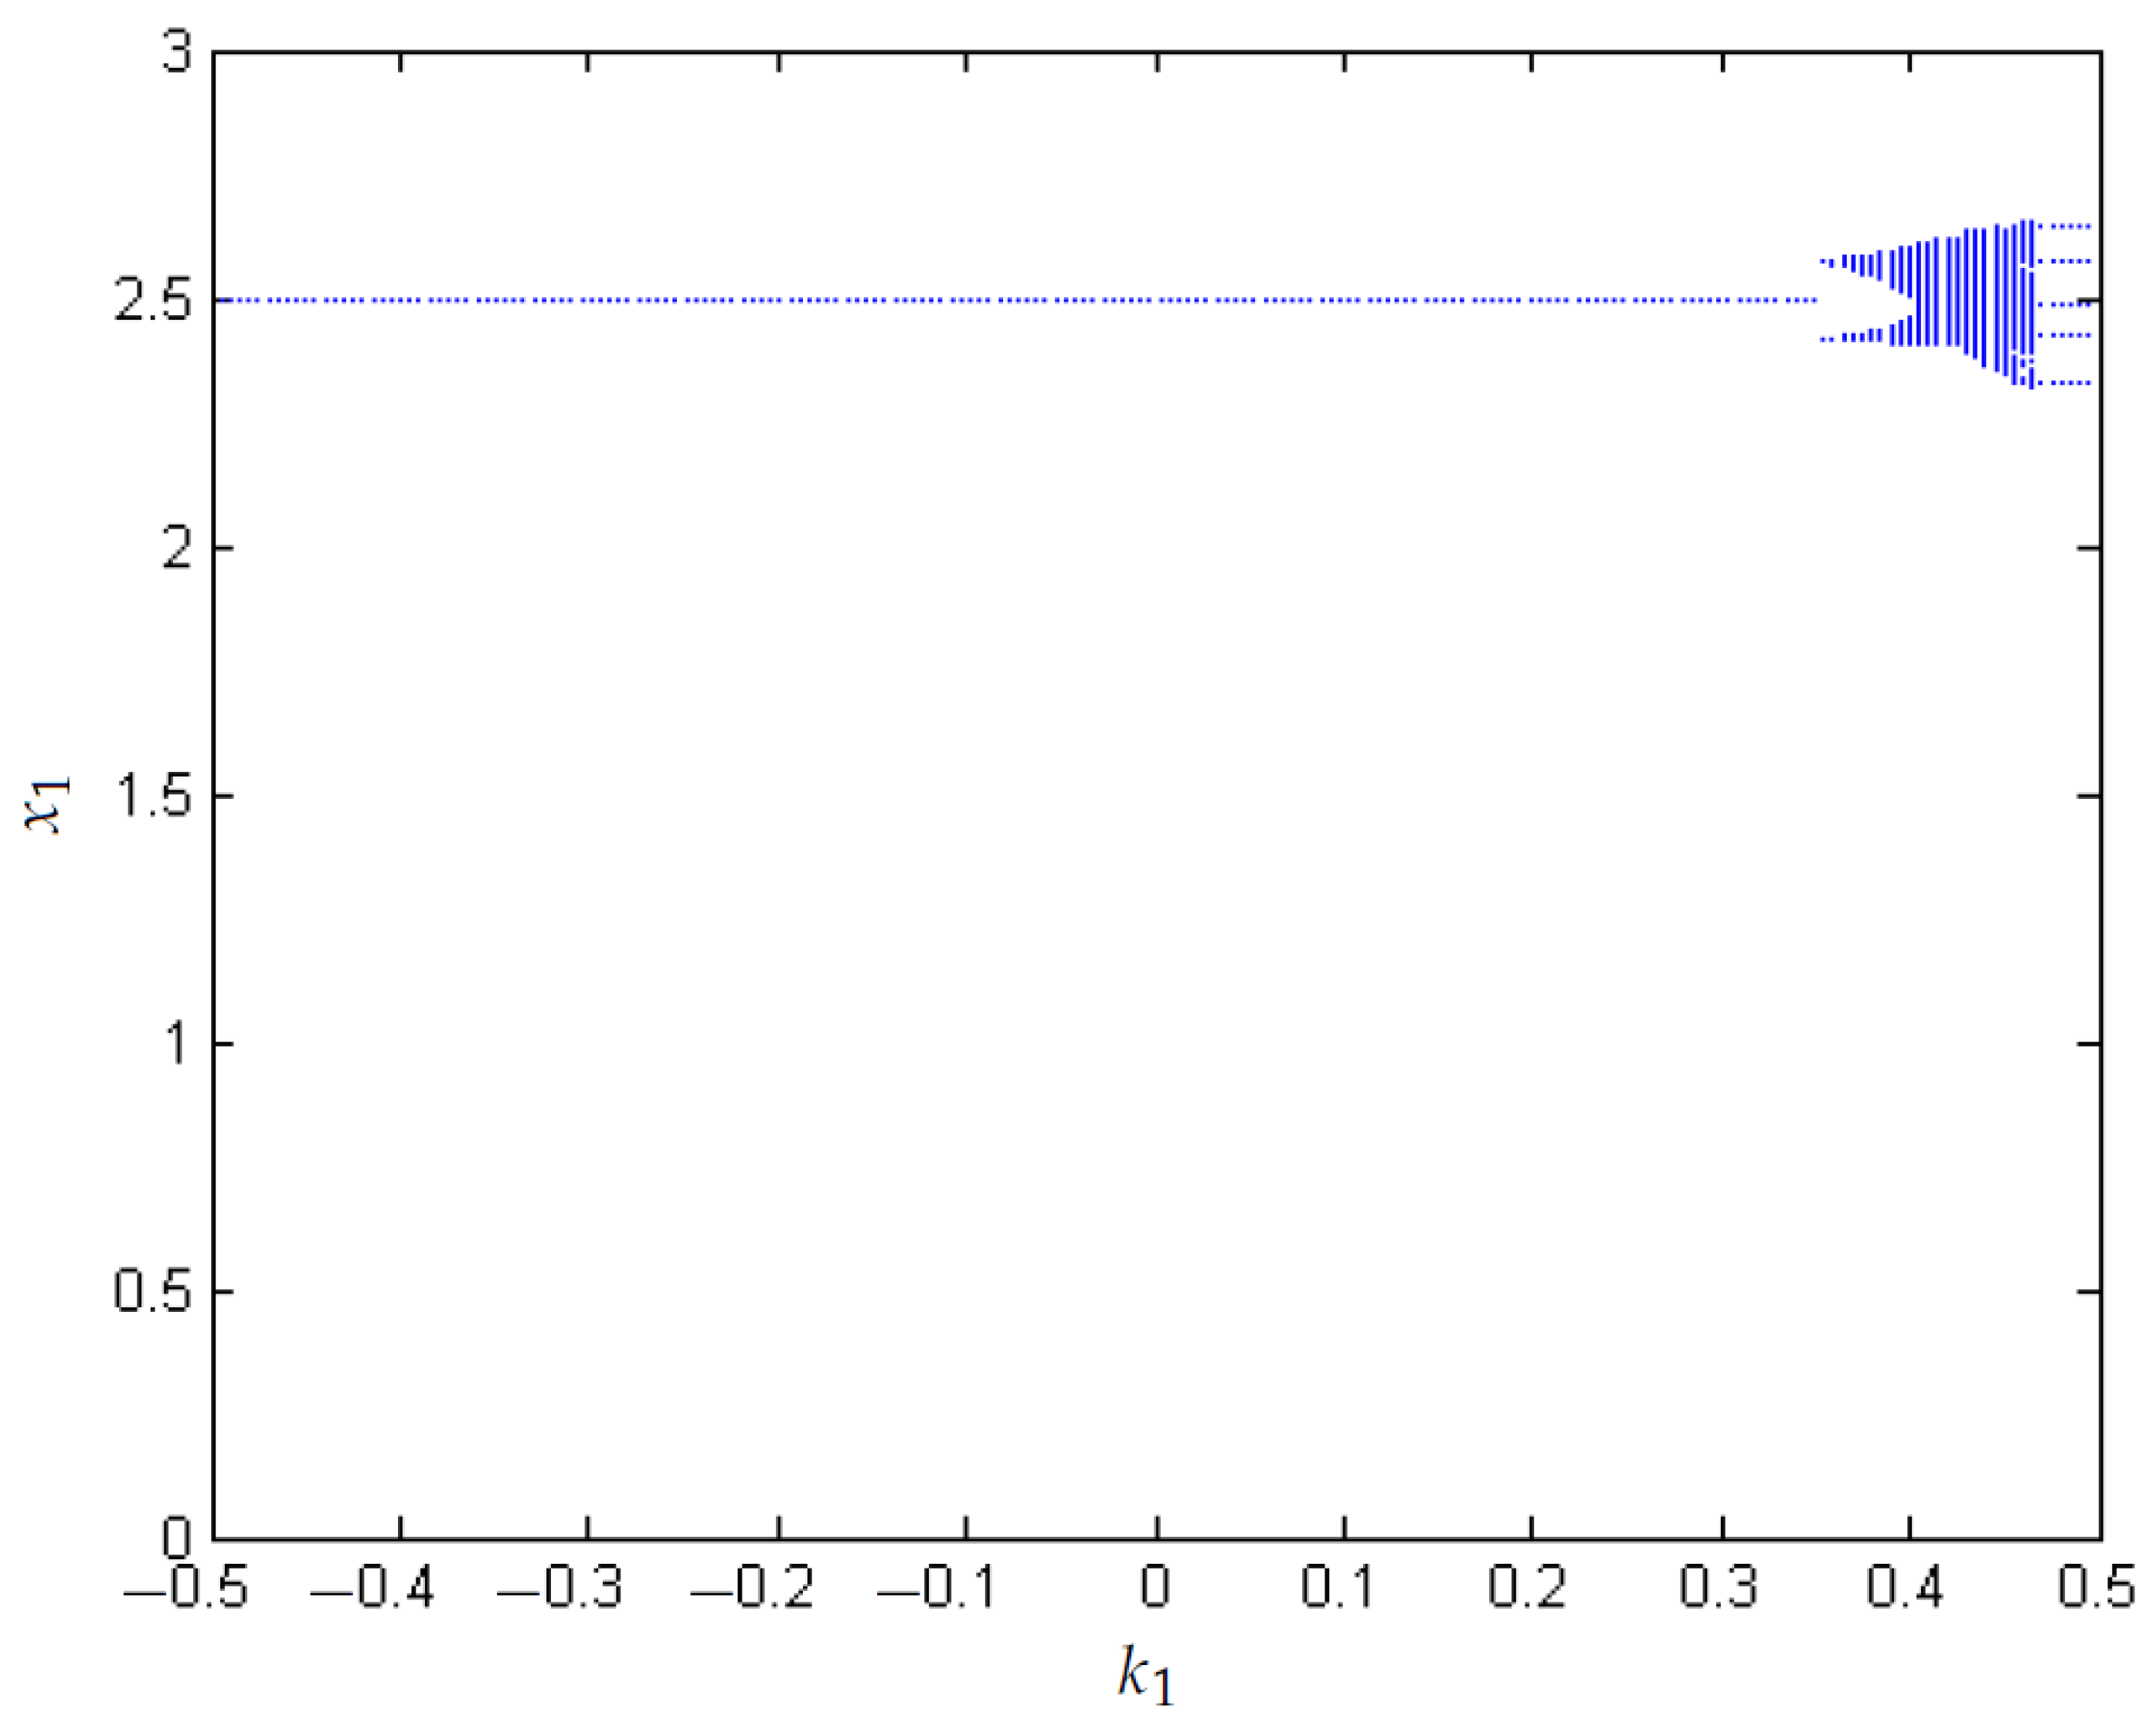
Figure 11 and Figure 12 show that the zone in which the system presented chaos with k 2 = 0.5 has practically disappeared.
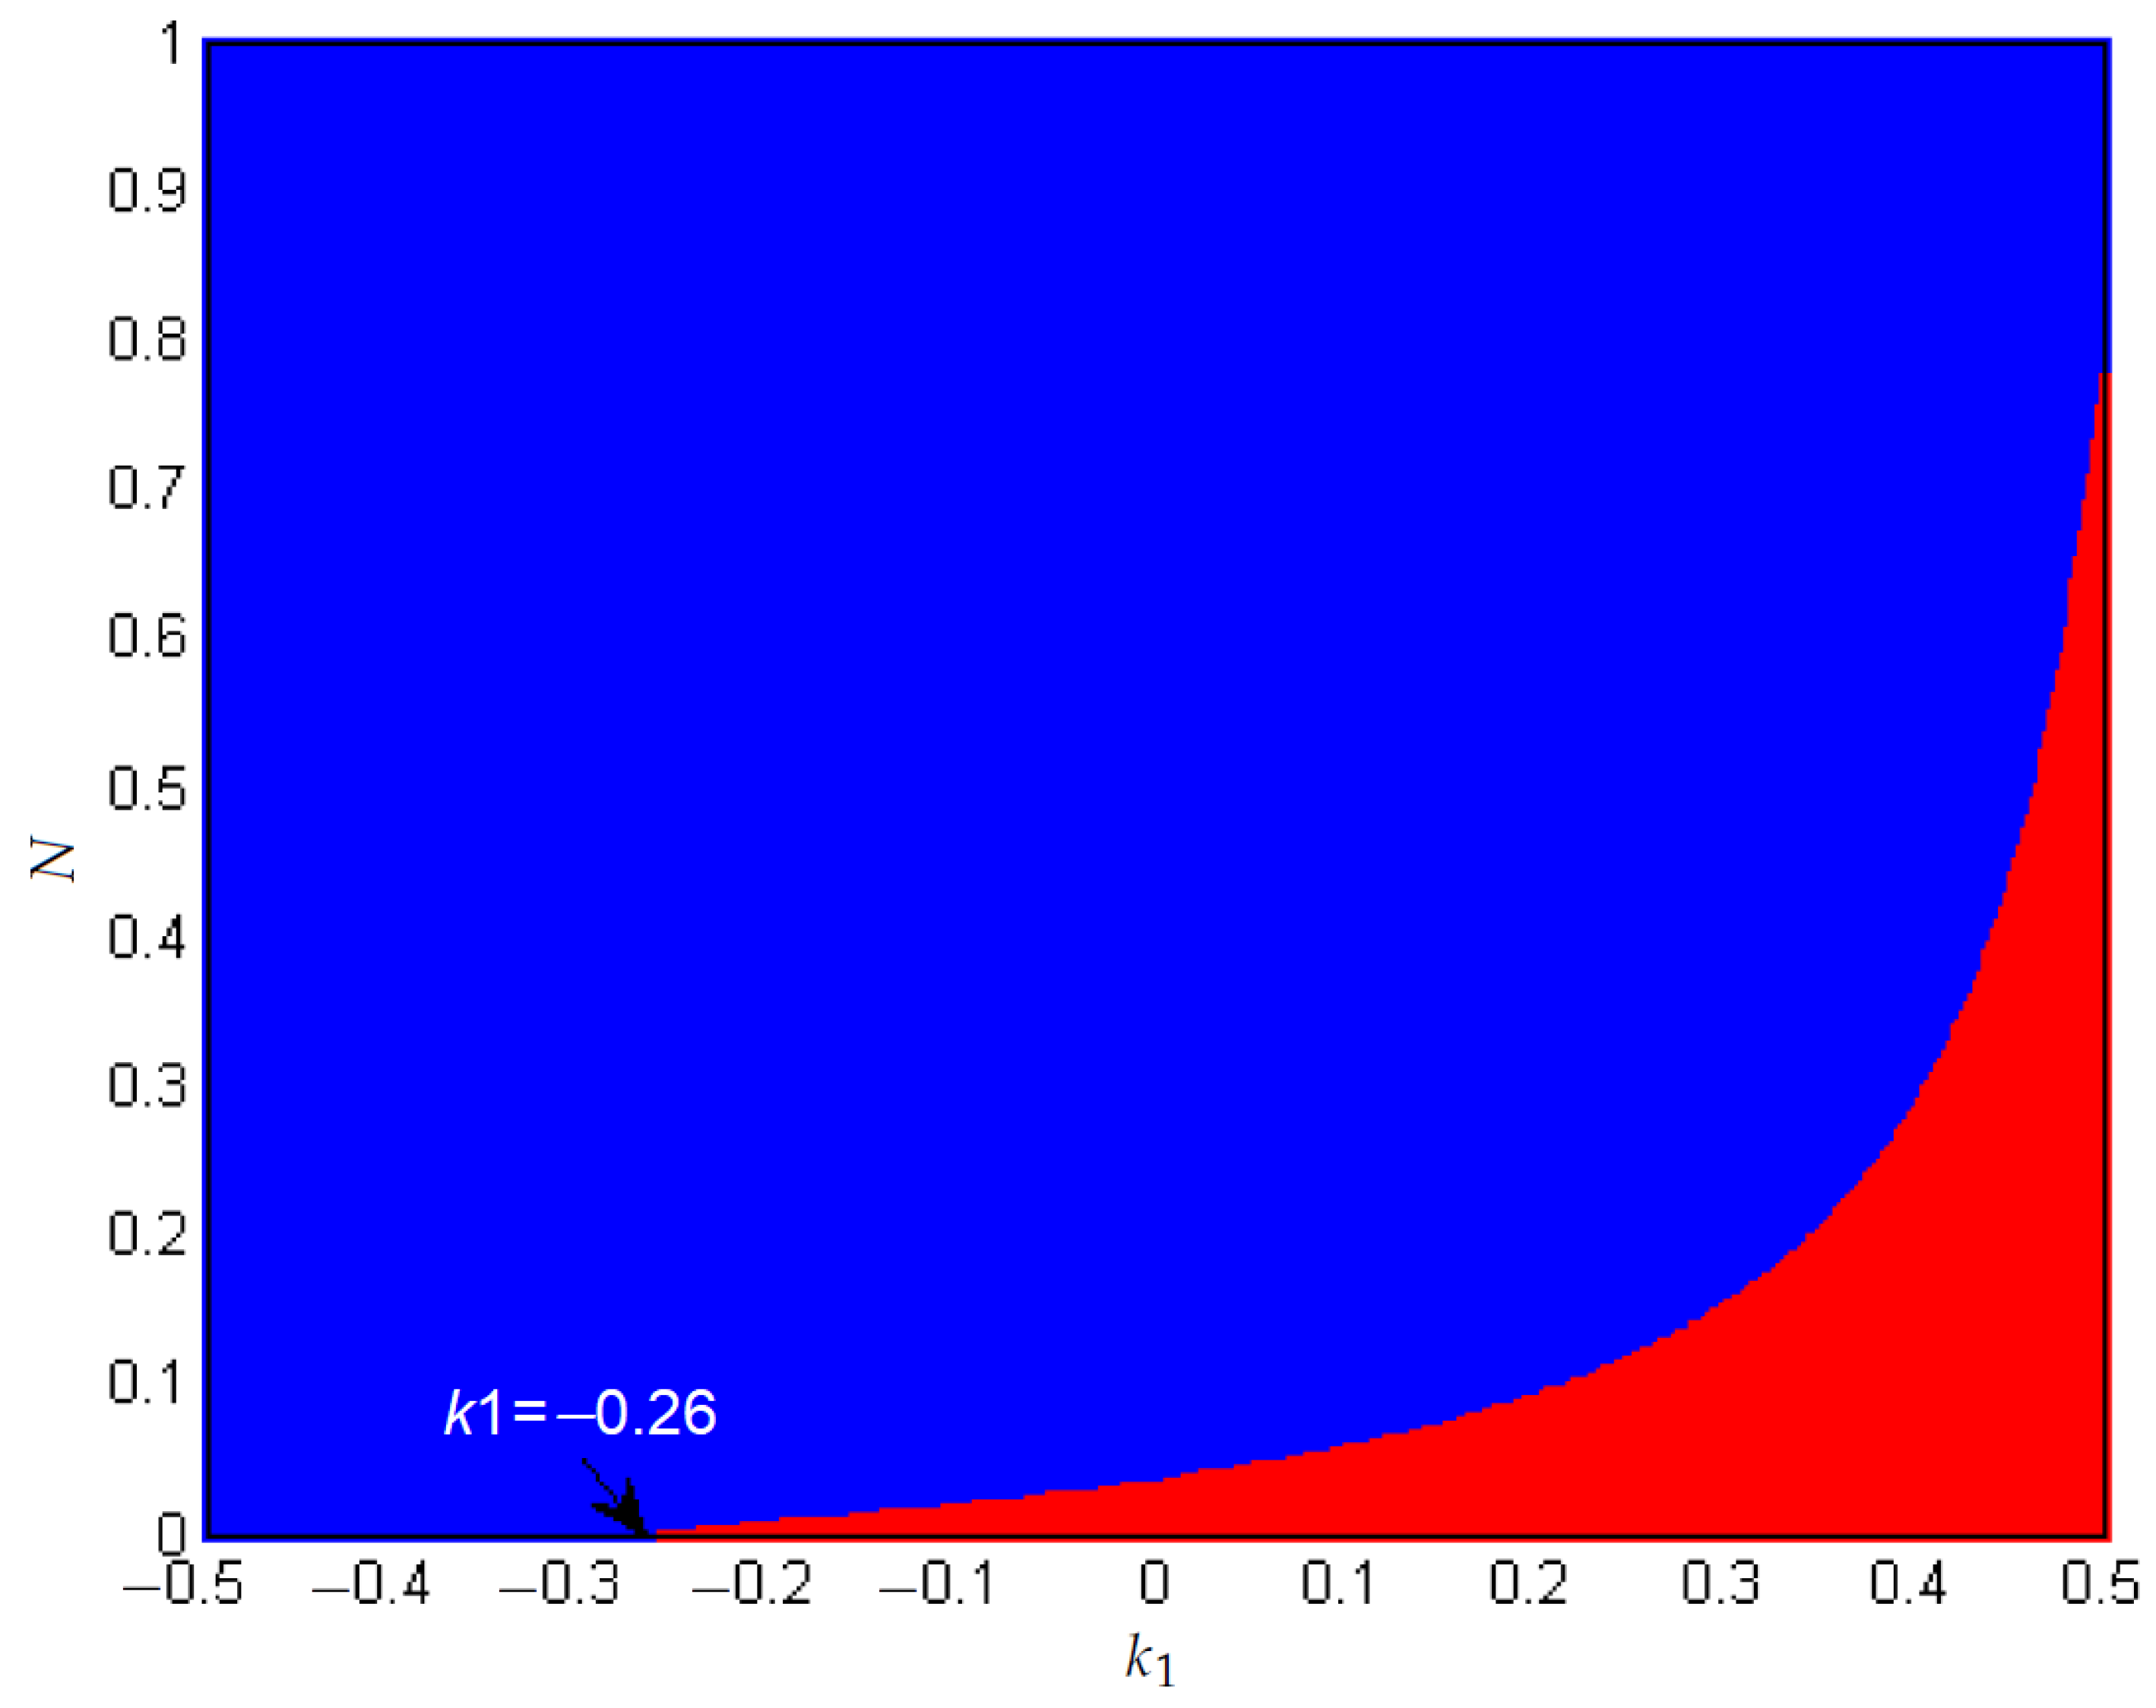
Figure 13 gives the bounds at which the FPIC technique controls the chaos of the system. As expected, for N = 0 the FPIC technique has not started to act. From this value, the FPIC technique begins to control the chaos. The blue color corresponds to areas where chaos is controlled, and the red to the presence of chaos. It is observed that for an approximate value of N = 0.7735 , the chaos has already been controlled.

3.3. FPIC Control with Time Delay

Once, the presence of chaos in the boost converter is found, the FPIC technique is applied with a time delay to evaluate the capacity of controlling chaos. Some simulations are performed in this research as follows. Figure 14 shows the variation of the Lyapunov exponents as a function of the parameter k 1 , when a time delay is considered and the FPIC control is implemented.
It is observed that by increasing the control constant N, the range of values of the parameter k 1 in which there are positive Lyapunov exponents increases. For example, if N = 0.1 positive Lyapunov exponents are obtained for k 1 [ 0.2406 , 0.3844 ] ; if N = 0.3 , positive Lyapunov exponents are obtained for k 1 [ 0.3101 , 0.389 ] , if N = 0.6 positive Lyapunov exponents are obtained for k 1 [ 0.3575 , 0.3791 ] , and if N = 0.8 positive Lyapunov exponents are obtained for k 1 [ 0.3535 , 0.3895 ] .
The result above shows that the variability range of k 1 is lost in which the 1 T -periodic orbit is stable. Consequently, when applying the FPIC technique to the boost converter with time delay, satisfactory results are not obtained in terms of the stability of unstable orbits.

3.4. Control of Chaos

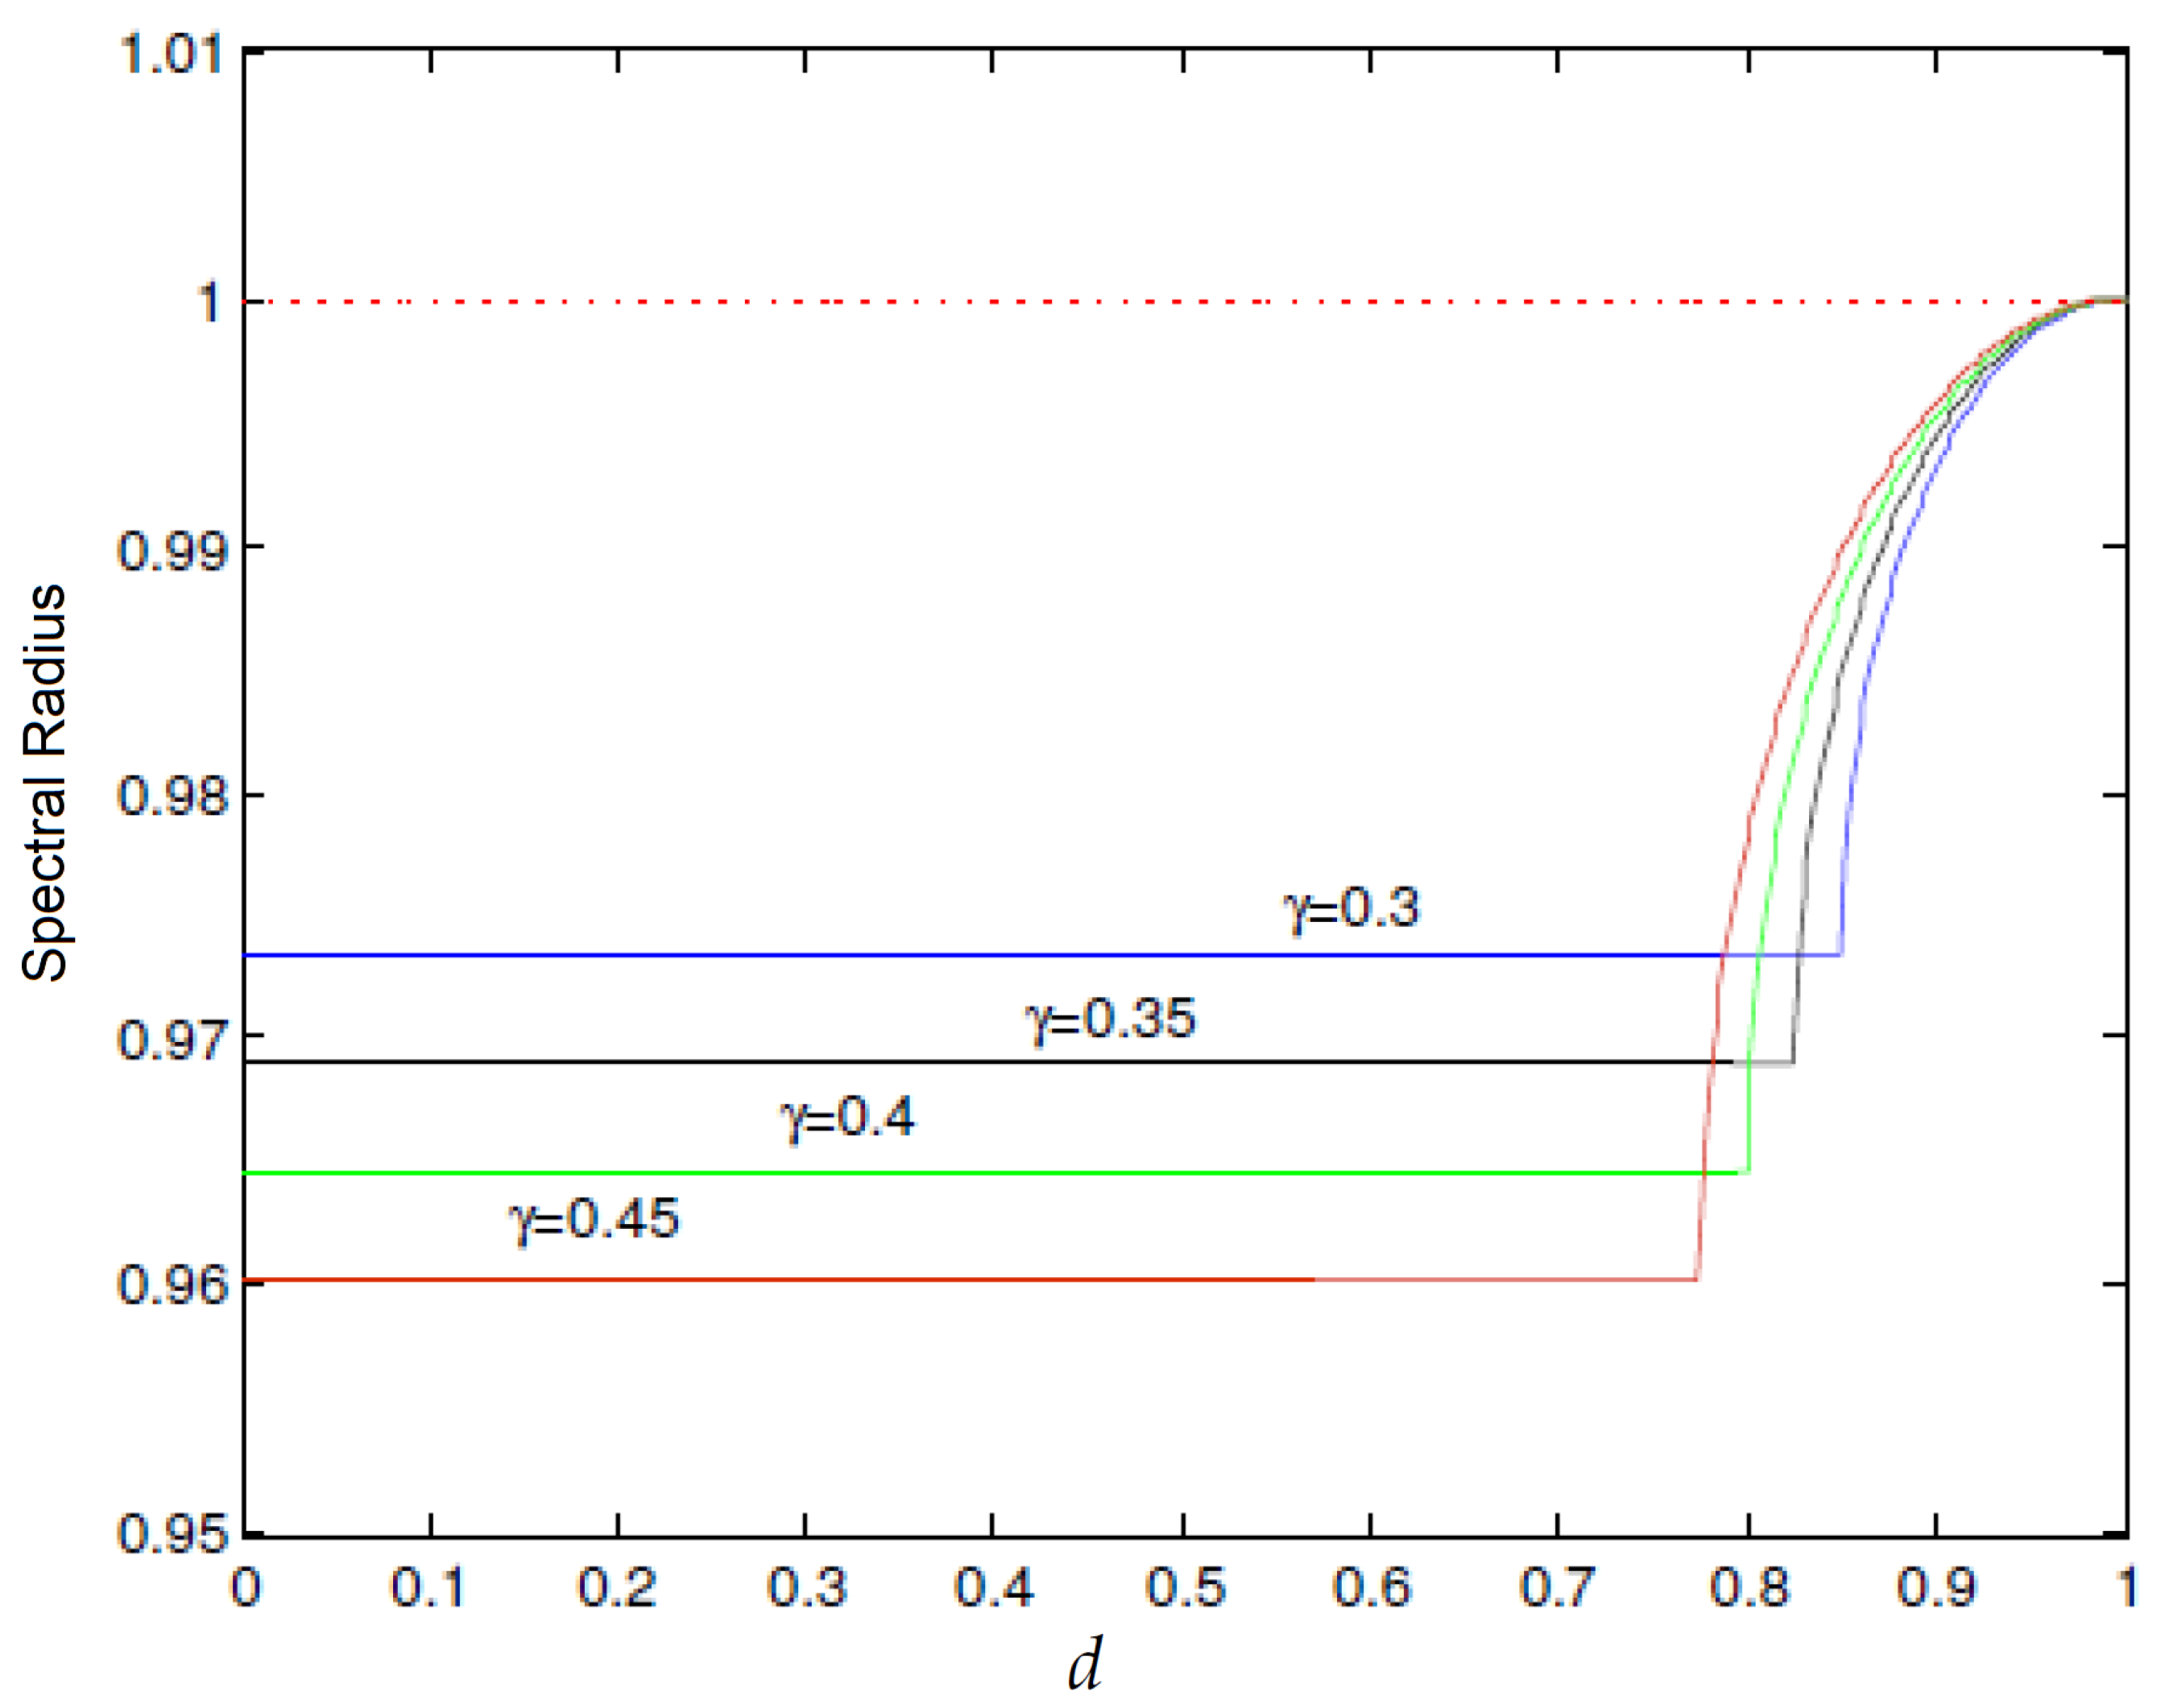
Figure 15 shows the variation of the spectral radius of the matrix P x n for various values of γ .
Figure 16 and Figure 17 correspond to the evolution of voltage and duty cycle as a function of k 1 , choosing η = 0.1 . The area where the chaotic regime occurs has increased, suggesting that negative values for the feedback factor η should be chosen.
In Figure 18 and Figure 19, η = 0.1 has been chosen. The area where the system operates in a chaotic regime has been reduced.
In Figure 20 and Figure 21, η = 0.2 has been chosen and a considerable decrease in the area where chaos is present can be seen.
Figure 22 gives the bounds for the constant η , where the chaos control is conducted. Once there is a maximum value k 1 of chaos control (corresponding to an approximate value of η = 0.24 ), the area where the TDAS technique can control the chaos begins to decrease. From an implementation standpoint, this is an inconvenience due to the choice of the zone where the control of chaos is performed. This does not happen with the FPIC technique because, as Figure 13 shows, starting at N = 0.7735 , the chaos is already controlled.
Figure 23, Figure 24 and Figure 25 show the evolution of the system when η = 0.1 is chosen as feedback constant. To perform this, the same initial conditions with which the chaotic attractor of Figure 6 was obtained. It is observed that for this value of η the attractor has not yet been fragmented into two pieces, as it happened with the FPIC technique. The duty cycle appears in a chaotic regime. Compared with Figure 8, the system regulation is very similar applying TDAS and FPIC. However, from this same figure, the area where the system operates in a chaotic regime is smaller when the FPIC control is applied.
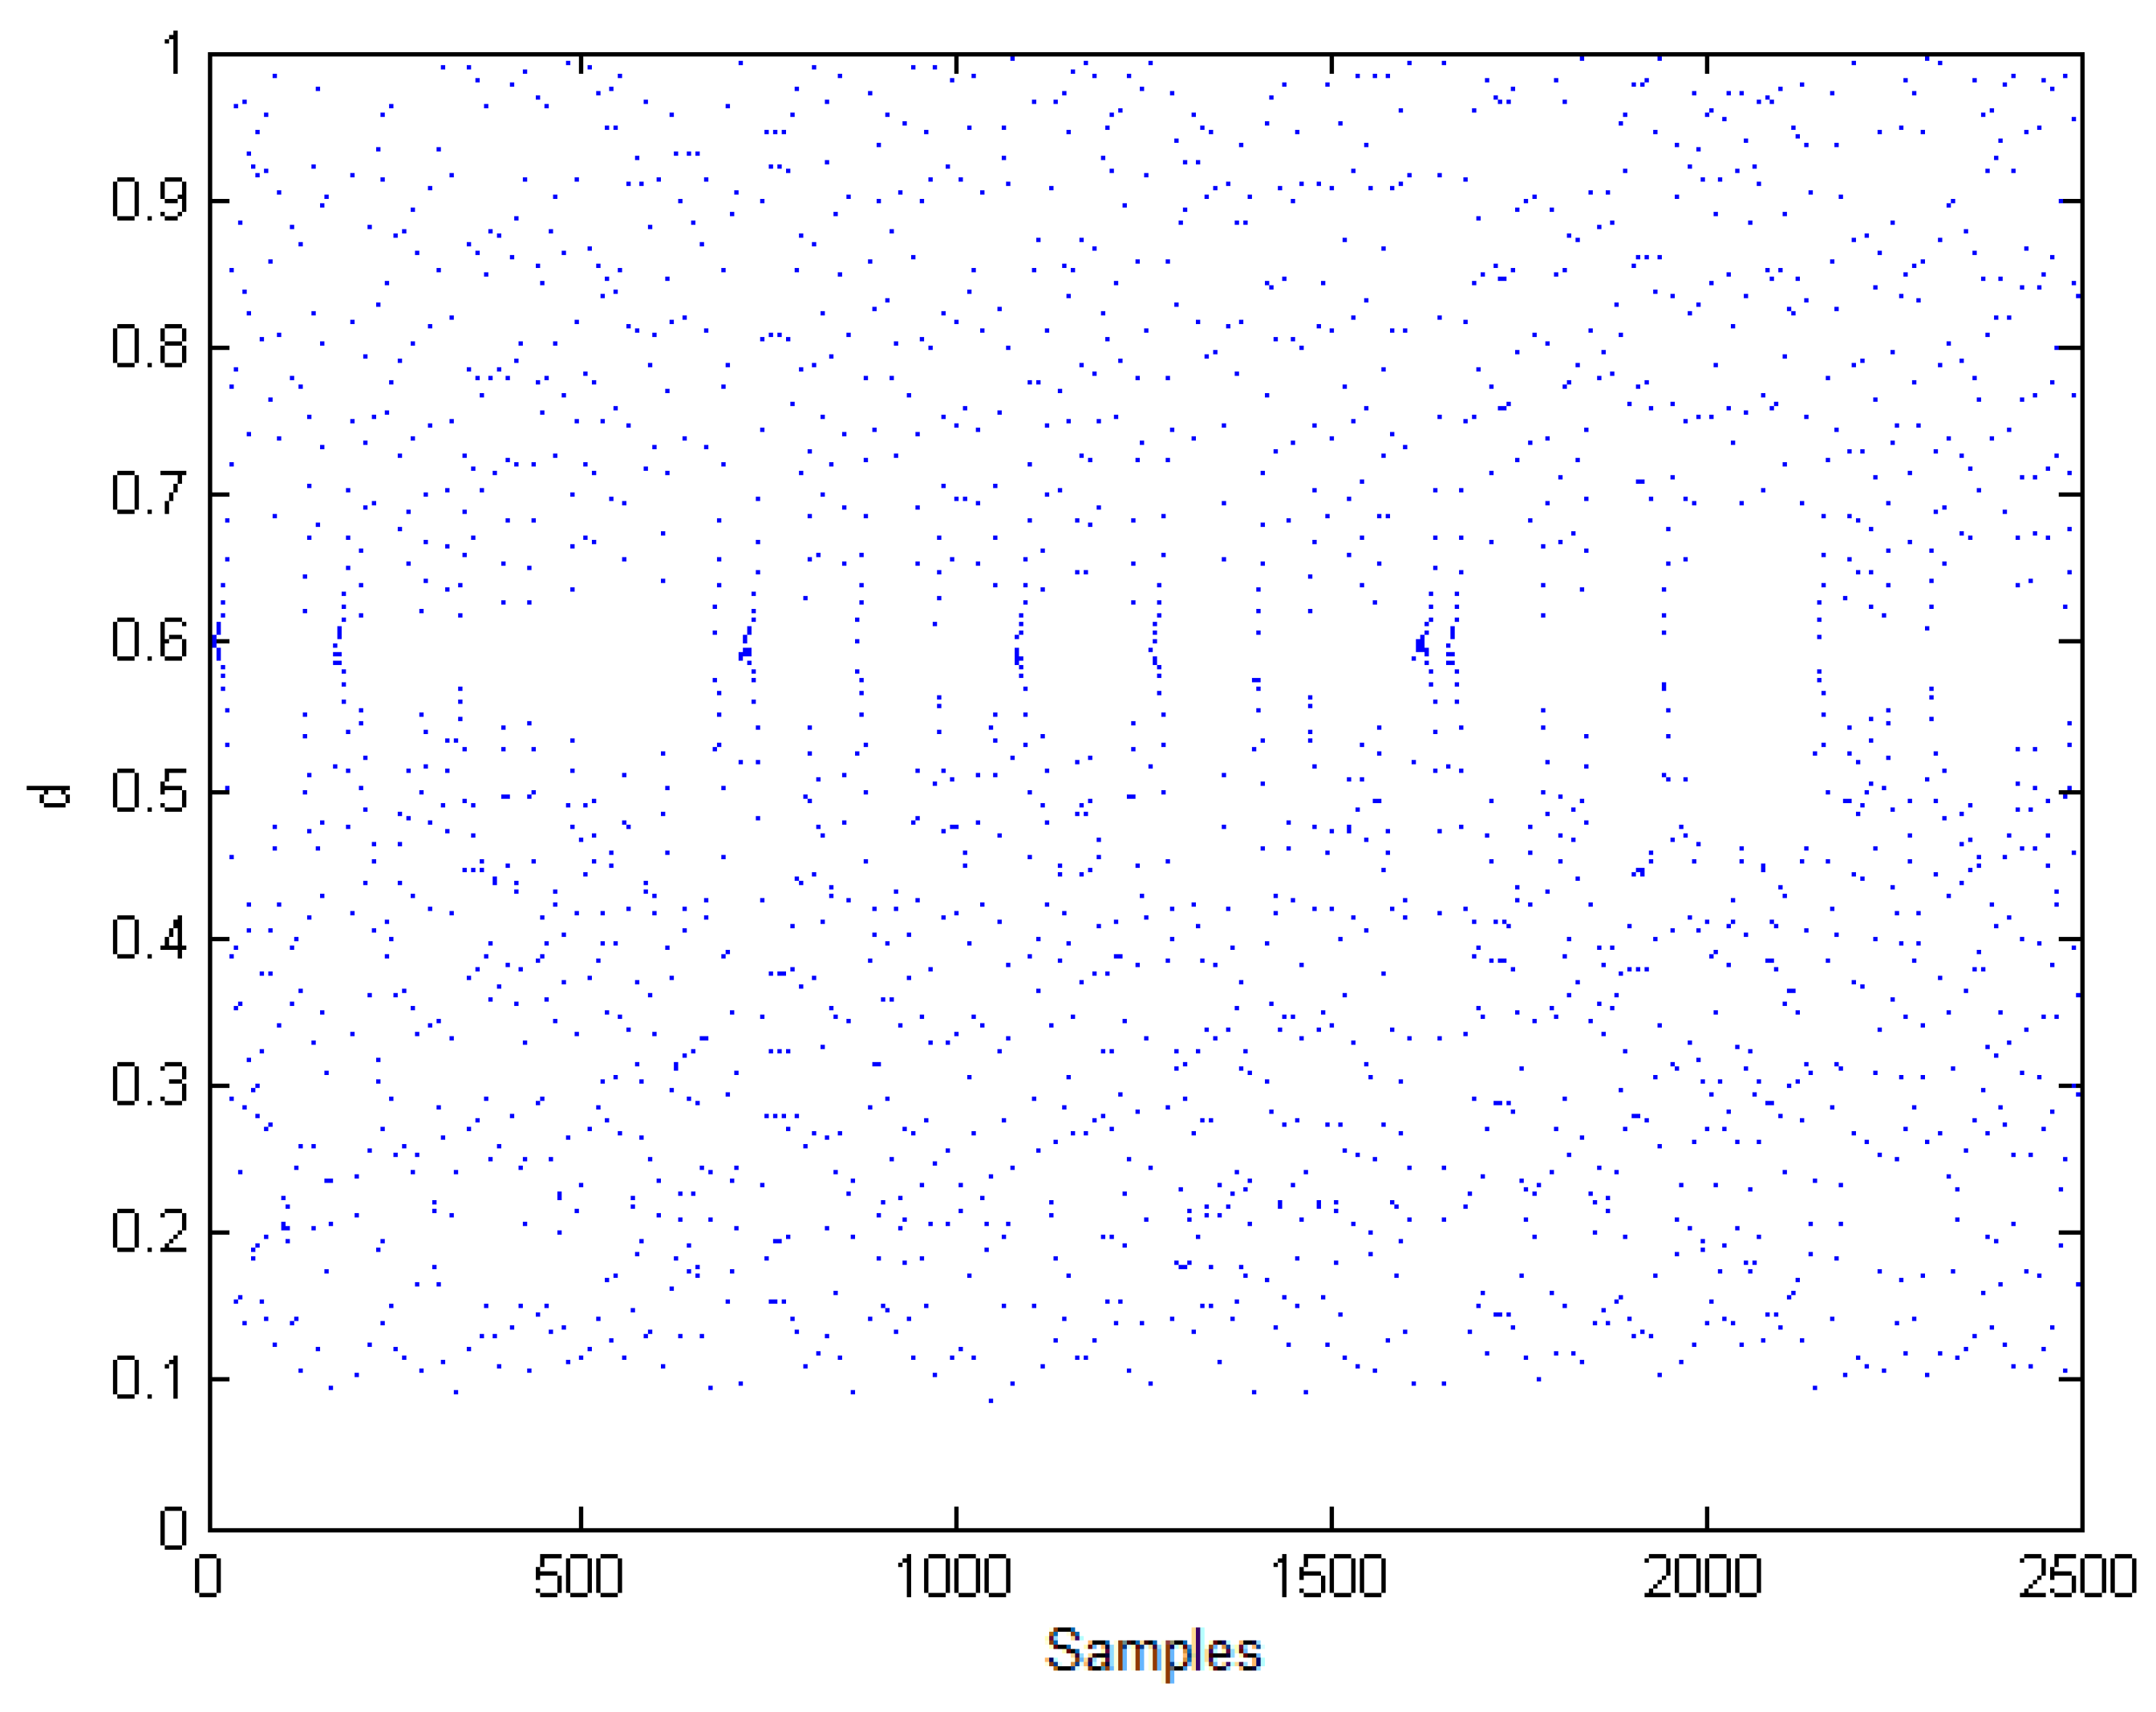
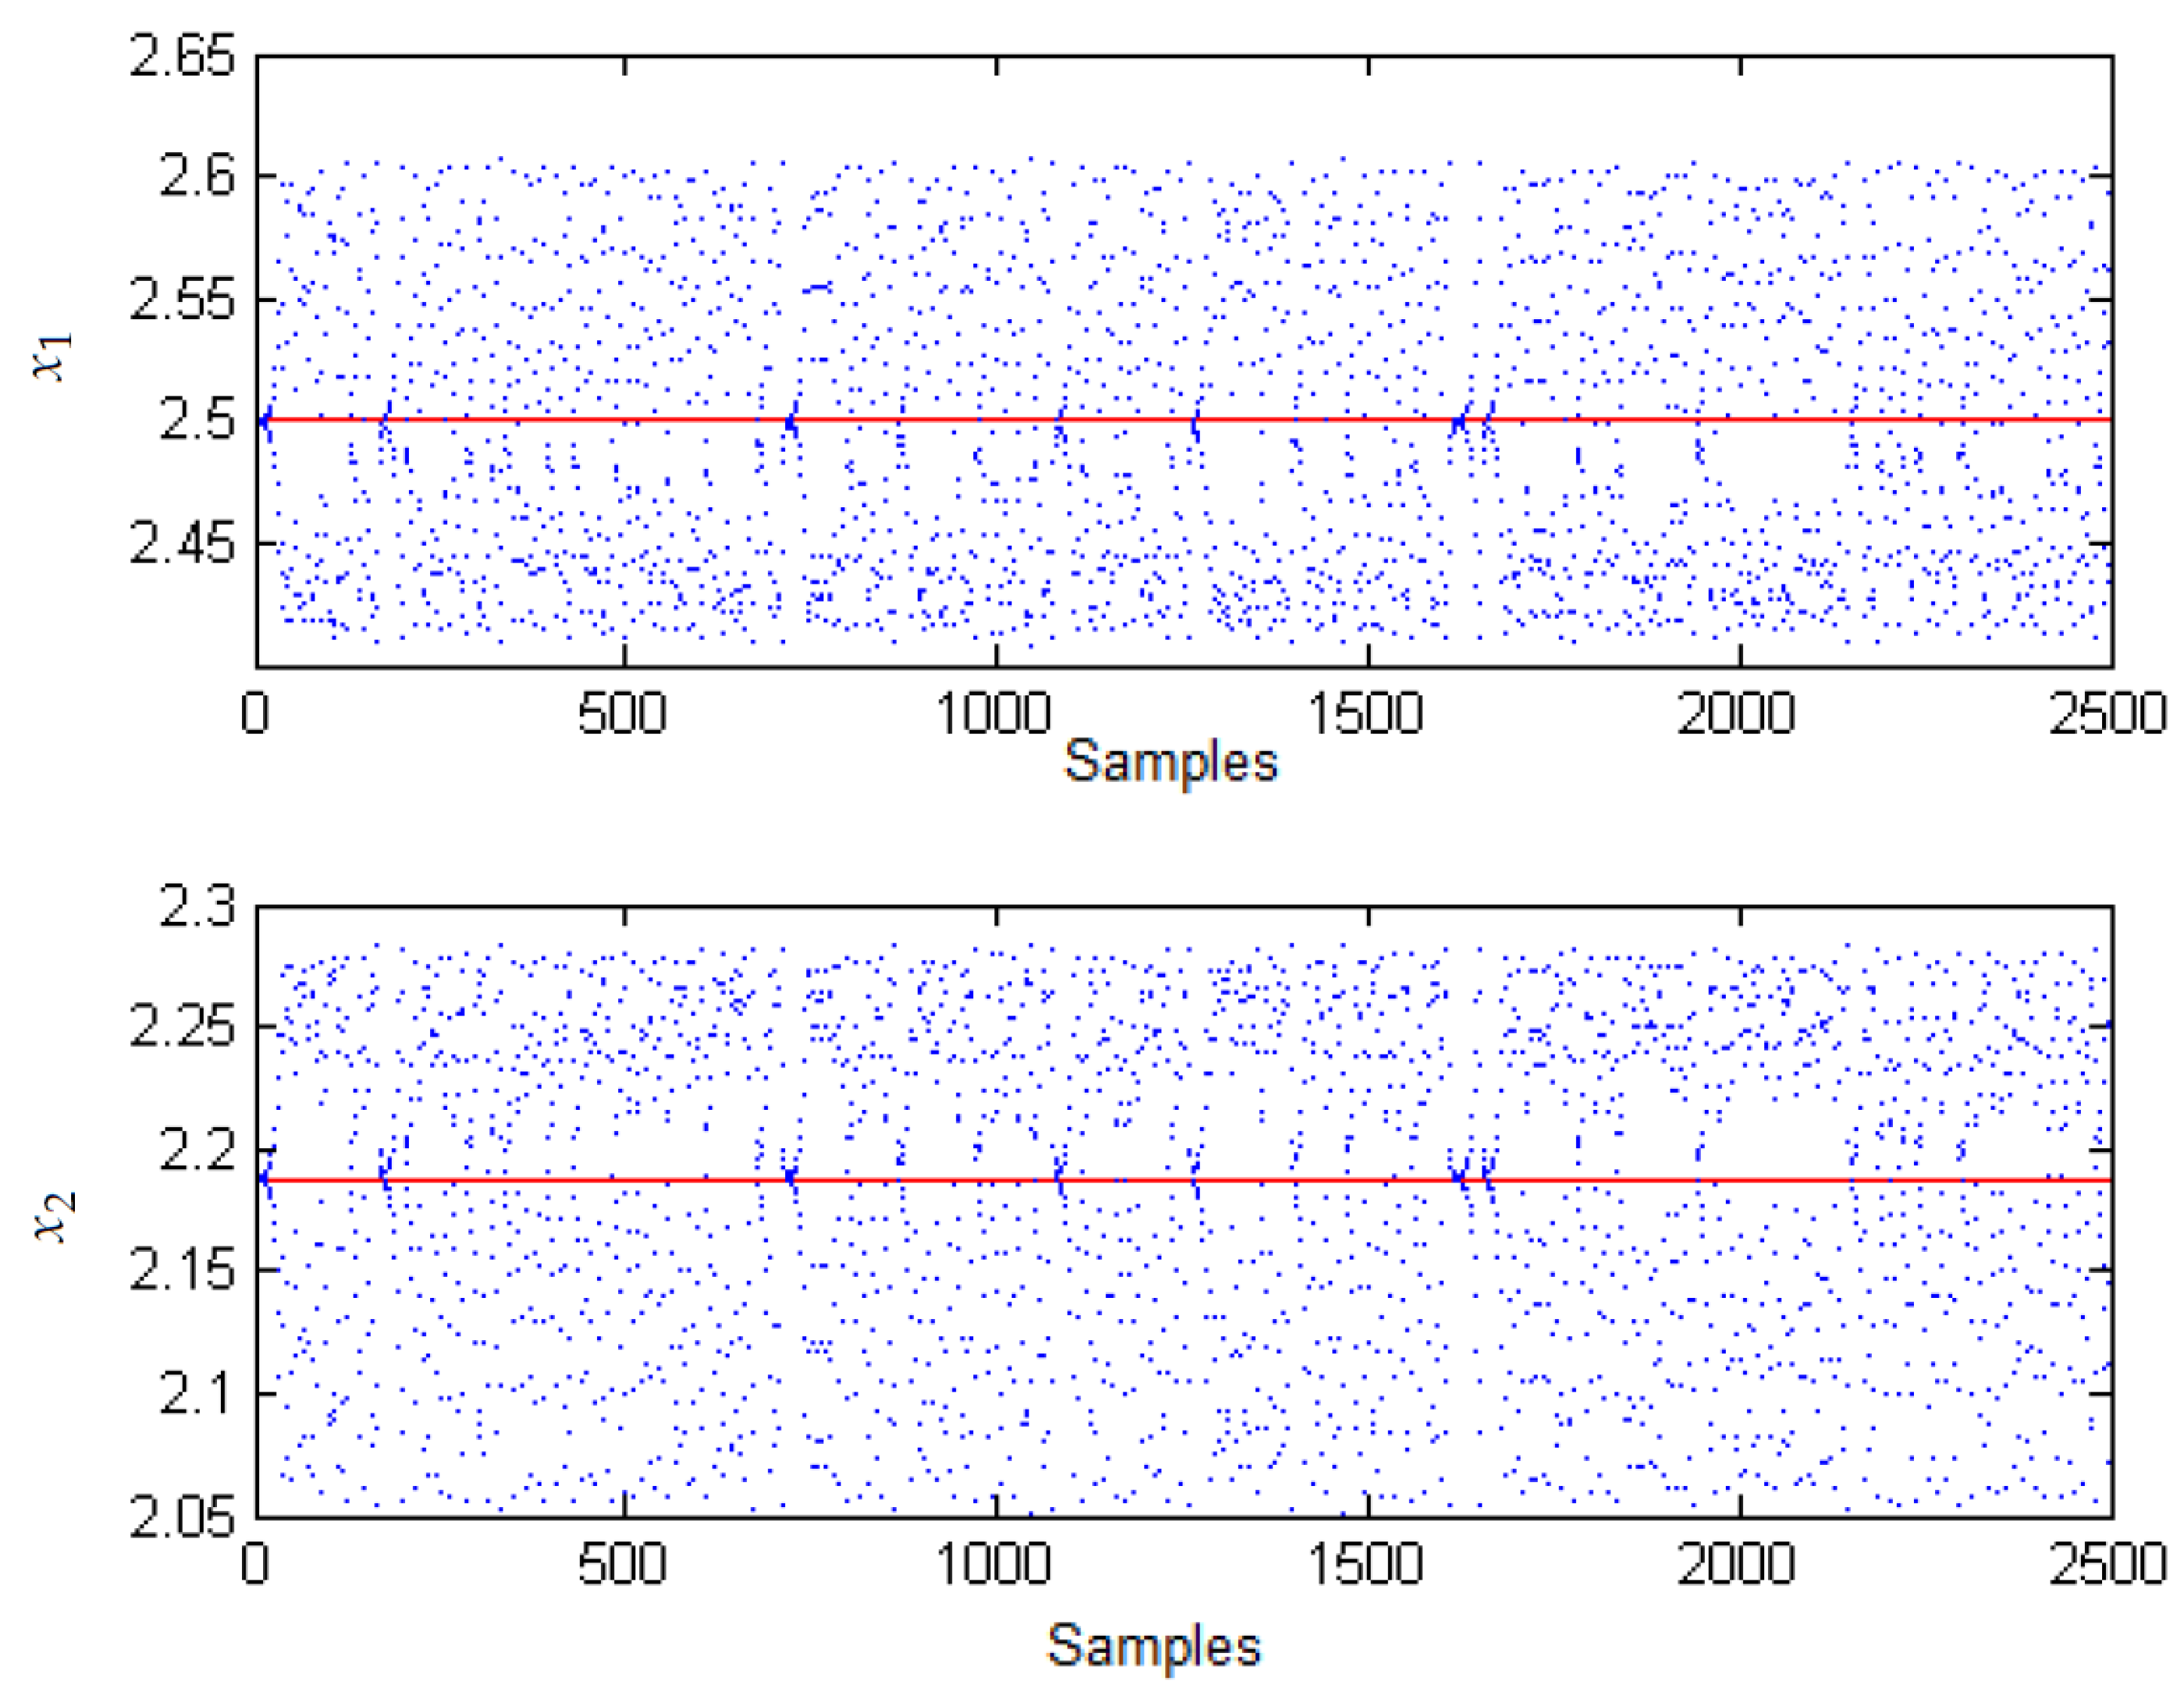
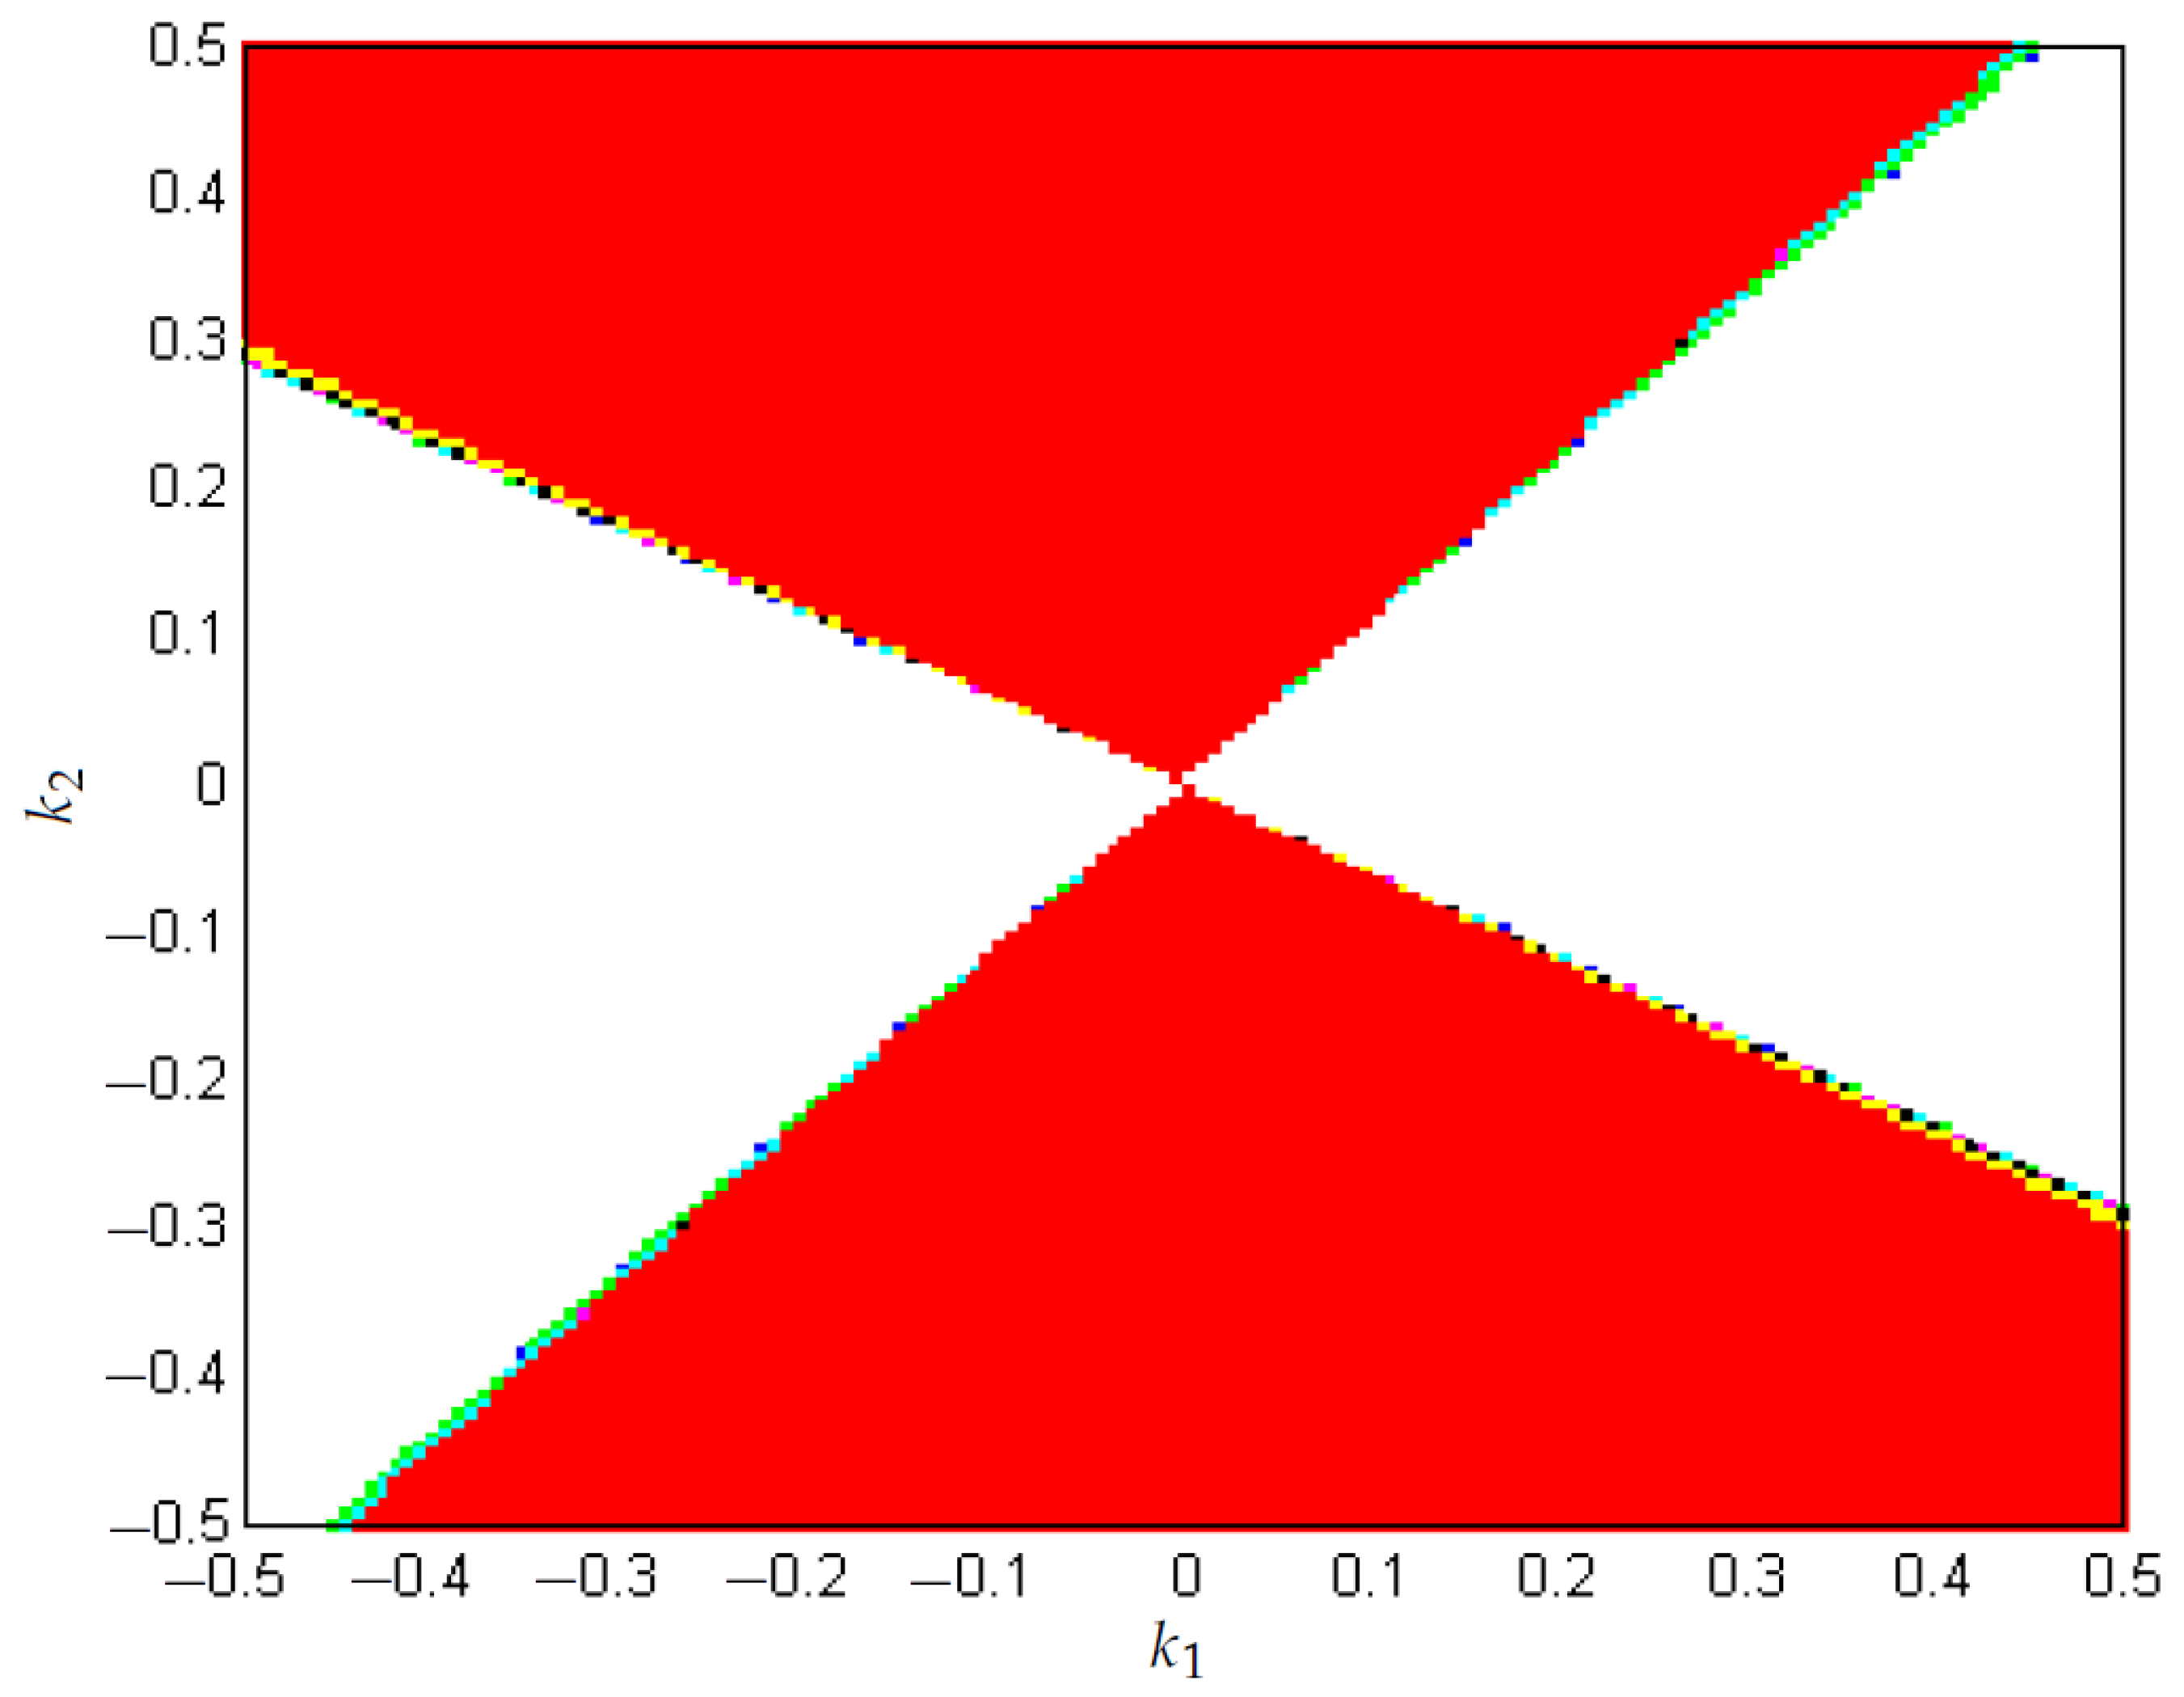
Figure 26 and Figure 27 correspond to biparametric diagrams where zones are represented in which the boost converter regulates when applying the FPIC and TDAS techniques, respectively. White corresponds to regulation with an error greater than 7 % , blue to the regulation of 7 % , green to the regulation of 6 % , cyan to the regulation of 5 % , magenta at 4 % regulation, black at 3 % regulation, yellow at 2 % regulation, and red at 1 % regulation. For Figure 26 a control constant N = 0.2 was chosen and in Figure 27 η = 0.2 was chosen. It is observed that the area where the TDAS technique regulates 1 % is greater. However, the areas where the FPIC technique regulates 7 % , 6 % , and 5 % are greater than with the TDAS technique. The zones where both techniques regulate 2 % , 3 % , and 4 % are almost the same.

4. Conclusions

This paper presented an analysis and control of chaos in the boost converter controlled with ZAD, FPIC, and TDAS. The existence of chaos is demonstrated numerically by calculating the Lyapunov exponents. Then, the FPIC and TDAS techniques are used to control the chaos implemented in the center pulse width modulation. The results show that both techniques are efficient to control the chaos. However, the FPIC technique presented better regulation of the system than the TDAS technique. In addition, the FPIC technique allows a greater range of variability of the parameter k 1 in which the 1 T -periodic orbit is stable. When applying the FPIC technique to the boost converter with time delay, satisfactory results were not obtained in terms of stabilization of unstable orbits. The validity of a new chaos control technique was proposed and analytically demonstrated, which does not require measurement of state variables or prior knowledge of periodic orbits. The results on stability were corroborated by calculating the Lyapunov exponents.

Author Contributions

Conceptualization, investigation, methodology, and software, S.C.T. Formal analysis, writing–review, and editing, S.C.T., J.E.C.-B., and F.E.H. All authors have read and agreed to the published version of the manuscript.

Funding

This work was supported by Universidad Nacional de Colombia in Medellín under project HERMES-55700.

Institutional Review Board Statement

Not applicable.

Informed Consent Statement

Not applicable.

Data Availability Statement

Not applicable.

Acknowledgments

The work of Simeón Casanova Trujillo was supported by Universidad Nacional de Colombia, Sede Manizales. The work of Fredy E. Hoyos and John E. Candelo-Becerra was supported by Universidad Nacional de Colombia, Sede Medellín.

Conflicts of Interest

The authors declare no conflict of interest.

References

  1. Forouzesh, M.; Shen, Y.; Yari, K.; Siwakoti, Y.P.; Blaabjerg, F. High-Efficiency High Step-Up DC–DC Converter With Dual Coupled Inductors for Grid-Connected Photovoltaic Systems. IEEE Trans. Power Electron. 2018, 33, 5967–5982. [Google Scholar] [CrossRef]
  2. Buso, P.M.S. Digital Control in Power Electronics; Morgan & Claypool Publishers: San Rafael, CA, USA, 2015. [Google Scholar]
  3. Mohan, N. Power Electronics: A First Course; Wiley: Hoboken, NJ, USA, 2011; p. 288. [Google Scholar]
  4. Mohan, N. Advanced Electric Drives: Analysis, Control, and Modeling using MATLAB/Simulink; John Wiley & Sons, Inc.: Hoboken, NJ, USA, 2014; p. 208. [Google Scholar]
  5. Revelo-Fuelagán, J.; Candelo-Becerra, J.E.; Hoyos, F.E. Power Factor Correction of Compact Fluorescent and Tubular LED Lamps by Boost Converter with Hysteretic Control. J. Daylighting 2020, 7, 73–83. [Google Scholar] [CrossRef]
  6. Amador, A.; Casanova, S.; Granada, H.A.; Olivar, G.; Hurtado, J. Codimension-Two Big-Bang Bifurcation in a ZAD-Controlled Boost DC-DC Converter. Int. J. Bifurc. Chaos 2014, 24, 1450150. [Google Scholar] [CrossRef]
  7. Fossas, E.; Olivar, G. Study of chaos in the buck converter. IEEE Trans. Circuits Syst. I Fundam. Theory Appl. 1996, 43, 13–25. [Google Scholar] [CrossRef] [Green Version]
  8. Toribio, E.; El Aroudi, A.; Olivar, G.; Benadero, L. Numerical and experimental study of the region of period-one operation of a PWM boost converter. IEEE Trans. Power Electron. 2000, 15, 1163–1171. [Google Scholar] [CrossRef]
  9. Poddar, G.; Chakrabarty, K.; Banerjee, S. Experimental control of chaotic behavior of buck converter. IEEE Trans. Circuits Syst. I Fundam. Theory Appl. 1995, 42, 502–504. [Google Scholar] [CrossRef]
  10. di Bernardo, M.; Garefalo, F.; Glielmo, L.; Vasca, F. Switchings, bifurcations, and chaos in DC/DC converters. IEEE Trans. Circuits Syst. I Fundam. Theory Appl. 1998, 45, 133–141. [Google Scholar] [CrossRef]
  11. Munoz, J.; Osorio, G.; Angulo, F. Boost converter control with ZAD for power factor correction based on FPGA. In Proceedings of the 2013 Workshop on Power Electronics and Power Quality Applications (PEPQA). IEEE, Bogota, Colombia, 6–7 July 2013; pp. 1–5. [Google Scholar] [CrossRef]
  12. Angulo, F.; Burgos, J.; Olivar, G. Chaos stabilization with TDAS and FPIC in a buck converter controlled by lateral PWM and ZAD. In Proceedings of the 2007 Mediterranean Conference on Control & Automation. IEEE, Athens, Greece, 27–29 June 2007; pp. 1–6. [Google Scholar] [CrossRef]
  13. Aroudi, A.E.; Debbat, M.; Martinez-Salamero, L. Poincaré maps modeling and local orbital stability analysis of discontinuous piecewise affine periodically driven systems. Nonlinear Dyn. 2007, 50, 431–445. [Google Scholar] [CrossRef]
  14. Hoyos Velasco, F.E.; García, N.T.; Garcés Gómez, Y.A. Adaptive Control for Buck Power Converter Using Fixed Point Inducting Control and Zero Average Dynamics Strategies. Int. J. Bifurc. Chaos 2015, 25, 1550049. [Google Scholar] [CrossRef]
  15. Repecho, V.; Biel, D.; Ramos-Lara, R. Robust ZAD Sliding Mode Control for an 8-Phase Step-Down Converter. IEEE Trans. Power Electron. 2020, 35, 2222–2232. [Google Scholar] [CrossRef]
  16. Vergara Perez, D.D.C.; Trujillo, S.C.; Hoyos Velasco, F.E. Period Addition Phenomenon and Chaos Control in a ZAD Controlled Boost Converter. Int. J. Bifurc. Chaos 2018, 28, 1850157. [Google Scholar] [CrossRef]
  17. Repecho, V.; Biel, D.; Ramos-Lara, R.; Vega, P.G. Fixed-Switching Frequency Interleaved Sliding Mode Eight-Phase Synchronous Buck Converter. IEEE Trans. Power Electron. 2018, 33, 676–688. [Google Scholar] [CrossRef] [Green Version]
  18. Perez, D.D.C.V.; Trujillo, S.C.; Velasco, F.E.H. On the dynamic behavior of the current in the condenser of a boost converter controlled with ZAD. TELKOMNIKA (Telecommun. Computi. Electron. Control) 2020, 18, 1678. [Google Scholar] [CrossRef]
  19. Pierre, T.; Bonhomme, G.; Atipo, A. Controlling the Chaotic Regime of Nonlinear Ionization Waves using the Time-Delay Autosynchronization Method. Phys. Rev. Lett. 1996, 76, 2290–2293. [Google Scholar] [CrossRef]
  20. Hoyos, F.E.; Candelo-Becerra, J.E.; Hoyos Velasco, C.I. Model-Based Quasi-Sliding Mode Control with Loss Estimation Applied to DC–DC Power Converters. Electronics 2019, 8, 1086. [Google Scholar] [CrossRef] [Green Version]
  21. Hoyos Velasco, F.E.; Candelo, J.E.; Silva Ortega, J.I. Performance evaluation of a DC-AC inverter controlled with ZAD-FPIC. INGE CUC 2018, 14, 9–18. [Google Scholar] [CrossRef]
  22. Angulo, F.; Fossas, E.; Ocampo-Martinez, C.; Olivar, G. Stabilization of chaos wiht FPIC: Application to ZAD-strategy buck converters. In Proceedings of the 16th World Congress of the International Federation on Automatic Control; Proceedings of the 16th IFAC World Congress, Prague, Czech Republic, 3–8 July 2005. [Google Scholar]
  23. Pyragas, K. Continuous control of chaos by self-controlling feedback. Phys. Lett. A 1992, 170, 421–428. [Google Scholar] [CrossRef]
  24. Pyragas, K. Control of Chaos via an Unstable Delayed Feedback Controller. Phys. Rev. Lett. 2001, 86, 2265–2268. [Google Scholar] [CrossRef] [PubMed]
  25. Senkerik, R.; Zelinka, I.; Davendra, D.; Oplatkova, Z. Evolutionary Design of Chaos Control in 1D; Springer: Berlin, Germany, 2010; Volume 267, pp. 165–190. [Google Scholar] [CrossRef]
  26. Iñarrea, M.; Peláez, J. Libration Control of Electrodynamic Tethers Using the Extended Time-Delayed Autosynchronization Method. J. Guidance Control Dyn. 2010, 33, 923–933. [Google Scholar] [CrossRef] [Green Version]
  27. Rusinek, R.; Mitura, A.; Warminski, J. Time delay Duffing’s systems: Chaos and chatter control. Meccanica 2014, 49, 1869–1877. [Google Scholar] [CrossRef] [Green Version]
  28. Doering, C.I.; Lopes, A.O. Equacoes Diferenciais Ordinárias; Instituto Nacional de Matemática Pura e Aplicada: Rio de Janeiro, Brazil, 2016; p. 423. [Google Scholar]
  29. Fossas, E.; Griño, R.; Biel, D. Quasi-sliding control based on pulse width modulation, zero averaged dynamics and the L2 norm. In Proceedings of the Advances in Variable Structure Systems, Gold Coast, Australia, 7–9 December 2000; pp. 335–344. [Google Scholar] [CrossRef]
  30. Nonlinear Control and Control of Chaos. In Nonlinear Phenomena in Power Electronics; IEEE: Piscataway, NJ, USA, 2009. [CrossRef]
  31. Banerjee, S.; Verghese, G.C. Basics of Bifurcation and Chaos Theory. In Nonlinear Phenomena in Power Electronics; IEEE: Piscataway, NJ, USA, 2009. [Google Scholar] [CrossRef]
  32. Banerjee, S.; Banerjee, S. Nonlinear Phenomena in Other Power Electronic Systems. In Nonlinear Phenomena in Power Electronics; IEEE: Piscataway, NJ, USA, 2009. [Google Scholar] [CrossRef]
  33. Banerjee, S.; Verghese, G.C. Nonlinear Phenomena in DC/DC Converters. In Nonlinear Phenomena in Power Electronics; IEEE: Piscataway, NJ, USA, 2009. [Google Scholar] [CrossRef]
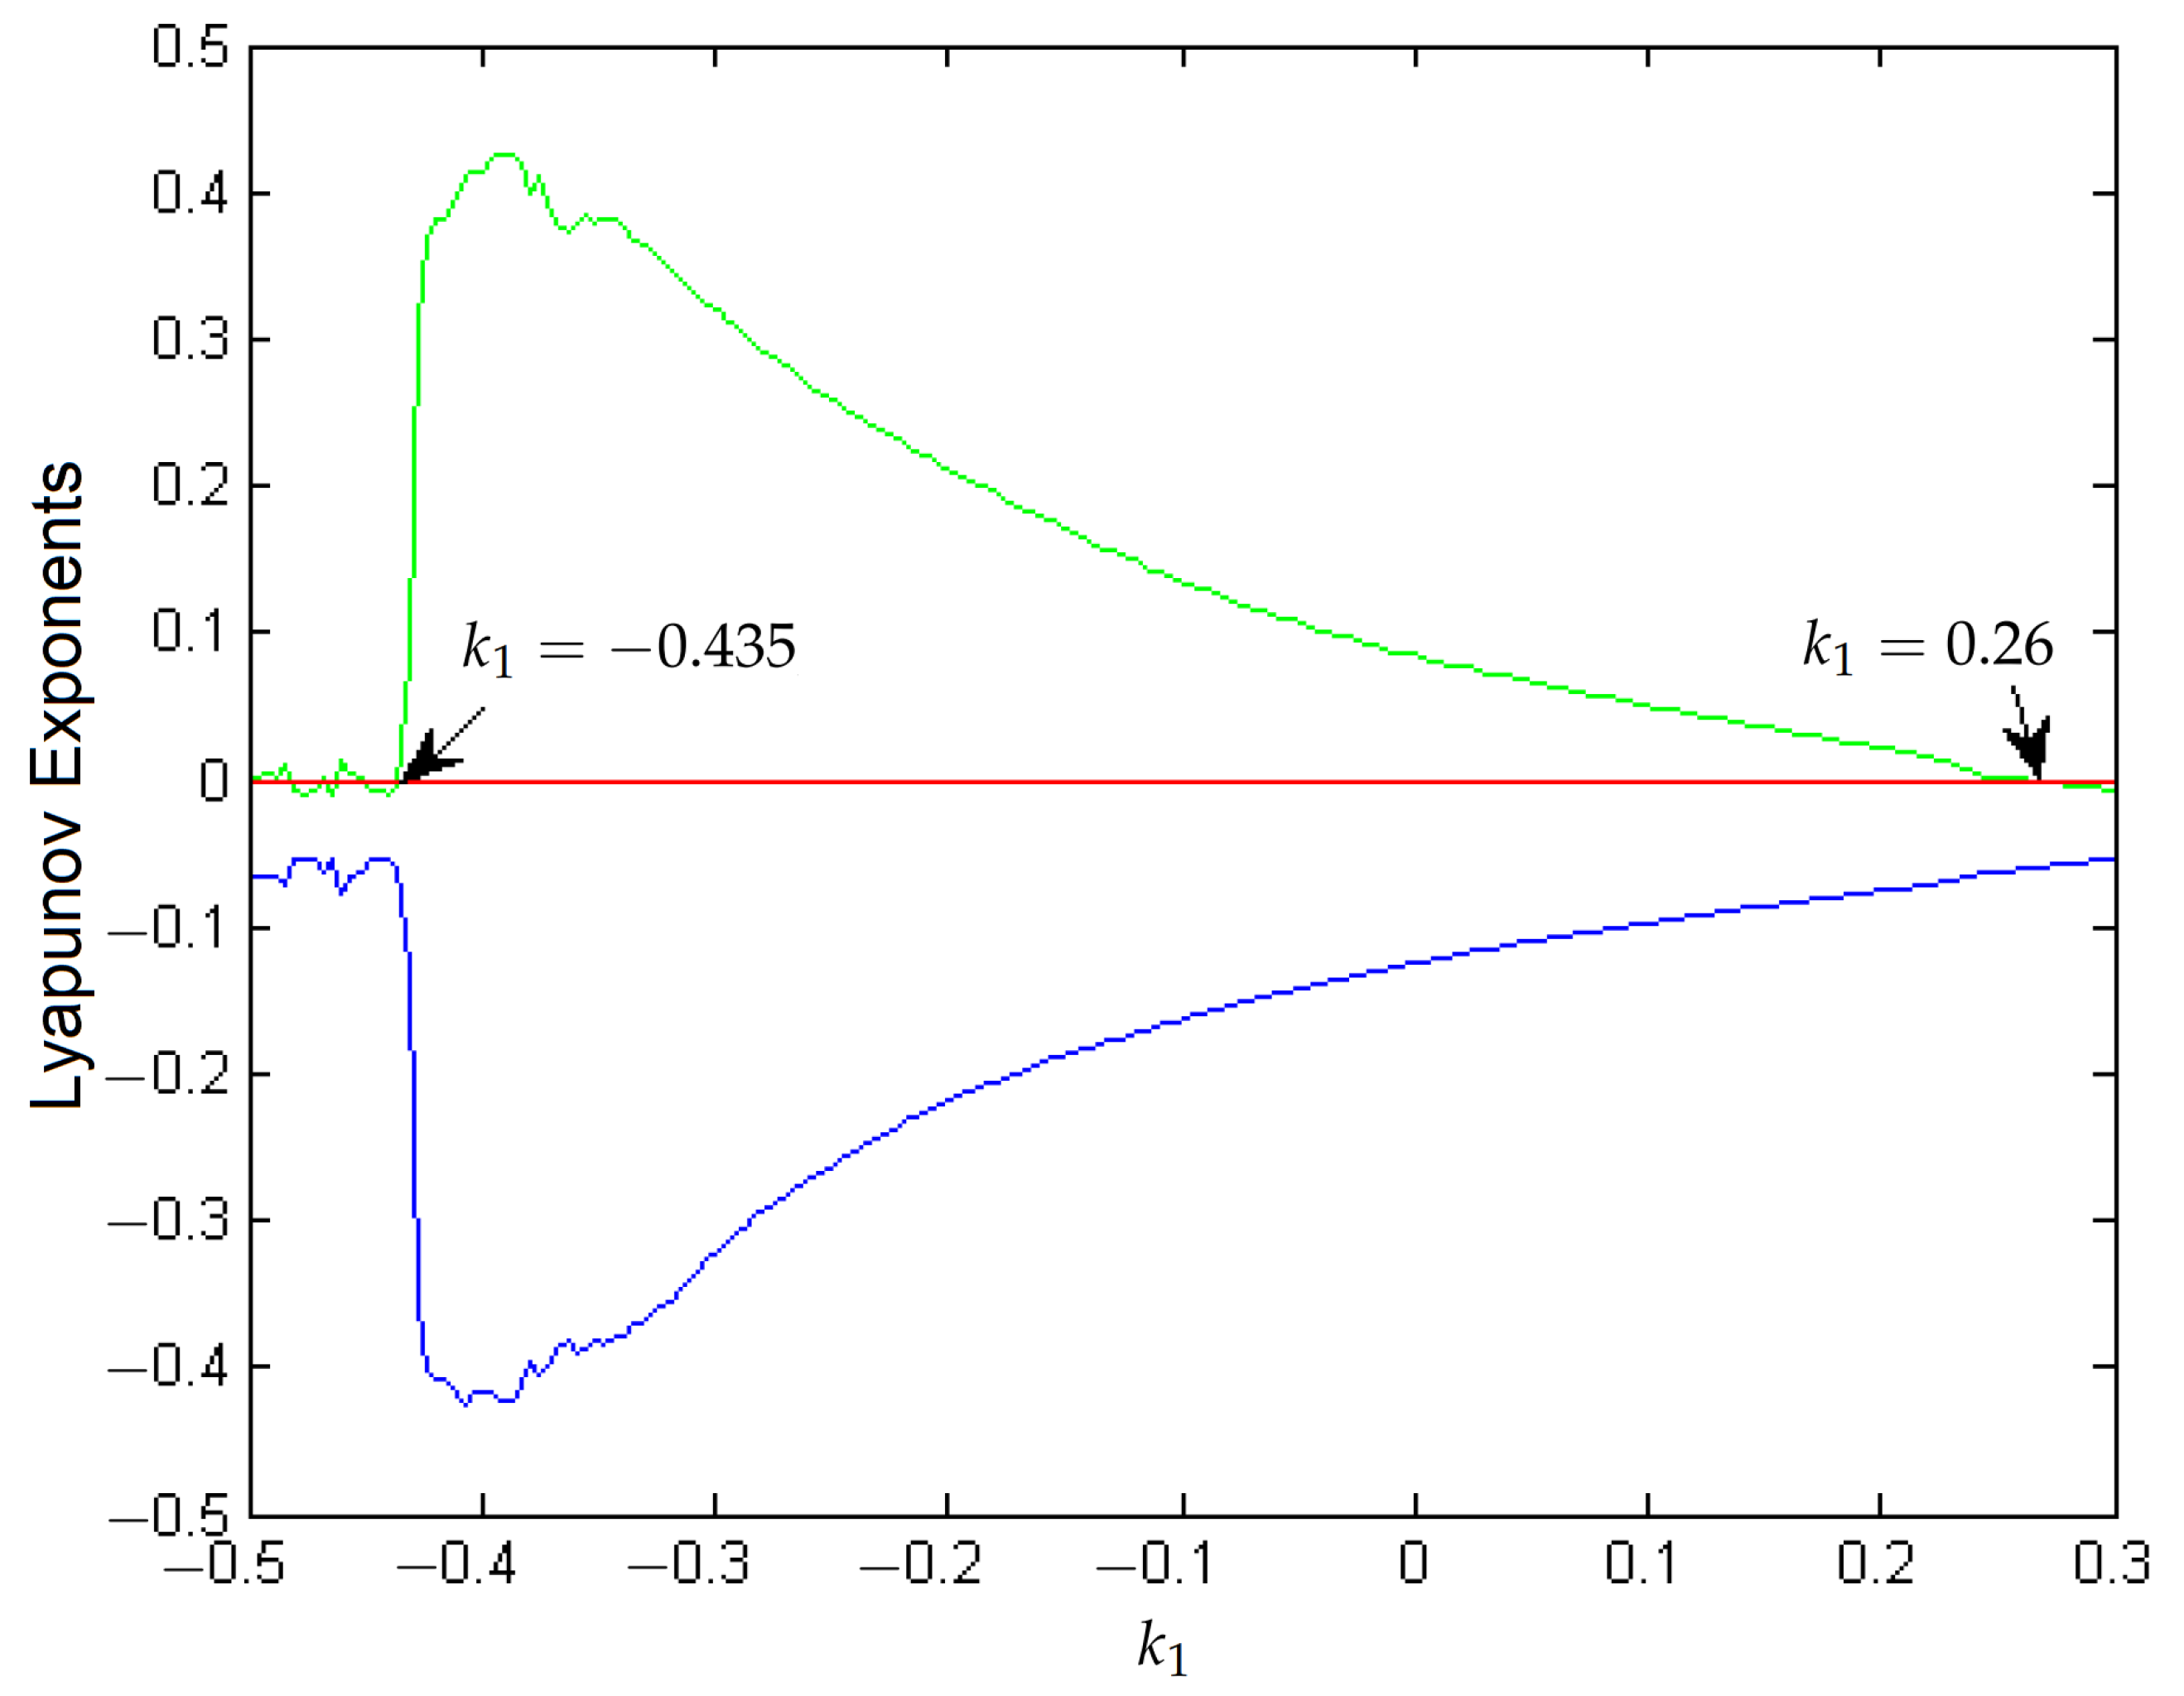
Figure 1. Boost converter with the ZAD, FPIC, and TDAS.
Sustainability 14 13170 g001
Figure 2. Variation of the Lyapunov exponents as a function of k 1 and considering the positive parameter k 2 = 0.5 .
Sustainability 14 13170 g002
Figure 3. Variation of the Lyapunov exponents as a function of k 1 and considering the negative parameter k 2 = 0.5 .
Sustainability 14 13170 g003
Figure 4. Voltage variation depending on k 1 with N = 0.1 .
Sustainability 14 13170 g004
Figure 5. Variation of the duty cycle depending on k 1 with N = 0.1 .
Sustainability 14 13170 g005
Figure 6. Evolution of the system in the state space when applying FPIC with N = 0.1 .
Sustainability 14 13170 g006
Figure 7. Evolution of the duty cycle applying FPIC with N = 0.1 .
Sustainability 14 13170 g007
Figure 8. Regulation of the system applying FPIC with N = 0.1 .
Sustainability 14 13170 g008
Figure 9. Voltage variation depending on k 1 with N = 0.2 .
Sustainability 14 13170 g009
Figure 10. Variation of the duty cycle depending on k 1 with N = 0.2 .
Sustainability 14 13170 g010
Figure 11. Voltage variation depending on k 1 with N = 0.6 .
Sustainability 14 13170 g011
Figure 12. Variation of the duty cycle depending on k 1 with N = 0.6 .
Sustainability 14 13170 g012
Figure 13. Biparametric diagram of the ZAD and FPIC controllers.
Sustainability 14 13170 g013
Figure 14. Lyapunov exponents for boost with time delay and FPIC control.
Sustainability 14 13170 g014
Figure 15. Spectral radius as a function of γ .
Sustainability 14 13170 g015
Figure 16. Voltage variation depending on k 1 for η =0.1.
Sustainability 14 13170 g016
Figure 17. Variation of the duty cycle depending on k 1 for η = 0.1 .
Sustainability 14 13170 g017
Figure 18. Variation of the duty cycle depending on k 1 for η = 0.1 .
Sustainability 14 13170 g018
Figure 19. Voltage variation depending on k 1 for η = 0.1 .
Sustainability 14 13170 g019
Figure 20. Variation of the duty cycle depending on k 1 for η = 0.2 .
Sustainability 14 13170 g020
Figure 21. Voltage variation depending on k 1 for η = 0.2 .
Sustainability 14 13170 g021
Figure 22. Biparametric diagram for the ZAD and TDAS controllers.
Sustainability 14 13170 g022
Figure 23. Evolution of the system in the state space with TDAS and η = 0.1 .
Sustainability 14 13170 g023
Figure 24. Evolution of the duty cycle with TDAS and η = 0.1 .
Sustainability 14 13170 g024
Figure 25. System regulation with TDAS and η = 0.1 .
Sustainability 14 13170 g025
Figure 26. Biparametric diagram for the regulation of the system with FPIC control.
Sustainability 14 13170 g026
Figure 27. Biparametric diagram for the regulation of the system with TDAS control.
Sustainability 14 13170 g027
Table 1. Advantage and drawbacks of the proposed control techniques.
ControllerAdvantageDrawbacks
ZADThe technique is useful to obtain a low steady-state error and maintain a fixed switching frequency [20,21,22].It is not robust when the system parameters change and for real-time application necessitates a high sampling rate and signal sensing synchronization with a PWM working in centered symmetric mode [20,22].
FPICThis technique is very useful for stabilizing higher period and order orbits, and also for controlling chaos [20,21,22].This technique lacks feedback from the regulated variables and is not robust enough to respond to changes in the system parameters [20,22].
TDASIt is useful to stabilize unstable periodic orbits and steady states [12,23,24,25]. It allows feedback and does not require rapid switching operations [26]. It is not necessary to have a reference signal according to the orbits [25,26].As the control uses the current state and one delay period, when the perturbation is small it presents low-quality stabilization, for example during high periodic orbits [27].
Table 2. System topology according to the duty cycle value.
CriteriaDecisionTopology
d c > T d c = T 1
d c < 0 d c = 0 2
0 d c T d c = d c 1 and 2
Publisher’s Note: MDPI stays neutral with regard to jurisdictional claims in published maps and institutional affiliations.