Article

The Impact Analysis of Psychological Issues and Pandemic-Related Variables on Ecuadorian University Students during COVID-19

by
Silvia Mariela Méndez-Prado
* and
Ariel Flores Ulloa
Faculty of Social Sciences and Humanities, ESPOL Polytechnic University, Campus Gustavo Galindo Km 30.5 via Perimetral, P.O. Box 09-01-5863, Guayaquil 090902, Ecuador
*
Author to whom correspondence should be addressed.
Sustainability 2022, 14(20), 13123; https://doi.org/10.3390/su142013123
Submission received: 16 September 2022 / Revised: 27 September 2022 / Accepted: 10 October 2022 / Published: 13 October 2022
(This article belongs to the Section Sustainable Education and Approaches)

Abstract

:
The study aims to find the impact of some life circumstances on psychological and pan-demic-related problems during the COVID-19 pandemic. Using the European student’s union survey of 2020, the research has negative emotions as the primary variable of interest. Other analyzed variables are pandemic-related behaviors and home infrastructure. A total of 1100 Ecuadorian university students let us conclude that those with moderate levels of emotional issues and high family income profiles suffered less during the lockdown. Negative emotions and home infrastructure sometimes depend on demographic factors like gender or family income. The multiple regression analysis shows that pandemic-related behaviors are positively correlated with negative feelings, which is the opposite of home infrastructure, which is negatively related to negative emotions—the CFA and SEM help to confirm the validity and reliability test of the questionnaire. The results let us understand the current university students’ situation and the public-related policies to enhance by filling the research gap and facing the scarce related literature in Ecuador.

1. Introduction

At the end of 2019, a new virus called SARS-CoV-2 appeared in Wuhan, China. Deaths and cases started to increase progressively since then, which led China to set a lockdown [1]. In 2020, the SARS-CoV-2 became a matter of concern around the world; later, in March 2020, the WHO (World Health Organization) declared a global pandemic [2]. Many cases and deaths were reported worldwide, and most countries decreed a national lockdown to protect their society [3]. Preoccupied with the situation, researchers and presidents attempted to find a solution to contain the virus while trying to create a vaccine or a treatment [4].
In Ecuador, COVID-19 started spreading in early April 2020. However, the first case was confirmed in late February 2020 [5]. Overall, the pandemic has brought several issues to the forefront of the entire society since it started in Ecuador. In around 56.4% of homes, at least one person stopped working. Additionally, Ecuador has 431,000 new poor, and more than 530,000 lost jobs [6]. Economic and isolation-related problems might have caused many people to deal with emotional issues (psychological problems such as anxiety, depression, and hopelessness), including students, who are usually a vulnerable part of the population, and women, a group of the population that usually have more negative emotions or psychological issues [7].
Not just in Ecuador, but all over the world, some issues people have had to cope with are also mental health-related problems, which in most cases are stress, anxiety, worries, or depression. On one hand, this may have been caused by fear and impotency in response to the bad news. On the other hand, it may have had something to do with quarantine and isolation. Concerning these emotional problems, the new coronavirus has affected more people than other pandemics such as the SARS in 2003 [8]. The world has had to deal with daily important problems due to the pandemic, such as air transportation issues, vulnerable elderly populations, and sometimes the fears of doctors and nurses, due to the risks required of them [9,10,11]. Regarding other related issues, personality traits in some people are usually associated with certain kinds of behaviors during the pandemic due to norms and laws in each country [12]. In some western provinces in China, trying to improve economic growth during a pandemic generated psychological entitlement and selfish behavior [13].
Social isolation caused by the COVID-19 pandemic is correlated with students’ mental health [3]. All significant changes provoked by restrictions such as the new online teaching method or lack of interaction have made students’ and their families’ worries increase and have brought on negative expectations of the future. Several studies have shown that depressive disorders or anxiety have increased by around 30% in most countries [3].
This study overall uses an uncommon survey in the research literature and emphasizes students’ feelings during the pandemic, such as anxiety, worries, frustration, and other feelings that are important during students’ lives. In addition, the data use also focuses on common student behaviors during the pandemic and their home infrastructure. Analyzing this data will allow for a better understanding of Ecuadorian university students and for either private or public entities to make better decisions, and to give these entities support to implement strategies to face possible crises; it will not only be useful for Ecuador, but also for countries that experience similar issues in the world.
During this research, scarce literature was found in Ecuador about current university students and the enhancement of related public policies. Trying to fill the research gap, the authors established two research questions: (1) Do the demographic variables gender and family income make a difference when facing pandemic-related situations? (2) Have behaviors and issues related to the COVID-19 pandemic had a negative effect on psychological issues in university students?
The following four objectives guide the research
(1)
To determine and analyze the validity of the questions of the instrument used in this research.
(2)
To describe how university students have dealt with negative emotions and Pandemic-related issues during the pandemic and how much.
(3)
To analyze if there is any difference in demographic variables concerning negative emotions and these Pandemic-related issues.
(4)
To establish a multiple regression analysis that quantifies the effects of these issues related to pandemics on the negative feelings of university students.
The present study starts with a short and specific literature review presenting the most common issues related to psychological and behavioral problems, including some of the most common scales used when trying to measure emotional issues, methodology and results. Finally, the discussion will contrast other results abroad, finding some similitudes and differences with other studies. The conclusion will show a resume of the most important points, results, and facts in the study, ending with the limitations and contributions.

2. Materials and Methods

Keywords used in Google Scholar were “university students”, “psychological impact”, “COVID-19”, and “scale”. However, the scale was taken out as well so that the research work would not be limited to scale studies. This is to procure as many studies as possible that relate to university students’ psychological impact. In addition, the Scopus index worked as a search engine and helped to delimit and specify the topics of interest related to psychological issues. Mendeley(software) was useful for organizing and preparing all the literature in a virtual library (https://www.mendeley.com/download-desktop-new/ (accessed on 15 September 2022)). Finally, more than a hundred studies related to university students’ issues were saved. Most of them related to psychological and behavioral problems, but mainly focused on students.

2.1. Related Literature

Psychological problems or mental health issues may be defined as a situation where a person or a group of people are having internal problems in their life, commonly caused by external problems. A range of symptoms is related to these issues. For example, feeling sad, not having energy, being embittered, etc. [14]. Stress, anxiety, or depression may cause severe problems on certain occasions [15,16,17,18,19,20]. Along with history, scientists have created several ways to measure how severe some of these problems are. The DASS-21 Scale is one of the most famous questionnaires that measure psychological problems: stress, anxiety, and depression. Many studies around the world have used it [15,16,17,18,19,20]. According to the literature, there are other popular scales, such as GAD-7 [21], more commonly used for anxiety, HADS [22], used for anxiety and depression, and HPQ-9 [23] for depression. Additionally, there are some other scales such as the Self-rating anxiety scale (SAS) [24], Perceived Stress Scale (PSS-10) [25]; and the COVID-19 student stress questionnaire, (CSSQ), which is a little more related to COVID-19 [26].
A high number of studies have analyzed the impact of the COVID-19 pandemic on psychological factors, apart from behavioral aspects. Looking at the most common literature regarding psychological issues, non-developed countries are those who have suffered the most [15,17,25,27,28,29,30,31,32,33]. Some relatively poor countries have had a high proportion of university students with psychological issues such as stress, anxiety, or depression. These are common problems in non-developed countries [20,34,35,36]. Just to give an example, Pakistan, southwest Ethiopia, and Egypt had a great proportion of university students facing psychological issues; over 40%, around 30%, and more than 50% each. Additionally, Japan and China showed high levels of emotional issues during the pandemic [16,37]. China had an even higher proportion of psychological issues than in some other non-developed countries (36%), that is the case of Nigeria where around 20% of university students suffered from mild anxiety, stress, and depression problems and less than 10% with severe cases [16,38]. Furthermore, in the case of Latin America, a study based on a systematic review in 2021, where a total of 196,950 people participated in the studies, found that mental health symptoms are quite prevalent in the population of the continent, here, in average, 35% said they felt anxiety, 35% felt depression, and 32% felt distress. Overall, South American participants had higher mental symptoms (36%), than Central America (28%). In addition, it is specified that 45% of university students had mental health symptoms, contrasting with the general population from Latin America (about 37%) [39]. In more developed countries like Spain, more than 40% of college students had to cope with emotional problems.
Not many studies have been carried out in Southwest Asia regarding mental health issues, and behavioral or home infrastructural problems during the pandemic. However, in a study taken in Malaysia, it can be seen how the students’ behavior changed towards the use of some technology, increasing the performance, and learning process during the pandemic, or the ease of use when they are more motivated. This shows the importance of the environment, good mental health, and how it influences the statement of the students. Students that are motivated or have a good mental health can perceive the use of technology and adapt better than those who are not. Unfortunately, this study does not analyze low-income students, but it does not diminish the importance [40].
Gender tends to be an important factor affecting the psychological problems of university students in all kinds of countries. Being a female has a positive and significant impact on emotional problems, such as stress, anxiety, and depression [34,35,38]. Furthermore, other demographic factors such as living in urban zones, or social status also tend to influence psychology in university students. In addition, pre-existing chronic disease, lack of support from families, living in urban zones, or social status [17,20]. Gender affects the COVID-19 impact in non-developed and developed countries. In the same study from Malaysia specified before, gender played an important role in the motivations of the students during the pandemic. Specifically, motivation or good mental health tend to affect more the performance of male students (Technology used during the pandemic) than female students in certain situations [40]. Concerning this, a study in 2021, ensures that there are some gender differences, and it is up to the public and private entities to support and motivate equally either males or females [41].
In The United States, demographic factors tend to have an impact on psychological problems. Specifically, being women, non-Hispanic Asians, in fair/poor health, below-average income, and those non-Hispanic white; and Above-average income showed low levels of psychological impacts [7]. Studies in Barcelona, Spain, have also found that the lower the mean income, the higher the COVID-19 incidence, which also includes psychological issues related to pandemics [42]. On the other hand, an analysis of mothers and fathers in Canada showed a decrease in health behavior and an increase in family stress during COVID-19. Some reasons found concerning stress were work balance and financial stability [43]. Nonetheless, not all countries have found the same demographic influence on emotional issues; sometimes, being a woman does not have any impact [44,45].
When trying to relate something with psychological aspects besides demographic factors, it may be possible to associate pandemic-related behaviors. For example, how the fact of behaving a specific way because of the pandemic may cause an increase in psychological issues. Due to the pandemic, many people also started being worried about their family’s health, which is something that may have also caused stress or anxiety, and some other emotions such as desperation, worries, frustration, etc. [15,20]. Staying at home, which is a behavior quite related to the pandemic, has caused an increase in depression [34]. This way, there are some other factors related to the pandemic that have influenced psychological problems. Some of the main precautionary measures people have practiced in some medium-developed countries such as Mexico are handwashing (around 35% of people practicing it), home confinement (around 28.77% practicing it), and handshake (16.10%) [19]. Likewise, handwashing, wearing a mask, home confinement or staying at home, and even not being physically active during the pandemic, all are statistically significant. Therefore, they are expected to influence psychological issues [19,25]. However, in some other cases, practices such as handshakes are not significant [19].
Moreover, home infrastructure problems may also affect psychological issues besides students’ performance. This is understandable since it is sometimes related to social status and family income, which is associated with factors such as good utility services, good internet connection, adequate study instruments, etc. [46,47]. As it may be suspected, problems related to infrastructure are more common in poorer countries. Asian countries are the countries more affected by this kind of situation [18,35,46]. As an example, university students in India (44%) reported they did not have a separate place to study. Almost 86% reported they received most of the classes on a cell phone, not a laptop. A lower income is a factor that might affect their education and psychological well-being [46]. In Pakistan, for example, 41.8% of university students reported they faced difficulties with online lessons [35]. In the case of developed countries, few studies have been conducted, maybe because it is not a real problem. However, a study where Germany and The United States participated showed there are no bad results for students. Most of the students do not face significant problems, but The United States usually performs better than Germany [48].

2.2. Hypotheses

Given the most common results in other analyses over the world, the following hypotheses were established. (H1) Most university students have often and always felt negative emotions. (H2) Negative emotions and pandemic-related behaviors together with home infrastructure issues are influenced by both demographic variables gender and family income. (H3) Pandemic-related issues such as related behavior or home infrastructure during the pandemic have a direct effect on negative emotions.

2.3. Sample and Recruiting

The dataset collection of the present work is related to the second phase of a study where more than 20 countries participated, and in which the objective was to describe the impact of COVID-19 on university students concerning several issues. This higher study was carried out and led by the University of Ljubljana in Slovenia [49].
The target population was all Ecuadorian university students. To develop the recruiting or data collection, a previous database which included the contacts of representatives of the universities in Ecuador was used. This first database is the same used in a previous study that took place in 2020, which is also related to another global research [49]. However, to obtain a higher sample, there was a need to look for new universities by contacting their federations, associations, or organizations. Social media was helpful to contribute to this new research. Once the information was obtained, calls and e-mails were sent to the correspondents, for them to spread the survey to students. Finally, besides ESPOL Polytechnic University, more than 30 representatives from universities such as Yachay Tech University or Machala Tech University, among others, accepted to participate in this study.
The dissemination of the study, especially among students, was made through massive e-mails, posts on the organizations’ official accounts, or those from students’ associations. In addition, a snowball sampling [50,51] was carried out to find more answers if possible. The survey was launched from 14 January to 30 April, finally obtaining around 1099 total answers from Ecuadorian universities. Being Ecuador in the top 4 countries with more samples collected.

2.4. Missing Data

The present study counted a considerable number of answers from most of the students who participated. Missing data are not a problem for the current study due to the great number of answers obtained in the questionnaire. This is thanks to the effort to find as many answers as possible.

2.5. Instrument

The survey was an extended version of the European student’s union survey (2020) which was coordinated in 2020 by the COVID-19 social science lab [52] (for more information see http://www.covidsoclab.org/ (accessed on 15 September 2022)). The survey was translated into Spanish for students to understand it easily; they had all the information they needed to consent to the survey before participating, and they confirmed they were 18 or older. Additionally, it is also specified and asked if their on-site classes were canceled.
The modification in this survey was focused on adding some new demographic questions. Some of the new questions were about family income, online learning previous experience, type of zone or area where students live, type of university, etc., among others. It has eight sections about several aspects of students’ lives, unlike the first and original questionnaire, which had seven sections. The survey started with demographic questions (Section 1) and evaluated the other seven sections: academic life, infrastructure and skills from home, social life, emotional life, life circumstances, support measures, and general reflections. Most questions in the questionnaire were formulated in the form of a 5 Likert scale. Others, such as demographic, were multiple choice. The complete original questionnaire was established with a one-click survey webpage created by the University of Ljubljana https://www.1ka.si/d/en (accessed on 15 September 2022) [53]. This study does not evaluate and analyze all the questions and answers of this questionnaire since the main objective is to analyze more psychological issues together with behavioral and infrastructure problems. This is due to the research scope, objectives, and questions, which also include a description of the sample using demographic items.
Concerning the topics of interest in this study, there were three questions useful for achieving the objectives. These were: “Q25. How often have you felt the next emotions while you attended your online classes since the outbreak of COVID-19 in your country?”; “Q38. Evaluate the frequency of your habits before and after the COVID-19 pandemic”; and “Q21. At your home, do you have access to the next necessary equipment?” These were the question specifically analyzed and treated in this study. All three of them were based on a 5-Likert scale [43] (shaped: never,1; rarely,2; sometimes,3; often,4; always,5), to measure the intensity of every action in the constructs depending on the context of each question. Questions used in this study were tested with Cronbach’s alpha [54].

2.5.1. Negative Emotions

Question Q25 contained a mix of emotions, which included positive and negative emotions. Just the negative emotions of this question were used; this way the final construct to describe the level of negative emotions was a compound of six emotions. Students answered how often they felt frustrated, angry, anxious, ashamed, desperate, and bored. Cronbach’s alpha for this construct was 0.83.

2.5.2. Pandemic-Related Behavior

Question Q38 from the original questionnaire was divided into two parts, behavior before and after COVID-19, where “after” means during the pandemic. Regarding the questions chosen for describing the behavior during the pandemic, students responded how often they practiced washing hands, avoided crowded places, avoided touching faces, shaking hands, kept just essentials when buying in pharmacies and groceries, canceled travels, worked at home, avoided public transport, and used masks outside. Initially, two questions, leaving the house for unnecessary reasons and shaking hands, were taken into consideration. However, a full CFA (confirmatory factor analysis) [55] showed these two items were not significant, therefore they were not considered.

2.5.3. Pandemic-Related Behavior before, after, and Variation

In total, three constructs regarding behavior were analyzed to know how important they are for the current research: behavior before, behavior after, and the variation between them. Variation is a created construct that captures the variation of each answer (represented in 5-Likert points) before and after. Concerning the construct pandemic behavior before, Cronbach’s alpha was 0.53, which makes sense because there was no way to be affected by anything before the pandemic. Cronbach’s alpha for behavior after was 0.66; and finally, for the construct created as variation, it was 0.71, which was the best one.

2.5.4. Home Infrastructure

Question Q21 helped by assessing how well university students are regarding the availability of important equipment and the facilities of the house to perform better in an online environment. All eleven items were used for this construct. Students were asked how often they had access to a quiet place to study, a desk, a computer, required software, printer, earphones and microphone, webcam, office supplies (notes, pen, etc.), good internet connection, and study material. Cronbach’s alpha was 0.86.

2.6. Data Analysis Procedure

2.6.1. Confirmatory Factor Analysis Procedure

Initially, a confirmatory factor analysis (CFA) was carried out. It is important to mention that there was no need for an Exploratory factor Analysis (EFA) [56] since this work is not proposing a new scale but it is rather working with an existing one (The European Students Union Survey-2020). Therefore, the objective of the CFA was to verify and check how good the results were. Past research, also linked to the global study started by the University of Slovenia, has already found a relationship between variables applied in the main questionnaire using a structural equational model [57]. This helped to know how relevant the questions used in this study are and which combination of variables could fit the best, performing this analysis using R-Studio (Version 1.4.1717,© 2009–2021 RStudio, PBC). Libraries used for CFA and SEM were “lavaan”(code: cfa. model), “psych “was the library used for Cronbach’s alpha (code: Alpha), and “semplot” for the structural equation model graph (Code: Sempath). For this case, variables taken into consideration were negative emotions, pandemic-related behavior, and home infrastructure. “Negative emotions” is the main variable of interest given the wide range of literature found regarding this problem.
The analysis lists the following variables: negative emotions (NE) and home infrastructure (HI), pandemic behavior-After (ARE), pandemic behavior-Before (BRE), pandemic behavior-Variation (VRE)
To know the goodness-of-fit of the model or models, the Schermelleh-Engel and Moosbrugger Criteria [58] together with Cronbach’s alpha [54] were used as fit indices. Four models were tested in total, one by one. One with an improvement compared to the other and trying to achieve better fit indices. Additionally, the same criteria were used to analyze the goodness-of-fit of each construct involved and to see how well these constructs perform individually. In the end, some constructs were quite bad.
Once the best model, with the best constructs, is chosen, a structural equation model (SEM) [59] is analyzed. For the case of the current study, the study complies with most of the SEM’s assumptions given the big sample, such as sufficiently large sample size (more than 700 for each latent variable) and correct model specifications (see Table 1). However, the multivariate normality needs to be tested; therefore, for validating the multivariate normality of the variables, skewness, and kurtosis criteria by Brosseau-Liard and Savalei (2012, 2014) was used, with the range of the skewness (<±2), and kurtosis (<±7), specifications that have also been proven and applied by several authors [60,61]. Using R-Studio, the library “moments”, and the codes “skewness” and “kurtosis” cast that all the important latent variables (NE, ARE, BRE, VRE, HI) fulfilled with the multivariate normality (range [−2, 2], [−7, 7]), which was the last assumption in the SEM [62]. Then, it is seen how significant the covariance between variables involved in the model is. Then, the SEM is shown through a graph where the correlations between variables can be appreciated, to know or have a first clue of how they are related.

2.6.2. Statistical Analysis of the Best Model’s Variables

Once the model that fits the best and better relates to the variables is identified, statistical procedures are followed to analyze the variables involved. From this step on, Excel 2016 and Stata/MP 16 software for windows is used to analyze preliminary statistical analysis and up forward analyses. Variables’ means can be seen for each variable of every construct, specifying what are the most common answers and how students have responded. Additionally, the percentages of the most relevant answers are described.

2.6.3. Descriptive and Inferential Analysis Procedure for Variables of Interest

A score was created for every construct using the 5-Likert [63] scale: Negative emotions, Pandemic-related-behaviors after (during the pandemic), home infrastructure, and behavior variation before and after the pandemic, which was included in the inferential and descriptive analysis so that behavior change could be seen. The score consisted of the sum of all points of the variables divided by the total number of variables in each construct. This score, between [0:1], represents how much they have chosen the highest answer on the 5-Likert scale. In the case of behavior variation before and after the pandemic, this variable is the difference between the score of behavior after the pandemic and behavior before the pandemic.
After obtaining scores, outliers were identified for each construct using the z-score methodology [64]. The objective was to see if the inferential analysis would change when taking out the outliers. In case there is no change, outliers would remain in the sample when analyzing the variables. After that, the mean of each construct is obtained. Then, two groups are analyzed to see if there is any statistical difference between them. The groups chosen to analyze were gender and students’ family income. For this study, only sex (males and females) was considered. Later, the sample’s parametricity was tested for the whole sample and by each group chosen. Concerning parametricity requirements, the Shapiro-Francia test [65] was used for normality. In case the sample has a normal distribution, the Sd-test [66] would help to know if variances are homogeneous. Once it is clear whether the sample is parametric or not, the t-test [67] is used for testing the mean difference between groups if samples are parametric, and the U-Mann Whitney test [68] if it is not parametric.

2.6.4. Multiple Regression Analysis

A Multiple regression analysis [69] was performed as a complementary procedure to see the relationship or effect of the Pandemic-related-behaviors and home infrastructure on Negative emotions. Variables chosen for this analysis were those of the best model of the CFA and the SEM. In addition, some demographic variables were added to the analysis. Aside from family income and gender, the variables were “online learning experience” (1 if the student has had previous online experience; 0 otherwise), and “zone of living” (1 if living in an urban(centric) zone; 0 otherwise). In addition, the multiple regression analysis was performed in both ways with outliers and taking them out. This was to see whether statistical results change or not, and how. Moreover, it is important to consider that home infrastructure captures some of the effects of negative emotions so that in any case, it could help as a control variable [70] in any other case of study.

2.6.5. Regression Analysis Consideration

The multiple regression analysis performed in this study is a supporting feature for the present analysis and the results should not be interpreted as a causality. However, it might give a clue of how these variables could affect it, supported by the previous analysis such as the confirmatory factor analysis. For causality analysis, the sample should comply with many requirements, and it is usually accompanied by several tests, such as normality and variance homogeneity of errors, perfect multicollinearity, etc.

3. Results

3.1. Participant’s Description

The final population of the present research was university students aged 18 or older. The sample had certain demographic features. For gender, 54.02% were female, the male proportion was 43.48% and the last 2.5% corresponded to other specifications of gender. The average age was 21.91 and 82.51% of the participants were from ESPOL Polytechnic University, and the other 17.49% were distributed among more than 30 universities. Some of the most important and recognized universities were Chimborazo Polytechnic University, Guayaquil University, Yachay Tech University, National Polytechnic University, and Cuenca University. It is important to highlight that almost all the students were from public universities (99.54%). Likewise, as foreseen, participants were living mostly in the city or urban zones (56.28% of the sample). The ones living in a suburban zone (periphery zone) were 31.15%. Finally, just 12.57% were from rural zones. Furthermore, just 1.85% affirmed having a high family income. A total of 58.67% of the sample were medium income and 35.42% lower income. Curiously, 4% of the students preferred not to say their income; hence, some high- or lower-income students may be inside this 4%. More than 250 students did not answer the question, but they were not taken into consideration in the tabulation. Concerning the new online environment, 25.75% affirmed they had previous experience with online learning, the other 74.25% said they had no experience.

3.2. Confirmatory Factor Analysis (CFA)

A CFA (confirmatory factor analysis) was carried out to know how good the selected constructs are for correctly describing the student’s answers [55]. This analysis helped to know the goodness-of-fit of the model, initially with a full test, then it helped to know the significance of every item in the constructs and the covariance significance for possible relationships between variables. Additionally, a CB-SEM (covariance-based structural equation model) was useful for determining how related the variables are and if there is a possible causality between some variables [71]. The Schermelleh-Engel and Moosbrugger Criteria [58] together with Cronbach’s alpha [54] analysis was used to determine the quality of each model or construct. An attempt to improve these models was made through some recommended modifications based on the results of the initial tests.
Table 1 shows how good the models are, separated in full tests and individually per construct. At first, in model M1, all items (negative emotions, behaviors before, behaviors after, and home infrastructure) were considered, as it was specified in the instrument description section above. This model was not quite good. Two items were not significant in the model (leaving the house for unnecessary reasons Q38b and shaking hands Q38e), the fit indices were very deficient, and only SMRM and RMSEA indices were acceptable. Nevertheless, Cronbach’s alpha (0.70) was not that bad. Consequently, a second model M2 was run, in this case, taking off the non-significant items. The fit indices did not improve but Cronbach’s alpha raised to 0.73. Finally, two new models were created, also without the non-significant items, but especially taking into consideration only the effects after the pandemic.
The third model M3 considered only the variation of the behavior before and after, together with negative emotions and home infrastructure (three factors). This time the model considerably improved for almost all indices, and Cronbach’s alpha increased to 0.76. Model 4 (M4), which only considered behavior after instead of variation, improved similarly to M3, but model 3 was slightly better than model 4 referring to how related the latent variables are.
Additionally, as can be seen in Table 1, fit indices for individual factors are mostly good. The only construct with quite bad results is ‘behavior before’ (ARE), unlike the other factors which had a relatively good fit. The behavior after construct had the worst Cronbach’s alpha an individual factor. On the other hand, negative emotions (NE) and home infrastructure (HI) have the highest Cronbach’s alpha (0.83 and 0.86 respectively).

3.3. Structural Equation Model (SEM)

3.3.1. Covariance Significance and Structural Equation Model

Only the last two models M3 and M4 were considered to analyze their intern variables’ relationship because they were the best. Table 2 shows the covariance significances. Model 4 shows better relationships between all variables and therefore, makes it a better candidate for the current analysis.
Having a first clue of the covariance significance can help to better understand the possible relationships and the intensity between variables. Figure 1 specifies the correlation and intensity between variables of model 4, using a Structural Equation Model [59]. The highest correlation in the variables is between ARE (pandemic behavior-after) and home infrastructure, which is a positive correlation. The next one, also positive, was between negative emotions and after-pandemic behavior. Finally, between negative emotions (NE) and home infrastructure (HI), where there is a negative and low correlation (See Figure 1).

3.3.2. R-Square Values

For each of the latent variables in the SEM Model specified above, there were some more significant R-square values. The negative emotions variables appear to have more moderate R-square values, in comparison to responsible behavior after-pandemic and home infrastructure. However, responsible behavior shows very low R-squares, especially question Q38j_2. See Table 3.

3.4. Variables’ Statistical Analysis (Model 4 Variables)

Primary results for variables involved in model 4 showed high results for university students in negative emotion, pandemic-responsible behavior (after), and home infrastructure. In the case of negative emotions, most of the students reported that they suffered from negative emotions, not always (5) but sometimes (3), especially emotions such as frustration, anxiety, and boredom, which were the most common and the highest ones (See Figure 2). In the case of frustration, 30% of the sample said they felt it frequently (3), 29.67% most of the time (4), and 15.43% affirmed they felt it always (5). Concerning anxiety, 23.98% felt it frequently (3), 23.62% most of the time (4), and 19.3% felt it always (5). Likewise, 68.62% of the sample felt bored frequently, most of the time, or always. In addition, about 44% of the sample felt desperate frequently or most of the time, and 12.44% always felt desperate.
Most university students were closer to 4 (frequently) and 5 (always). These are options that reflect being closer to always practicing this type of behavior, for both pandemic-related behaviors and home infrastructure. Handwashing, avoiding touching their faces, and using a mask outside were the most common and practiced behaviors that students did during the pandemic (See Figure 2). A total of 88.04% of university students said they practiced handwashing frequently (4) or always (5). A total of 17.45% affirmed they avoided touching their face sometimes (3), and 60.13% did it frequently (4) or always (5). Concerning using a mask outside, 8.7% did it frequently (4), and 84.27% always (5).
Home infrastructure seemed not to be a problem for most of the sample, since almost everybody showed good results. In the case of this variable, it also showed that many students had access to essential materials and supplies at home frequently (4) and always (5). As seen in Figure 3, the required supplies that students almost never had issues with are computers, required software, desk, earphones and mic, webcam, and office supplies. Concerning percentages of university students, 63.15% of the sample always (5) had access to a computer during the pandemic and 21.69% had it frequently (4), 1.46% affirmed they never had (1) access to a computer. Regarding having the required software 44.22% always (5) had access, and 46.57% said they had access sometimes (3) and frequently (4). Some 50% of the sample always had access to a desk, 32.09% sometimes (3) and frequently (4), but 17.9% affirmed they never (1) or rarely (2) had access to a desk. 86.82% had access to a microphone and earphones always, frequently, or sometimes (5,4,3), and just 13.18% never (1) and rarely (2). It was similar with the access to webcam and office supplies, where respectively 76.07% and 74.49 of students had access frequently (4) and always (5).

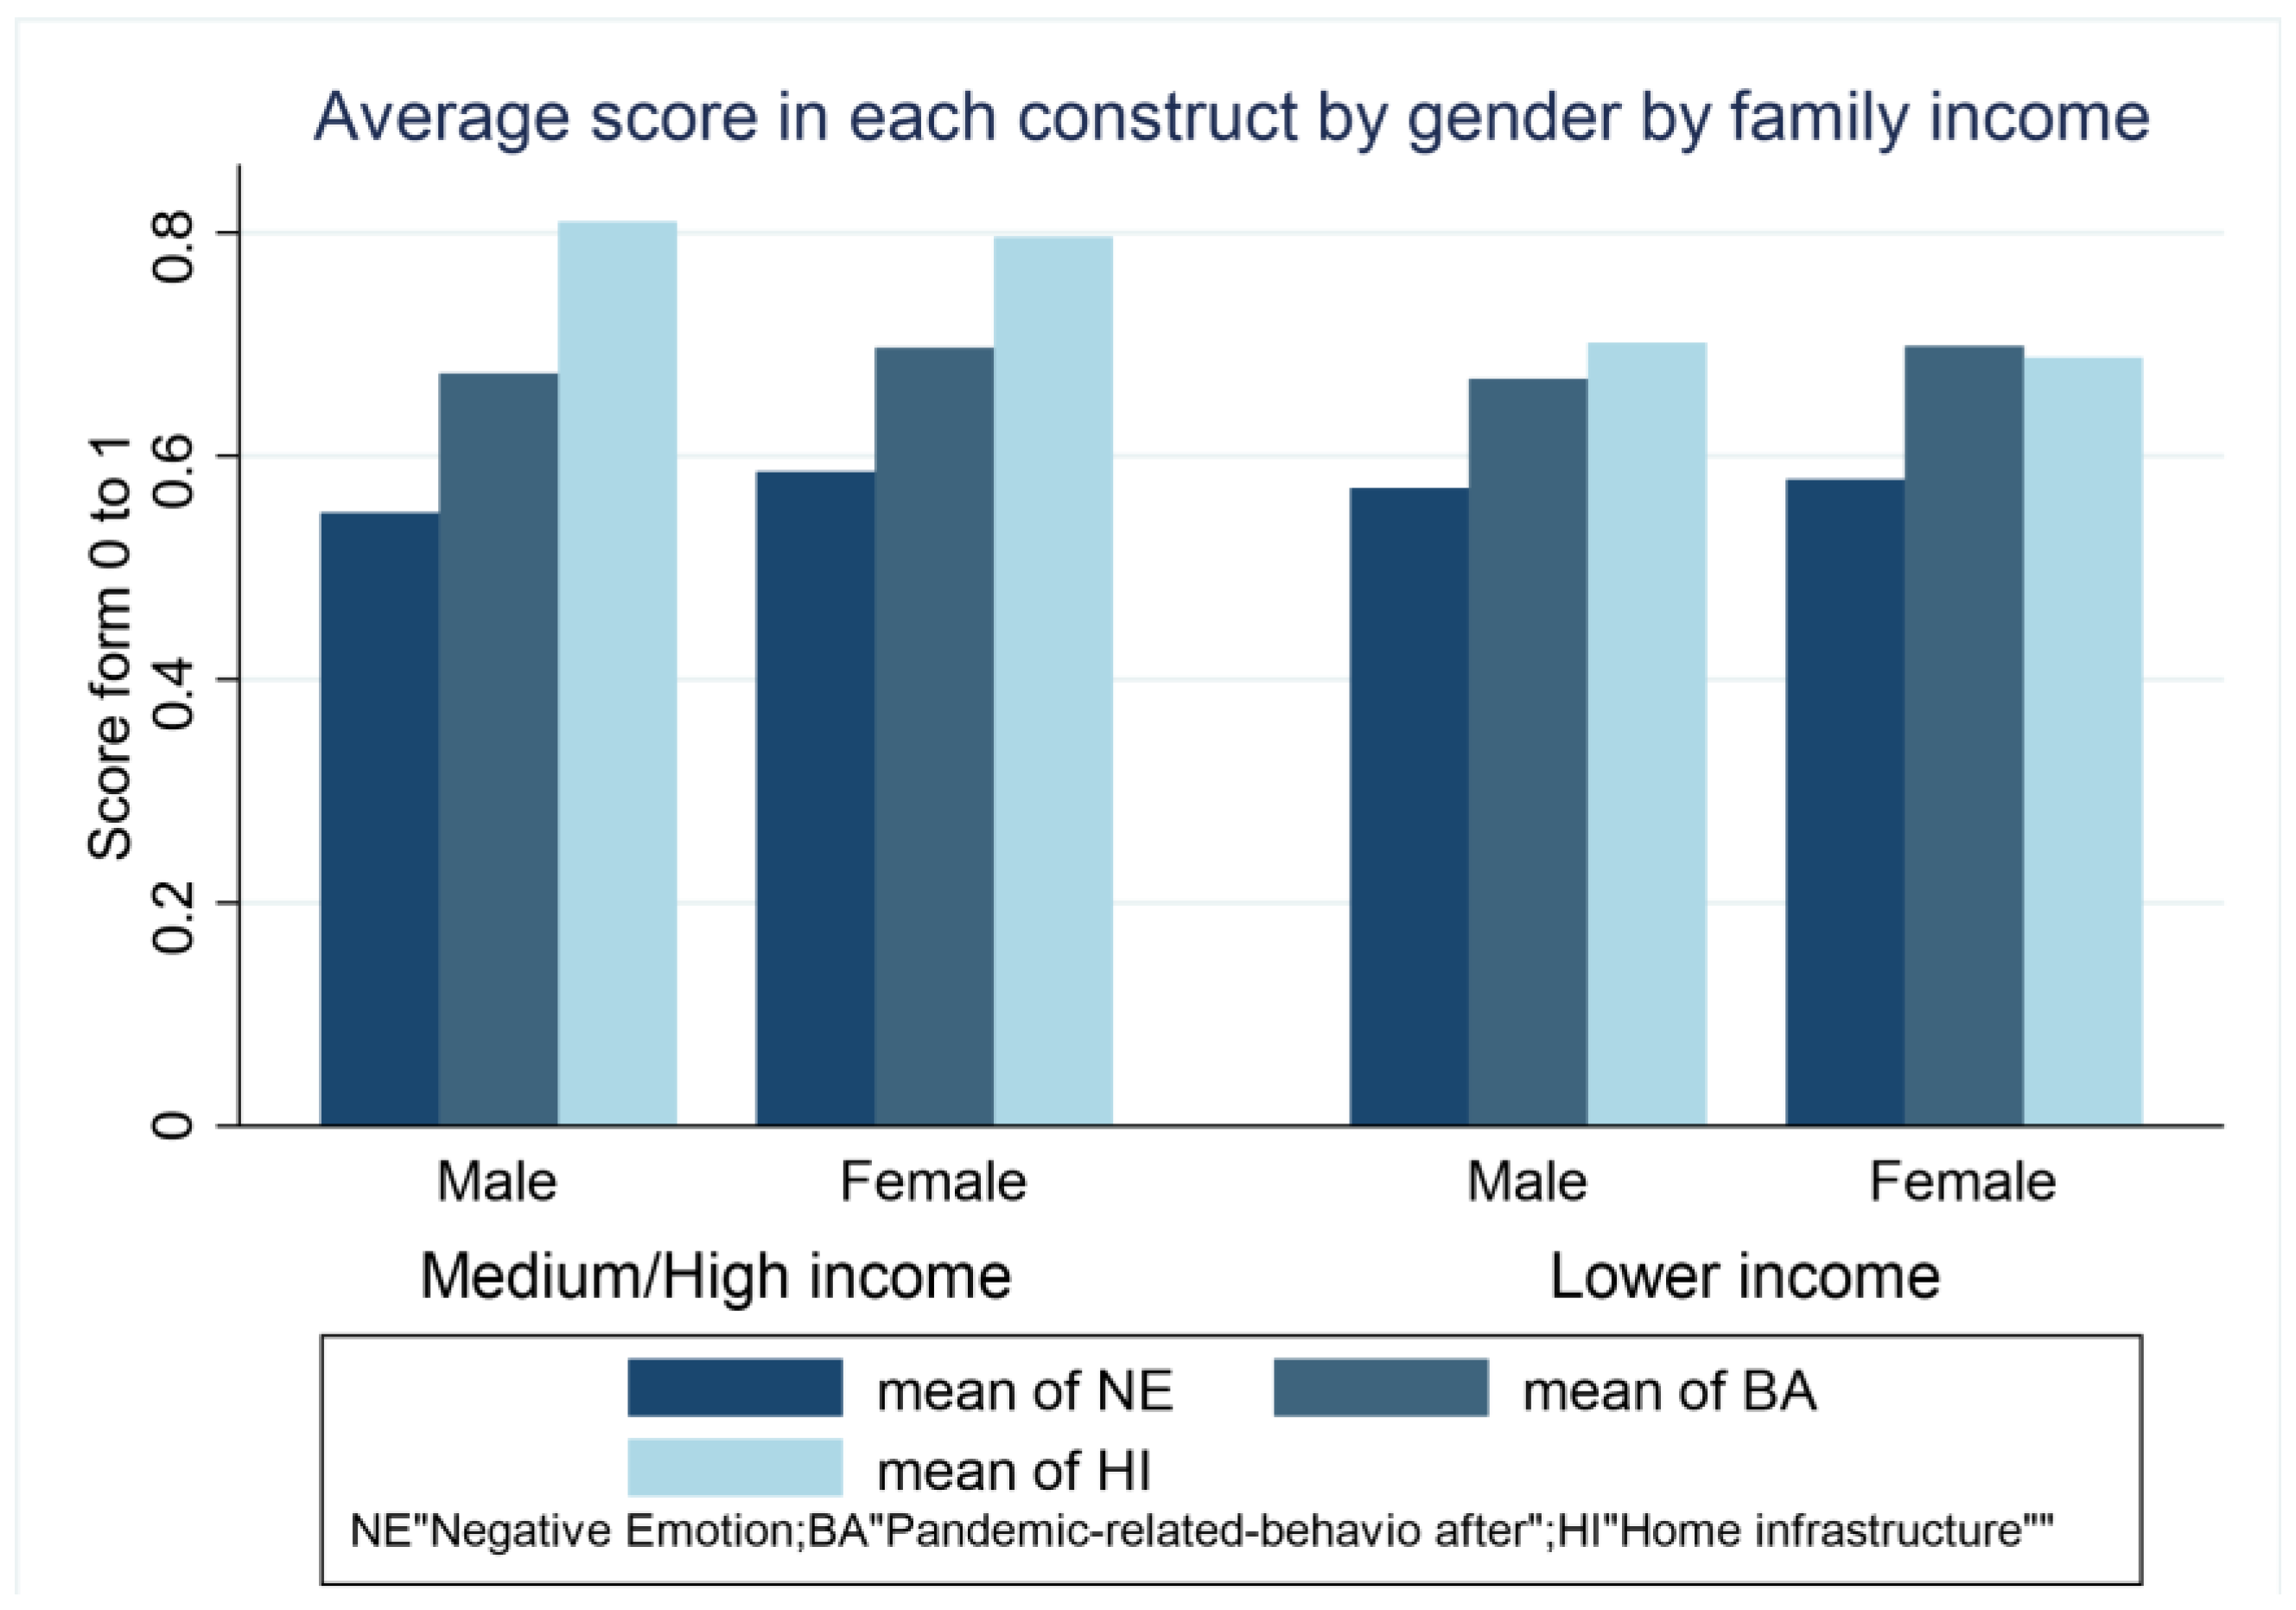
Scores’ Preliminary Analysis by Gender and Family Income

Figure 4 describes how university students performed in the three constructs chosen to analyze. In the first instance, it can be seen that there is a slight difference in males and females when talking about negative emotions; the difference is slightly more noticeable in medium/high-income students, where females obtained a higher score.
Looking at the graph, at least at first impression, it does not look like there is any clear difference between males and females, nor by family income. However, for home infrastructure, there is an explicit difference between lower-income and medium/high-income students. These were the answers with the highest scores. In this case, students with medium/high income, male or female, achieved a score around 0.8 or higher. It is also interesting to see that lower-income female students do not have much difference between scores of pandemic-related behaviors (during) and home infrastructure (See Figure 5).

3.5. Inferential and Descriptive Analysis

3.5.1. Parametricity

The Parametricity test cast out that all samples in negative emotions sub-groups were parametric at 5% confidence individually (p-value > 0.01); the same happened with the complete group. For all other variables analyzed, home infrastructure (HI), pandemic-related behavior after (ARE), and variation (VRE). all of them were non-parametric (p-value < 0.001), either being separated into groups or as a whole group. See Table 3.

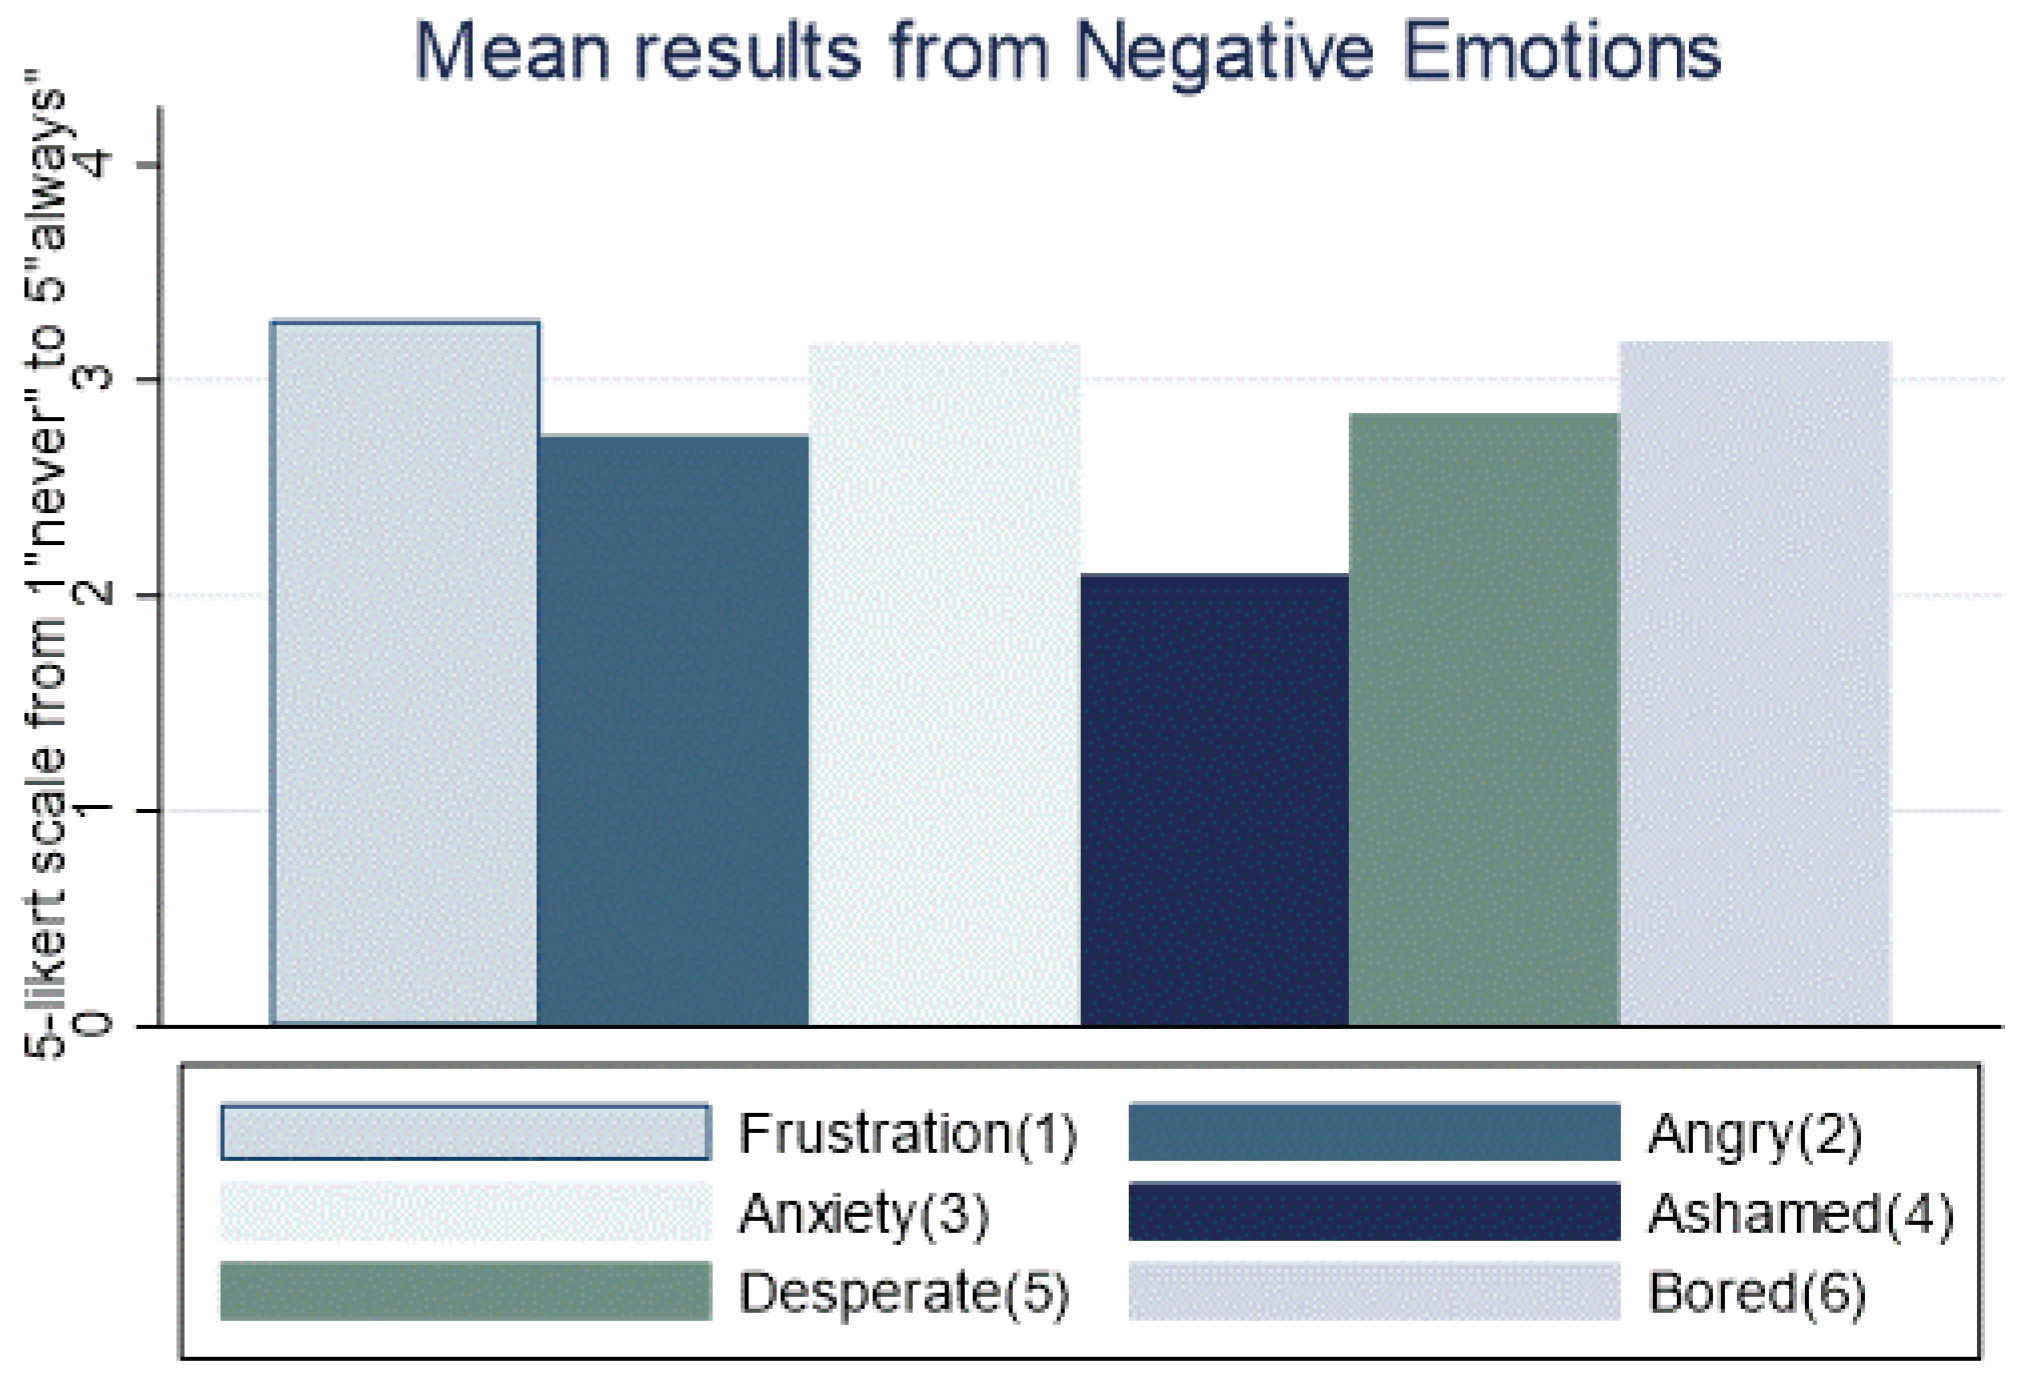
3.5.2. Negative Emotions

The complete group overall obtained an average score of 0.57529 which means most of the students suffered from psychological issues often and sometimes. Given this, statistically, males and females were significantly different at 5% level of confidence (p-value = 0.0384; male = 0.5584; female = 0.5842). See Table 4.
In the case of the income group, the average score of negative emotions was around 0.57 and the groups analyzed were not significantly different (p-value = 0.5969; lower-income = 0.577894; medium-income = 0.57086). Either lower income or medium income, students seemed to be equal when referring to emotional issues.

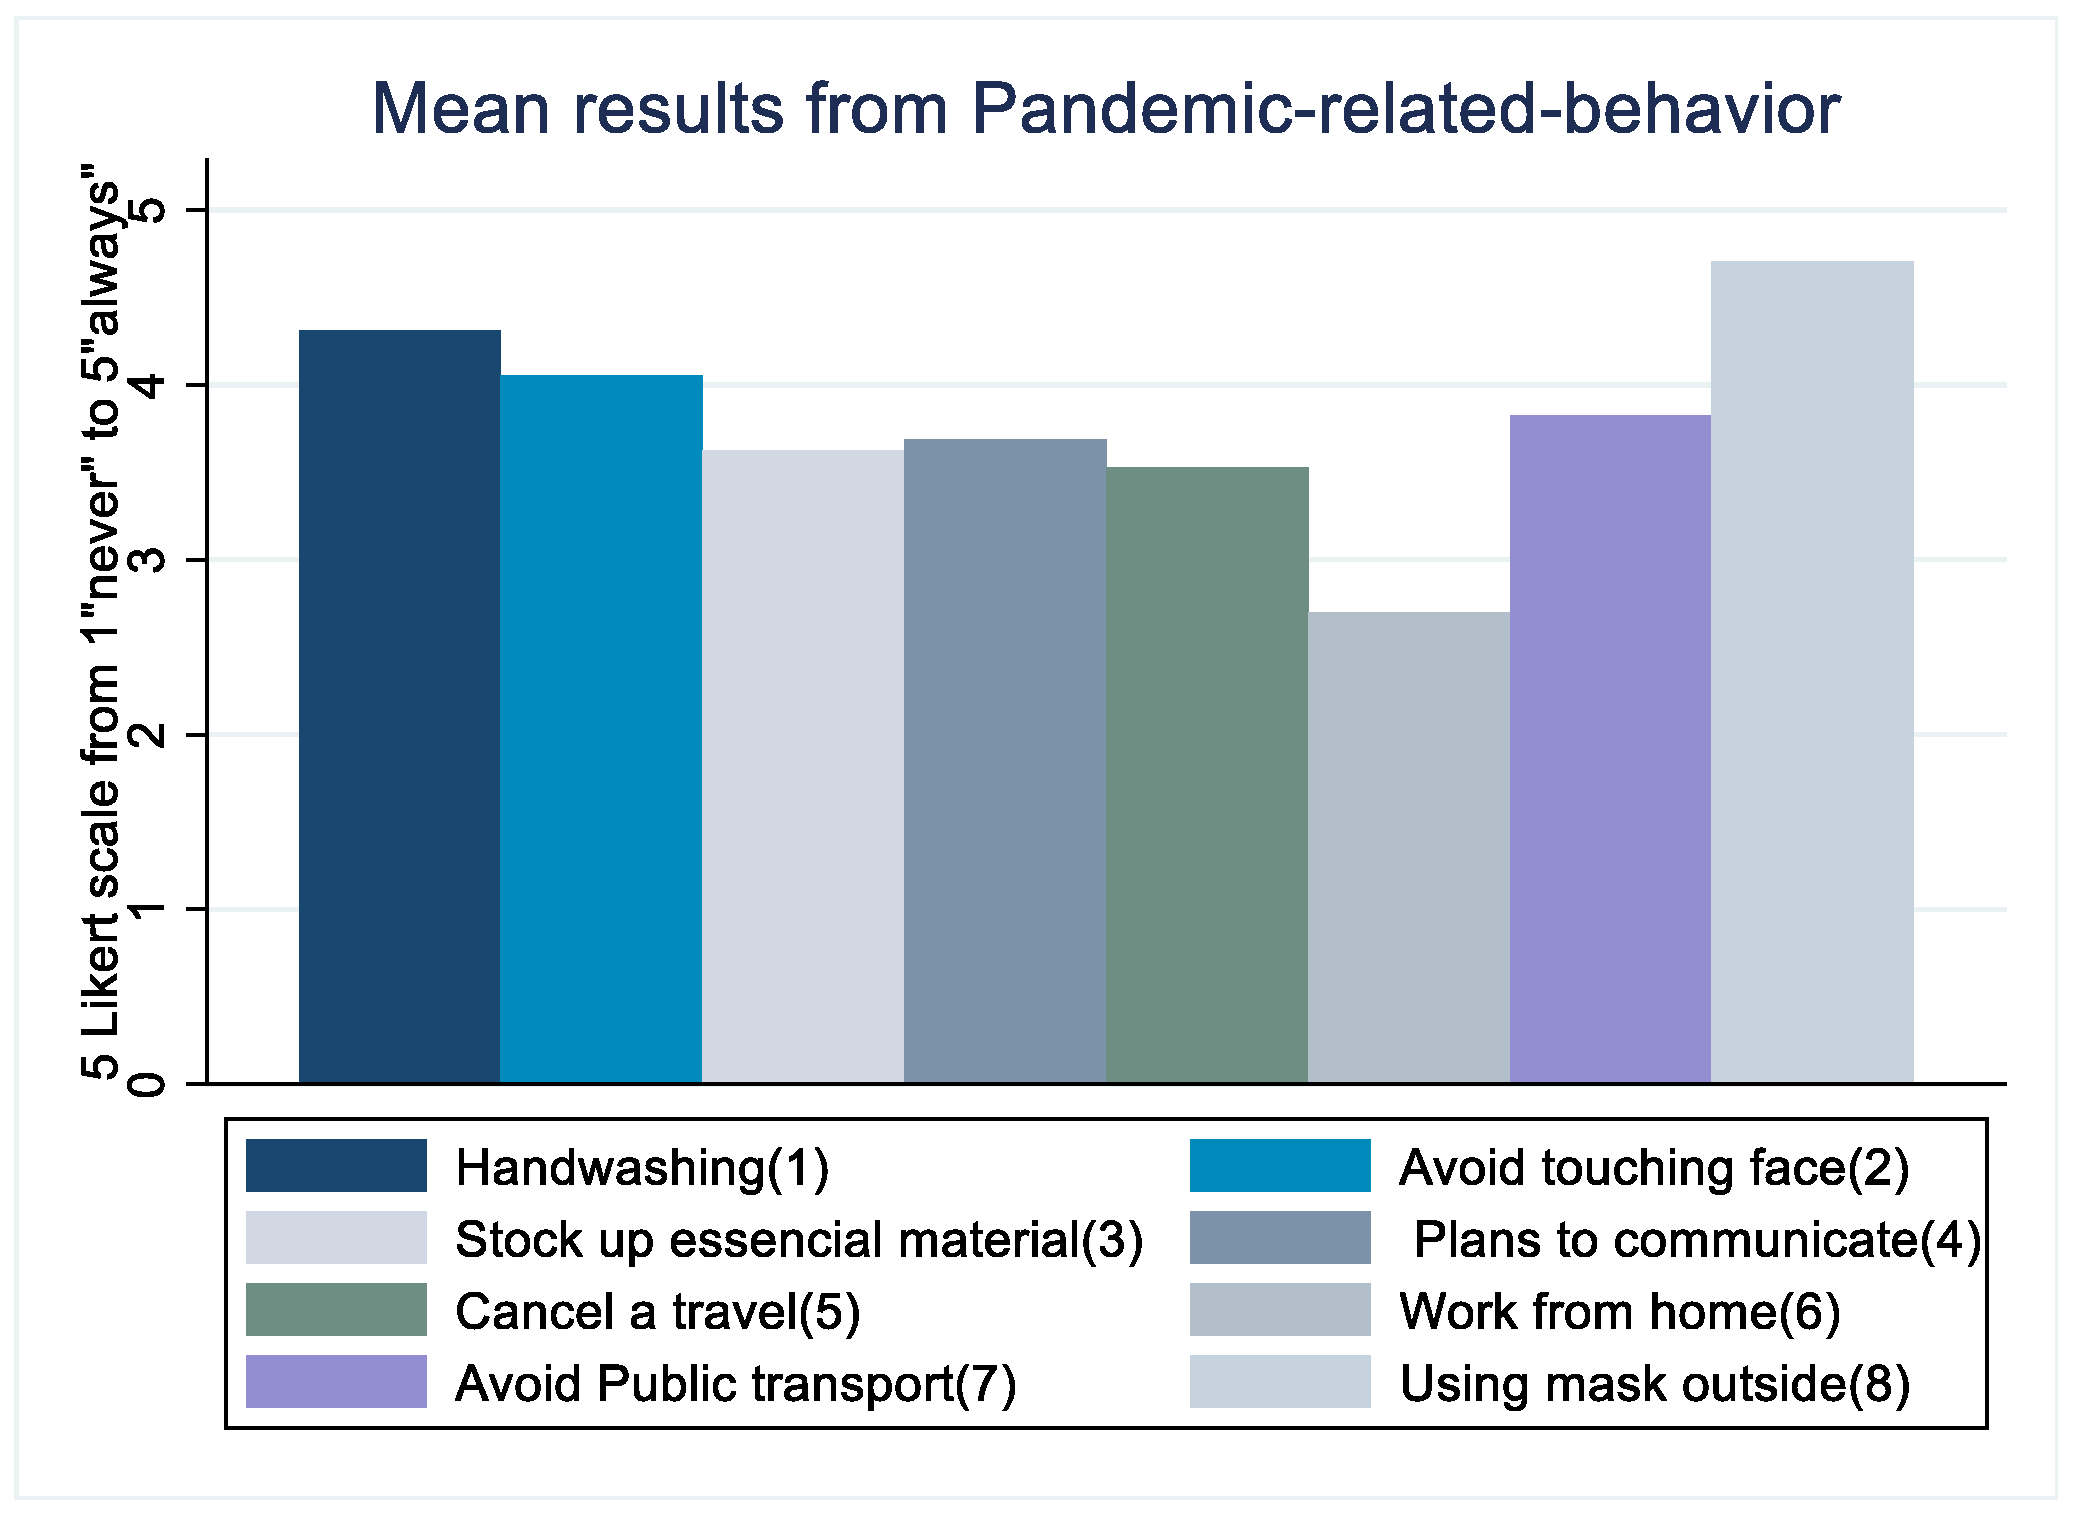
3.5.3. Pandemic-Related Behavior after COVID-19

Table 4 shows that the complete group obtained around 0.6860, which signifies that most of the students practiced these behaviors related to the pandemic (this included washing hands, avoiding crowded places, avoiding touching faces, etc.) often or always. Males and females were statistically different (p-value = 0.0031; male = 0.672599; female = 0.697579). However, students with either lower or medium income showed the same results and there was no statistical difference (p-value = 0.9633; low-income = 0.684783; medium-income = 0.684645).

3.5.4. Pandemic-Related-Behavior Variation

Regarding behavior variation, the whole group increased their pandemic-related behavior score during the COVID-19 pandemic by about 0.3836 score points. In the case of gender, females obtained a higher and significant increase in their behavior compared to males (p-value = 0.000; male = 0.326926; female = 0.435338). On the other hand, students with lower or medium-income did not show a difference in their punctuation increase (p-value = 0.5035; lower-income = 0.394204; medium-income = 0.373619).

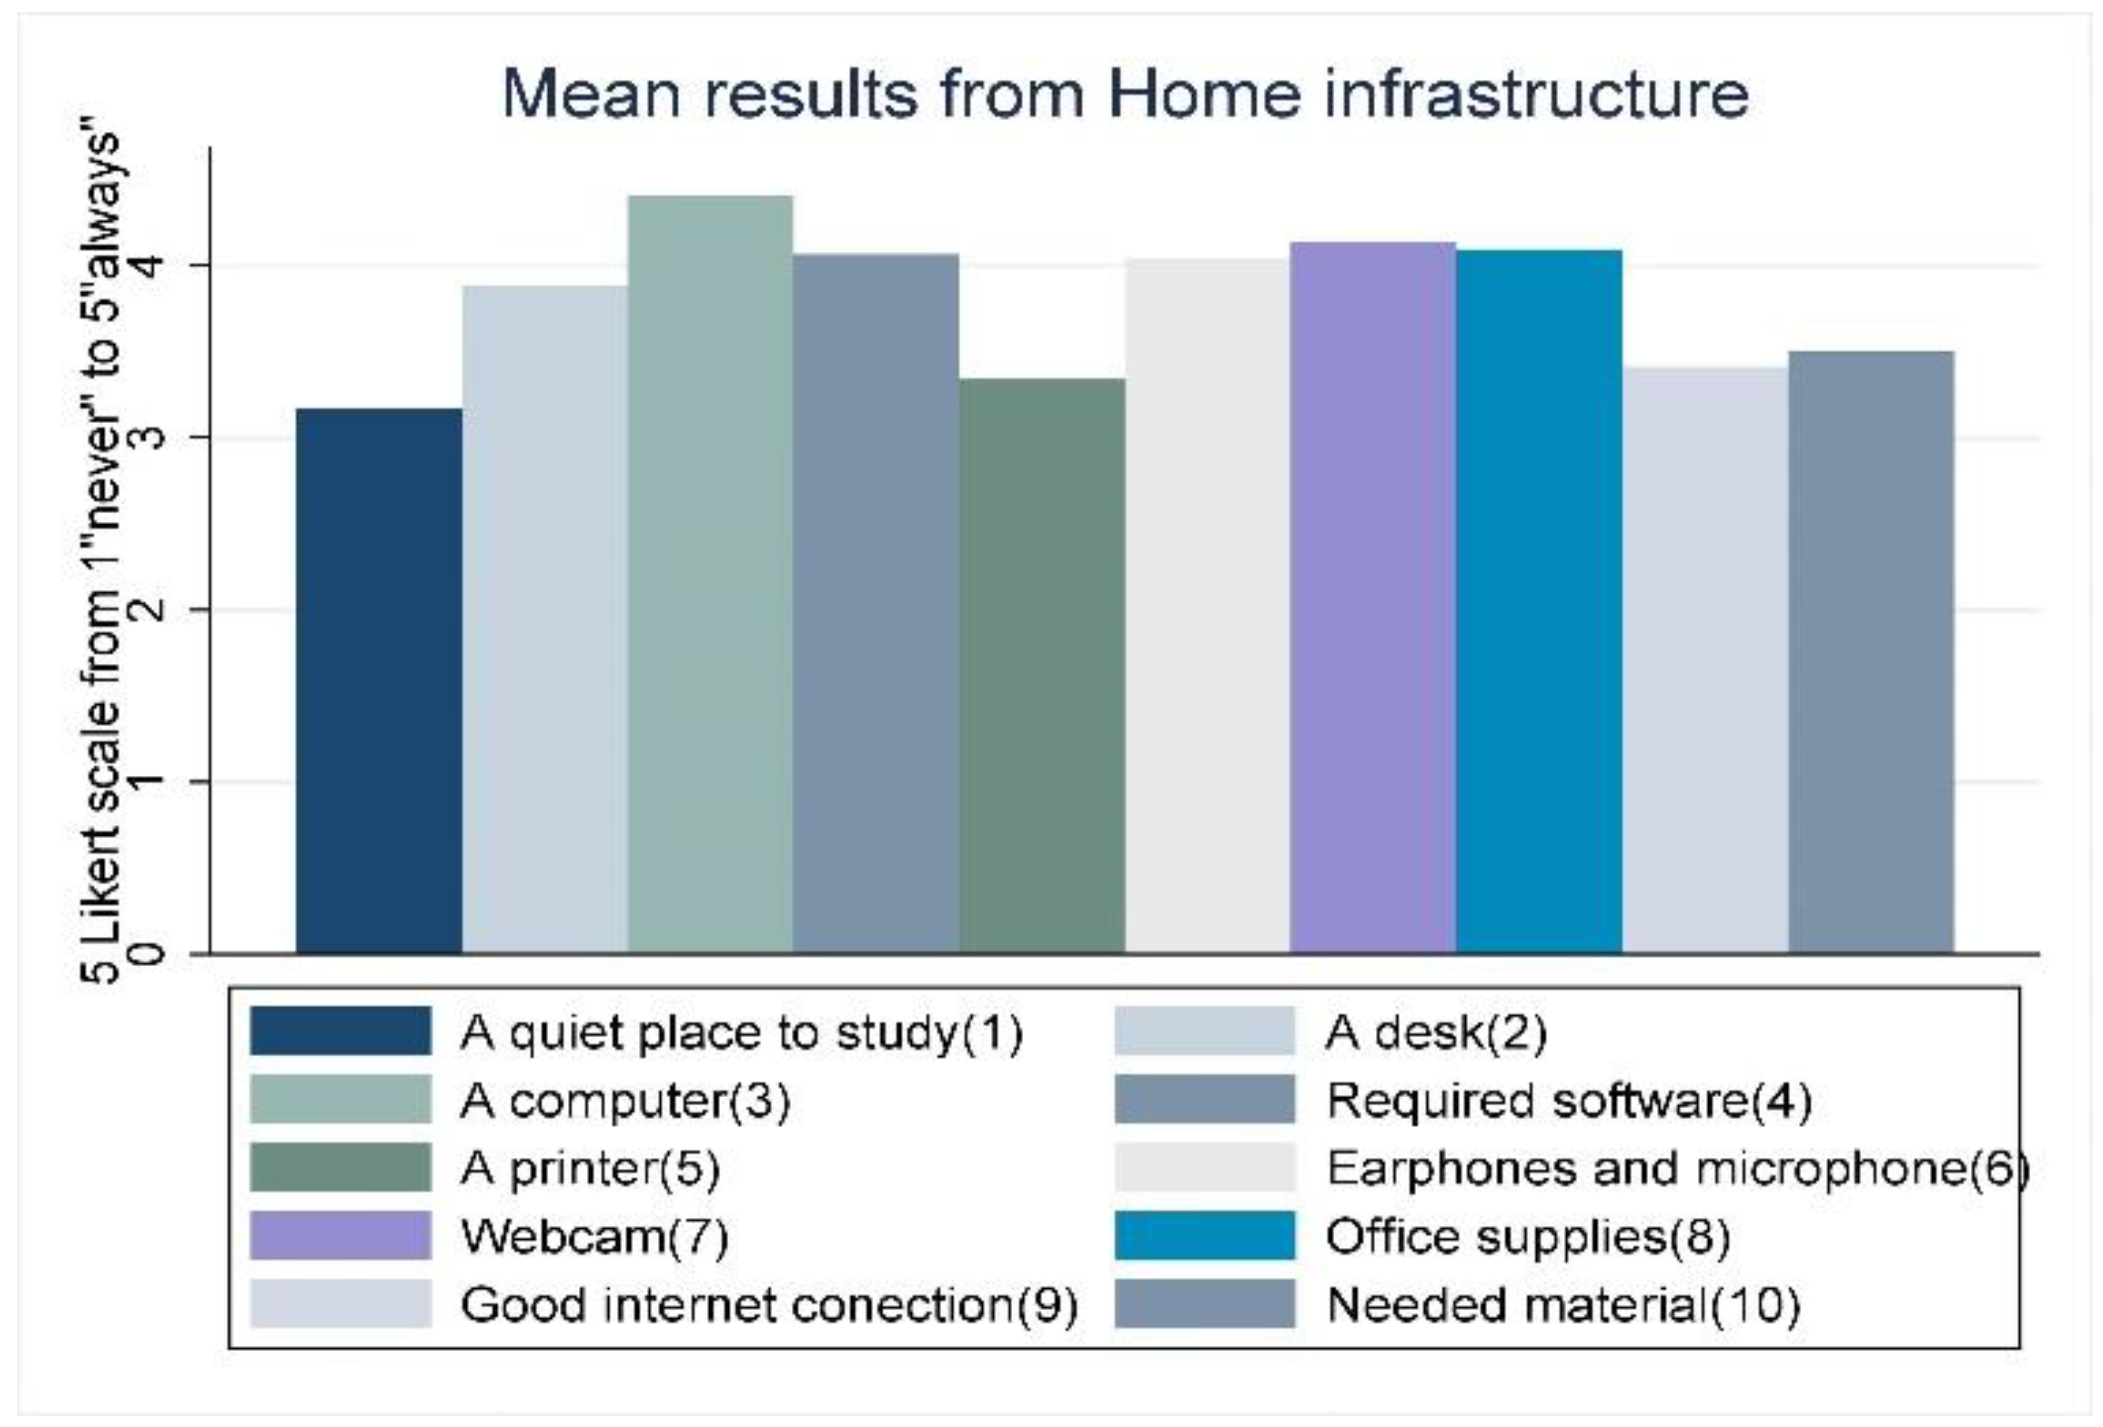
3.5.5. Home Infrastructure

Most university students had no problems with their home infrastructure, having received an average score of 0.75, which means a great number of them always have access to essential supplies at home such as a quiet place, a desk, good internet connection, adequate material, etc. Regarding mean difference groups, at a 5% level of confidence, males and females were not statistically different (p-value = 0.0719; male = 0.769086; female = 0.749828). Nonetheless, as was expected, lower and medium-income students were significantly different when having access to essentials (p-value = 0.000; lower-income = 0.694476; medium-income = 0.801646). See Table 4.

3.6. Multiple Regression Analysis

In Model 4, which fit the best, a multiple regression analysis showed different results when specifying the model differently, especially when taking out the outliers. In Table 5, the net model with only the involved variables (NE, ARE, and NE) showed that the pandemic-related behavior (ARE) score was positively correlated with negative emotions (β = 0.127; p-value = 0.029; 95% IC [0.013:0.241]). Likewise, the home infrastructure item also has a slight correlation but in this case is significant at 10% (β = −0.078; p-value = 0.0064; 95% IC [−0.160:0.005]). On the other hand, once some demographic variables were added to the regression analysis, Pandemic-related-behavior diminished its significance (β = 0.109; p-value = 0.065; 95% IC [−0.0007:0.224]) being now statistically significant at a 10% confidence, instead of the 5% of the first regression. In the case of home infrastructure, the variable was slightly more significant than in the first model but still at 10% (β = −0.086; p-value = 0.059; 95% IC [−0.174:0.003]). In addition, demographic variables used as complements in this analysis did not show statistical significance at 5%. However, gender (reference; female = 1) was statistically significant at 10% confidence (β = 0.025; p-value = 0.055; 95% IC [−0.001:0.051]) See Table 5.
A model without taking the outliers seems to be the best for this analysis since these values are important. The reason is that respondents who obtained the highest or the least possible punctuation are those who are usually more affected. For instance, this is the case of students who have the highest punctuation (1.00); those are the most affected, therefore, those results are important.
The case of the net model without outliers was different. Variable ARE is not significant (β = 0.106; p-value = 0.105; 95% IC [−0.022:0.235]), and home infrastructure now turned into significant at 5% (β = −0.092; p-value = 0.044; 95% IC [−0.182:−0.003]). Otherwise, when adding demographic variables, home infrastructure improved its significance being at the same level of confidence (β = −0.119; p-value = 0.015; 95% IC [−0.215:−0.024]) and the statistical significance of BA remained the same (β = −0.119; p-value = 0.015; 95% IC [−0.215:−0.024]). Additionally, none of the demographic variables were statistically significant. See Table 5.

4. Discussion

COVID-19 has affected university students in several ways around the world. As seen in this study, some common issues have been psychological problems, behavioral factors, and home infrastructure [7,15,46,48]. For psychological issues, many methods, instruments, or surveys have been applied in various studies to detect the most common emotional problems. Instruments such as Dass-21 [18,19], PHQ-9 [23], GAD-7 [21], OR HADS [22] have been proved to be better instruments than the ones used in the current research to assess emotional factors such as stress, anxiety, and depression, which are the most common psychological issues found in the literature. Therefore, there is still room for improvement in the instrument used in this research for assessing similar aspects (Negative emotions; Cronbach’s alpha = 0.83). Even if it is a good instrument with good results, the other questionnaires are better because they are specialized in a specific problem, and they usually have a Cronbach’s alpha higher than 0.9 [18,21,22,23].
The R-squares of some variables from the SEM model were moderate, especially some from negative emotions and home infrastructure; however, many variables of the responsible behavior were low, which is also a disadvantage compared to instruments other instruments such as those mentioned above.

4.1. Proportions Comparison

Regarding psychological problems, Ecuadorian university students seem to be affected differently than other students over the world. They did not experience emotional issues as in several other countries; however, there were few similarities in others [15,16,17,38,46,48]. In the case of Ecuadorian university students, an average of about 60% to 70% of the sample have suffered from negative emotions, nonetheless, and around 15% to 20% of the sample have strongly suffered from it. This number is not too high compared to other results over the world. There is the case of some countries in the Middle East where around 30% of university students had a prevalence of anxiety, and it remained almost the same percentage for other psychological-related issues [34,35]. This way, Ecuadorian university students performed better than in countries such as Egypt, where around 50% of students suffered from anxiety and other related emotional problems reached more than 70% of the students [20]. Apart from this, developed Asian countries such as China and Japan also suffered from similarly high levels of psychological suffering [16,37].
On the contrary, students in some other more developed countries like the Unites Stated or even European nations have demonstrated being more prepared to deal with emotional issues. In many of these countries, high levels of negative emotions affected around 10% to 15% of college students [7,15]. This is less than in the current work. Additionally, some other developed countries reported that around 20% to 30% of university students said they experienced anxiety, but they did not specify how severe it was. This was the case in Canada, for example [72].
When talking about home infrastructure problems, Ecuadorian university students showed good conditions compared to other countries, especially non-developed countries. It is a common finding that in several developing countries, more than 40% of students do not have a separate place to study at home and have some problems with online lessons [35,46]. In India, a study could even find that more than 80% of college students received their classes on a smartphone and not a laptop [46]. In the present study, on average, more than 80% of university students affirmed they always or almost always have the necessary infrastructure at home. The average score per every variable of home infrastructure was around 0.8 out of 1 or more, which means students overall do not have considerable problems. Results were even like scores regarding good conditions of students, obtained in developed countries such as the United States or Germany [48].

4.2. Significant Impact Comparison

Regarding the main aspects that may affect suffering psychological issues, the present study did not considerably differ from the most common results in the literature. However, concerning negative emotions, the results are not the most common in the literature. Males’ and females’ negative emotions did not appear to be significantly different during the pandemic at a 1% level of confidence. Research related to this problem over the world has found that women are usually more psychologically affected than men [7,17,20,34,35,38]. This is something quite common either in a developed or non-developed country. The United States and Egypt are just examples where women usually have higher levels of emotional issues [7,20].
Furthermore, there are some similitudes with the literature regarding variables that influence suffering from emotional issues. In the present study, pandemic-related behaviors such as handwashing and avoiding crowded places, which are part of the construct of behavior, were positively correlated with negative emotions. A higher and good home infrastructure was negatively correlated with negative emotions at least at a 10% level of significance (without demographic variables in the regression). Contrasting these results, in some literature abroad, several behaviors related to the pandemic are also correlated with more psychological issues, where handwashing is usually a quite common behavior analyzed [19,73]. This may be because practicing these activities more often, explains that we are experiencing a pandemic; therefore, the pandemic itself is probably causing people to be more anxious, worried, experiencing depression, etc.
In addition to this, the relationship between demographic factors and negative emotions, using multiple regression showed not to be quite like the most common literature. While in the present study both main demographic factors, gender, and family income, plus the other two chosen to analyze, zone of living and previous online experience, were not significant when relating them to negative emotions, the most common research has usually found a significant correlation between demographic factors and negative emotions [7,17,20,34,35,38]. For instance, in some countries, being above or below average income and living in urban areas are usually correlated with psychological health [7,17,20]. Nonetheless, there are still some similar results in other studies where there is no relationship, especially when talking about gender, but they are too few [44,45].

4.3. Contributions

Currently, there is not much literature related to the COVID-19 impact on university students in Ecuador, and there is still a lack of it in some countries in Latin America. Additionally, this study also contributes to demographic analysis, to see if there is any demographically significant difference concerning situations that have happened to university students during the current pandemic. This study also contributes joining to a wide range of results that have been found in other continents regarding negative emotions and situations related to pandemics. In addition, the survey that was used is not one of the most used in the literature. It is almost new since it was adapted from the European student’s union survey [7].
The current findings in the present study significantly support the development of Latin American regions with respect to pandemic issues, such as possible future problems with students’ mental health and behaviors, anticipations of future crises, better decision making for specific demographic variables, or to have a wide view of the possible implications and causes involved in the psychology of a student during a global concern. Current findings can help to better deal with social situations in Latin America overall.
Furthermore, some analyses carried out in the current study may contribute to future research. The confirmatory factor analysis and structural equation model performed in this study give a general idea of how good the questionnaires used are. Therefore, it may be possible to use the ones that showed excellent results as instruments and maybe improve those which were not.
Additionally, analyses related to multiple regression are not usually carried out in Latin America, especially regarding this kind of topic. Therefore, even when the multiple regression analysis performed here cannot be interpreted as causality because many of the assumptions were not fulfilled, it still can give a good idea of how the variables involved might be related.

4.4. Limitations and Future Work

The instrument used and adapted in the current research is good, but the fit indices were not the best. It is far from being as excellent as other questionnaires, especially when talking about psychological issues; this may be because those other questionnaires are more specialized toward a single problem, for example, the GAD-7 survey just assesses anxiety. In addition, most of the sample collected was from ESPOL Polytechnic University; hence, the analysis might be biased to infer students from this university, even when the purpose was to analyze Ecuadorian university students.
R-squares obtained from the SEM model were not high, therefore, the interpretation of the results might not be as accurate as other questionnaires. The clearer limitation lies in the responsible behavior after the pandemic, were the R-squares were considerably low, as in the negative emotions and home infrastructure were moderate.
It is important to mention, that data was mainly obtained by asking self-perceptions which inevitably provokes subjectivity in the answers because of any desirability biases. A more accurate and precise study could find some objective variables such as grade, general performance, etc.
Unfortunately, students who did not have access to the internet and a proper electronic device could not be reached due to the online format of the survey. Future research might be focused on making a stronger effort to obtain a more representative sample. Furthermore, some demographic variables such as gender diversity could not be analyzed and compared because of the considerably fewer answers.
Better variables could have contributed to explaining pandemic-related behaviors. In the case of using pandemic-related behaviors as a possible predictor of negative emotions, other variables could be used or added to the construct, for example, behaviors more related to negative emotions such as staying all day at home, being aggressive with others, not helping others when needed, etc. Further work in Ecuador might target to find more accurate variables adapted to the research objectives in any specific case.
In addition, not all data or samples behaved in a normal distribution, which sometimes might cause some problems when trying to find significant statistical effects. Moreover, regression analysis cannot have a more acute interpretation since there were some issues. For instance, in the case of the wish of finding causality for behaviors, the variable “home infrastructure” should work as a control variable instead of being correlated or being influenced by “pandemic-related behavior” and vice versa. However, they were both correlated.
Given some of the limitations and contributions of this research, many contextual questions surge from who it may concern, and these questions might be; what now? What can other researchers do to improve the research conditions? What policymakers can help the population deal with such issues? When? When is the better moment to help the students and whoever is in need? In which situations? Where is it possible to apply them?
Future research might be focused on making a stronger effort to obtain a more representative sample and using different variables; overall, to deal with the limitations of this research, which include using a mix of questionnaires to create a more specialized one. Therefore, one of the most important things to take into consideration for researchers when elaborating and developing more about this topic might be for example: using different variables in the questionnaire such as students’ financial attitude, scholarships, and economic situation; obtaining a much more representative sample, also taking into consideration vulnerable people (usually not able to access internet or low-income), make additional statistical analysis and try to compare different demographic variables depending on the needs of their own country. Public entities should incentivize activities to make students socialize and cope with different problems such as those mentioned here. The incentive may also be applied to private education entities to track their students and help them. However, this issue is more common in low-income resources, hence, they are more likely to receive support. As a result of this, it is also encouraged to impulse and support research focused on low-income students for future work.
Mostly, developing countries are places where studies like these are more likely to be applied and compared since Ecuador is a developing country and so there are similarities. There is no perfect moment to issue a new policy or to perform further research, but better as soon as possible, because many students are already suffering from mental issues.

5. Conclusions

Ecuadorian university students’ situation is quite like other students abroad. However, in some factors, results may show some differences depending on the country or the context. As for the first hypothesis, it can be seen that students in Ecuador mostly felt negative emotions. However, those who strongly suffered from it or always were experiencing them were relatively low, with around 15 to 20% of students. This is like some developed countries but not too much compared to most literature. Concerning the influence of demographic factors, referring to the second hypothesis, it is concluded that demographic factors do not significantly influence negative emotions, specifically the ones treated in the present work (gender and income). Nonetheless, regarding pandemic-related behavior, women practiced it more than men. The clearest difference was between students with lower income and medium income concerning home infrastructure, with the highest significant difference.
Furthermore, pandemic-related behaviors could have had something to do with college students’ negative emotions during the pandemic. In addition, it could be seen that having a better infrastructure at home is usually related to feeling fewer psychological issues.
In the world, researchers and policymakers outside Ecuador can compare results, analyze the features of their population, and then take better policies to support their students during a similar crisis, based on some findings of this research. For Ecuador, the findings are even more applicable because the results are a description of the population, since many students sometimes deal with bad emotions, and this makes it a matter of concern. Therefore, mental health, bad feelings, or behavioral-related problems can be avoided in future crises by providing actual and practical solutions to what students need. Additionally, the results from home infrastructure can give an idea about why these issues are prevalent in countries like Ecuador and help public and private institutions to create more incentives to help those few resources.
Additionally, it has been seen that the present study could have improvements in further research in the future. Particularly given the fact that fit indices were not the best and some other questionnaires in the literature were better, especially the ones that assess psychological issues. Indeed, there were some other problems such as the sample parametricity. However, the present study contributes in several ways to the literature, showing how university students were affected and comparing their demographic factors. More studies like this are needed in the literature, especially in Latin America.

Author Contributions

Conceptualization, S.M.M.-P. and A.F.U.; methodology, S.M.M.-P. and A.F.U.; software, A.F.U.; validation, S.M.M.-P.; formal analysis, S.M.M.-P. and A.F.U.; investigation, S.M.M.-P. and A.F.U.; resources, S.M.M.-P.; data curation, S.M.M.-P. and A.F.U.; writing—original draft preparation, A.F.U.; writing—review and editing, S.M.M.-P. and A.F.U.; visualization, S.M.M.-P. and A.F.U.; supervision, S.M.M.-P.; project administration, S.M.M.-P. and A.F.U.; funding acquisition, S.M.M.-P. All authors have read and agreed to the published version of the manuscript.

Funding

This research received no external funding.

Institutional Review Board Statement

ESPOL Polytechnic University does not have a research ethics committee. However, this study was on a national scale, not just focused on ESPOL, and additionally, the questionary applied here, and the data collected was initially used globally in another study in which Ecuador took part in data collection. This Study which fulfills the requirements needed was conducted in accordance with the Declaration of Helsinki and can be found at https://www.sciencedirect.com/science/article/pii/S2352340921009343 (accessed on 15 September 2022).

Informed Consent Statement

Informed consent was obtained from all subjects involved in the study.

Data Availability Statement

The dataset (row data) used in this article is property of the COVID-19 Social Science lab when used in a higher and global study, and can be obtained at https://www.sciencedirect.com/science/article/pii/S2352340921009343 (accessed on 15 September 2022).

Acknowledgments

Thanks to the Ecuadorian university students participating in the current research.

Conflicts of Interest

The authors declare no conflict of interest.

References

  1. Wang, C.; Pan, R.; Wan, X.; Tan, Y.; Xu, L.; McIntyre, R.S.; Choo, F.N.; Tran, B.; Ho, R.; Sharma, V.K.; et al. A longitudinal study on the mental health of general population during the COVID-19 epidemic in China. Brain Behav. Immun. 2020, 87, 40–48. [Google Scholar] [CrossRef]
  2. Padrón, I.; Fraga, I.; Vieitez, L.; Montes, C.; Romero, E. A Study on the Psychological Wound of COVID-19 in University Students. Front. Psychol. 2021, 12, 589927. [Google Scholar] [CrossRef]
  3. da Conceição, V.; Rothes, I.; Gusmão, R.; Barros, H. Depression and anxiety before and during the COVID-19 lockdown: A longitudinal cohort study with university students. MedRxiv 2021. [Google Scholar] [CrossRef]
  4. Zhang, Y.; Zhang, H.; Ma, X.; Di, Q. Mental health problems during the COVID-19 pandemics and the mitigation effects of exercise: A longitudinal study of college students in China. Int. J. Environ. Res. Public Health 2020, 17, 3722. [Google Scholar] [CrossRef]
  5. El Universo. Ecuador confirma primer caso de coronavirus. El Universo, 29 February 2020; 1. [Google Scholar]
  6. Loaiza, Y. La pandemia del coronavirus dejó al Ecuador más de 400.000 nuevos pobres y más de 500.000 empleos perdidos. Infobae, 27 September 2021; 1. [Google Scholar]
  7. Browning, M.H.E.M.; Larson, L.R.; Sharaievska, I.; Rigolon, A.; McAnirlin, O.; Mullenbach, L.; Cloutier, S.; Vu, T.M.; Thomsen, J.; Reigner, N.; et al. Psychological impacts from COVID-19 among university students: Risk factors across seven states in the United States. PLoS ONE 2021, 16, e0245327. [Google Scholar] [CrossRef]
  8. Li, W.W.; Yu, H.; Miller, D.J.; Yang, F.; Rouen, C. Novelty Seeking and Mental Health in Chinese University Students Before, During, and After the COVID-19 Pandemic Lockdown: A Longitudinal Study. Front. Psychol. 2020, 11, 600739. [Google Scholar] [CrossRef] [PubMed]
  9. Bao, X.; Ji, P.; Lin, W.; Perc, M.; Kurths, J. The impact of COVID-19 on the worldwide air transportation network. R. Soc. Open Sci. 2021, 8, 210682. [Google Scholar] [CrossRef]
  10. Wolfe, K.; Sirota, M.; Clarke, A.D.F. Age differences in COVID-19 risk-taking, and the relationship with risk attitude and numerical ability. R. Soc. Open Sci. 2021, 8, 201445. [Google Scholar] [CrossRef]
  11. Riello, M.; Purgato, M.; Bove, C.; MacTaggart, D.; Rusconi, E. Prevalence of post-traumatic symptomatology and anxiety among residential nursing and care home workers following the first COVID-19 outbreak in Northern Italy. R. Soc. Open Sci. 2020, 7, 200880. [Google Scholar] [CrossRef]
  12. Schunk, D.; Wagner, V. What determines the willingness to sanction violations of newly introduced social norms: Personality traits or economic preferences? evidence from the COVID-19 crisis. J. Behav. Exp. Econ. 2021, 93, 101716. [Google Scholar] [CrossRef]
  13. Qin, X.; Yam, K.C.; Ma, G.; Chen, C.; Zhu, H.; Wang, H. The unintended psychological and behavioral drawbacks of big push strategies: Increased psychological entitlement, selfish behavior, and decreased prosocial behavior. J. Behav. Exp. Econ. 2022, 97, 101842. [Google Scholar] [CrossRef]
  14. Faubion, D. What Is Psychological Distress? An Overview [Internet]. 2021. Available online: https://www.betterhelp.com/advice/grief/what-is-psychological-distress-an-overview/ (accessed on 15 September 2022).
  15. Odriozola-González, P.; Planchuelo-Gómez, Á.; Irurtia, M.J.; de Luis-García, R. Psychological effects of the COVID-19 outbreak and lockdown among students and workers of a Spanish university. Psychiatry Res. 2020, 290, 113108. [Google Scholar] [CrossRef] [PubMed]
  16. Zhao, Y. Psychological Impacts of the COVID-19 Outbreak on Chinese International Students: Examining Prevalence and Associated Factors. World J. Educ. Res. 2020, 7, 45. [Google Scholar] [CrossRef]
  17. Islam, M.S.; Sujan, M.S.H.; Tasnim, R.; Sikder, M.T.; Potenza, M.N.; van Os, J. Psychological responses during the COVID-19 outbreak among university students in Bangladesh. PLoS ONE 2020, 15, e0245083. [Google Scholar] [CrossRef]
  18. Akhihiero, E.T. Effect of Inadequate Infrastructural Facilities on Academic Performance of Students of Oredo Local Government Area of Edo State. The Nigerian Academic Forum, 2011; Volume 20. [Google Scholar]
  19. Cortés-Álvarez, N.Y.; Piñeiro-Lamas, R.; Vuelvas-Olmos, C.R. Psychological Effects and Associated Factors of COVID-19 in a Mexican Sample. Disaster Med. Public Health Prep. 2020, 14, 413–424. [Google Scholar] [CrossRef]
  20. Ghazawy, E.R.; Ewis, A.A.; Mahfouz, E.M.; Khalil, D.M.; Arafa, A.; Mohammed, Z.; Mohammed, E.-N.F.; Hassan, E.E.; Hamid, S.A.; Ewis, S.A.; et al. Psychological impacts of COVID-19 pandemic on the university students in Egypt. Health Promot. Int. 2021, 36, 1116–1125. [Google Scholar] [CrossRef]
  21. Spitzer, R.L.; Kroenke, K.; Williams, J.B.W.; Löwe, B. A Brief Measure for Assessing Generalized Anxiety Disorder The GAD-7. Arch. Intern. Med. 2006, 166, 1092–1097. [Google Scholar] [CrossRef] [Green Version]
  22. Spinhoven, P.; Ormel, J.; Sloekers, P.P.A.; Kempen, G.I.J.M.; Speckens, A.E.M.; Van Hemert, A.M. A validation study of the Hospital Anxiety and Depression Scale (HADS) in different groups of Dutch subjects. Psychol. Med. 1997, 27, 363–370. [Google Scholar] [CrossRef] [Green Version]
  23. Lotrakul, M.; Sumrithe, S.; Saipanish, R. Reliability and validity of the Thai version of the PHQ-9. BMC Psychiatry 2008, 8, 46. [Google Scholar] [CrossRef] [Green Version]
  24. Zung, W.W.K. A Rating Instrument For Anxiety Disorders. Psychosomatics 1971, 12, 371–379. [Google Scholar] [CrossRef]
  25. Aslan, I.; Ochnik, D.; Çınar, O. Exploring perceived stress among students in Turkey during the COVID-19 pandemic. Int. J. Environ. Res. Public Health 2020, 17, 8961. [Google Scholar] [CrossRef]
  26. Zurlo, M.C.; Cattaneo Della Volta, M.F.; Vallone, F. COVID-19 Student Stress Questionnaire: Development and Validation of a Questionnaire to Evaluate Students’ Stressors Related to the Coronavirus Pandemic Lockdown. Front. Psychol. 2020, 11, 576758. [Google Scholar] [CrossRef]
  27. Khan, A.H.; Sultana, M.S.; Hossain, S.; Hasan, M.T.; Ahmed, H.U.; Sikder, M.T. The impact of COVID-19 pandemic on mental health & wellbeing among home-quarantined Bangladeshi students: A cross-sectional pilot study. J. Affect. Disord. 2020, 277, 121–128. [Google Scholar]
  28. Tomaszek, K.; Muchacka-Cymerman, A. Thinking about my existence during COVID-19, i feel anxiety and awe—The mediating role of existential anxiety and life satisfaction on the relationship between PTSD symptoms and post-traumatic growth. Int. J. Environ. Res. Public Health 2020, 17, 7062. [Google Scholar] [CrossRef]
  29. Johansyah, M.D.; Sidharta, I. Exploring Trait Emotional Intelligent: Survey on Students during COVID-19. Sci. J. Manag. 2020, 8, 70–77. [Google Scholar] [CrossRef]
  30. Nurunnabi, M.; Hossain, S.F.A.H.; Chinna, K.; Sundarasen, S.; Khoshaim, H.B.; Kamaludin, K.; Baloch, G.M.; Sukayt, A.; Shan, X. Coping strategies of students for anxiety during the COVID-19 pandemic in China: A cross-sectional study. F1000Research 2020, 9, 16. [Google Scholar] [CrossRef]
  31. Risal, A.; Shikhrakar, S.; Mishra, S.; Kunwar, D.; Karki, E.; Shrestha, B.; Khadka, S.; Holen, A. Anxiety and Depression During COVID-19 Pandemic Among Medical Students in Nepal. Res. Sq. 2020, 1–11. [Google Scholar] [CrossRef]
  32. Arënliu, A.; Bërxulli, D.; Perolli-Shehu, B.; Krasniqi, B.; Gola, A.; Hyseni, F. Anxiety and depression among Kosovar university students during the initial phase of outbreak and lockdown of COVID-19 pandemic. Health Psychol. Behav. Med. 2021, 9, 239–250. [Google Scholar] [CrossRef]
  33. Sood, S.; Sharma, A. Resilience and Psychological Well-Being of Higher Education Students During COVID-19: The Mediating Role of Perceived Distress. J. Health Manag. 2020, 22, 606–617. [Google Scholar] [CrossRef]
  34. Aylie, N.S.; Mekonen, M.A.; Mekuria, R.M. The Psychological Impacts of COVID-19 Pandemic Among University Students in Bench-Sheko Zone, South-west Ethiopia: A Community-based Cross-sectional Study. Psychol. Res. Behav. Manag. 2020, 13, 813–821. [Google Scholar] [CrossRef]
  35. Khawar, M.B.; Abbasi, M.H.; Hussain, S.; Riaz, M.; Rafiq, M.; Mehmood, R.; Sheikh, N.; Amaan, H.N.; Fatima, S.; Jabeen, F.; et al. Psychological impacts of COVID-19 and satisfaction from online classes: Disturbance in daily routine and prevalence of depression, stress, and anxiety among students of Pakistan. Heliyon 2021, 7, e07030. [Google Scholar] [CrossRef]
  36. Al-Tammemi, A.B.; Akour, A.; Alfalah, L. Is It Just About Physical Health? An Online Cross-Sectional Study Exploring the Psychological Distress Among University Students in Jordan in the Midst of COVID-19 Pandemic. Front. Psychol. 2020, 11, 562213. [Google Scholar] [CrossRef]
  37. Arima, M.; Takamiya, Y.; Furuta, A.; Siriratsivawong, K.; Tsuchiya, S.; Izumi, M. Factors associated with the mental health status of medical students during the COVID-19 pandemic: A cross-sectional study in Japan. BMJ Open 2020, 10, 7. [Google Scholar] [CrossRef]
  38. Adewale, B.A.; Adeniyi, Y.C.; Adeniyi, O.A.; Ojediran, B.C.; Aremu, P.S.; Odeyemi, O.E.; Akintayo, A.D.; Oluwadamilare, F.A.; Offorbuike, C.B.; Owoeye, I.P. Psychological Impact of COVID-19 Pandemic on Students at the University of Ibadan in Nigeria. J. Educ. Soc. Behav. Sci. 2021, 34, 79–92. [Google Scholar] [CrossRef]
  39. Zhang, S.; Chen Jiyao Yin, A.; Yáñez, J.A. Mental health symptoms during the COVID-19 pandemic in developing countries: A systematic review and meta-analysis. J. Glob. Health 2022, 12, 05011. [Google Scholar]
  40. Rosli, M.S.; Saleh, N.S. Technology enhanced learning acceptance among university students during COVID-19: Integrating the full spectrum of Self-Determination Theory and self-efficacy into the Technology Acceptance Model. Curr. Psychol. 2022, 1–20. [Google Scholar] [CrossRef]
  41. Stolk, J.D.; Gross, M.D.; Zastavker, Y.V. Motivation, pedagogy, and gender: Examining the multifaceted and dynamic situational responses of women and men in college STEM courses. Int. J. STEM Educ. 2021, 8, 1–19. [Google Scholar] [CrossRef]
  42. Baena-Diéz, J.M.; Barroso, M.; Cordeiro-Coelho, S.I.; Diáz, J.L.; Grau, M. Impact of COVID-19 outbreak by income: Hitting hardest the most deprived. J. Public Health 2020, 42, 698–703. [Google Scholar] [CrossRef]
  43. Carroll, N.; Sadowski, A.; Laila, A.; Hruska, V.; Nixon, M.; Ma, D.W.; Haines, J.J.; on behalf of the Guelph Family Health Study. The Impact of COVID-19 on Health Behavior, Stress, Financial and Food Security among Middle to High Income Canadian Families with Young Children. Nutrients 2020, 12, 2352. [Google Scholar] [CrossRef]
  44. Conrad, R.C.; Hahm, H.C.; Koire, A.; Pinder-Amaker, S.; Liu, C.H. College student mental health risks during the COVID-19 pandemic: Implications of campus relocation. J. Psychiatr. Res. 2021, 136, 117–126. [Google Scholar] [CrossRef]
  45. Akhtarul Islam, M.; Barna, S.D.; Raihan, H.; Nafiul Alam Khan, M.; Tanvir Hossain, M. Depression and anxiety among university students during the COVID-19 pandemic in Bangladesh: A web-based cross-sectional survey. PLoS ONE 2020, 15, e0238162. [Google Scholar]
  46. Kapasia, N.; Paul, P.; Roy, A.; Saha, J.; Zaveri, A.; Mallick, R.; Barman, B.; Das, P.; Chouhan, P. Impact of lockdown on learning status of undergraduate and postgraduate students during COVID-19 pandemic in West Bengal, India. Child. Youth Serv. Rev. 2020, 116, 105194. [Google Scholar] [CrossRef] [PubMed]
  47. Kemi, M.F.; Chijioke, U. Personal Study, Peer Engagement and Learning Infrastructure Access During COVID-19 Shock: Implication for Rural Based-University Students’ in 4Ir. e-BANGI 2021, 18, 230–243. [Google Scholar]
  48. Küsel, J.; Martin, F.; Markic, S. University Students’ Readiness for Using Digital Media and Online Learning—Comparison between Germany and the USA. Educ. Sci. 2020, 10, 313. [Google Scholar] [CrossRef]
  49. Aristovnik, A.; Keržič, D.; Ravšelj, D.; Tomaževič, N.; Umek, L. Impacts of the COVID-19 pandemic on life of higher education students: A global perspective. Sustainability 2020, 12, 8438. [Google Scholar] [CrossRef]
  50. Audemard, J. Objectifying Contextual Effects. The Use of Snowball Sampling in Political Sociology. BMS Bull. Sociol. Methodol./Bull. Methodol. Sociol. 2020, 145, 30–60. [Google Scholar]
  51. von der Fehr, A.; Sølberg, J.; Bruun, J. Validation of networks derived from snowball sampling of municipal science education actors. Int. J. Res. Method Educ. 2018, 41, 38–52. [Google Scholar] [CrossRef]
  52. Association, E.U. The European University Association [Internet]. 2020. Available online: https://eua.eu/partners-news/492-esu’s-survey-on-student-life-during-the-COVID-19-pandemic.html (accessed on 15 September 2022).
  53. University of Ljubljana. One Click Survey [Internet]. 2019. Available online: https://www.1ka.si/d/en/about/general-description (accessed on 15 September 2022).
  54. Bonett, D.G.; Wright, T.A. Cronbach’s alpha reliability: Interval estimation, hypothesis testing, and sample size planning. J. Organ. Behav. 2015, 36, 3–15. [Google Scholar] [CrossRef]
  55. Fornell, C.; Larcker, D.F. Evaluating structural equation models with unobservable variables and measurement error. J. Mark. Res. 1981, 18, 39–50. [Google Scholar] [CrossRef]
  56. Gerbing, D.W.; Hamilton, J.G. Viability of exploratory factor analysis as a precursor to confirmatory factor analysis. Struct. Equ. Model. 1996, 3, 62–72. [Google Scholar] [CrossRef]
  57. Keržič, D.; Alex, J.K.; Pamela Balbontín Alvarado, R.; Bezerra, D.D.S.; Cheraghi, M.; Dobrowolska, B.; Fagbamigbe, A.F.; Faris, M.E.; França, T.; González-Fernández, B.; et al. Academic student satisfaction and perceived performance in the e-learning environment during the COVID-19 pandemic: Evidence across ten countries. PLoS ONE 2021, 16, e0258807. [Google Scholar] [CrossRef]
  58. Schermelleh-Engel, K.; Moosbrugger, H.; Müller, H. Evaluating the fit of structural equation models: Tests of significance and descriptive goodness-of-fit measures. MPR-Online 2003, 8, 23–74. [Google Scholar]
  59. Westland, J.C. An introduction to structural equation models. Stud. Syst. Decis. Control. 2015, 22, 1–8. [Google Scholar]
  60. Hair, J.F., Jr.; Anderson, R.E.; Tatham, R.L.B. Multivariate Data Analysis, 7th ed.; Pearson Educational International: Upper Saddle River, NJ, USA, 2010; Available online: https://imaging.mrc-cbu.cam.ac.uk/statswiki/FAQ/Simon (accessed on 15 September 2022).
  61. Langer, W., Dr. How to Use Stata’s Sem Command with Nonnormal Data? A New Nonnormality Correction for the RMSEA, CFI and TLI; Martin-Luther-University Halle-Wittenberg: Halle, Germany, 2019. [Google Scholar]
  62. Kaplan, D. Structural Equation Modeling. In International Encyclopedia of the Social & Behavioral Sciences; Elsevier: Amsterdam, The Netherlands, 2001; pp. 15215–15222. [Google Scholar]
  63. Chyung, S.Y.Y.; Roberts, K.; Swanson, I.; Hankinson, A. Evidence-Based Survey Design: The Use of a Midpoint on the Likert Scale. Perform. Improv. 2017, 56, 15–23. [Google Scholar] [CrossRef] [Green Version]
  64. Altman, E.I.; Haldeman, R.G.; PNarayanan, P. ZETATM analysis A new model to identify bankruptcy risk of corporation. J. Bank. Financ. 1977, 1, 29–54. [Google Scholar] [CrossRef]
  65. Shapiro, S.S.; Francia, R.S. An Approximate Analysis of Variance Test for Normality. J. Am. Stat. Assoc. 1972, 67, 215–216. [Google Scholar] [CrossRef]
  66. Boakye Oppong, F.; Yao Agbedra, S. Assessing Univariate and Multivariate Normality, A Guide For Non-Statisticians. Math. Theory Model. 2016, 6, 26–33. [Google Scholar]
  67. Gosset, W.S. The probable error of a mean. Biometrika 1908, 6, 1–25. [Google Scholar] [CrossRef]
  68. Nagarajan, N.; Keich, U. Reliability and efficiency of algorithms for computing the significance of the Mann-Whitney test. Comput. Stat. 2009, 24, 605–622. [Google Scholar] [CrossRef]
  69. Aiken, L.S.; West, S.G.; Pitts, S.C. Multiple Linear Regression. In Handbook of Psychology; John Wiley & Sons, Inc.: Hoboken, NJ, USA, 2003. [Google Scholar]
  70. Atinc, G.; Simmering, M.J.; Kroll, M.J. Control variable use and reporting in macro and micro management research. Organ. Res. Methods 2012, 15, 57–74. [Google Scholar] [CrossRef]
  71. Hair, J.F.; Ringle, C.M.; Sarstedt, M. PLS-SEM: Indeed a silver bullet. J. Mark. Theory Pract. 2011, 19, 139–152. [Google Scholar] [CrossRef]
  72. Hamza, C.A.; Ewing, L.; Heath, N.L.; Goldstein, A.L. When social isolation is nothing new: A longitudinal study on psychological distress during COVID-19 among university students with and without preexisting mental health concerns. Can. Psychol. 2021, 62, 20–30. [Google Scholar] [CrossRef]
  73. Sharma, M.; Batra, K.; Davis, R.E.; Wilkerson, A.H. Explaining Handwashing Behavior in a Sample of College Students during COVID-19 Pandemic Using the Multi-Theory Model (MTM) of Health Behavior Change: A Single Institutional Cross-Sectional Survey. Healthcare 2021, 9, 55. [Google Scholar] [CrossRef] [PubMed]
Figure 1. Structural Equation Model.
Sustainability 14 13123 g001
Figure 2. Negative emotions mean.
Sustainability 14 13123 g002
Figure 3. Pandemic-related behaviors (After) mean.
Sustainability 14 13123 g003
Figure 4. Home infrastructure mean.
Sustainability 14 13123 g004
Figure 5. Construct by gender and family income mean.
Sustainability 14 13123 g005
Table 1. Fit indices. Full individual tests.
Full TestNegative Emotions
(NE)
Behavior before
(BRE)
Behavior after
(ARE)
Behavior Variation
(VRE)
Home Infrastructure
(HI)
Fit IndicesM1: (var Taken as Given)M2: (Taking off Non-Significant)M3: (with Variation)M4: with “After Pandemic”
Chi-square (value)2551.262081.63773.33875.6258.46123.98141.6692.18371.38
Chi-square (p-value)0.00 ***0.00 ***0.00 ***0.00 ***0.00 ***0.00 ***0.00 ***0.00 ***0.00 ***
Chi-square/df4.344.553.103.526.506.207.084.6110.61
CFI0.710.750.900.880.970.800.840.910.89
TLI0.690.720.880.860.950.710.780.870.86
SRMR0.0720.070.0490.0530.0290.0580.0540.040.05
RMSEA0.0670.0690.0530.0580.080.080.090.070.11
Cronbach’s Alpha0.700.730.760.760.830.530.660.710.86
Chi-square/Degrees of freedom (better close to 1) CFI—Comparative fit index (better 1 or close), TLI—Tucker–Lewis’s index (better 1 or close), SRMR—Standardized Root mean square residual (better 0 or close), RMSEA—Root mean square error of approximation (better 0 or close). *** p < 0.001.
Table 2. (SEM) Covariance significance.
M3NEVREHIM4NEAREHI
NE1 NE1
VRE0.8651 ARE0.035 *1
HI0.041 *0 ***1HI0.04 *0 ***1
*** p < 0.001; * p < 0.05.
Table 3. SEM’S R-square.
QuestionCoefficientsR2Interpretation
NEQ25d0.770.59Moderate
Q25e0.730.53Moderate
Q25f0.790.62Moderate
Q25g0.490.24Weak
Q25i0.790.62Moderate
Q25j0.410.17Very weak
AREQ38a_20.540.29Weak
Q38c_20.480.23Weak
Q38d_20.570.32Weak
Q38f_20.480.23Weak
Q38h_20.450.20Weak
Q38j_20.270.07Very weak
Q38k_20.500.25Weak
Q38l_20.440.19Weak
HIQ21a0.580.34Moderate
Q21b0.590.35Moderate
Q21c0.710.50Moderate
Q21d0.710.50Moderate
Q21e0.460.21Weak
Q21f0.630.40Moderate
Q21g0.660.44Moderate
Q21h0.630.40Moderate
Q21i0.580.34Moderate
Q21j0.590.35Moderate
Table 4. Descriptive and inferential statistics.
VariableCategoryGroupsMeanMean Differences between Groups
ParametricNon-Parametric
Negative emotions
(NE)
gendermale0.5584640.0384 *
female0.58425
incomelow income0.5778940.5969
medium income0.57086
complete group0.575259
Behavior after COVID-19
(ARE)
gendermale0.672599 0.0031 **
female0.697579
incomelow income0.684783 0.9633
medium income0.684645
complete group0.686074
Behavior variation
(VRE)
gendermale0.326926 0 ***
female0.435338
incomelow income0.394204 0.5035
medium income0.373619
complete group0.38366
Home Infrastructure
(HI)
gendermale0.769086 0.0719
female0.749828
incomelow income0.694476 0 ***
medium income0.801646
complete group0.75935
The last two columns represent Parametric sample(t-test)-p-value/non-parametric sample (U-Mann Whitney test)-p-value. *** p < 0.001; ** p < 0.01; * p < 0.05.
Table 5. Multiple Regression Analysis, Pandemic-related-behavior Impact on Negative emotions.
VariablesCategoryβp-ValueCI (95%)
Model 4 (With outliers)
Behavior After (ARE)0.1270.029 *0.0130.241
Home infrastructure (HI)−0.0780.064−0.1600.005
_constant0.5460.000 ***0.4560.637
A model with demographic variables
Behavior After (ARE)0.1090.065−0.0070.224
Home infrastructure (HI)−0.0860.059−0.1740.003
Family Income
low-income (1)−0.0080.564−0.0370.020
Other (0)
Online learning experience
Previous experience (1)−0.0090.544−0.0390.021
No (0)
Zone of living
Urban(centric) (1)0.0050.673−0.0200.031
Other (0)
Gender
Female (1)0.0250.055−0.0010.051
Male (0)
Constant 0.5250.000 ***0.4230.626
Model 4 (Without outliers)
Behavior After (ARE)0.1060.105−0.0220.235
Home infrastructure (HI)−0.0920.044 *−0.182−0.003
_constant0.5580.000 ***0.4520.663
A model with demographic variables
Behavior After (ARE)0.1000.132−0.0300.231
Home infrastructure (HI)−0.1190.015 *−0.215−0.024
Family Income
low income (1)−0.0160.233−0.0440.011
Other (0)
Online learning experience
Previous experience (1)−0.0170.258−0.0450.012
No (0)
Zone of living
Urban(centric) (1)0.0110.393−0.0140.035
Other (0)
Gender
Female (1)0.0180.149−0.0060.042
Male (0)
constant
0.5730.000 ***0.4410.669
*** p < 0.001; * p < 0.05.
Publisher’s Note: MDPI stays neutral with regard to jurisdictional claims in published maps and institutional affiliations.

