Article

The Rapid and Participatory Assessment of Land Suitability in Development Cooperation

Department of Agricultural and Environmental Sciences, Production, Landscape, Agroenergy, University of Milan, 20133 Milan, Italy
*
Author to whom correspondence should be addressed.
Sustainability 2022, 14(20), 13049; https://doi.org/10.3390/su142013049
Submission received: 7 September 2022 / Revised: 24 September 2022 / Accepted: 30 September 2022 / Published: 12 October 2022

Abstract

:
Development cooperation in agriculture aims to contribute to the achieving of a large part of the Sustainable Development Goals (SDGs) of the UN 2030 Agenda, especially the first three, No Poverty (1), Zero Hunger (2), and Good Health and Well-being (3). Development cooperation in agriculture tries to help local communities to increase their awareness, participation, and skills about the management of land and environmental resources, in order to realize sustainable development. In this context, methods of participatory assessment of land suitability have been widely and successfully applied. The present research took place in the framework of a real development cooperation intervention in Nord Kivu (Democratic Republic of Congo) and aimed to implement a rapid participatory assessment of land suitability. In this context, where official and detailed data are not available, the study fostered the active involvement of local experts and used geographical information systems (GIS) to identify the most suitable crops to be supported in different zones of the study area. Toward this aim, the authors used a procedure based on the following steps: the identification of relevant land use types (LUTs), mapping capability factors, describing the responses of each LUT to the different capability factors, mapping potential land suitability for the LUTs, mapping accessibility, mapping land suitability for the LUTs. Resulting maps and tables were used to identify the most suitable areas for the different uses. Globally, forestry was the most suited use (99.6% of the study area is potentially highly suitable), followed by the cropping of manioc, sorghum, banana, oil palm, bean and cattle grazing in decreasing order (62.6% of the study area is potentially highly suitable for grazing). When accessibility is considered, forestry presents the largest decrease in the class of high potential suitability (−34.9% equal to a loss of 24,945.5 ha), while less adaptable uses, such as cattle grazing showed lower decreases in highly suitable class (−11.2%) and larger increases in scarcely suitable class (+9.5%). At a later stage, the comparison between computed suitability and actual land use helped with identifying the areas where forestry should be the only (or most) supported activity and the areas where to push integrated land uses. Our interpretation of the results allows us to recommend the adoption of agroforestry and intercropping as the main methodologies to integrate multiple aims such as the environmental conservation and the improvement of livelihoods.

1. Introduction

Land suitability assessment is a method of land evaluation that enables decision makers to determine which type of land use is most appropriate for a particular location [1] and to develop accordingly a crop management system for increasing land productivity [2], in order to enhance the ecosystem services provided [3]. In recent years, land-use suitability has gained the widest diffusion as a decision support system in the evaluation of agricultural land [4], in the determination of land habitats for animal and plant species [5], in landscape evaluation and planning [6], and in regional planning and environmental impact assessment [7,8,9].
If land suitability assessment is used in participatory land use planning, it may be useful for avoiding environmental conflicts by the segregation of competing land uses [10,11,12,13]. When land suitability is used to inform evidence-based decisions about land use and consequent socioecological evolution of a given territorial system, land suitability assessment have to take in consideration both agronomical and logistic factors. In fact, land accessibility analysis allows to understand the difference between the potential, i.e., agronomical, land suitability and the real use potential of land in rural areas [14,15].
This is especially useful in agricultural development cooperation (DC) where initiatives normally take place in rural communities where the management of resources such as land or water is to be improved in order to augment the wellbeing of the population [16].
In such a specific context, participatory land suitability evaluation, with the use of geographical information systems (GIS) technology, has been applied widely and successfully [17,18,19,20,21], mainly for practical and structural reasons. Firstly, agri-environmental and regional planning issues are the typical targets of participative and multicriteria decision-making procedures as they involve community resource planning and multidisciplinary knowledge [22]. Consequently, DC practitioners need tools that helps to involve multiple stakeholders, or multiple disciplines, and to integrate the different point of view existing in local communities. Participatory GIS grant the possibility to shift from, and link, local scale perceptions to wider perspectives, facilitating stakeholders’ interaction and avoiding misunderstanding and conflict over strategic decisions [23]. Secondly, from a DC structural perspective, existing guidelines demand that DC practitioners adopt planning and evaluation methodologies that support evidence-based decision making at all levels of the results chain. Nevertheless, DC practitioners are usually forced to decide about land uses in scarcely informed environments [24,25,26,27,28,29], where the only available source of knowledge about the land is empirical and is detained by the local communities, may them be the farmers or the local technicians. In addition, from a more technical point of view, most of the land suitability classification systems and mapping are quite demanding in terms of data. In several DC intervention zones, the lack of available data and the time constraints of program cycle management determine an increased need for tools that are able to extract structured information form the perception of the actors of the agricultural system [30].
The present research took place in the framework of a real DC intervention in Nord Kivu (NK), Democratic Republic of Congo (DRC) and aims to implement a rapid and participatory assessment of land suitability that (i) overcome context-related data-shortage, (ii) provide an open-to-participation tool for decision-making and (iii) take in consideration the accessibility of rural areas in land suitability evaluation. Present paper resumes the results of the integration of participatory expert opinion elicitation and GIS for identifying most suitable crops to be supported by the DC project in different zones of the study area.

2. Materials and Methods

2.1. Case Study

Present study occurred in the frame of an EU-funded DC project called ARDST ”Appui au retour de réfugiés et déplacés par le biais de la sécurisation de terres en Diocèse de Goma” (“Support for the return of refugees and displaced persons by securing land in the Diocese of Goma”), led by Caritas Development Goma NGO. The project took place within the European strategy for peace seeking and keeping operations in the African Great Lakes region. The Protocol on the Property Rights of Returnees signed at the International Conference of Great Lakes region (ICGLR) on 30 November 2006. Activities were carried out according to the European Development Fund National Strategy for the DRC, focusing on the in-creased diffusion of the state-of-law and augmented sustainability of the agricultural sector [25]. The research aims to contribute to the evaluation of the agricultural development perspectives and namely to the identification of the most suited land use classes (LUTs) in the Diocese of Goma.

2.2. Study Area

The study area corresponds the Collectivity of Katoyi, covering approximately 720 km2, and located in the southern part of Masisi territory, NK province, eastern region of the DRC (centroid at LAT 1°39′14.03″ S, LON 28°43′18.60″ E, Figure 1). NK is concerned with chronic insecurity due to the presence of several active armed groups [31].
Masisi territory, and Katoyi Collectivity in particular, were the theatre of huge population displacement from 1994 to 2004. During this period, Katoyi Collectivity hosted the headquarters of the main armed group of that period, the FDLR (“Forces démocratiques de libération du Rwanda”, “Democratic Forces for the Liberation of Rwanda”) [32]. Due to their presence, most of the population fled and left the collectivity scarcely inhabited during the following ten years. Since about 2015, returning internally and externally displaced People (IDP and EDP, respectively) are slowly resettling in the collectivity of Katoyi [33,34].
According to the World Bank [35], NK shows one of the highest population densities in Africa (6,600,000 inhabitants, 110 inhabitants/km2). The primary sector (agriculture, livestock, fishing, forestry, mining) is determinant for the economy of NK, reppresenting about 49.7% of the provincial GDP and employing about 80% of the active population [36]. Poverty rate is high in the area (52.4% of the population in NK live below the poverty line, which grows to 69% in rural areas [37].
According to a previous study [38], the land use/cover in Katoyi shows that 52.2% of the land (37,248 ha) is covered by forest and used for the extraction of timber and other non-timber forest products, 30.5% (21,787 ha) is used for agriculture, and 17.3% (12,418 ha) is dedicated to pastures. Two production systems exist in this setting: (1) small farmers practicing subsistence family agriculture on small plots and (2) large landowners who mainly grow cash crop plantations or staple crops in monocultural cropping systems for business, or breed cattle in extensive systems [38]. Both systems practice rain-fed agriculture and extensive grazing.
In Masisi, about 50% of the rural households have plots of less than 0.3 ha, and only 20–25% have more than 2.5 ha of land [39]. It was evident to the authors during the numerous visits in the rural areas, that land scarcity in the area is exacerbated where IDP or EDP come back to lands they fled from and mostly where large-scale cattle ranches slowly increase their size at the expense of local communities.
The authors’ previous surveys and observations allow saying that Katoyi hosts large pastures and forests. Forested areas host some artisanal oil palm (Elaeis guineensis) exploitations. In terms of agriculture, the main staple crops are sorghum (Sorghum vulgare), cassava (Manhiot esculenta), taro (Colocasia esculenta), sweet potatoes (Ipomoea batatas) and potatoes (Solanum tuberosum). Many farmers practice multiple cropping combining staple, fruit and vegetable crops. Small mixed-plantations of banana (mainly Musa acuminata) host other vegetable species such as bean, cabbage, spring onion, carrot and tomato. Previous studies [39] confirm that most traditional crops in Masisi territory are bean, banana, sweet potatoes, green peas and maize.
The orography in Katoyi Collectivity is very complex. The NK province is part of an agroecological zone characterized by a long growing season of nearly 210–365 days per year [40], but the heterogeneity of the relief in Katoyi brings a wide variety of microclimates. Generally, the Goma diocese has a mountain climate, but with a close correlation between altitude and average temperature: the average minimum monthly temperature is 23 °C below 1000 m AMSL (above mean sea level), 19 °C at 1500 m AMSL and 15 °C above 2000 AMSL [41]. Average rainfall varies between 1000 mm and 2000 mm [41]. The lowest monthly precipitation occurs between January and February and between July and August. Four seasons characterize the territory of Masisi: two wet seasons and two dry seasons. The first wet season is between September and December and the second is practically from February to June. As for the two dry seasons, they are very short. The first is observed between July and August and the second in January. The mountain climate and the relief give the soils of Masisi a certain complexity. In Katoyi Collectivity, the soils are very deep and rich in humus. They are mildly clayey and not very compact and contain large reserve of organic matter on the surface, especially where land is covered by forests. In fact, the natural vegetation tends to heterogeneous mountain rain forests.

2.3. Research Workflow, Data Sources and Methods

Land suitability mapping needs a first set of information about the study area, which we divided into land capability factors (LCFs) and logistic factors (LFs), and a second set of information related to the effects of each of these factors on the locally relevant land use types (LUTs).
In order to obtain such information in an area characterized by a limited availability of official and reliable data, we defined the six-step procedure presented in Figure 2. The workflow is based on the integration of literature, local expert elicitation methods [42,43], and specific GIS overlay methodologies to collect and merge geo-referred useful information [44]. The experts participating in the land suitability assessment were selected within the ARDST project team and counted five people: three local agronomists, one expert in rural development and one pedologist. Additionally, five farmers were involved in a collective interview during the process.

2.3.1. Identifying Relevant Land Uses

We started the analysis from the information gathered and made available in the framework of the ARDST project, namely by analyzing the field visits reports and the results of a survey aimed at collecting information about existing crops and practices in the Diocese of Goma [45]. Seven most relevant land uses for the whole “petit-nord” region were cross-validated through literature review and expert elicitation and selected to form the list of target crops, hereafter called land use types (LUTs) (Table 1).

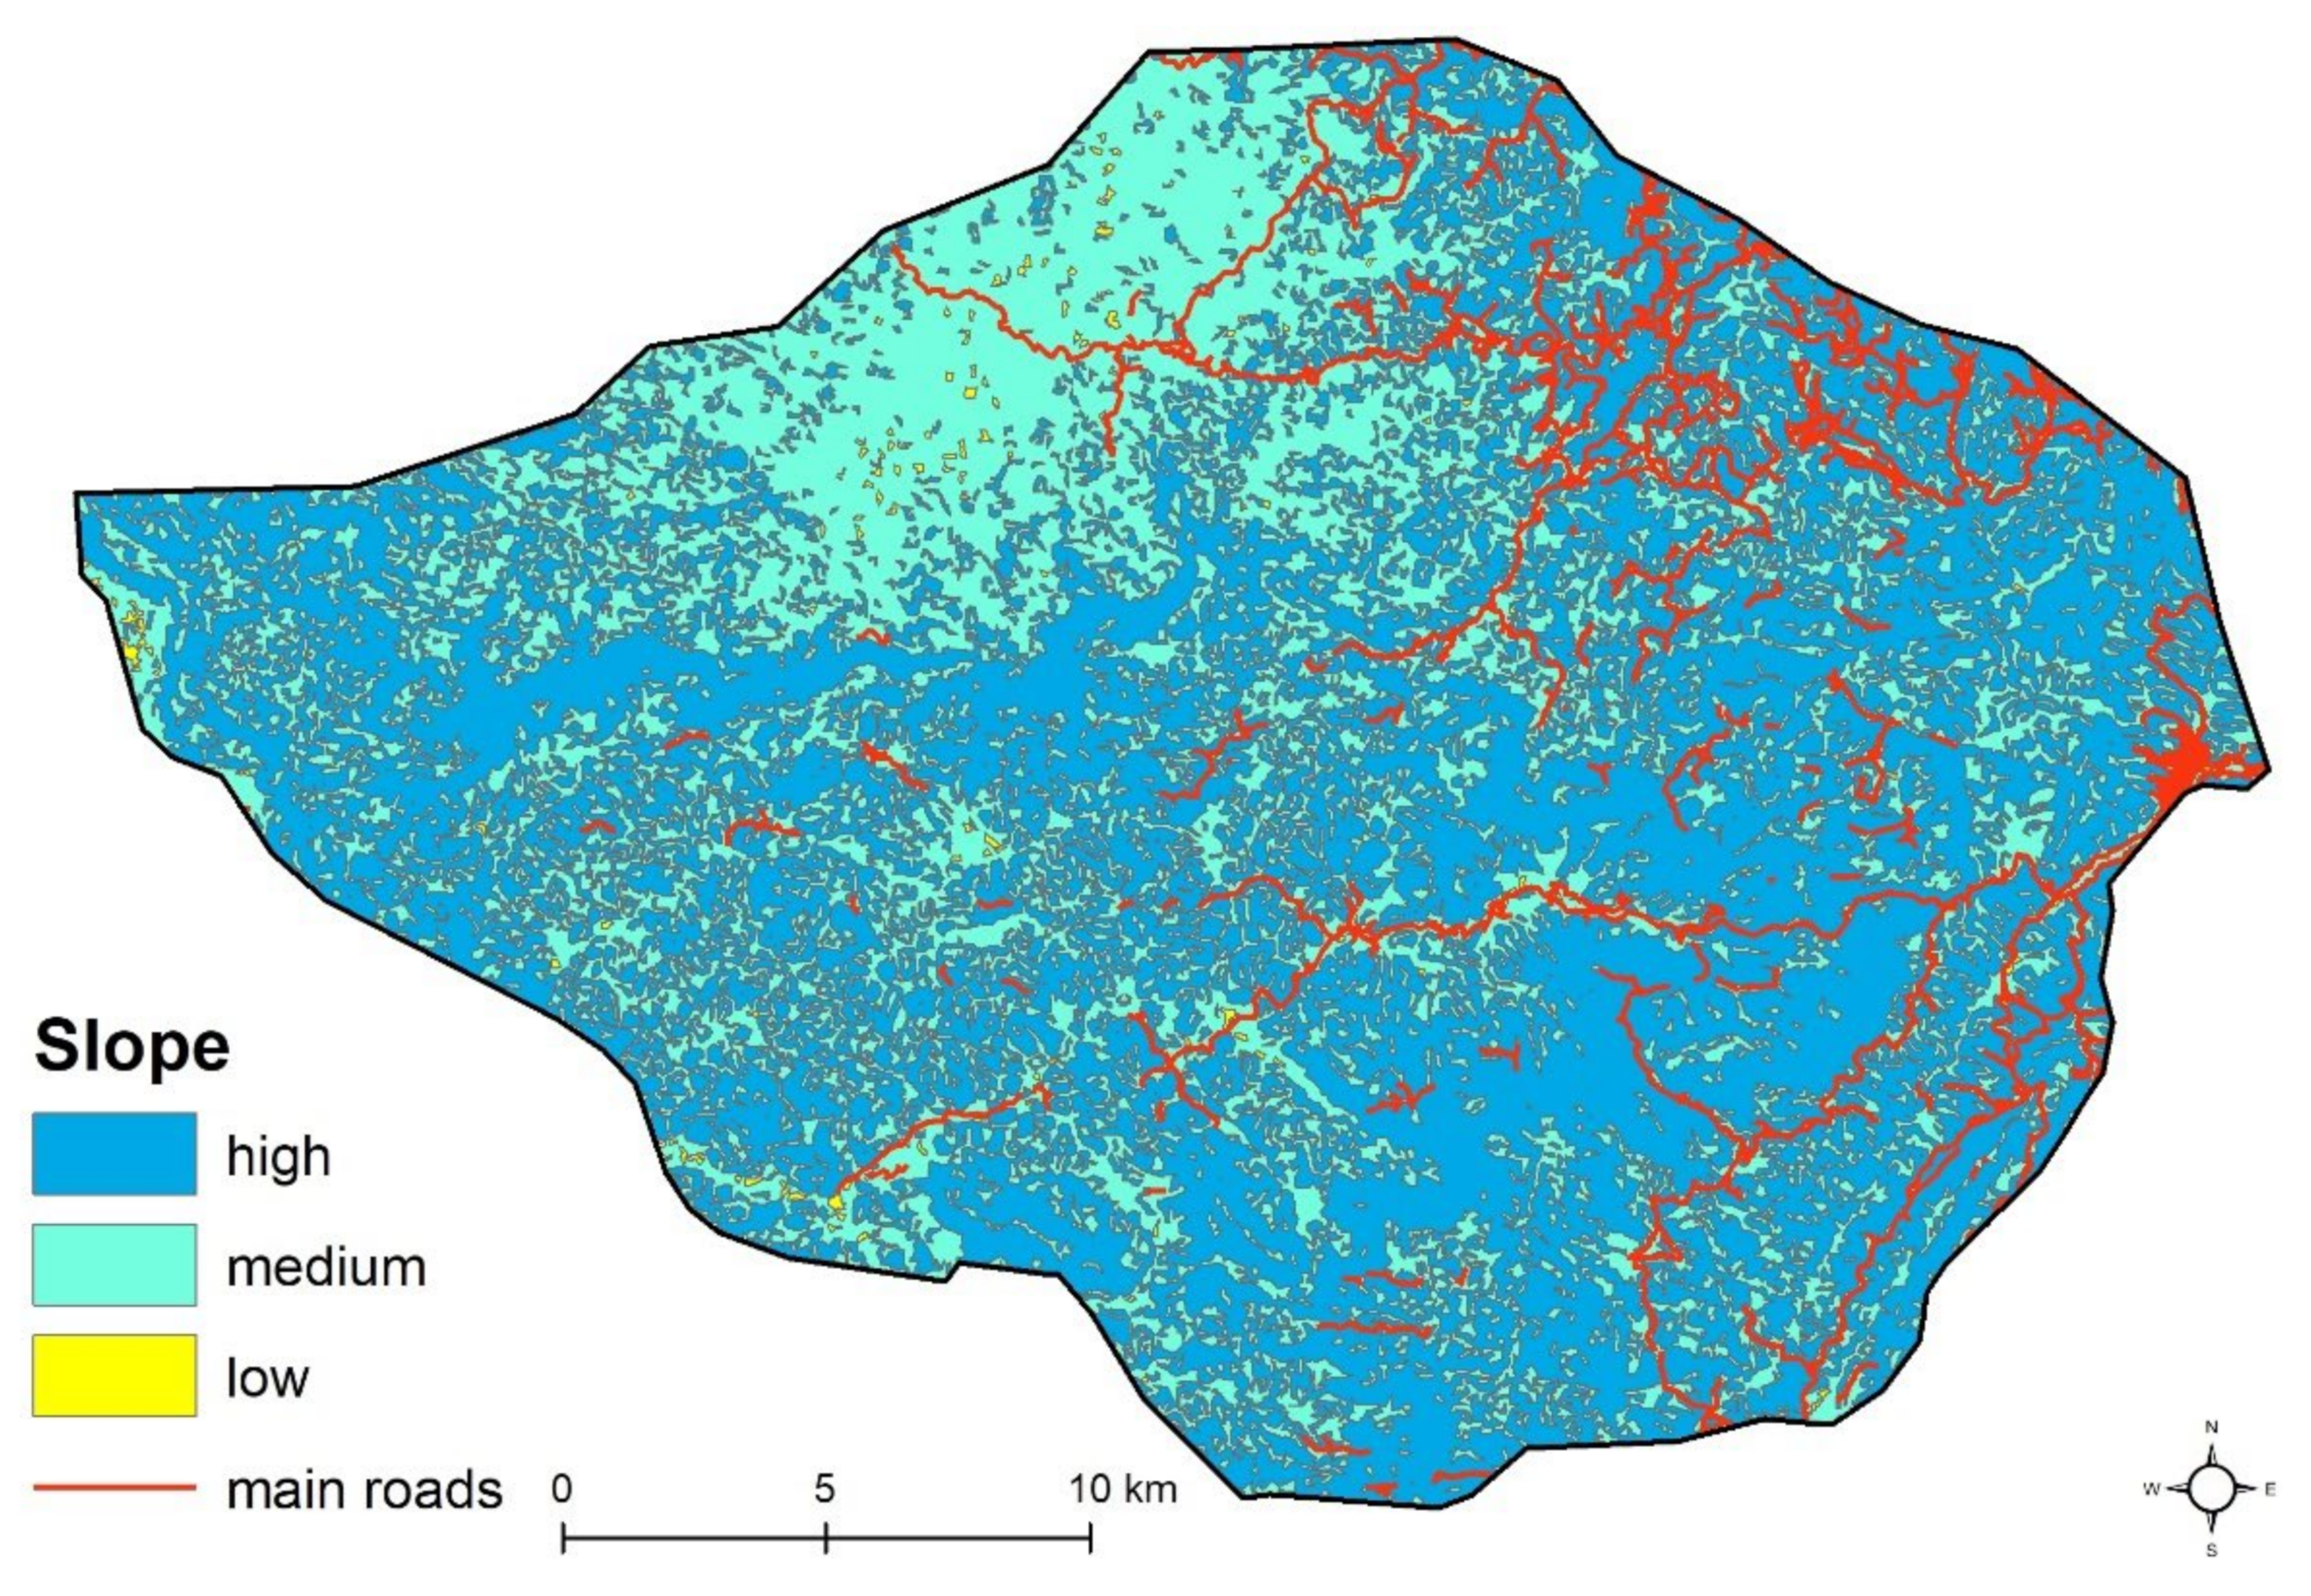
2.3.2. Mapping Land Capability Factors

Because of the lack of a land capability map and information for the study area, we firstly compiled an extensive list of land capability factors found (LCFs) in literature [46,47,48,49,50,51]. The extensive list was then analyzed through experts elicitation devoted to the identification of available sources of data for each LCF. This phase, held in July 2018 in Goma, ended with the validation of a final list of three LCFs for the specific study area (Table 2).
A proxy was defined for each LCF as a variable that approximated the measure of the LCF (e.g., elevation used as a proxy of climatic factor, in order to replace unavailable information such as temperature, humidity, precipitation data).
In the study area, the climate is mostly influenced by altitude, which macroscopically determines usual cropping and other LU choices. Elevation data are obtained from the ASTER (advanced spaceborne thermal emission and reflection radiometer) GDEM (global digital elevation model) version 2, with a pixel resolution of 30 × 30 m. In particular, two altitude zones are usually taken into consideration by local experts, namely, the highlands (indicatively located above 2100 m AMSL) and the lowlands (located below 1600 m AMSL). Building on available relevant studies in the region [53], which confirmed the local experts opinions, we defined three elevation classes (Figure 3A):
  • Low: under 1600 m AMSL.
  • Medium: between 1601 and 2100 m AMSL.
  • High: above 2100 m AMSL.
Regarding the topographic factor, we used slope classes as a proxy. Slope data were obtained by computation from the ASTER GDEM version 2 (pixel resolution: 30 × 30 m). The study area is characterized by a continuous series of mountains and high hills. Planes are nearly absent and cropping activities, especially subsistence-oriented ones, are implemented no matter the slope. Based on existing studies focusing on the region [53], three slope classes were defined for land capability assessment (Figure 3B):
  • low: slope inferior to 6%,
  • medium: slope between 6 and 25%,
  • high: slope over 25%.
Regarding the soil factor, quality classes indicating soil fertility have been used as proxy. Data were obtained from the only available soil map of the region in a 1:500,000 scale [52]. The interpretation of existing soil units descriptions was obtained through local expert elicitation. According to available information, the study area is characterized by 13 different soil types, mostly originating from volcanic parental material. We defined three soil quality classes by evaluating soil depth/age and dominant texture as described in the available sources (Figure 3C):
  • low, characterized by yellow or shallow brown soils of variable texture (mainly sandy-loamy or sandy-clayey) with weak A1 horizon in hilly or uneven topography.
  • medium, characterized by light and brown soils, mainly sandy-clayey or clayey, with pronounced A1 horizon in uneven topography.
  • high, characterized by light and brown clayey or clayey-sandy soils, with pronounced chernozemic A1 horizon in a flat or nearly flat topography.
The thresholds used for classifying the study area according to LCFs and build capability classes were determined with reference to existing literature and local expert elicitation. The land capability assessment allowed for drawing three LCF maps using ESRI ArcGIS 10.8 desktop software (Figure 3).
Figure 3. LCF Maps: (A) Elevation-based; (B) Slope-based; (C) Soil quality-based. Class thresholds are described in the text.
Sustainability 14 13049 g003
Regarding elevation, low and medium classes are almost equally present and together occupy 76% of the study area. Regarding the slope, the low class is almost absent (only 309 ha); more than 60% of the study area is characterized by a high slope. Regarding the soil quality, the low class is almost absent (only 850 ha), and the medium class occupies 55% of the study area.

2.3.3. Defining the Suitability Scores for Each LUT

The goal of this phase was to identify the influence of LCFs on the different LUTs defined. Each of the LCFs mapped is present in the study area in three different classes: high, medium, and low. The question to be answered was: How does the presence of a particular LCF class affect the productivity of a specific LUT?
To answer this question, we performed an expert elicitation, organizing an ad hoc collective interview with farmers and experts in Katoyi in August 2018. We asked the experts and the farmers to give a suitability score (SC), on a five-point scale (1 to 5, where 1 is 1 is low suitability and 5 is high suitability), for each combination of LUT and LCF class.
During the collective interview, six farmers collectively filled one survey form, while the experts filled one form each. The scores were synthetized though participatory discussion and final scores were validated for each LUT (Table 3).

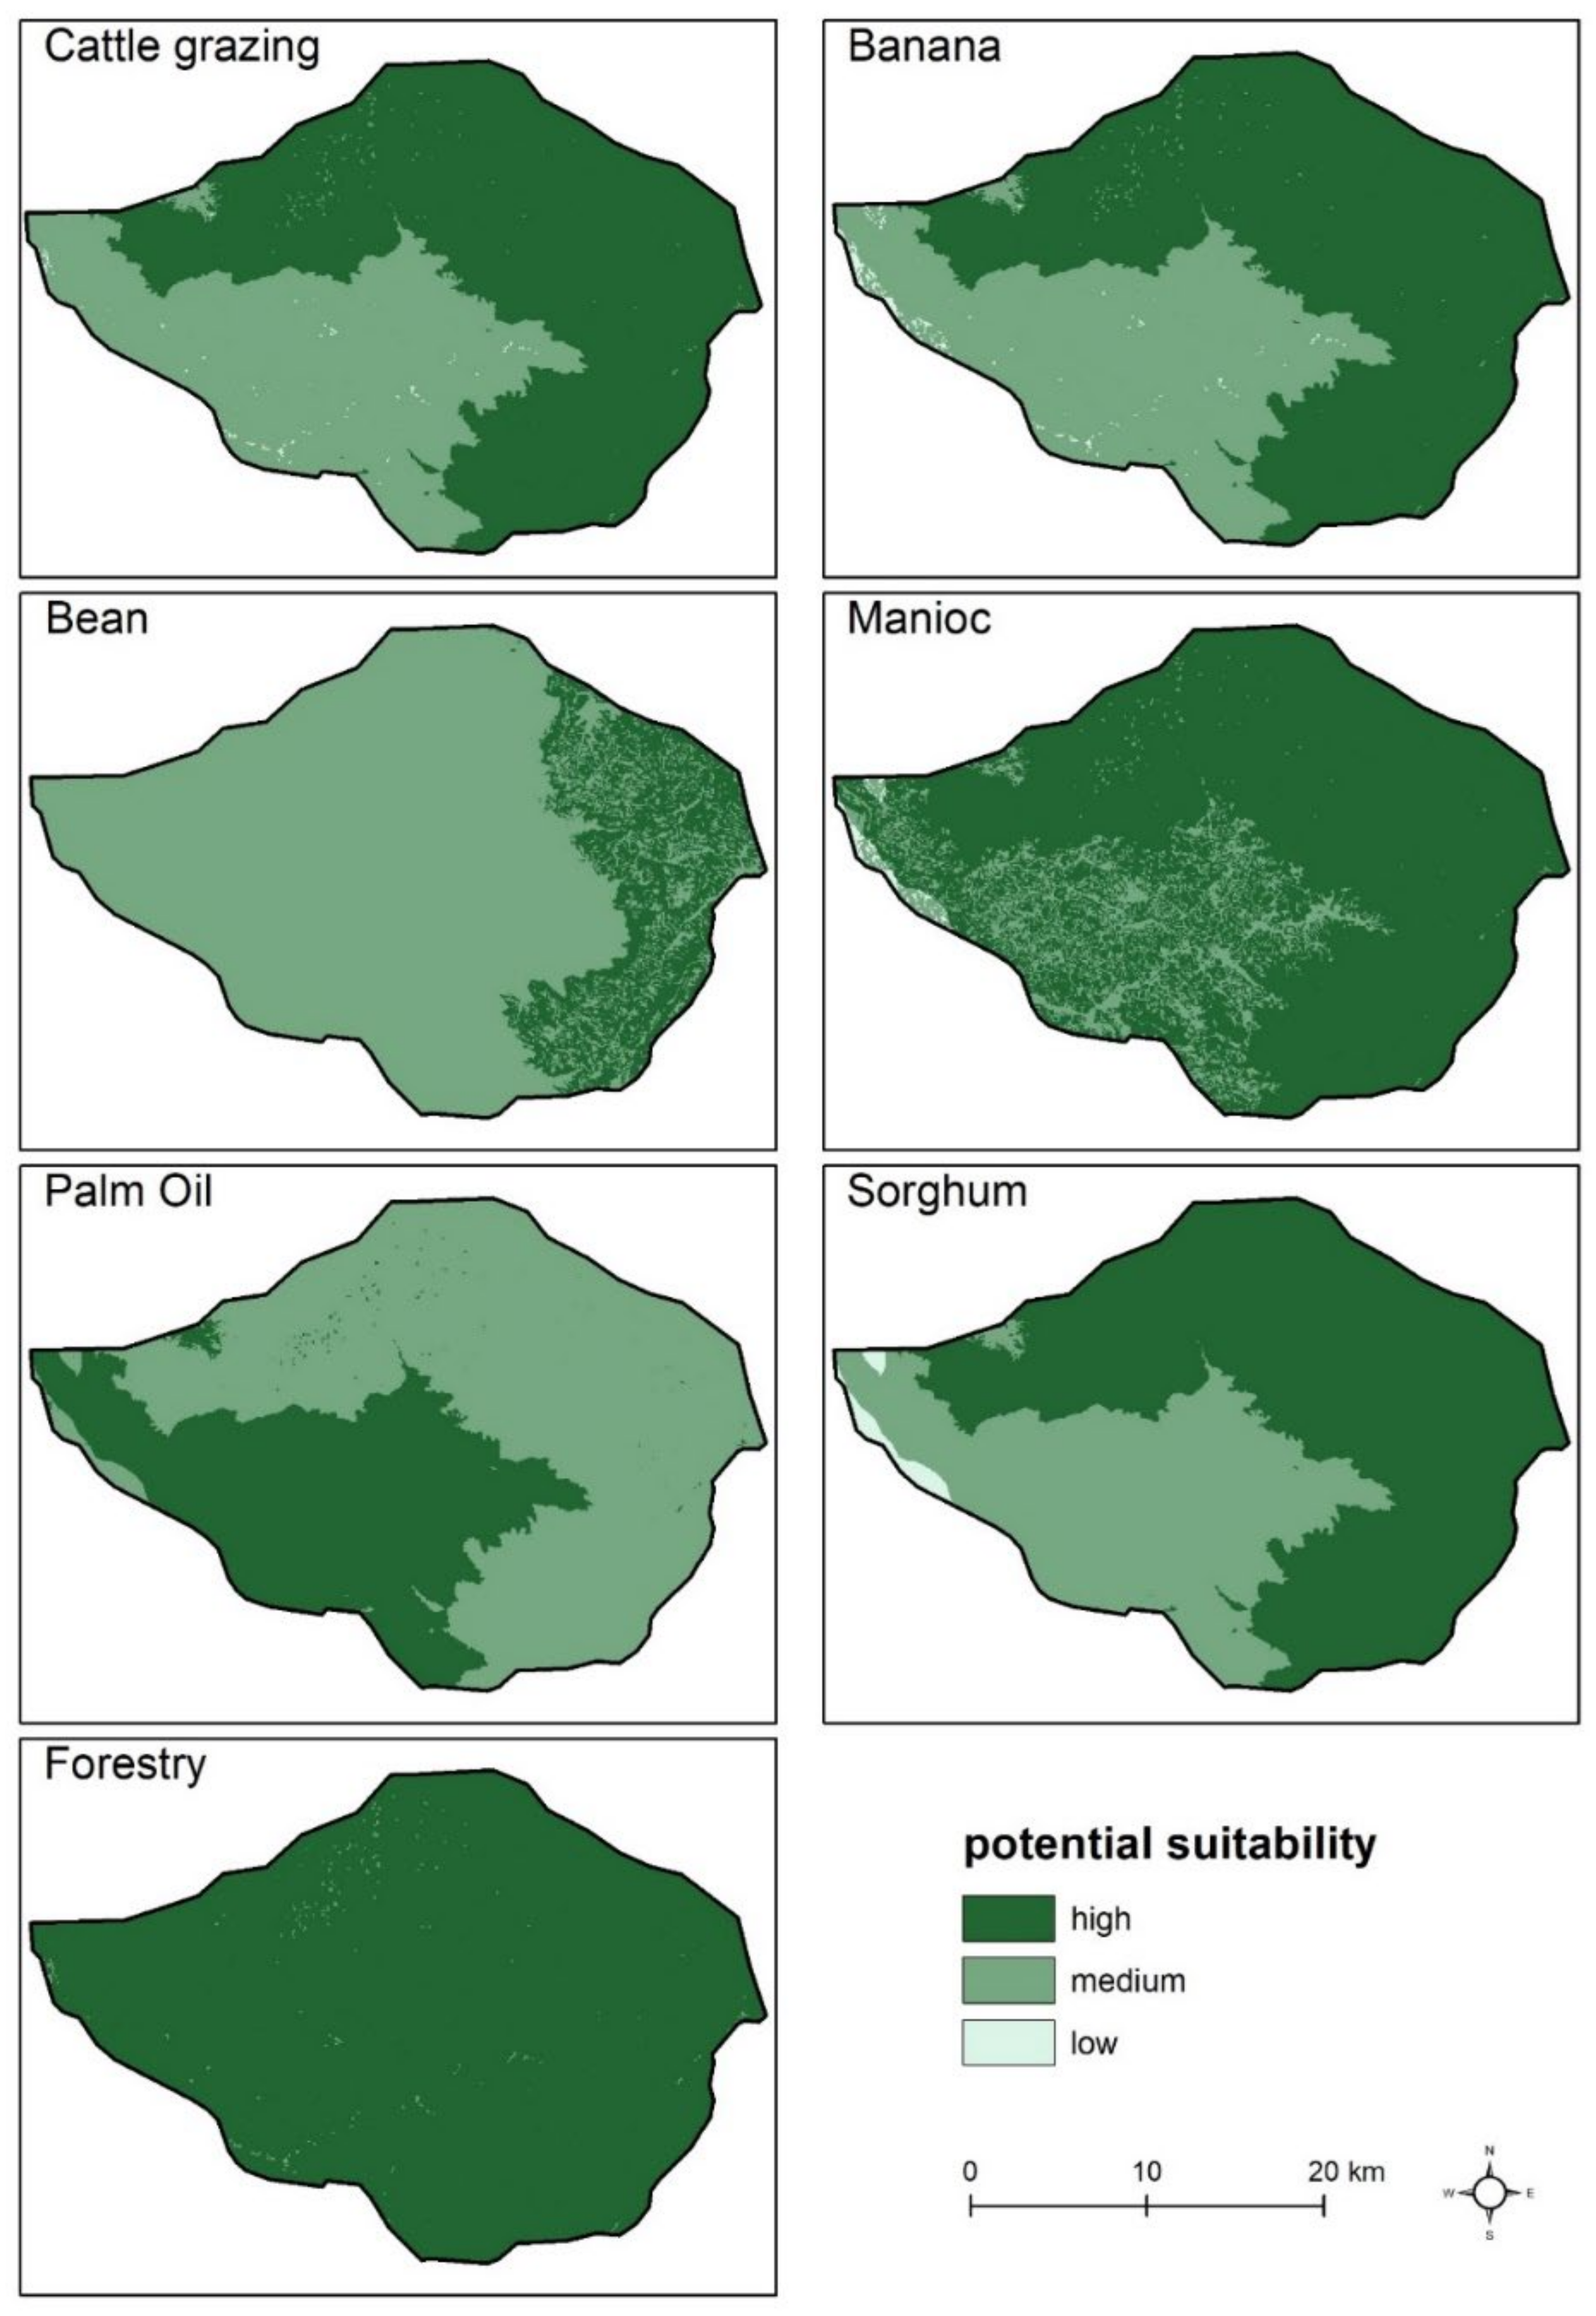
2.3.4. Mapping Potential Land Suitability for the Seven LUTs Considered

The potential land suitability for each of the seven LUTs considered was assessed through the topological overlay capability of geographical information systems that allow producing a composite map with new polygons generated from the intersection of the original ones coming from the LCF maps.
The new composite map contains all the possible combinations of the three LCFs and their class. For each LUT, the suitability score indicated in Table 3 (SCxyz) was assigned to each combination of LCF/class, where
-
x (1–7) is one of the seven LUTs,
-
y (1–3) is one of the LCF (SQ, SL, EL),
-
z (1–3) is one of the LCF class (High, Medium, Low).
For each LUT, the total suitability score of a specific area (TSCxzi) corresponds to the arithmetic average of the three LCF suitability score assigned to the specific LCF classes of that area:
T S C x z i = S C x z S Q + S C x z S L + S C x z E L 3
where
-
TSCxzi is the total suitability score of the i-th area, for the x-th LUT, for the z-th LCF class,
-
SCxz (SQ) is the suitability score, for the x-th LUT, of the the z-th class of soil quality,
-
SCxz (SL) is the suitability score, for the x-th LUT, of the the z-th class of slope,
-
SCxz (EL) is the suitability score, for the x-th LUT, of the the z-th class of elevation.
In order to produce the final potential land suitability (PLS) map for each LUT (Figure 4), the total suitability score of a specific area (TSCxzi) has been reclassified in the following three classes:
-
High, greater than 3,
-
Medium, greater than 2 and up to 3,
-
Low, up to 2.
Figure 4. Potential land suitability for the 7 LUTs considered.
Sustainability 14 13049 g004

2.3.5. Mapping Accessibility

Accessibility is considered one important land-use determinant, especially in agro-forestry activities [14,15,54]. The approach used was based on the “access time criterion”, suggested for the first time in Italy by Hippoliti [55] and recently updated by other researchers, such as Grigolato et al. [56]. Access time is the time required for a forest/agricultural worker to make a round trip on foot from the nearest road to a given field. This time is based on an assumed average walking speed of 4 km/h on flat terrain, and 400 ma/h on steep terrain, where ma is the difference in elevation in meters [57].
Based on this criterion, we calculated a logistic factor (LF) through a cost–distance method [57], thanks to the GIS specific tools. This tool can determine the weighted distance from each cell to the nearest source location across continuous surfaces using grid data. In this study, the “nearest source locations” have been the roads and the weight (or cost) has been the slope (Figure 5), so that the “cost distance” has been the elevation in meters:
C D i = D i × W i
where
CDi is the cost distance, in meters, of the i-th cell from the nearest road,
Di is the dimension, in meters, of the i-th cell (in the study the pixel is 30 m),
Wi is the weight, equal to the slope of the cell (in %).
Figure 5. Main roads and slope in the study area.
Sustainability 14 13049 g005
Based on the average walking speed defined above [57], we calculated five accessibility classes (AC) (Figure 6):
  • High, with a CDi less than 200 m, that is 30 min walking,
  • Medium-high: with a CDi of 200–400 m, that is 1 h walking,
  • Medium: with a CDi of 400–600 m, that is 1.5 h walking,
  • Low: with a CDi of 600–800 m, that is 2 h walking,
  • null: with a CDi greater than 800 m, that is more than 2 h walking.
We used the logistic factor to differently weight the potential suitability according to the distance and elevation gain from existing major roads.
Figure 6. Accessibility map.
Sustainability 14 13049 g006

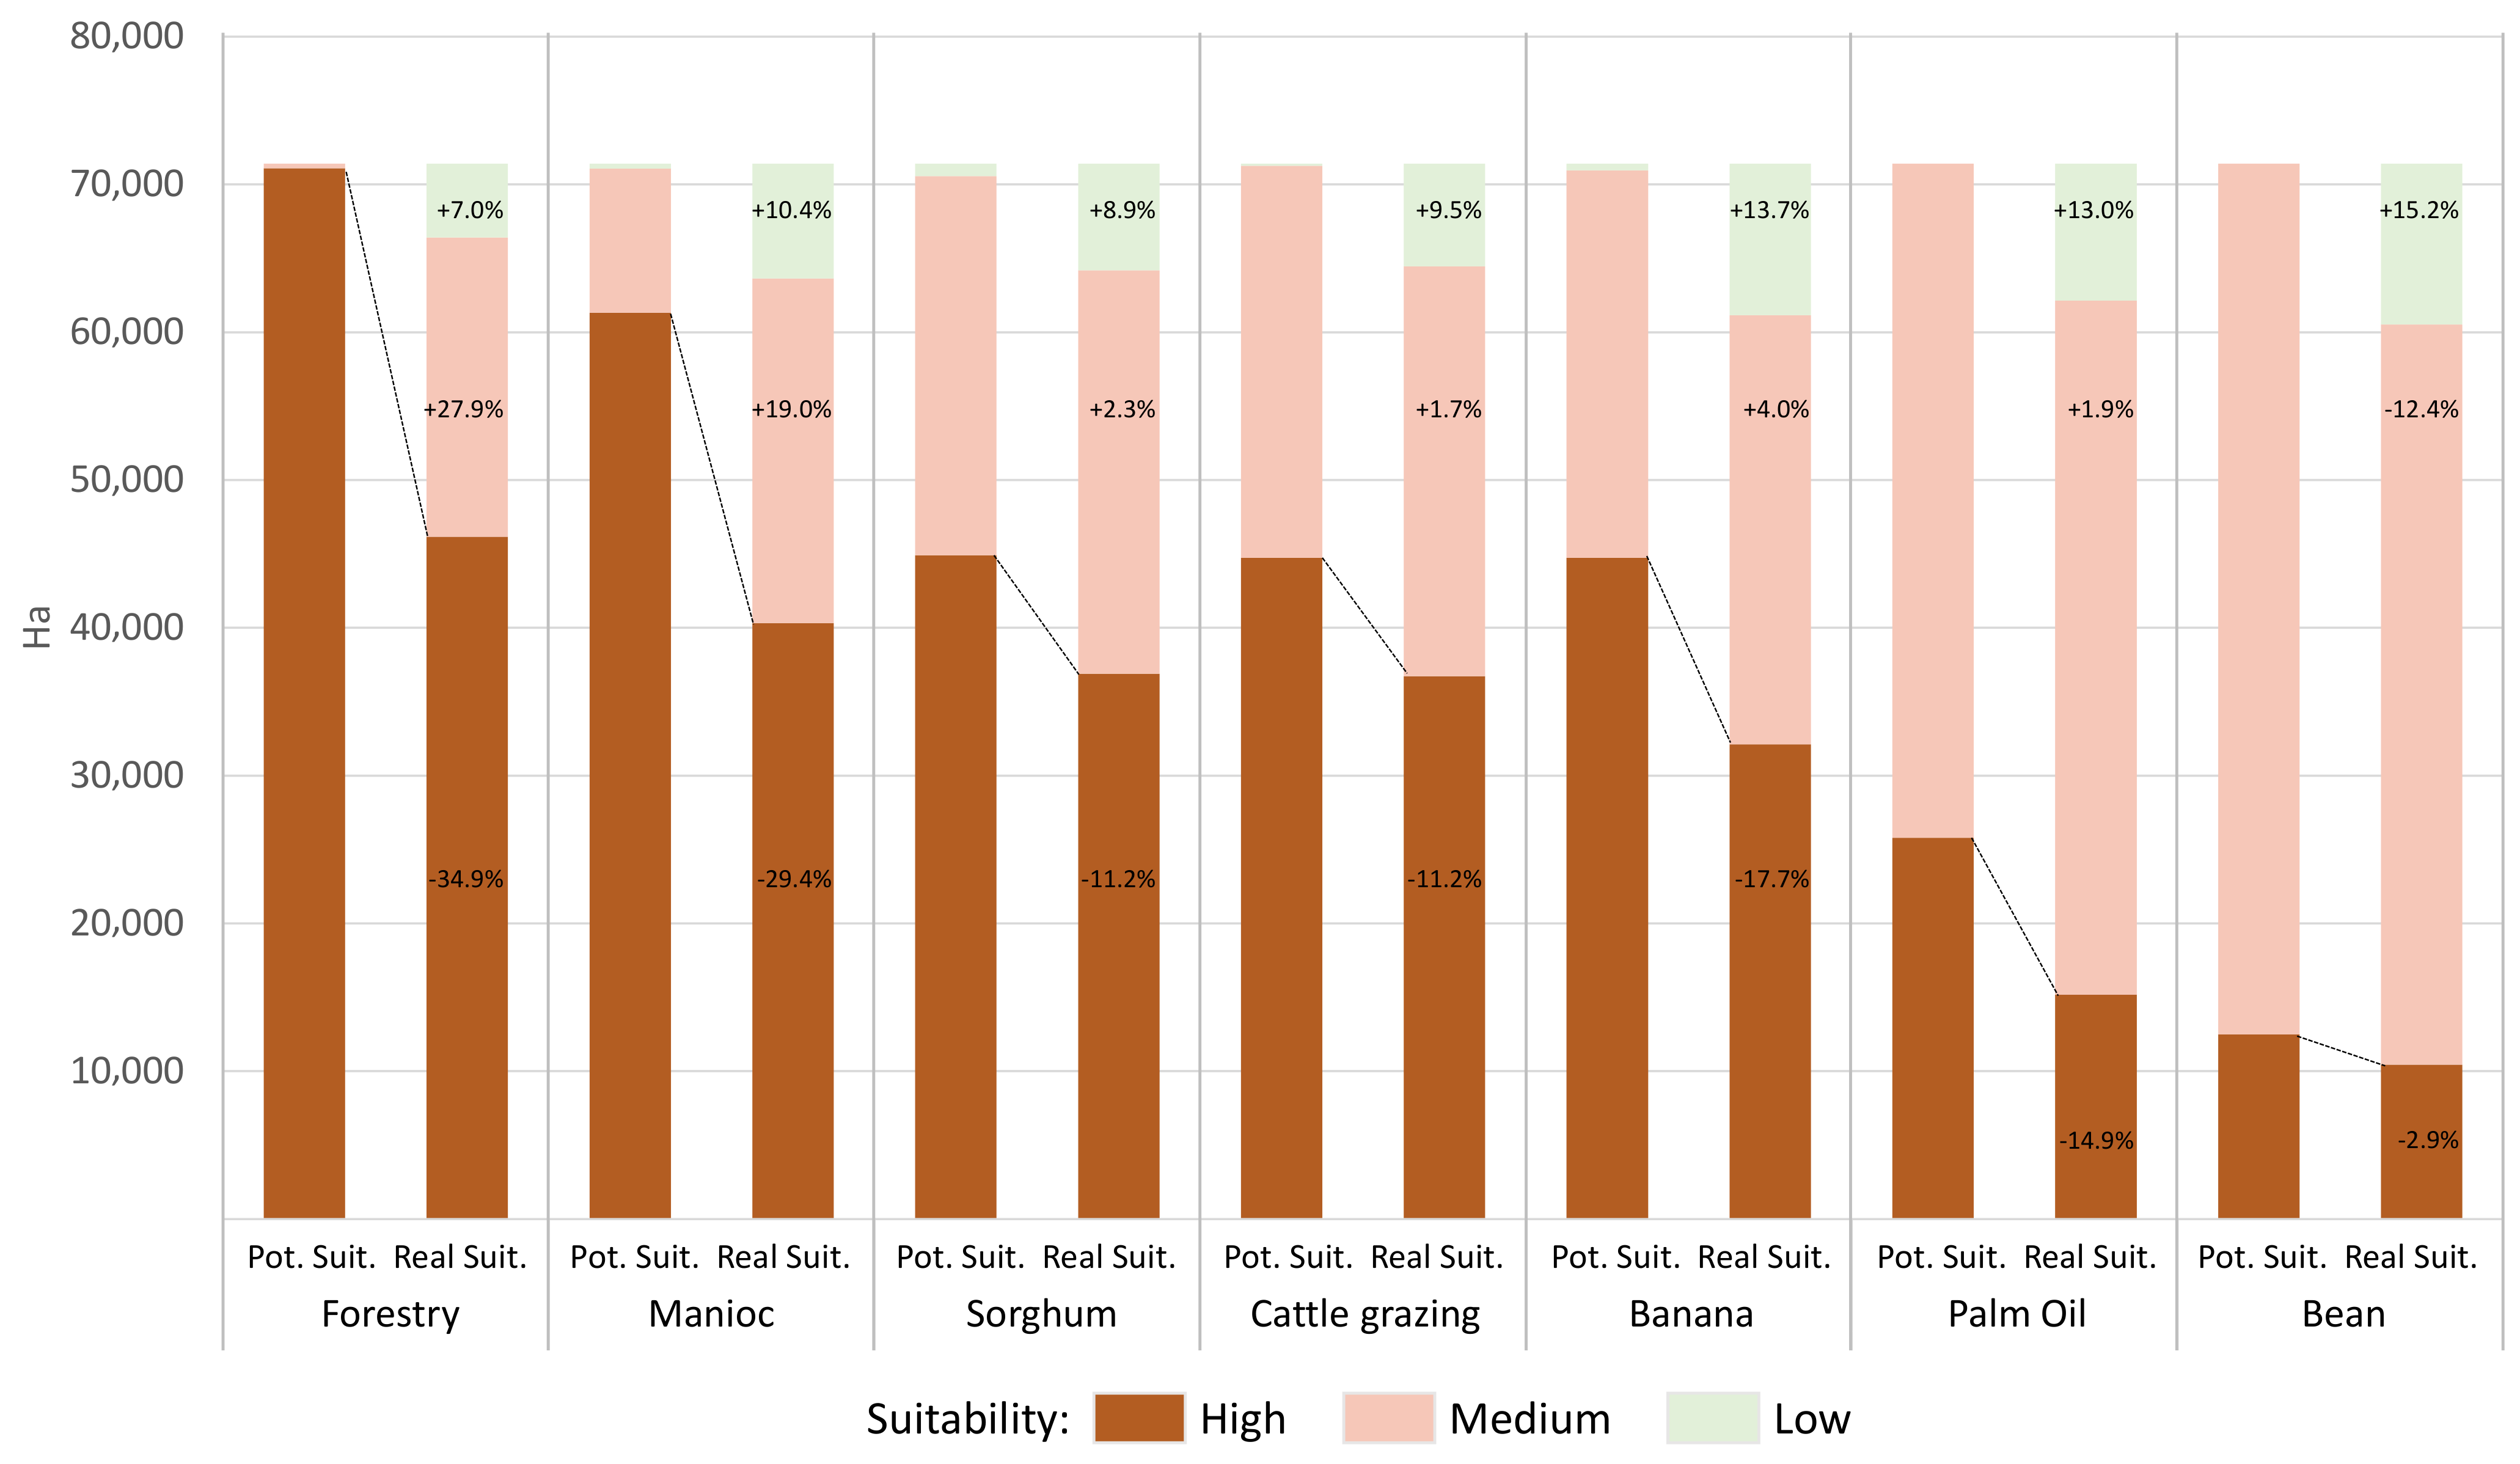
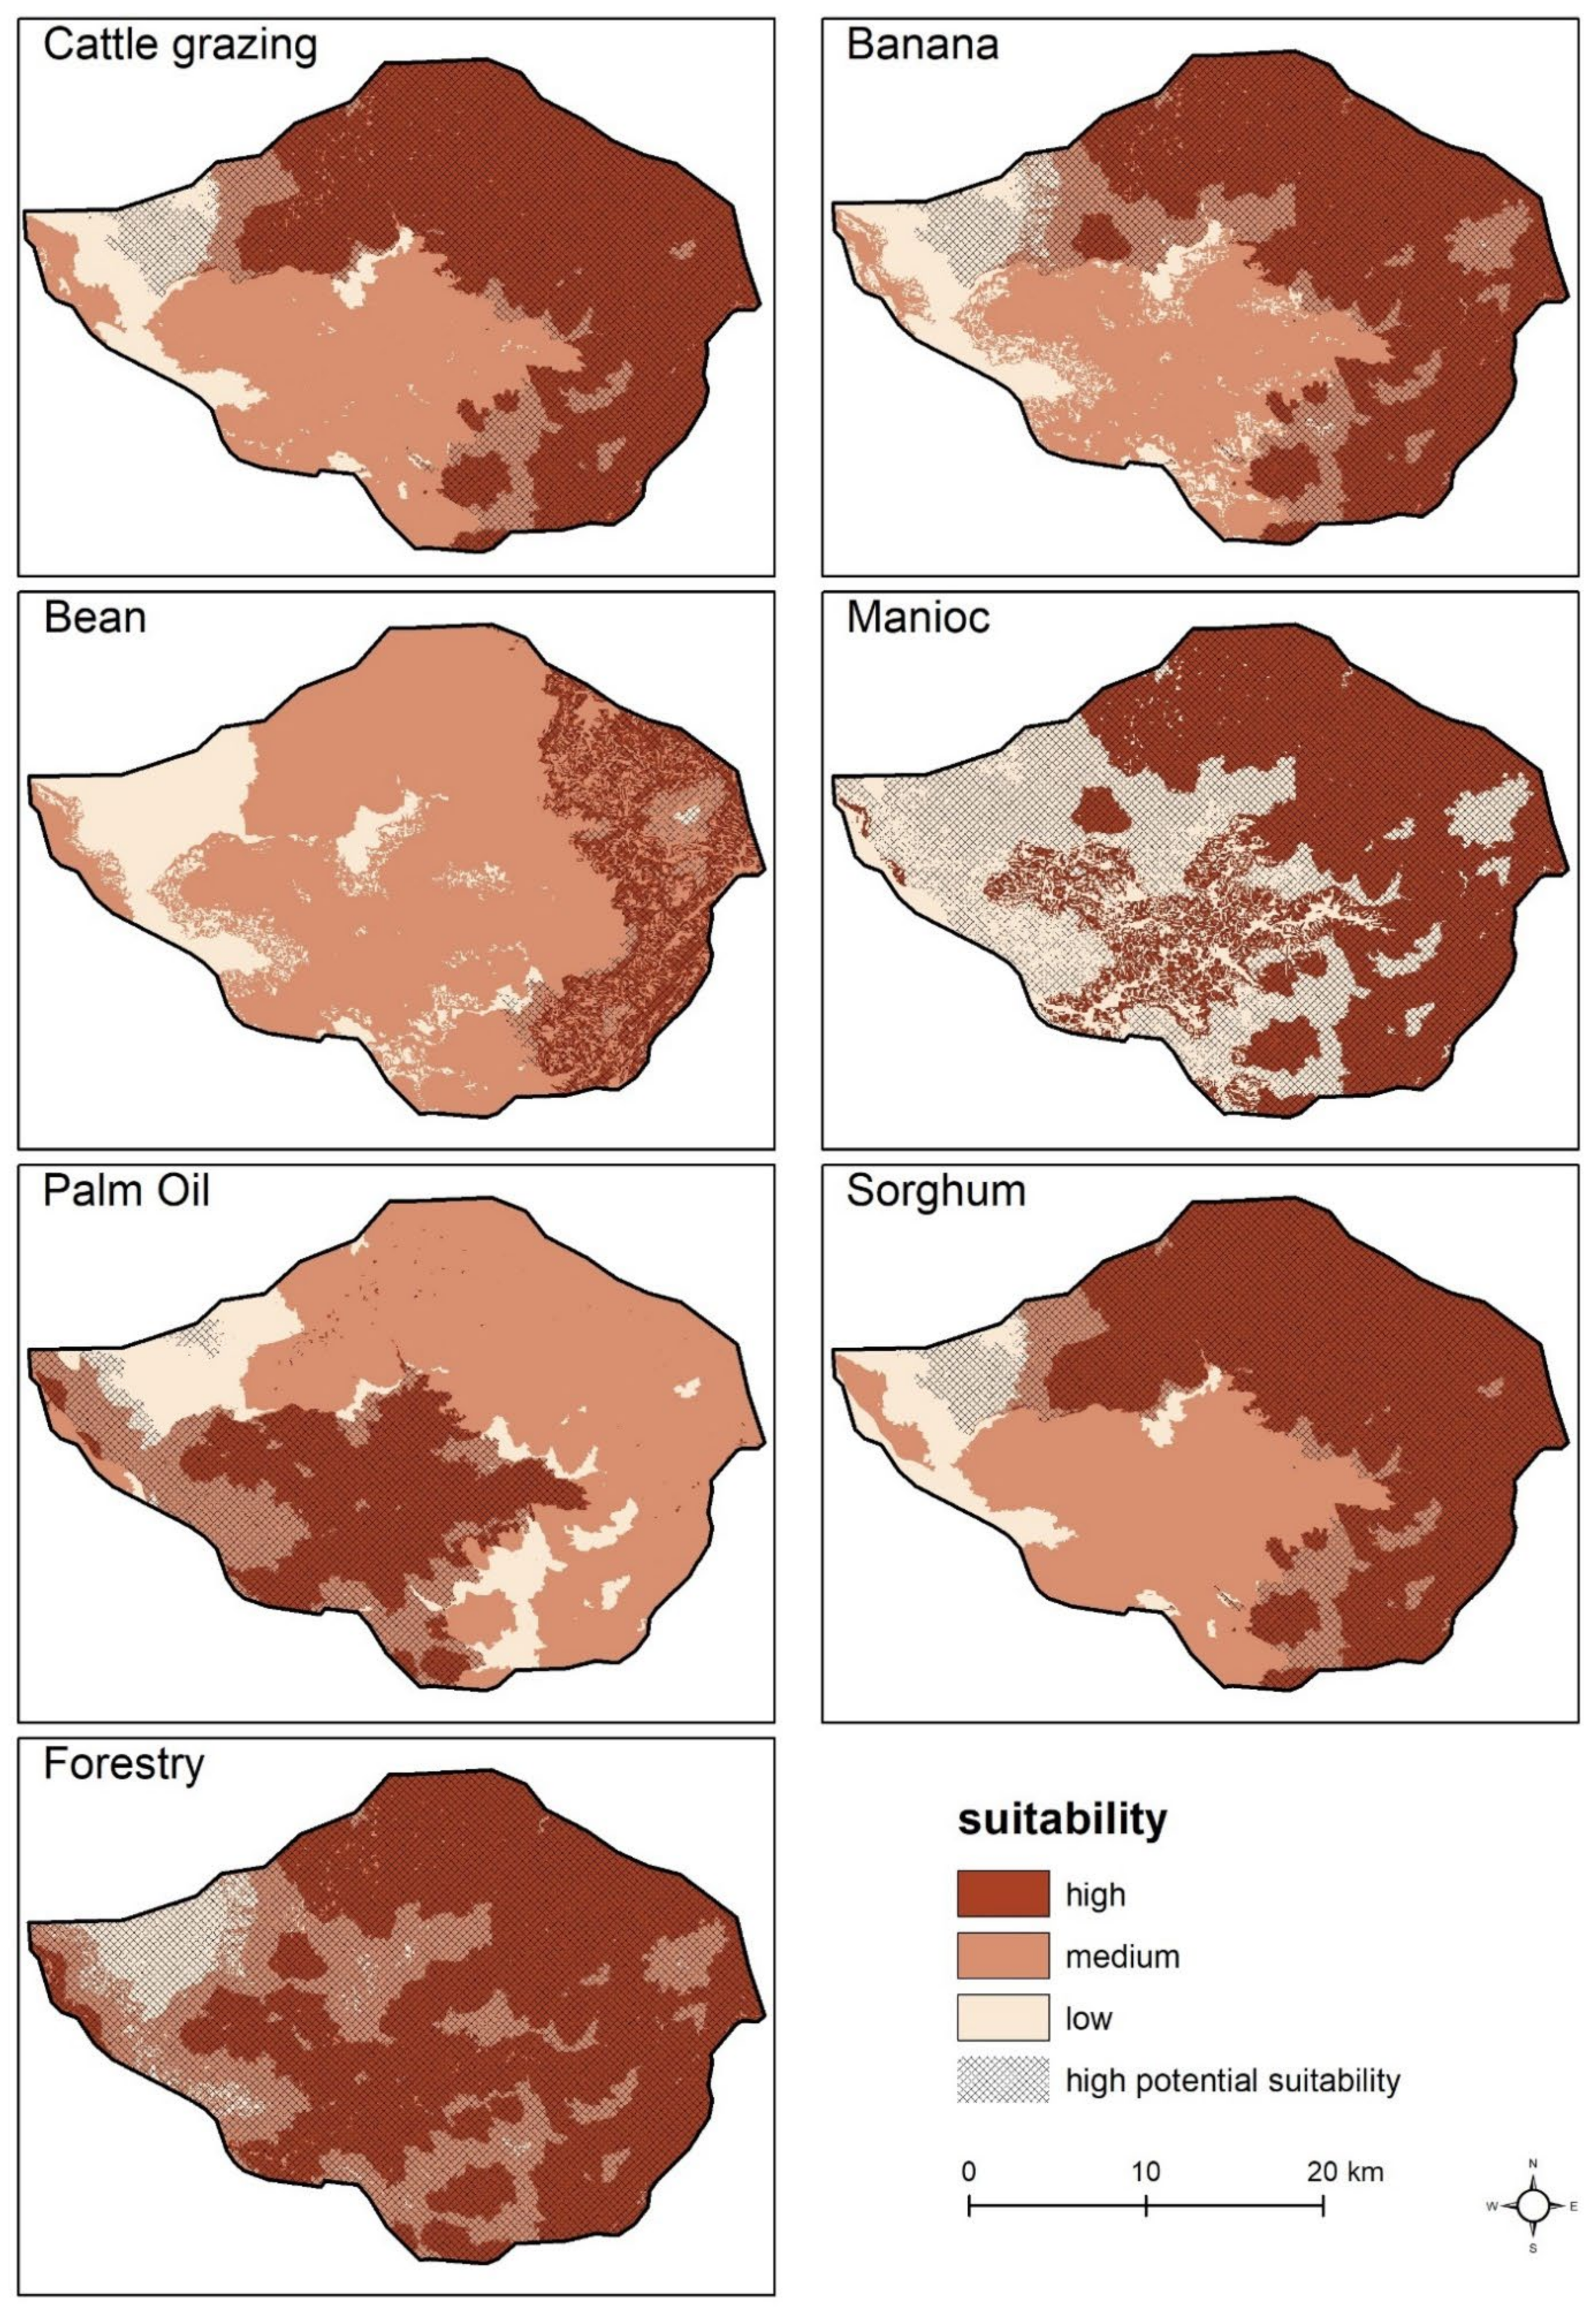
2.3.6. Mapping Land Suitability

The integration of the potential land suitability with the logistic factor due to the accessibility allowed us to produce the final land suitability (LS) map (Figure 7). To this end, we used the overlay mapping tool with ESRI ArcGIS 10.8 desktop software. Land suitability was calculated as follows:
L S i = P L S j   × A C k
where
LSi is the land suitability of the i-th area,
PLSj is the potential land suitability of the j-th area,
ACk is the accessibility class of the k-th area, calculated as follows:
  • Accessibility Class High = 1,
  • Accessibility Class Medium-high = 0.8,
  • Accessibility Class Medium = 0.6,
  • Accessibility Class Low = 0.4,
  • Accessibility Class null = 0.2.
In this way, even if the AC is null (CDi greater than 800 m, that is more than 2 h walking), we have no area with land suitability equal to zero.
Figure 7. Land Suitability Maps for each LUT.
Sustainability 14 13049 g007

3. Results and Discussion

As shown in Table 4, the study area presents many territories with high potential land suitability for most of the LUTs considered. Among the seven LUTs, forestry is the potentially most suited land use (99.6% of the study area is potentially highly suitable). This was expected because forest represents the climax vegetation of the region; consequently forestry is a potentially ubiquitous activity in the study area. This is a well-known characteristic of the area, also confirmed during the elicitation phase, in which forestry registered the second lowest standard deviation of the SC given by the local experts compared with the other LCFs (see Table 3).
Among the crops, manioc is the most suitable (85.9% of the land is highly suitable while only 0.5% in scarcely suitable). The result is congruent with its high diffusion and in line with the opinion expressed by the local experts (Table 3).
Sorghum and banana show a high potential suitability in about 62% of the study area, while oil palm and bean are less suited, with only 36.1% and 17.5% of the land highly suitable, respectively. These results are congruent with locally conducted interviews, which show that there are other more suitable areas than Katoyi for oil palm cropping, while bean is ubiquitous due to its value in the framework of subsistence farming [45].
Finally, cattle grazing was potentially highly suitable in the 62.6% of the study area, even if it received more variable scores when evaluated by the experts (Table 3), probably due to the low attitude of cattle in lowlands where the occurrence of animal pests is higher (i.e., Glossina spp.).
Concerning the standpoint and the operational nature of DC organizations’ interest in knowing land suitability, the real suitability, which incorporates accessibility, is much more interesting. In fact, including accessibility in land suitability assessment helps DC organizations to identify, on the one hand, areas where eventual support to specific land use activities could be implemented with much ease and increased sustainability, from a logistic perspective, and, on the other hand, the best land use to be supported in the most accessible areas.
Figure 8 shows the differences between potential and real land suitability in the study area. Due to accessibility, potential high land suitability decreases for all the LUTs considered, from 2.9% of bean (that has few areas with high potential suitability) to 34.9% for forestry (that has, on the contrary, many areas with high potential suitability). Potential high suitability is confirmed when accessibility is high and decrease when land become less and less accessible.
Figure 9 shows where the differences between potential and real land suitability for each LUT occur in the study area.
Forestry presents the largest decrease in the class of high potential suitability (−34.9% equal to a loss of 24,945.5 ha), and the largest increase in medium potential suitability class (+27.9% equal to a gain of 19,944.9 ha). This result is congruent with the specificity of the study area, where the products of forestry include both more and less transportable items. For instance, carpentry wood needs steady access to roads for often long-range transportation, while honey or medicinal substances extracted from managed forest are easily transported even from less reachable lands. Consequently, it is difficult to imagine any areas completely losing their suitability to forestry. As a result, forestry confirms itself as the most suited LUT for the study area (with 64.6% or 46,156 ha with high suitability and 28.4% or 20,253.3 ha with medium suitability), with most suitable lands located across the whole study area (except the west part, the worst accessible area).
Conversely, crops and animal grazing are generally less adaptable than forestry, and this could explain the results showing a more relevant increase of scarcely suitable land class.
As far as manioc is concerned, the accessibility factor plays such an important role to pass all the south-west area and a part of the eastern area, previously with high suitability, to low suitability (Figure 9). Overall, highly suitable land for manioc shows a −29.4% (−20,999 ha) decrease and a relevant increase in both low and medium suitability classes (+19.0% and +10.4%). These modifications in the suitability are probably due to the fact that even though manioc adapts both to high- and lowlands and is quite insensitive to high slopes and poor soils, it is not suited to inaccessible areas because it has high yields that imply heavy loads for transportation and relatively low market price. Nevertheless, manioc remains the second most suited crop in the study area (with 56.5% or 40,327 ha highly suitable and 32.6% or 23,312 ha medium suitable), especially in the northern and eastern parts of the study area.
Banana, sorghum and cattle grazing show a similar decrease in highly suitable areas (−17.7%, −11.2% and −11.2%, respectively) Sorghum and cattle grazing show highly suitable areas especially in the north-eastern part while the central part of the study area presents medium suitability. Differently, banana presents a quite large area with medium suitability in the eastern part of the study area. Banana is an important staple crop in the region, both in terms of sweet and plantain bananas. Banana herbaceous plants are adapted to sloppy and poor-soils highlands.
Sorghum is known as a hardy crop for adapting to extreme ecological conditions such as rising temperature, low soil fertility, drought [58,59]. Sorghum is also a very important crop for ensuring food security in the region [60]. Despite this great importance and the region’s agricultural potential, sorghum production is still low, probably due to the reduction in the length of fallow and to the practice of monoculture cereals [61], coupled with smallholders poor access to land and the effects of climate change [62]. Consequently, the cultivation of sorghum has lost many traditional farming areas in the region where it is supplanted by other cereals such as maize and rice, which by contrast are particularly vulnerable to drought and soil fertility defects. Sorghum would therefore be the cereal of choice in regions where the rains are becoming more and more limiting for maize such as the remote and scarcely accessible high and lowlands in the northern and eastern parts of Katoyi. Our suitability assessment confirms this conviction.
The diffusion of animal husbandry, namely cattle grazing, is growing in the study area, especially in the northeast, while traditionally the collectivity was known for its plantations of Cinchona spp. and Tanacetum spp. amidst managed forest areas [63]. Moreover, cattle are known to suffer in lowlands where parasite pressure tend to be stronger than in the highlands.
Palm oil shows a decrease of areas with high potential suitability similar to the previous LUTs (−14.9%), but starting from a much lower area of potential high suitability (25,793 ha that become 15,182 ha considering accessibility). This decrease happens especially in the southwest boundary of the study area, while the high suitability is confirmed in the central-southern part of the study area (Figure 9). In the study area, oil palm is a cash crop rarely grown in plantations. Oil harvest is much more common as an artisanal practice, in easily accessible lowlands with fertile soils, where the production of single naturally occurring plants can be valorized. Our results confirm the information collected during filed visits.
Bean shows the lowest decrease of areas with high potential suitability respect to all the other LUTs (−2.9%) but starting from the lowest amount of areas with high potential suitability (12,496 ha that become 10,447 ha). Land suitability decrease significantly when the accessibility factor is taken into consideration: even in the most suitable part in the east, some large areas with medium (and low) suitability appear. Bean is confirmed the least suited LUT in the study area. Nevertheless, during the field visits, widespread cropping of bean was reported, both about climbing and dwarf varieties. Interviewees declared that bean shows good attitude also in poor soils and remote areas, due to the nitrogen fixing ability and to the common local practice of harvesting already-dried beans, which facilitates long-distance transportation. Climbing bean is more adapted to highlands and to sloppy zones while dwarf bean easily adapts to lowlands and are much more indifferent to slopes.
If we consider all the LUTs together, we are able to identify the most versatile areas, i.e., areas suitable for more than one LUT, where farmers, and their supporters, have a wider set of possible crops to choose upon. More than 56% of the study area is simultaneously highly suitable to at least 2 LUTs (Figure 10).
The areas characterized by the highest multi-suitability are located along the eastern border of Katoyi area. The multi-suitability, then, decreases progressively in the north and the central area.
The target LUTs chosen proved to be actually relevant in the collectivity of Katoyi given that almost the 73% of the study area is highly suitable for at least 1 LUT and only the 5% presents low suitability for all the LUTs considered (Figure 10).
A recent study [38] using remote-sensed images for land use analysis in NK province (DRC) allows for a shorthand comparison of the real land suitability results with the ongoing land uses. Figure 11 illustrates the distribution of agriculture, pasture and forest across the study area in 2018. According to the mentioned study [38], 52.2% of the 71,409.8 ha available within Katoyi boundaries are forested. 30.5% of lands is used for agriculture and 17.3% is dedicated to pasture.
The Agricultural Development Cooperation (ADC) organizations active in the study area are interested in identifying the priority zones where to focus interventions that should address the most suitable LUTs by also taking into consideration the present land use. This attitude answers to the need of increasing the efficiency of the intervention by prioritizing the areas where most suited LUTs are already in place, and of supporting land use changes that minimize environmental impact while maximizing socioeconomical returns.
Given the ecological features of the study area, on the outskirts of the second largest forest on planet Earth, we assume the perspective of forest conservation in order to correctly interpret the results and produce useful pieces of advice to ADC organizations.
To this aim, the comparison between actual land use and the obtained results about suitability are shown in the next figures.
Concerning areas suitable for forestry (Figure 12), the observed land use matches highly suitable lands for forestry in 31.8% of the whole study area (and in 16.2% in the case of medium suitable land). As already mentioned, forestry represents the spontaneous climax land cover in the region, and according to local experts, it does not show any constraint in terms of soil quality, slope, and elevation.
Our suitability analysis helps identifying the areas where forestry should be the only (or most) supported activity and the areas where to push mixed land uses. The identification of the areas in which the actual forest cover matches the suitability to forestry helps achieving the first aim. 61% and 31% (22,720.5 and 11,536.2 ha) of the land currently covered by forest is located in areas with high or medium suitability for forestry, respectively.
Figure 12 highlights (in dark green) the lands with high suitability for forestry and that are actually, and “consistently”, forested. These constitute 61.0% of the land actually covered by forests (which in turns covers 31.8% of the whole study area). On one hand, these areas are easily accessible and highly suitable for forestry. On the other hand, in these areas, the only intervention consistent with international goals of forest conservation could be related to sustainable forest management and valorization. Obviously, it does not mean that forestry or forest management are actually implemented in all the areas covered by forests, but the results show the high potential for the expansion of these activities in these areas, scattered across the study area but generally served by the road network.
In the land actually covered by forest and classified as medium or low suitable for forestry (green and light green), which amount to 20.4% of the study area, inhabitants could profit from advancing agricultural or pastoral practices by eroding the forest cover. In this case, local needs should be accurately weighted against the internationally set environmental goals related to forest and soil conservation. In fact, soils in forested areas are mainly thin and fragile, and their quality is strictly related to the carbon cycle related to forest cover. In such a pedologic context, in order to remain sustainable, the development of these areas critically needs an agroecological approach to land valorization, which could integrate the intrinsic value of the actual forest cover and the increase of human exploitation through agroforestry or sylvo-pastoralism.
The actually forested land featuring low suitability to forestry may be identified as sound areas where to push agricultural or grazing activities, even if it would be important take into account the suitability to the other LUTs. These areas are located mostly in the less accessible part of the collectivity, i.e., the western part.
Areas highly suitable for forestry but actually used for agriculture and pasture (in red in the Figure 12) amount to 32.8% of the study area, 14,912 ha (20.9%) occupied by agriculture and 8523 ha (11.9%) by pasture), that represent the 68.9% and 68.4% of the land currently used for agriculture and for cattle grazing, respectively. These lands could profitably host mixed production systems involving agro-sylvo-pastoral activities on the same lands, instead of specialized land uses. This is particularly important information in the study area where large portion of the land are owned by few landowners [38]. In fact, large land holdings show higher risk of being devoted to only one use with a specialized monocultural cropping system. Nevertheless, in NK plantations of eucalyptus are very common, due to the role of the species in producing construction wood and charcoal. Eucalyptus forestry is suited to highlands fertile soils, and it is indifferent to long distance transportation, even if it must be said that remote plantations are mostly used for charcoal, which have lower market price, while accessible plantation are easily used for carpentry.
In these areas, located mostly within the previously mentioned consistently forested areas, ADC organization may suggest for partial reforestation under a scheme of agroforestry or sylvo-pastoralism. In fact, interventions supporting the inhabitants in the diversification toward mixed production schemes may introduce and valorize the forestry component and increase the overall productivity. In these areas, and especially due to high slopes, it is strongly recommended to adopt soil conservation techniques such as terracing, key-line design, no-tillage, mulching and cover crops.
Areas with medium or low suitability for forestry that are currently used for agriculture or pasture (orange and pink in Figure 12), amount altogether to 15.0% of the whole study area. These areas are the most interesting for agricultural development but appear to be located in the western part of Katoyi, which is the less accessible and less suitable for animal grazing due to the low altitude. ADC organizations could support the ongoing activities or, according to the specific suitability of lands, push for oil palm cropping.
Considering agriculture (Figure 13), which is the second most widespread land use in Katoyi, and focusing on the whole study area, the land highly suitable to at least 1 crop (among the 5 ones in the considered LUTs) matches the actual agricultural (cropped) areas only in 23.9% of the whole study area (orange in Figure 13). It represents 78.3% of the agricultural land. These areas are scattered across the whole collectivity but mainly located in the eastern and central part of Katoyi. These are, from ADC organizations’ standpoint, the areas where to support existing activities with the aim of valorizing the right localization of already existing activities, and namely the vocation of land to the target LUTs.
From the opposite perspective, it is encouraging to report that only 21.7% of the land currently used for agriculture present no high suitability to crops (light yellow) and represent only the 6.6% of the study area. These areas represent the ones where ADC organizations could profitably advocate for a diversified production and/or a shift away from the actually occurring crops.
Further comparison between current land uses and land suitability to cropping reveals that 68.6% (25,559 ha) of forests (light green) and 75.6% (9359 ha) of pastures (light blue) are located on areas highly suitable for at least one crop, representing the 35.8% and 13.1% of the study area, respectively. The former is mainly located in the central part of the study area, while the latter in the northern and eastern parts.
Considering the high human pressure on natural resources and landscapes, ADC organizations may be particularly interested in the identification of these areas in order to implement specific interventions aiming the integration of agricultural production and cattle grazing on the existing pastures, or the integration of forest conservation and agricultural expansion through agroforestry. Once more, soil management should build on the consciousness of existing slopes and thin fertile soil horizons, which should be managed according to the best available practices for soil conservation (i.e., terracing, key-line design, no-tillage, mulching and cover crops).
Pastures represents the third land use in Katoyi. According to our analysis (Figure 14), 64.6% (7990 ha) and 24.3% (3001 ha) of the land currently used for pasture presents high or medium suitability to cattle grazing, respectively.
Unfortunately, the results also show that 54.7% (11,928 ha) of the land currently used for agriculture and 45.1% (16,810 ha) of the land covered by forests present high suitability to grazing (dark red in Figure 14). These areas, located in the northern and eastern parts of the study area, could be the ones where ADC organizations may be interested in supporting the integration of cropping with more rational pastoral activities. Here, given that grazing often takes place in lowlands with relative lower slope, soil management practices could range from the already mentioned conservation techniques to more intensive ones, including subsoiling and minimum tillage.

4. Conclusions

This study assessed the land suitability for different agro-sylvo-pastoral land uses in NK (DRC) in the framework of the EU-funded ARDST Development Cooperation Project led by Caritas Development Goma NGO.
In this context, characterized by a general lack of available and updated data and limited time availability due to the DC programs deadlines, DC organizations need decision support tools that are easily applicable, reliable, and scientifically sound. Local stakeholders, i.e., farmers and technicians, who very often retain in-depth empirical knowledge about local land and agricultural systems, must have access to effective tools for decision-making processes.
In this context, a specific methodology for rapid participatory assessment of land suitability has been developed in order to identify the most suitable crops to be supported in different zones of the study area.
Local farmers and technicians have been involved from the earliest phases of the project in the identification of the relevant land uses (LUTs) of the study area and in the assessment of the productive response of each LUT to the different capability factors and their proxies.
They have also been involved in the quantification of the thresholds for the assessment of accessibility (a very important land-use determinant for agricultural development cooperation in rural communities), based on the “access time criterion”.
The use of GIS technology allowed to take into account simultaneously all the parameters involved in the assessment methodology and to integrate all the geographical information produced (thematic maps) in a final overall assessment of the most suitable areas for the different crops.
Finally, actual land uses have been compared with the land suitability in order to propose specific local improvement interventions for the different rural production activities (agriculture, forestry, cattle grazing).
The methodology developed proved to be effective in identifying the areas where it is better to concentrate development cooperation interventions as a priority in order to improve the possibilities of local communities.
In fact, the study shows that about 67% of the study area (47,774 ha) presents a land use type congruent with the land suitability (22,721 ha of forestry in areas with high suitability to forestry, 17,063 ha of crops in areas with high suitability for at least 1 crop, and 7990 ha of pasture in areas with high suitability to cattle grazing).
On the other hand, the remaining 33% of the study area presents a land use type that can be eventually modified for a more rational and sustainable use of environmental resources.
Despite the limitations of the study (related to the different choices we had to make to overcome the lack of data) the results show how development cooperation practitioners can profit from using scientifically sound but still-applicable methodologies to inform strategic evaluation in development planning. Namely, the results obtained have been successfully used in NK by Caritas Development Goma for the strategic evaluation and the increase of sustainability of the agricultural sector. The adoption of the proposed methodology, if supported by technical regulations in DC, may constitute a new standard for improving the sustainability of interventions in line with the European Development Fund National Strategy for the Democratic Republic of Congo, and beyond.

Author Contributions

Conceptualization, P.D.M. and G.S. (Giulio Senes); methodology, G.S. (Giulio Senes) and P.S.F.; software, G.S. (Giulio Senes) and P.S.F.; validation, P.D.M., G.S. (Giulio Senes) and G.S. (Guido Sali); formal analysis, P.S.F.; investigation, P.D.M.; resources, G.S. (Guido Sali), G.S. (Giulio Senes) and P.D.M.; data curation, P.D.M. and P.S.F.; writing—original draft preparation, P.D.M.; writing—review and editing, P.D.M., P.S.F. and G.S. (Giulio Senes); visualization, P.S.F.; supervision, G.S. (Giulio Senes) and G.S. (Guido Sali); project administration, G.S. (Guido Sali); funding acquisition, G.S. (Guido Sali). All authors have read and agreed to the published version of the manuscript.

Funding

This research was funded by the ARDST project within the EU strategy for peace seeking and keeping operations in the African Great Lakes region (Grant No. 360149 of ICSP–Instrument contributing stability and peace).

Institutional Review Board Statement

Not applicable.

Informed Consent Statement

Not applicable.

Data Availability Statement

The data presented in this study are available on request from the corresponding author. The data are not publicly available due to credit restrictions.

Acknowledgments

The framework for this study is provided by a three-year EU-funded project called ARDST “Appui au retour de réfugiés et déplacés par le biais de la sécurisation de terres en Diocèse de Goma”, led by Caritas Développement Goma NGO. The project started in February 2016 and ended in June 2019. We would like to acknowledge the fundamental role of the whole ARDST project team. Moreover, we acknowledge the role of Giacinto Manfron in the initial conceptualisation of the methodology. The authors acknowledge the support in publishing received from the Department of Agrienvironmental Science, Production, Landscape, Agrienergy of the University of Milan through the APC initiative.

Conflicts of Interest

The authors declare no conflict of interest.

References

  1. Bagheri Bodaghabadi, M.; Martínez-Casasnovas, J.A.; Khakili, P.; Masihabadi, M.H.; Gandomkar, A. Assessment of the FAO Traditional Land Evaluation Methods, A Case Study: Iranian Land Classification Method. Soil Use Manag. 2015, 31, 384–396. [Google Scholar] [CrossRef] [Green Version]
  2. Chen, J. GIS-Based Multi-Criteria Analysis for Land Use Suitability Assessment in City of Regina. Environ. Syst. Res. 2014, 3, 13. [Google Scholar] [CrossRef] [Green Version]
  3. Senes, G.; Fumagalli, N.; Ferrario, P.S.; Rovelli, R.; Sigon, R. Definition of a Land Quality Index to Preserve the Best Territories from Future Land Take. An Application to a Study Area in Lombardy (Italy). J. Agric. Eng. 2020, 51, 43–55. [Google Scholar] [CrossRef]
  4. Feizizadeh, B.; Blaschke, T. Land Suitability Analysis for Tabriz County, Iran: A Multi-Criteria Evaluation Approach Using GIS. J. Environ. Plan. Manag. 2012, 2012, 1–23. [Google Scholar] [CrossRef]
  5. Store, R.; Kangas, J. Integrating Spatial Multi-Criteria Evaluation and Expert Knowledge for GIS-Based Habitat Suitability Modelling. Landsc. Urban Plan. 2001, 55, 79–93. [Google Scholar] [CrossRef]
  6. Girvetz, E.H.; Thorne, J.H.; Berry, A.M.; Jaeger, J.A.G. Integration of Landscape Fragmentation Analysis into Regional Planning: A Statewide Multi-Scale Case Study from California, USA. Landsc. Urban Plan. 2008, 86, 205–218. [Google Scholar] [CrossRef]
  7. Marull, J.; Pino, J.; Mallarach, J.M.; Cordobilla, M.J. A Land Suitability Index for Strategic Environmental Assessment in Metropolitan Areas. Landsc. Urban Plan. 2007, 81, 200–212. [Google Scholar] [CrossRef]
  8. Rojas, C.; Pino, J.; Jaque, E. Strategic Environmental Assessment in Latin America: A Methodological Proposal for Urban Planning in the Metropolitan Area of Concepción (Chile). Land Use Policy 2013, 30, 519–527. [Google Scholar] [CrossRef]
  9. Senes, G.; Ferrario, P.S.; Cirone, G.; Fumagalli, N.; Frattini, P.; Sacchi, G.; Valè, G. Nature-Based Solutions for Storm Water Management—Creation of a Green Infrastructure Suitability Map as a Tool for Land-Use Planning at the Municipal Level in the Province of Monza-Brianza (Italy). Sustainability 2021, 13, 6124. [Google Scholar] [CrossRef]
  10. FAO Land and Water Development Division. A Framework for Land Evaluation. In FAO Soils Bulletin; FAO Publishing and Multimedia Service: Rome, Italy, 1976; Volume 32. [Google Scholar]
  11. FAO Land and Water Division. Guidelines: Land Evaluation for Extensive Grazing. In FAO Soils Bulletin; FAO Publishing and Multimedia Service: Rome, Italy, 1991; Volume 58. [Google Scholar]
  12. Al-Mashreki, M.H.; Akhir, J.B.M.; Rahim, S.A.; Desa, K.; Lihan, T.; Haider, A.R. Land Suitability Evaluation For Sorghum Crop in the Ibb Governorate, Republic of Yemen Using Remote Sensing And GIS Techniques. Aust. J. Basic Appl. Sci. 2011, 10, 359–368. [Google Scholar]
  13. Ashraf, S.; Normohammadan, B. Qualitative Evaluation of Land Suitability for Wheat in Northeast-Iran Using FAO Methods. Indian J. Sci. Technol. 2011, 4, 703–707. [Google Scholar] [CrossRef]
  14. Bhattarai, K.; Yousef, M.; Greife, A.; Naraharisetti, S. Influence of Topography on Sustainable Land Management: An Analysis of Socioeconomic and Ecodemographic Conditions of Nepal. Agriculture 2020, 10, 224. [Google Scholar] [CrossRef]
  15. Li, Y.; Yang, X.; Long, W. Topographic Dependence of Cropland Transformation in China during the First Decade of the 21st Century. Sci. World J. 2013, 2013, 1–12. [Google Scholar] [CrossRef] [PubMed] [Green Version]
  16. UNSDG. United Nations Sustainable Development Cooperation Framework; UNSDG: New York, NY, USA, 2019. [Google Scholar]
  17. Ziadat, F.; Bruggeman, A.; Oweis, T.; Haddad, N.; Mazahreh, S.; Sartawi, W.; Syuof, M. A Participatory GIS Approach for Assessing Land Suitability for Rainwater Harvesting in an Arid Rangeland Environment. Arid. Land Res. Manag. 2012, 26, 297–311. [Google Scholar] [CrossRef] [Green Version]
  18. Zabihi, H.; Alizadeh, M.; Langat, P.; Karami, M.; Shahabi, H.; Ahmad, A.; Said, M.; Lee, S. GIS Multi-Criteria Analysis by Ordered Weighted Averaging (OWA): Toward an Integrated Citrus Management Strategy. Sustainability 2019, 11, 1009. [Google Scholar] [CrossRef] [Green Version]
  19. Vasu, D.; Srivastava, R.; Patil, N.; Tiwary, P.; Chandran, P.; Singh, S. A Comparative Assessment of Land Suitability Evaluation Methods for Agricultural Land Use Planning at Village Level. Land Use Policy 2018, 79, 146–163. [Google Scholar] [CrossRef]
  20. Sicat, R.; Carranza, E.; Nidumolu, U. Fuzzy Modeling of Farmers’ Knowledge for Land Suitability Classification. Agric. Syst. 2005, 83, 49–75. [Google Scholar] [CrossRef]
  21. Bojorquez-Tapia, L.; Diaz-Mondragon, S.; Ezcurra, E. GIS-Based Approach for Participatory Decision Making and Land Suitability Assessment. Int. J. Geogr. Inf. Sci. 2001, 15, 129–151. [Google Scholar] [CrossRef]
  22. Dunnett, A.; Shirsath, P.B.; Aggarwal, P.K.; Thornton, P.; Joshi, P.K.; Pal, B.D.; Khatri-Chhetri, A.; Ghosh, J. Multi-Objective Land Use Allocation Modelling for Prioritizing Climate-Smart Agricultural Interventions. Ecol. Model. 2018, 381, 23–35. [Google Scholar] [CrossRef]
  23. Kwaku Kyem, P.A. Of Intractable Conflicts and Participatory GIS Applications: The Search for Consensus amidst Competing Claims and Institutional Demands. Ann. Assoc. Am. Geogr. 2004, 94, 37–57. [Google Scholar] [CrossRef]
  24. Marschall, P. Evidence-Oriented Approaches in Development Cooperation? Experiences, Potential and Key Issues; Discussion Paper/German Development Institute; Deutsches Institut für Entwicklungspolitik gGmbH: Bonn, Germany, 2018. [Google Scholar]
  25. European Commission. Joint Communication to the Council: A Strategic Framework for the Great Lakes region. In High Representative of the European Union for Foreign Affairs and Security Policy; European Commission: Brussels, Belgium, 2013. [Google Scholar]
  26. UNDP. Building Peace and Advancing Development in the Great Lakes Region; UNDP Publishing: New York, NY, USA, 2013. [Google Scholar]
  27. Mayne, J. Building an Evaluative Culture for Effective Evaluation and Results Management; ILAC Worki.; Institutional Learning and Change Initiative: Rome, Italy, 2008. [Google Scholar]
  28. IPES-Food. From Uniformity to Diversity: A Paradigm Shift from Industrial Agriculture to Diversified Agroecological Systems; International Panel of Experts on Sustainable Food systems: Brussels, Belgium, 2016. [Google Scholar]
  29. Barbier, J.-C.; Hawkins, P. Evaluation Cultures, Sense-Making in Complex Times; Routledge: London, UK, 2012. [Google Scholar]
  30. Chambers, R. Participatory Rural Appraisal (PRA)-Challenges, Potentials and Paradigm. World Dev. 1994, 22, 1437–1454. [Google Scholar] [CrossRef]
  31. MONUSCO. UN Reports Hundreds of Human Rights Violations as Security Situation in North Kivu Deteriorates. Available online: https://www.ohchr.org/en/press-releases/2018/12/drc-un-reports-hundreds-human-rights-violations-security-situation-north (accessed on 15 December 2018).
  32. Tegera, A. La Conference de Goma et La Question de La Presence Des FDLR Au Nord et Sud Kiu: Etat Des Lieux; Pole Institute: Goma, Congo, 2008. [Google Scholar]
  33. Gabriel Habimana. Goma; Caritas Development Goma: Goma, Congo, 2015; (Unpublished Project Document). [Google Scholar]
  34. Nthengwe, D. Some 17,000 People Return Home in District of Conflict-Ravaged North Kivu. Available online: https://www.unhcr.org/news/latest/2009/5/4a0add026/17000-people-return-home-district-conflict-ravaged-north-kivu.html#:~:text=Some%2017%2C000%20displaced%20Congolese%20people,agreed%20on%20peace%20in%20March (accessed on 15 December 2018).
  35. World Bank. World Bank Staff Estimates Based on Age/Sex Distributions of United Nations Population Division’s World Population Prospects: 2019 Revision. Available online: https://data.worldbank.org/indicator/SP.POP.1564.TO.ZS (accessed on 15 December 2020).
  36. Ministère Provincial du Plan of DRC MINPLAN. Localisation Des Objectifs de Développement Durable Dans Le Nord-Kivu. 2017. Available online: https://www.local2030.org/library/406/locating-the-sdgs-in-north-kivu-provincial-report.pdf (accessed on 12 November 2020).
  37. Mahrt, K.; Nanivazo, M. Growth and Poverty in the Democratic Republic of Congo. In Growth and Poverty in Sub-Saharan Africa; Arndt, C., McKay, A., Tarp, F., Eds.; Oxford University Press: Oxford, UK, 2016; pp. 421–446. [Google Scholar]
  38. De Marinis, P.; De Petris, S.; Sarvia, F.; Manfron, G.; Momo, E.J.; Orusa, T.; Corvino, G.; Sali, G.; Borgogno, E.M. Supporting Pro-Poor Reforms of Agricultural Systems in Eastern DRC (Africa) with Remotely Sensed Data: A Possible Contribution of Spatial Entropy to Interpret Land Management Practices. Land 2021, 10, 1368. [Google Scholar] [CrossRef]
  39. Vlassenroot, K. Households Land Use Strategies in a Protracted Crisis Context: Land Tenure, Conflict, and Food Security in Eastern DRC; FAO: Rome, Italy, 2006. [Google Scholar]
  40. Sebastian, K. Agro-Ecological Zones of Africa 2009. Available online: https://www.ifpri.org/publication/agro-ecological-zones-africa. (accessed on 15 December 2020).
  41. CTA. Building the Evidence Base on the Agricultural Nutrition Nexus: Democratic Republic of Congo; CTA Working Papers; Université Evangélique en Afrique: Apia, Samao, 2017; Volume 17, ISBN 978-982-9003-88-1. [Google Scholar]
  42. Buck, C.E.; Daneshkhah, A. Uncertain Judgements: Eliciting Experts’ Probabilities. Statistics in Practice; Wiley: Hoboken, NJ, USA, 2006. [Google Scholar]
  43. Fischer, A.R.H.; Wentholt, M.T.A.; Rowe, G.; Frewer, L.J. Expert Involvement in Policy Development: A Systematic Review of Current Practice. Sci. Public Policy 2014, 41, 332–343. [Google Scholar] [CrossRef] [Green Version]
  44. Malczewski, J. GIS-Based Land-Use Suitability Analysis: A Critical Overview. Prog. Plan. 2004, 62, 3–65. [Google Scholar] [CrossRef]
  45. De Marinis, P.; Sali, G. Rapport Conclusif de l’étude Des Potentialités Agricoles En Diocèse de Goma. Projet ARDST; Caritas Development Goma: Goma, Congo, 2019. [Google Scholar]
  46. Akıncı, H.; Özalp, A.Y.; Turgut, B. Agricultural Land Use Suitability Analysis Using GIS and AHP Technique. Comput. Electron. Agric. 2013, 97, 71–82. [Google Scholar] [CrossRef]
  47. El Baroudy, A.A. Mapping and Evaluating Land Suitability Using a GIS-Based Model. Catena 2016, 140, 96–104. [Google Scholar] [CrossRef]
  48. Parry, J.A.; Ganaie, S.A.; Sultan Bhat, M. GIS Based Land Suitability Analysis Using AHP Model for Urban Services Planning in Srinagar and Jammu Urban Centers of J&K, India. J. Urban Manag. 2018, 7, 46–56. [Google Scholar] [CrossRef]
  49. Yohannes, H.; Soromessa, T. Integration of Remote Sensing, GIS and MCDM for Land Capability Classification in Andit Tid Watershed, Ethiopia. J. Indian Soc. Remote Sens. 2019, 47, 763–775. [Google Scholar] [CrossRef]
  50. FAO. Guidelines for Land-Use Planning; FAO Development Series 1; FAO Publishing and Multimedia Service: Rome, Italy, 1996. [Google Scholar]
  51. FAO. Directives: Evaluation Des Terres Pour l’Agriculture Pluviale; Bulletin Pédologique de la FAO: Rome, Italy, 1988; Volume 52. [Google Scholar]
  52. Pecrot, A.; Leonard, A. Dorsale Du Kivu; Carte de Sols et de la Vegetation du Congo Belge et du Rwanda-Burundi; Institut National pour L’étude Agronomique du Congo Belge: Brussells, Belgium, 1960. [Google Scholar]
  53. Verdoodt, A.; van Ranst, E. Land Evaluation for Agricultural Production in the Tropics: A Large Scale Land Suitability Classification for Rwanda; Ghent University, Laboratory of Soil Science: Ghent, Belgium, 2003. [Google Scholar]
  54. Verburg, P.H.; Overmars, K.P.; Witte, N. Accessibility and Land-Use Patterns at the Forest Fringe in the Northeastern Part of the Philippines. Geogr. J. 2004, 170, 238–255. [Google Scholar] [CrossRef]
  55. Hippoliti, G. Sulla Determinazione Delle Caratteristiche Del La Viabilità Forestale. Ital. J. For. Mt. Environ. 1976, 31, 241–255. [Google Scholar]
  56. Grigolato, S.; Pellegrini, M.; Cavalli, R. Temporal Analysis of the Traffic Loads on Forest Road Networks. Iforest 2013, 6, 255–261. [Google Scholar] [CrossRef] [Green Version]
  57. Laschi, A.; Neri, F.; Montorselli, N.B.; Marchi, E. A Methodological Approach Exploiting Modern Techniques for Forest Road Network Planning. Croat. J. For. Eng. 2016, 13, 319–331. [Google Scholar]
  58. Hossain, M.S.; Islam, M.N.; Rahman, M.M.; Mostofa, M.G.; Khan, M.A.R. Sorghum: A Prospective Crop for Climatic Vulnerability, Food and Nutritional Security. J. Agric. Food Res. 2022, 8, 100300. [Google Scholar] [CrossRef]
  59. De Marinis, P.; Spada, A.; Aristil, J. Evaluation Des Paramètres Productifs et Quantification d’aflatoxine de Sept Variétés de Maïs (Zea Mays L.) Testées En Haïti Yield Evaluation and Aflatoxin Quantification of Seven Maize Varieties (Zea Mays L.) Tested in Haiti. Int. J. Biol. Chem. Sci. 2019, 13, 3009–3022. [Google Scholar] [CrossRef]
  60. Gaye, M. Les Cultures Céréalières Dans Le Bassin Arachidier: Motivations et Contraintes; Institut National de Recherche Agricoles: Dakar, Senegal, 1994. [Google Scholar]
  61. Samaké, O.; Smaling, E.M.A.; Kropff, M.J.; Stomph, T.J.; Kodio, A. Effects of Cultivation Practices on Spatial Variation of Soil Fertility and Millet Yields in the Sahel of Mali. Agric. Ecosyst. Environ. 2005, 109, 335–345. [Google Scholar] [CrossRef]
  62. Cox, T.P. The Land as a Casualty: Soil, Cattle, and the Future in South Kivu, DRC. Ph.D. Thesis, University College Department of Anthropology, London, UK, 2008. [Google Scholar]
  63. Blaise, M.M. Land, Power and Identity. The Politics of Scale and Violent Conflict in Masisi, “DR Congo”. Ph.D. Thesis, University of Bayreuth: Bayreuth International Graduate School of African Studies (GIGSAS), Bayreuth, Germany, 2017. [Google Scholar]
Figure 1. Geographical framework of the study area. (A) The Democratic Republic of the Congo; (B) The Diocese of Goma, located at the extreme east of the DRC, in North and South Kivu provinces; (C) The collectivity of Katoyi, located at the south border of the Goma Diocese.
Sustainability 14 13049 g001
Figure 2. Research workflow. Acronyms used: LUT = Land Use Type; LCF = Land Capability Factor; DRC = Democratic Republic of Congo.
Sustainability 14 13049 g002
Figure 8. Differences for areas for the seven LUTs between potential and real land suitability.
Sustainability 14 13049 g008
Figure 9. Land suitability maps, compared with the areas of high potential land suitability, for each of the seven LUTs.
Sustainability 14 13049 g009
Figure 10. Multiple suitability map of the study area.
Sustainability 14 13049 g010
Figure 11. Land use map for the study area (authors’ elaboration on available data [38]).
Sustainability 14 13049 g011
Figure 12. Map (and relative table) showing the comparisons between the land suitability to forestry and the actual land use.
Sustainability 14 13049 g012
Figure 13. Map (and relative table) showing the comparisons between the land suitability to crops and the actual land use.
Sustainability 14 13049 g013
Figure 14. Map (and relative table) showing the comparisons between the land suitability to cattle grazing and the actual land use.
Sustainability 14 13049 g014
Table 1. The seven land use types (LUTs) included in the land suitability assessment.
LUTScientific Name
Cattle grazing
BananaMusa acuminata
BeanPhaseulus vulgaris
ManiocManihot esculenta
Oil PalmElaeis guineensis
SorghumSorgum bicolor
Forestry
Table 2. LCFs, proxies and sources of information considered in the study.
LCFProxyData Source and Resolution
Climatic factorElevation classesASTER (Advanced Spaceborne Thermal Emission and Reflection Radiometer) GDEM (Global Digital Elevation Model) version 2.
Pixel resolution: 30 × 30 m.
Topographic factorSlope classesSlope calculation on ASTER GDEM v. 2 data.
Pixel resolution: 30 × 30 m.
Soil factorSoil quality (fertility) classes“Dorsale du Kivu” Soil map.
Scale 1:500,000 [52]
Table 3. Suitability scores (1 to 5) derived by expert elicitation: the higher the score, the better is the suitability of the specific LCF class for the specific LUT.
LCF LUTsLUTs Suitability Scores (SC)
LCF Class Cattle GrazingBananaBeanManiocPalm OilSorghumForestry
Soil quality (SQ)High4324553
Medium3324443
Low2231113
Mean3.02.72.33.03.33.33.0
St.dev.1.00.60.61.72.12.10.0
Slope (SL)High4444235
Medium4333234
Low1232431
Mean3.03.03.03.02.73.03.3
St.dev.1.71.00.51.01.20.02.1
Elevation (EL)High4443143
Medium4433143
Low1122513
Mean3.03.02.82.72.33.03.0
St.dev.1.71.70.80.62.31.70.0
Table 4. Potential and real suitability for the seven LUTs in Katoyi.
LUT HighMediumLow
(%)(ha)(%)(ha)(%)(ha)
ForestryPotential suitability99.6%71,1020.4%3080.0%0
Real suitability64.6%46,15628.4%20,2537.0%5001
ManiocPotential suitability85.9%61,32613.6%97420.5%342
Real suitability56.5%40,32732.6%23,31210.9%7771
SorghumPotential suitability62.9%44,90035.9%25,6601.2%850
Real suitability51.7%36,88638.2%27,30710.1%7217
BreedingPotential suitability62.6%44,73637.2%26,5300.2%144
Real suitability51.4%36,72938.8%27,7249.7%6957
BananaPotential suitability62.6%44,73536.7%26,2110.6%464
Real suitability45.0%32,10740.7%29,04614.4%10,257
Palm OilPotential suitability36.1%25,79363.9%45,6170.0%0
Real suitability21.3%15,18265.8%46,95913.0%9269
BeanPotential suitability17.5%12,49682.5%58,9140.0%0
Real suitability14.6%10,44770.1%50,07415.2%10,889
Publisher’s Note: MDPI stays neutral with regard to jurisdictional claims in published maps and institutional affiliations.

