Abstract
The urban form is the physical configuration of a city, developed over time and space. Urban form can be considered at different scales, from region to neighborhood, each carrying a different focus. North Cianjur serves as the hinterland and one of the conurbation corridors of the Jakarta–Bandung Mega-Urban Region, meaning that the balance between its function as an environmental buffer area and the destination of urban growth needs to be planned carefully. This paper explores the dynamics in North Cianjur and employs several model scenarios as a planning intervention using landscape dynamic tools and land-change modeling, with three scenarios employed: Business as Usual (BAU), Spatial Planning Policy (SPP), and Urban Containment (UCT). The result show that North Cianjur has transformed into a polycentric region with two urban zones, a peri-urban zone, and a rural zone in the northernmost part of the region. Urban form trends show a sprawling built-up pattern outside urban zones, and a compacted trend in urban zones due to expansion from the Jakarta and Bandung Metropolitan Area. UCT models appear to be the most optimal for implementation in North Cianjur, representing a way to accommodate urban growth and expansion inside the urban center while still maintaining regional sustainability.
1. Introduction
Urban form, in its conceptual view, can be described as the spatial pattern of human activities. Often it is the physical characteristics that make up the physical configuration of a city, including the shape, size, density, and configuration of settlements [1]. The urban form also includes the relationship between the physical configuration of a city and the relationships between the elements that compose it, such as land-use patterns, population and housing density, infrastructure, transport, and networks [2,3,4]. These forms and relationships result from the multidimensional factors shaping a city, demographic, socioeconomic, planning, and cultural processes developed over time and space [5,6,7].
Urban form can be considered at different scales: the regional scale, which refers to the spatial extent of a region and the rural–urban configuration [8]; the urban/city scale, which refers to the spatial configuration of urban settlement types [9]; the district scale, which refers to how streets and transportation networks are organized and how urban amenities are distributed [8]; and neighborhood scale, which relates to the configuration of urban blocks [1]. Urban form is an aspect that continually evolves by responding to social, environmental, economic and technological development, and is often mediated/controlled by policies in planning, housing and urban policy, health, transport, and economics [10,11].
Urban areas such as metropolitan, cities, hinterlands, and conurbations can be seen as systems in which relatively slow-changing urban forms provide the setting for more rapidly-changing ‘flows’ of capital, people, pollutants, cultures, and technologies [12,13]. However, in rapid urban expansion, an urban agglomeration and similar forces affecting urban areas might highly disrupt these ‘flows’ and demand a more dynamic or fast-changing urban form. Often, fast-changing urban forms create various issues such as economic collapse [14], degradation of the urban environment and quality of life [15,16], social unrest [17], peak energy, and climate crises [18].
The growth and expansion of urban areas from the earliest stages until today are the result of several internal and external factors such as industrialization, shifting economic structures and development, transportation modes and extent, physical and geographical properties of the site, environmental characteristics, and planning process [11,19,20]. The continuous growth of these human-made developments has magnified urban problems and issues due to the unorganized nature of urban development, which is often viewed as economically more practical in the short term while proving to be a more costly decision when considering the wasted resources and environmental problems created in the long term [21,22]. Hence, in the recent decades an awareness of uncontrolled urban development and its negative consequences has grown [23,24], resulting in sustainable urban development and urban form [25,26].
Achieving sustainable urban development is not limited to the core of a metropolitan area; it can take place in its surrounding regions as well, especially in hinterland areas [27,28]. Hinterland areas are conceptualized as fluid and dynamic regions which have a relationship of mutual dependency with the core metropolitan area through a dynamic urban–rural linkage [29,30]. Urban–rural linkage determines the configuration of such urban forms [31]. Sustainability in the context of hinterland development correlates well with SDG 11, which aims to make cities and human settlements inclusive, safe, resilient, and sustainable. It revolves around mitigating and preparing regions to face rapid urbanization, which then will affect the spatial configuration of a region or its urban form. Better urban forms in this context combine elements of broad conceptualizations of sustainability and resiliency. They are defined as those that [1] underpin the functioning of an array of urban systems, use resources sustainably, and provide a sound economic base that provides the setting for a good quality of life for their inhabitants.
Several findings on urban form dynamics and sustainable hinterland development suggest that sustainable hinterland development must form a linkage with the main metropolitan areas, and that urban form is an essential aspect as the base of spatial layout to build that linkage [7,32,33]. The urban form approach in hinterland development is important as a tool in zoning in order to avoid sprawl or uncontrolled development [33]. In addition, it could identify economic influences and other socio-ecological factors acting as indicators of regional sustainability [34].
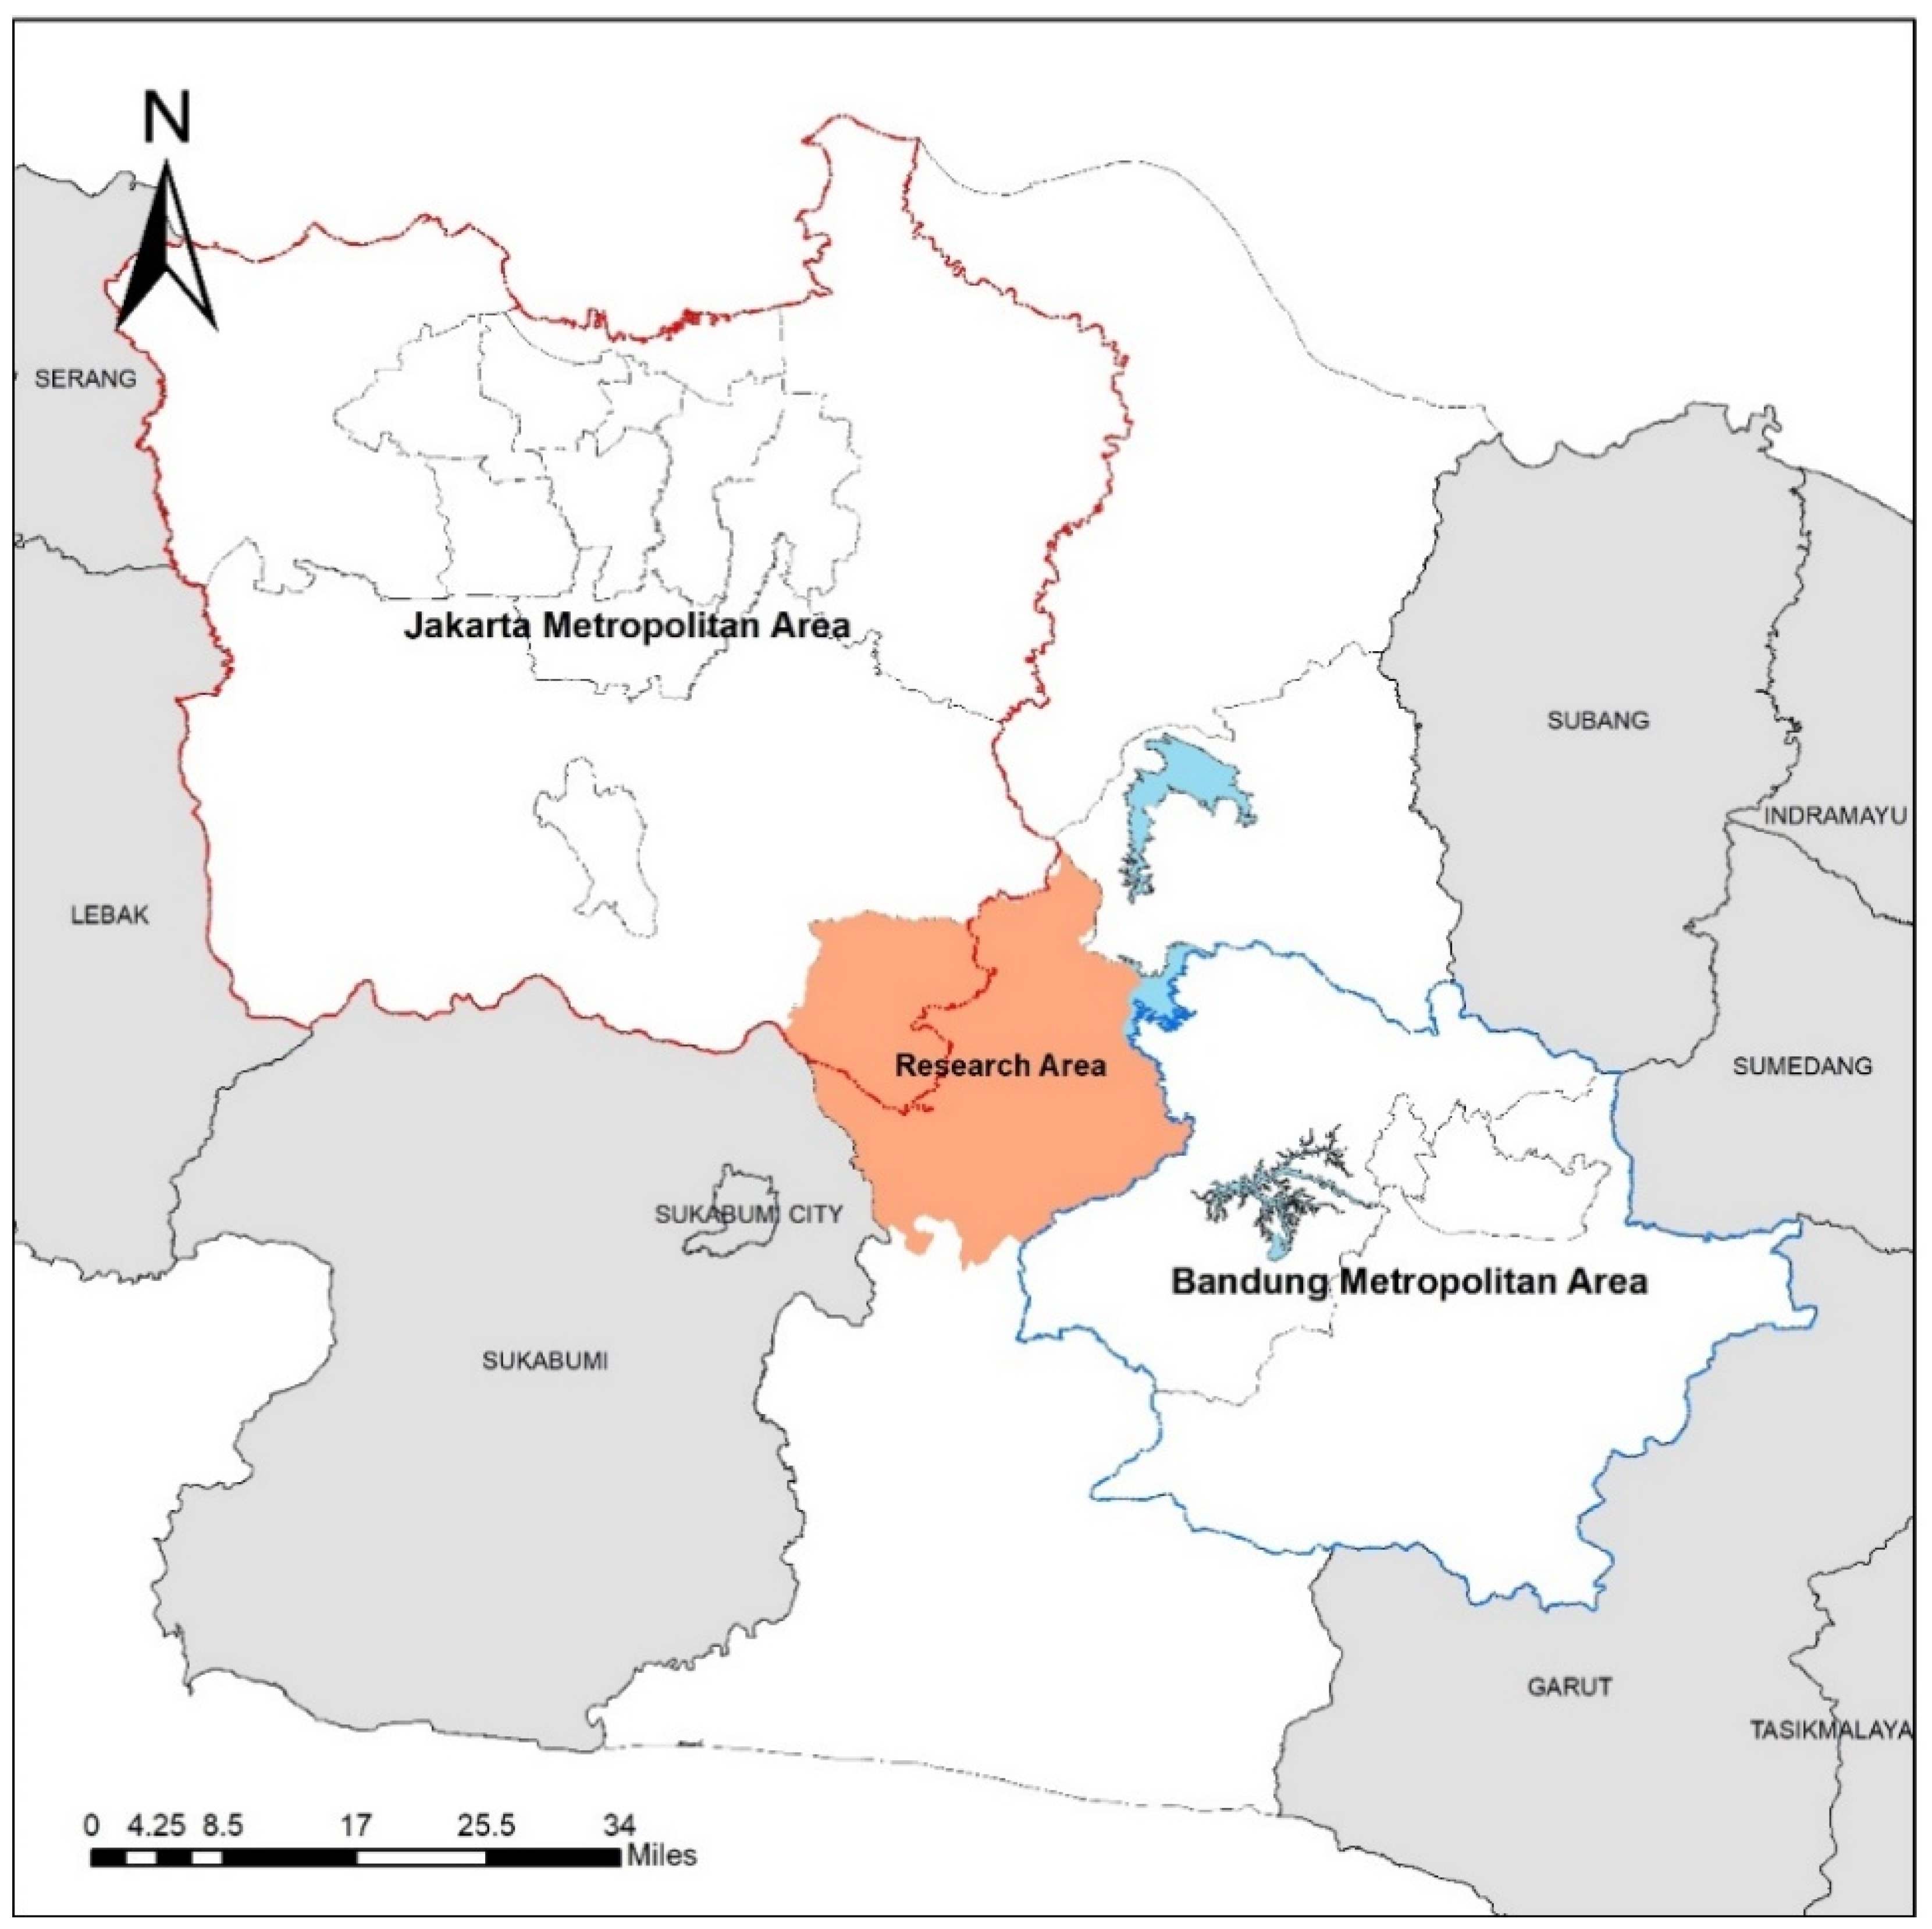
The North Cianjur Region, the study area for this research, is located between two of Indonesia’s biggest metropolitan area, Jakarta Metropolitan Area (JMA) and Bandung Metropolitan Area (BMA), which show a trend towards and are predicted to eventually merge into Jakarta–Bandung Mega-Urban Region (JBMUR) [35]. Therefore, North Cianjur serves as a hinterland or buffer area for both metropolitan areas and their environmental and agricultural functions, and as an urban corridor. Forces of urban expansion from both metropolitan areas have affected the region. Planning policies are incapable of controlling urban development, and a quick shift in spatial configuration is progressing rapidly [20]. Urban form in this mega-urban corridor often displays a mixed characteristic between urban and rural, with a high urban form dynamic often resulting in sprawl, dispersion, and a leapfrogged development pattern [36].
This paper aims to explore the urban form dynamics in the North Cianjur Region as the hinterland of the Jakarta–Bandung Mega-Urban Corridor, and to predict future urban form in this region, its trend, and several planning interventions in order to achieve more sustainable hinterland development. This paper employs quantitative methods in urban form analysis and predictions. Abrantes et al. [4] stated that there are three major perspectives when quantifying urban form:
- A classical perspective, using multivariate and bivariate analysis of statistical indicators such as population growth, commuting costs, employment shifts, and regional income; density gradient analysis is used to represent the spatial aspects of urban form.
- A remote sensing and GIS-based perspective, where remote sensing is used to map urban features and LUC and to derive statistics and socioeconomic parameters; spatial metrics are often used in this perspective, as quantitative indices can characterize the geometry of landscapes and their spatial relationships [37,38]
- A multi-dimensional perspective, linking the previous approaches in order to analyze patterns and configurations in association with classical statistical indicators.
In all the different approaches, the density dimension using population and/or LUC is a key variable. This paper will uses the third perspective, combining a multi-dimensional approach with quantitative zoning and landscape spatial pattern analysis based on quantitative and spatial indices. Using remotely-sensed data, quantitative zoning, and landscape dynamics tools, we investigated urban form dynamics and future prediction in the North Cianjur region based on time-series data from 2009–2019.
2. Materials and Methods
2.1. Study Area
North Cianjur Region (6°21′–7°01′ S, 106°42′–107°25′ E) is the northern part of Cianjur Regency, which is divided by its spatial planning policy as one of the development priorities (the other being middle and south Cianjur) functions as the urban core of the regency as well as the agricultural and tourism centre [39]. North Cianjur itself is a polycentric region with two urban cores: (1) Puncak–Cipanas urban center, and (2) Cianjur urban center, which serves as the capital of Cianjur regency. Puncak–Cipanas urban center has developed mainly due to market mechanisms, as tourism activities have increased to meet the demand of Jakarta’s inhabitants. In contrast, Cianjur urban center has been planned as a center of the settlement area and government center in Cianjur Regency. Cianjur Regency’s population numbers around 2.256 million, with over 70% of the population living in the North Cianjur area (±1.6 million) and the highest concentration of population being in its urban areas [40]. North Cianjur’s main economic activity [40] is agriculture, with a 32.2% share of total economic activities. However, the agriculture sector is decreasing (3.40% annual decrease) over time due to rapid urban expansion.
In relation with the surrounding metropolitan areas, JMA and BMA, North Cianjur is becoming the southern conurbation corridor (Figure 1), with a significant rate of industrialization and urban expansion following one of the busiest road networks, Puncak artery road, which connects the Jakarta–Bandung Mega-Urban Region [20,30]. In managing this mega-urban region, administrative boundaries are less considered, emphasizing regional dynamics, as has been shown in the case of the Jakarta–Bandung mega-urban region, albeit, to a limited degree due to the nature of Indonesia’s spatial planning framework [41,42]. In this research, we focus on observing and analyzing urban form dynamics in order to make future predictions based on several viable scenarios towards achieving more sustainable hinterland development.
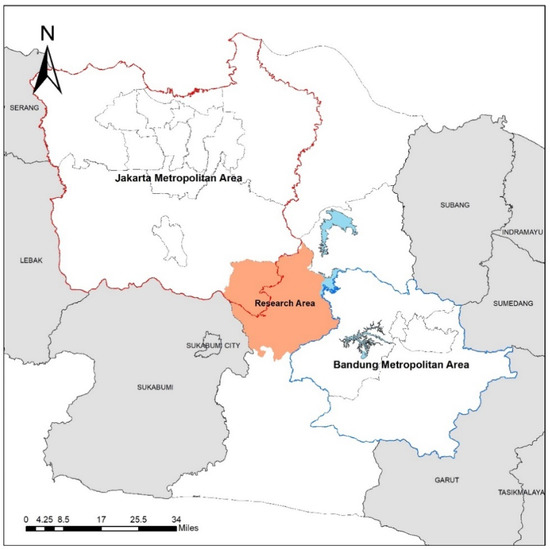
Figure 1.
North Cianjur Orientation Map.
2.2. Data
Data used in this research were remotely-sensed land-use data from LANDSAT satellite imagery, 2009–2019. The classification process in this study used supervised classification with a maximum likelihood algorithm, with training areas/training sets derived from past field observations. In this research, land uses were classified into six categories: built-up (consisting of settlement, urban facility, industrial area, or trade and services area), dry land (barren and open land), mixed garden (bushes and plantation), forest, paddy field, and water (river and lake). This classification was used in order to match the observed spatial planning data in each hierarchy (Jabodetabekpunjur Spatial Planning Policy [43], West Java Spatial Planning Policy [44], and Cianjur Spatial Planning Policy [39]) in order to best describe the built-up area pattern and to represent the urban form dynamics. Additional data used in this research were statistical data on North Cianjur socio-economic conditions, the main transportation networks in West Java Province, and spatial planning data for the Jakarta Metropolitan Area, Bandung Metropolitan Area, West Java Province, and North Cianjur.
2.3. Methods
2.3.1. Quantitative Zoning
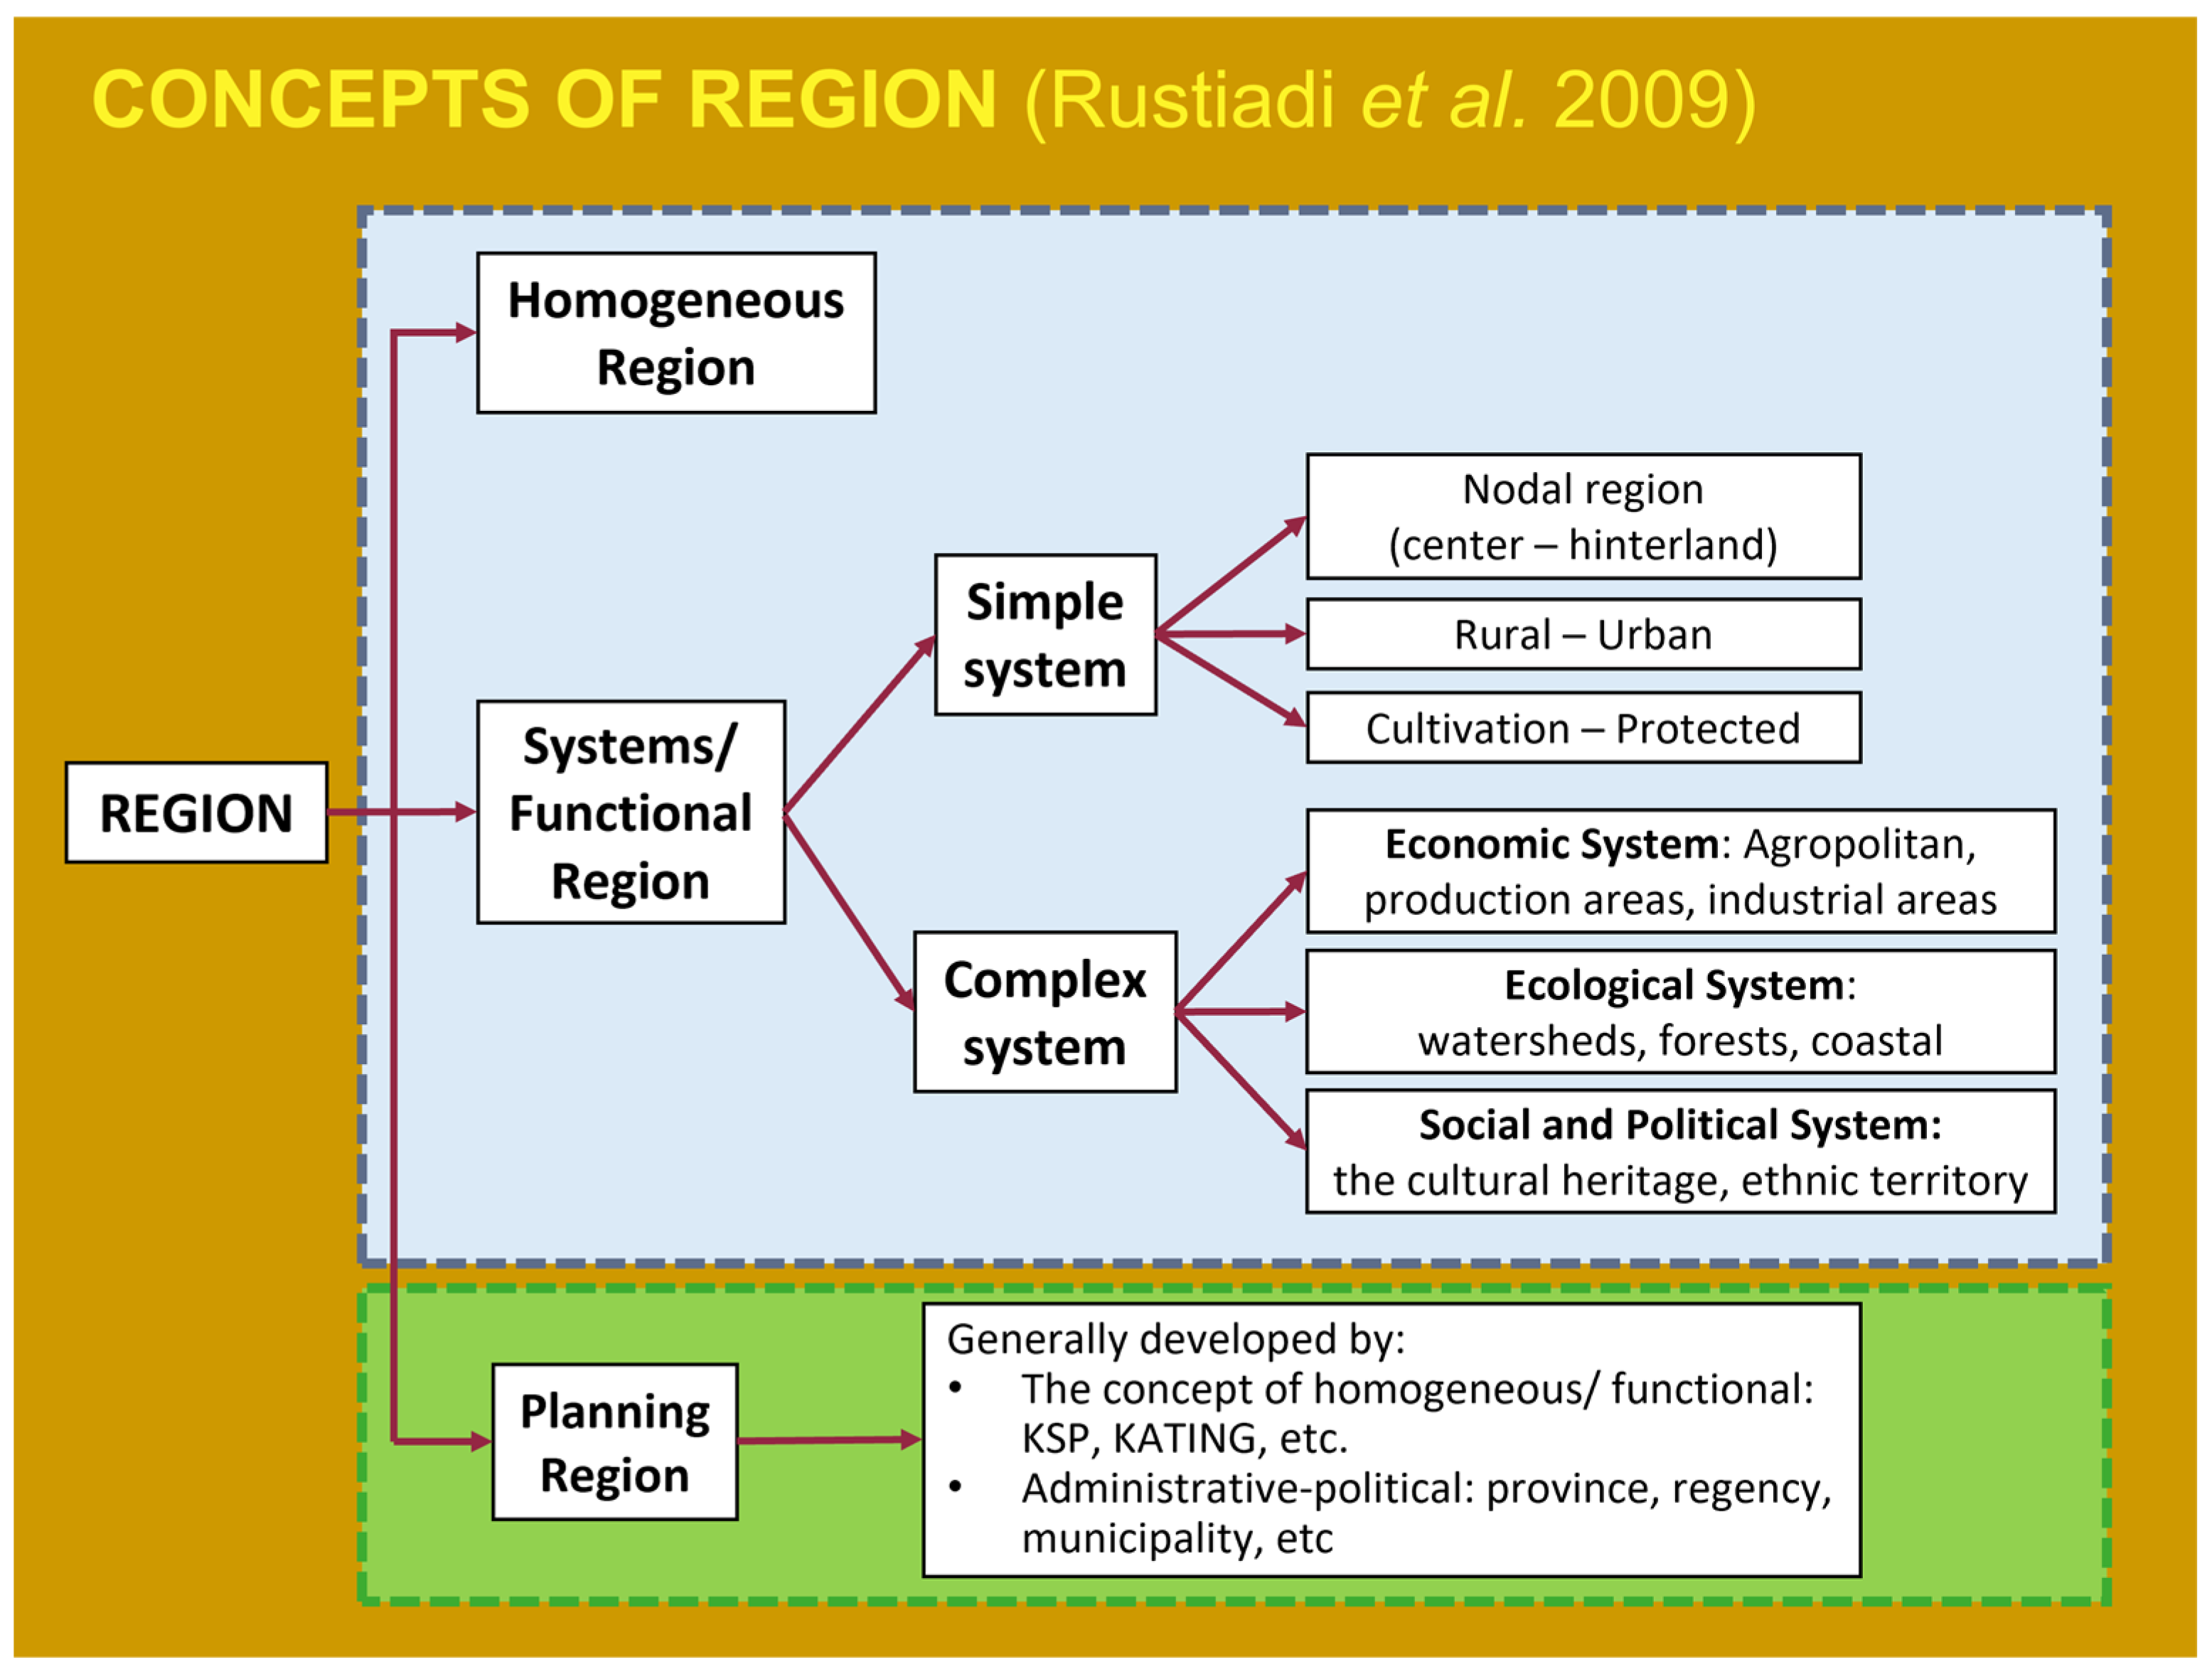
Regional planning, especially in a complex region such as a mega-urban region, often uses a typology-based zoning approach to simplify and improve the efficiency of a region and implement specific policy and development directives [45,46]. Zoning techniques have capabilities that can be used in regional development and spatial planning, one being the ability to control urban sprawl due to dynamic and complex urban expansion. The quantitative zoning method is a spatial classification approach based on a homogeneous area and a quantitative approach to the characteristics of the area using a number of variables. Rustiadi and Kobayasi [47] initiated a quantitative zoning method to classify areas based on their homogeneity characteristics known as “Rustiadi’s Quantitative Zoning Method (Spatial Clustering).” This idea originated from the development of the concept of a homogeneous area (Figure 2) where each group of regions has a specific function that is classified spatially based on the similarity of its characteristics. Spatial classification aims to identify regional typologies at the micro or local level by considering each data unit’s spatial proximity and spatial interactions, with smaller unit areas having higher spatial interdependence. In this research, quantitative zoning provides the tools to explain the way in which the North Cianjur Region should be zoned by considering its current dynamics and existing characteristics. Zoning practices in Indonesia are often qualitative–subjective, with little consideration for quantitative methods [20]. The zoning produced in this research suggests several zones: urban, peri-urban, and rural; urban zones act as the center of activities in a region, with peri-urban and rural zones forming support systems in a functional region [48].
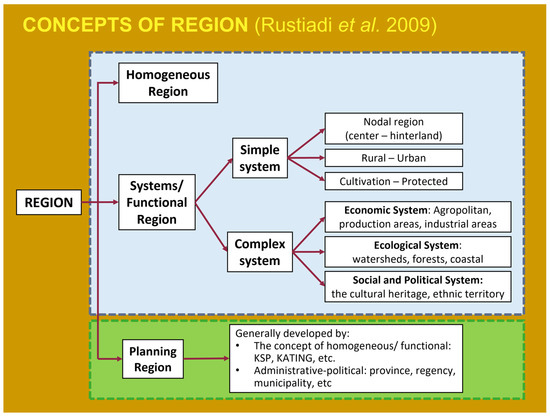
Figure 2.
Concepts of Region; derived from [48].
Rustiadi’s Quantitative zoning method has three spatial classification methods, Non-Contiguous (NC), Contiguous I (C), and Contiguous II (C”) based on two basic principles, spatial contiguity and spatial compactness. Contiguity or continuity between polygons shows areas related to one another and having similar characteristics; these are influenced by their distance from each other. Limits in the process of identifying adjacent areas use the centroid replacement value procedure. This paper uses Contiguous II (C”) methods, with the formula as follows [47]:
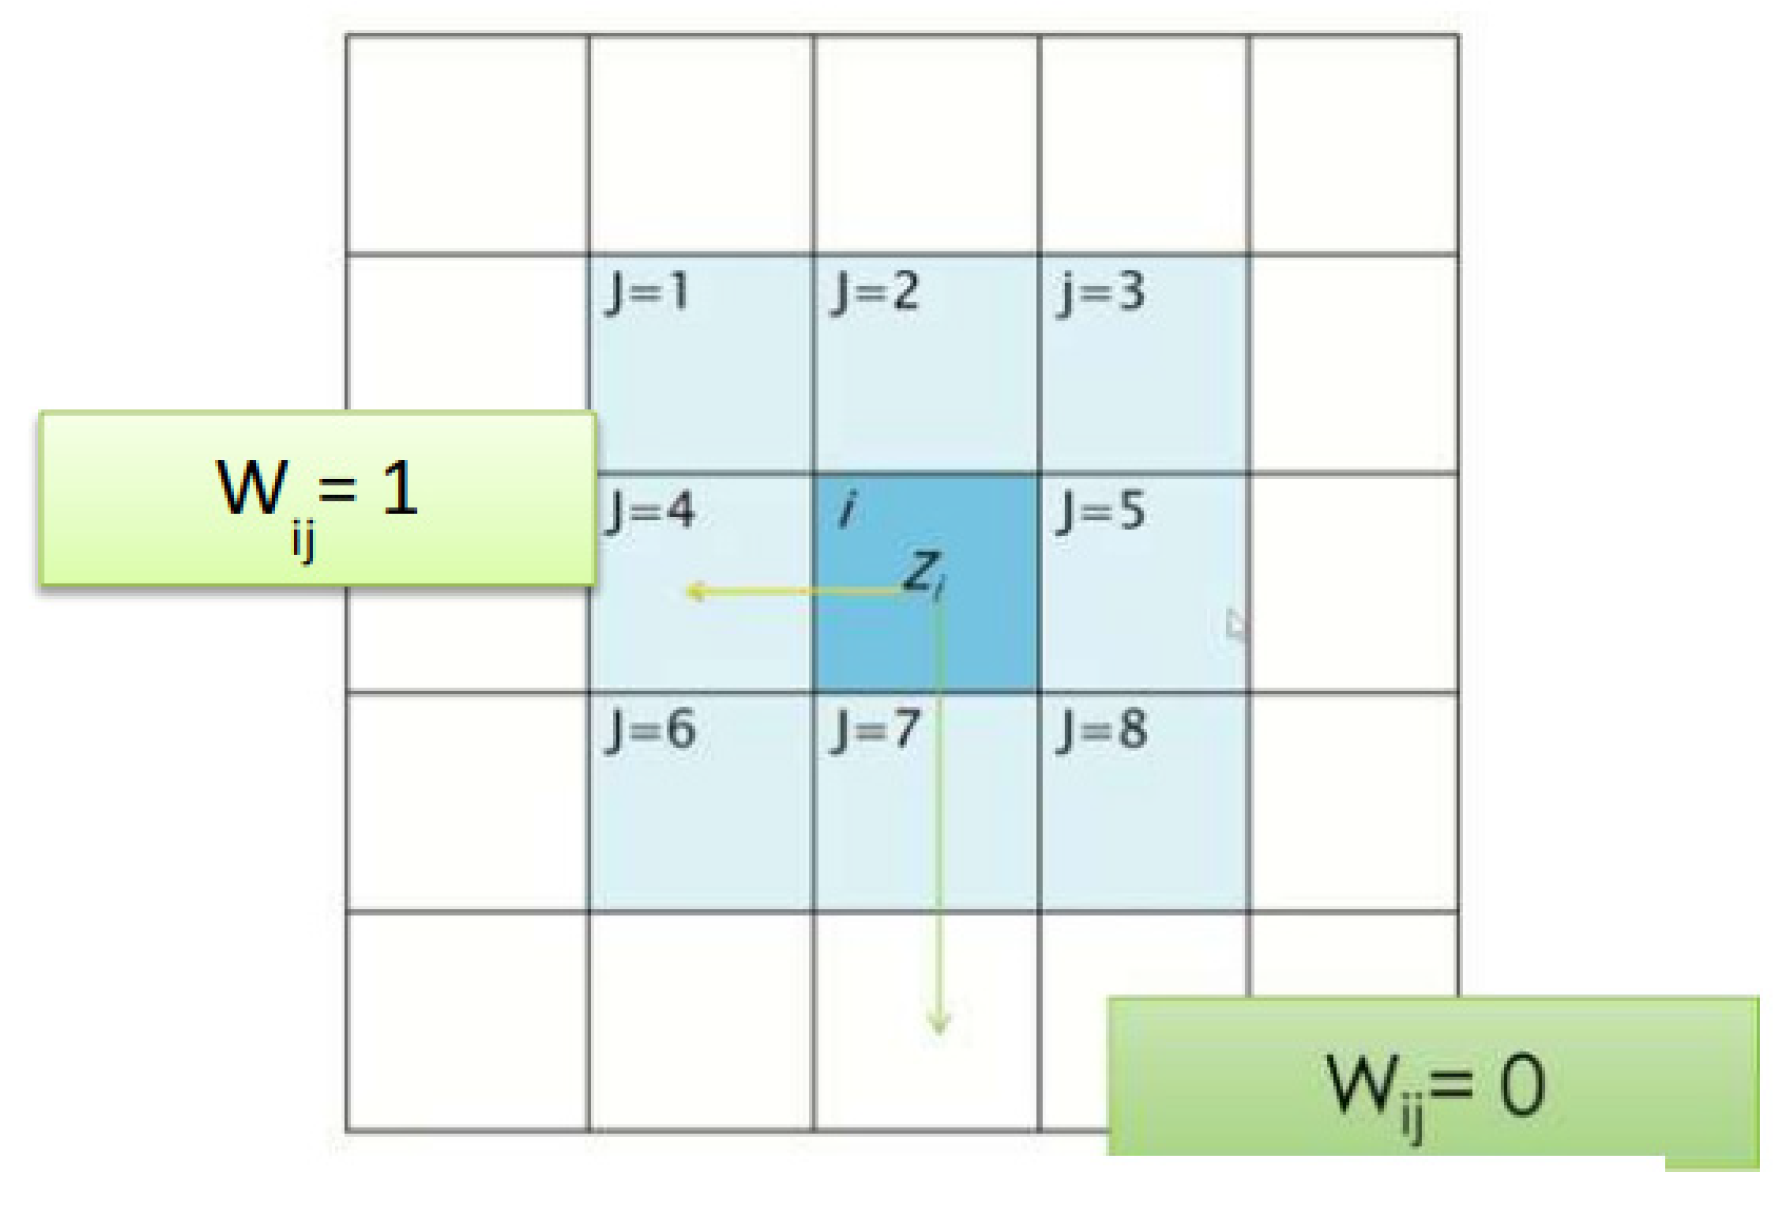
where i is the spatial unit observed, j represents the neighbors surrounding i per queen contiguity rules, z is the variable value, zi” is the manipulated variable value in i based on its neighbors (zj), is the average value of variable, Wij is the contiguity weight where Wij = 1 shows that there are spatial associations between i and j while Wij = 0 shows no spatial association between the two (Figure 3), m is the total number of neighbors surrounding i, and is the spatial aggregation between i and its surroundings.
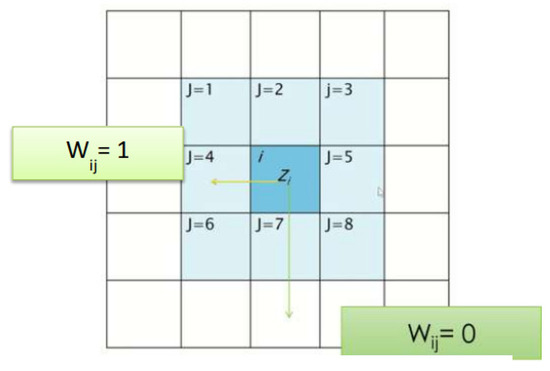
Figure 3.
Contiguity Weight in Rustiadi’s Quantitative Zoning Method.
2.3.2. Land Change Modeler (LCM)
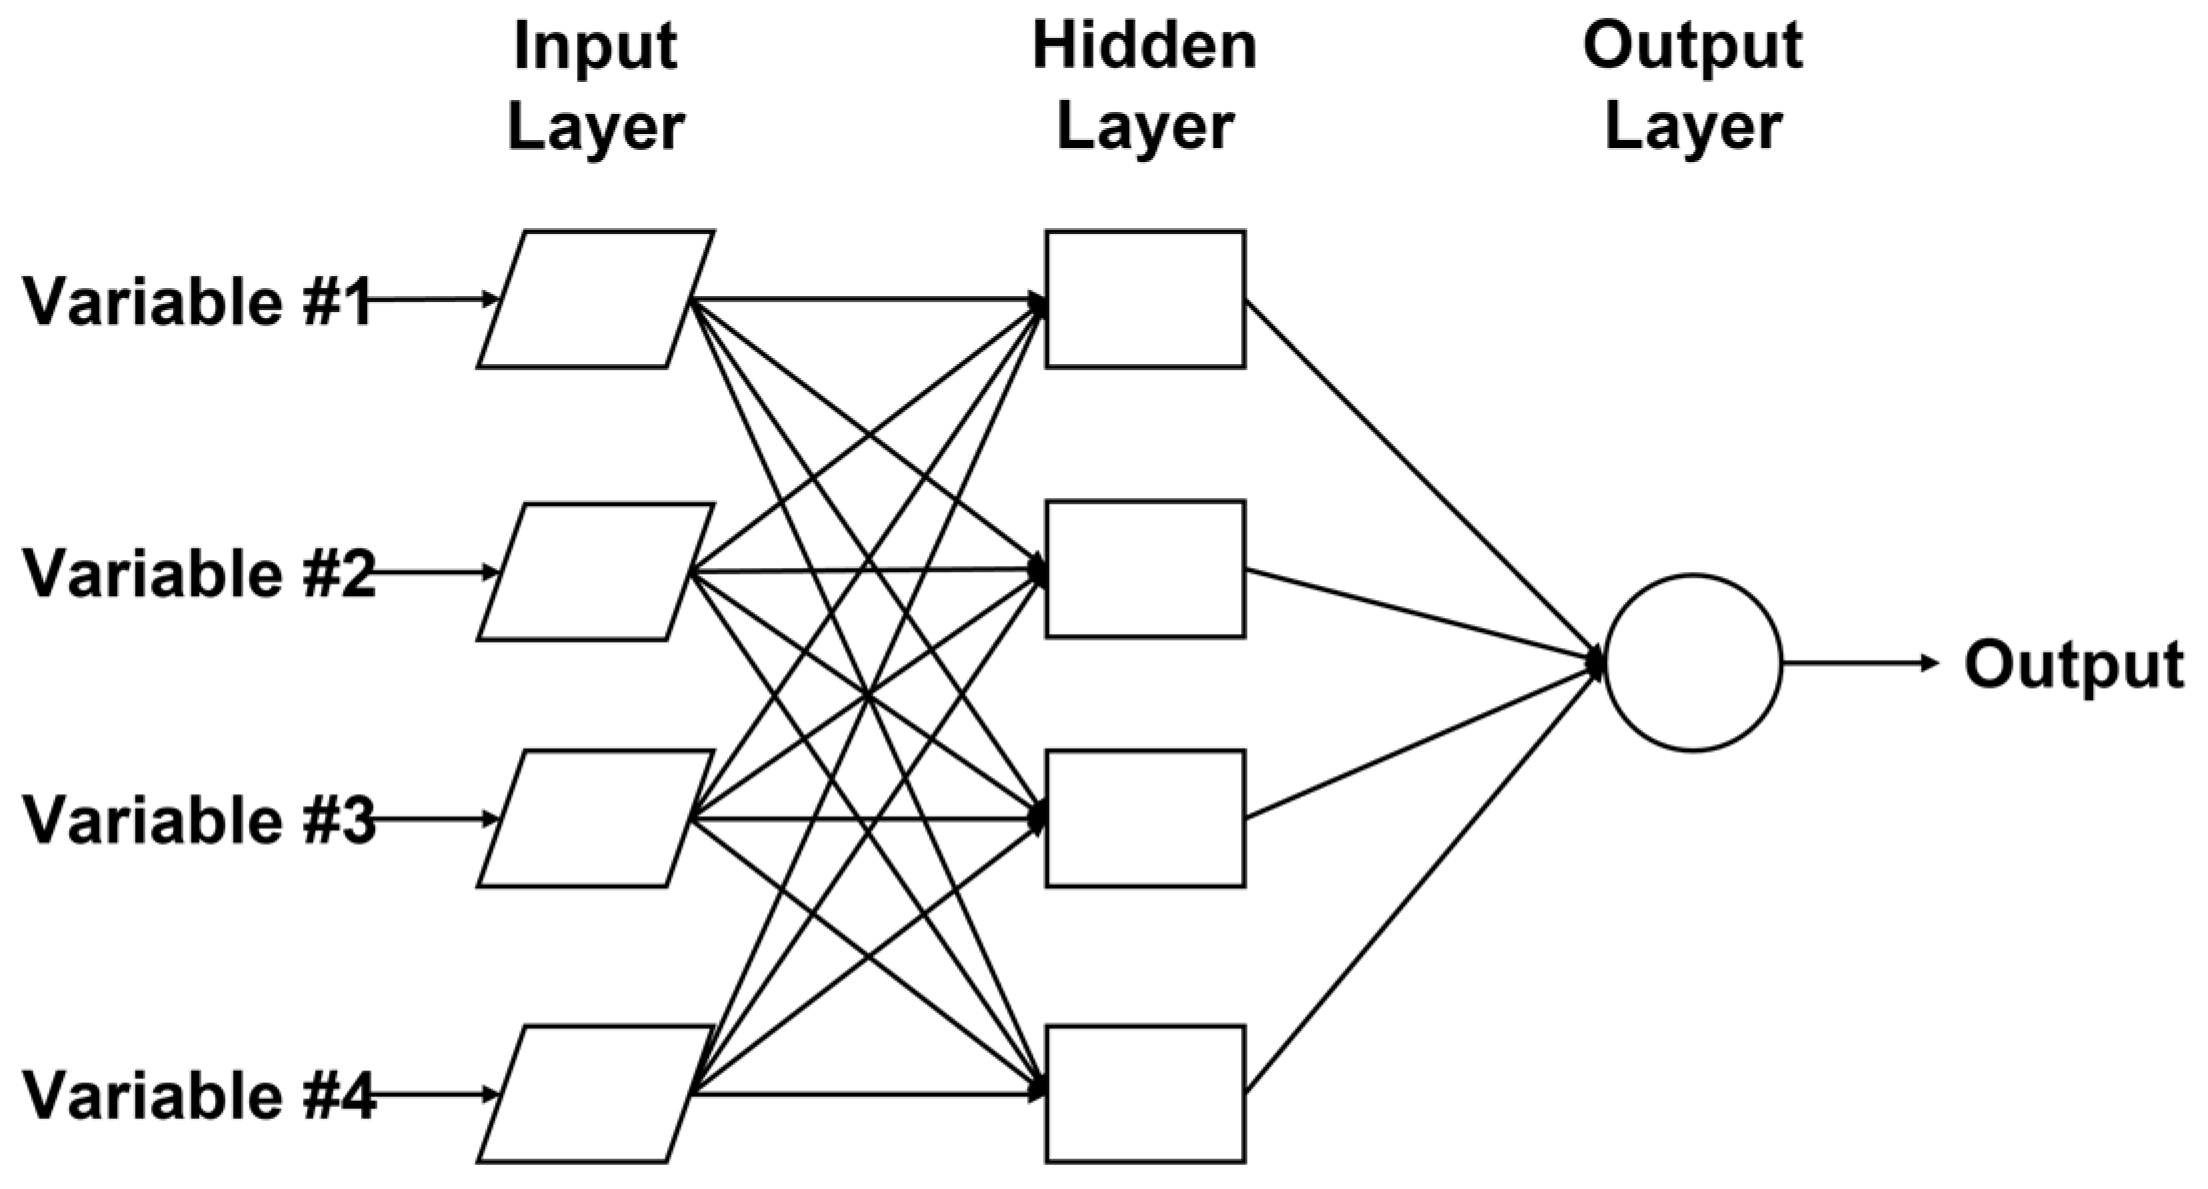
Land Change Modeler (LCM) is a land-use modeling method that combines CA–Markov and Artificial Neural Networks [49] to employ scenarios and constraint/driving factors via the interaction between inputs and hidden layers (Figure 4). LCM can provide spatio-temporal and dynamic land-use change assessments to further implement land allocation in planning and policy-making processes [50]. LCM can anticipate and predict land-use changes in various scenarios [49]. This study used the prediction year of 2031 to adjust to the final year in the spatial planning policy of the Cianjur Regency in order that the comparison between scenarios would have better correlation with ongoing planning policies. The stages of the LCM prediction process were as follows [51]:
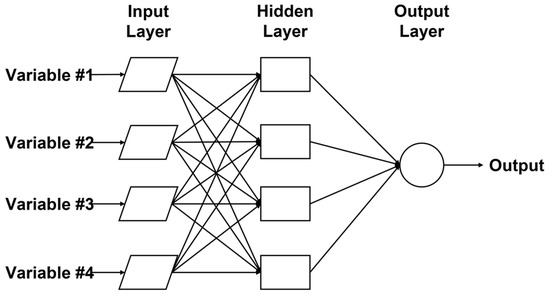
Figure 4.
LCM Analytical Framework.
- Transition Sub-Models and Probabilities
The potential change for each land-use class was based on the MLP neural network approach, logistic regression, and simweight. At this stage, the land-use transition was broken down into various sub-models. An accuracy assessment was carried out for each transition category in order to obtain the driving factors and potential changes in land use [49,50]. Transition potential was represented as a continuous value on a scale of 0–1, indicating the probability of a land-use pixel transforming into another class.
The quantity of land-use transitions was obtained from the value of the transition potential combined with the transition probability matrix from the Markov Chain. The calculation process [50] was carried out by calculating the total change from the two years of observation using the cross-tabulation method. At this stage, information on land-use changes of (X) class was obtained in the form of a transition matrix. Then, to project the future, multiplication was carried out based on the differences between the observations and the destination year.
- Scenario Preparation
This paper employs three scenarios, (i) business as usual (BAU); (ii) spatial planning policy (SPP); and (iii) urban containment (UCT). The BAU and SPP scenarios were intended to monitor and predict change based on trends and to determine the manner in which spatial planning policy affects urban form dynamics. The trend itself is an essential aspect of this research, because the nature of Indonesia’s urbanization is mainly driven by the private and real estate sectors [41,52,53]. A comprehensive spatial planning policy was constructed by considering socio-economic characteristics, developments and trends to make an instrument that equally contributes to every aspect of the region, including its flaws. In contrast, UCT scenarios were developed as policy interventions to limit or direct urban growth into a designated zone for better control and management. Urban containment has been hypothesized to help create a more compact region [54,55]. As North Cianjur is a poly-centric region, the force of growth and expansion is contained in both urban zones. Translating these scenarios requires several constraint variables, which in this paper were (i) distance from urban center; (ii) distance from main road network; (iii) slope; and (iv) topography. The three scenarios represented basic hypotheses for predicting growth in the North Cianjur as the JBMUR conurbation corridor. In the first scenario, no planning interventions were made in the study area. In the second scenario, the spatial planning and zoning policy was implemented. In the third scenario, planning and zoning interventions based on the results of the quantitative zoning were implemented. The rules for the three scenarios are described in Table 1.

Table 1.
Detailed Explanation of Model Scenarios.
- Spatial Allocation and Land Use Prediction
From a series of sub-model maps of potential transitions and transition magnitudes for each land-use class, spatial allocation was determined based on the area/coordinate with the greatest potential transition value for a particular class (the highest potential value in class i means that the area/coordinate is predicted to be class i, etc. [50]) If two or more classes had the same potential transition value, then the area/coordinate was occupied by the class with the highest marginal transition potential value.
For the simulated scenarios, the allocation process was determined based on the interaction between the opposite land use classes and the proximity/minimum distance of the two types of use was determined. For example, in a scenario prioritizing the protection of forest land, with the conversion class being settlement and agriculture, the minimum proximity of the forest class to settlements and settlements is determined such that if the growth of the two conversion classes reaches or exceeds the specified minimum distance, the growth is stopped.
In the final stage of land change modeling, LCM can project land use in a predetermined year through trends and potential land-use changes, potential transitions, and scenarios [50].
2.3.3. Landscape Dynamic Typology (LDT) Tools
Many quantitative and indices-based methods have been developed to assess the spatial configuration of habitat patches, classes of patches, and landscape characteristics that can be analyzed on various scales [56,57]. Landscapes in this context may vary in scale, and can be on the regional, city, district, or neighborhood scale, similar to urban form [1,8]. The best landscape characteristics to describe urban form dynamics and quantifications often involve characteristics such as dominance, contiguity, contagion, fragmentation, and diversity [20,58]. Landscape metrics is one of the most prominent methods in landscape quantification, and has become the baseline for the development of other methods [59]. Landscape metrics measure and describe in various ways the spatial structure of patches, patch classes, or landscapes [60].
Landscape Dynamic Typology (LDT) is a method based on landscape metrics developed by focusing on the fragmentation and aggregation of the landscape and providing a visual interpretation to describe its configuration [59,60]. LDT is a classification system in which landscape changes are aggregated according to the processes that give rise to the changes. The different dynamics are defined for a binary landscape with two classes only, the land cover under study and other class that encompass any different land covers, obtained by considering how eventual composition and configuration changes are reflected by the two selected metrics, namely, area and number of patch (NP). There are three main interpretations in LDT:
- In a case where there are no changes in area and NP between two periods, the landscape did not experience any dynamics.
- In a case where the area remains the same between two periods while NP changes, the landscape faces a fragmentation or aggregation event (i.e., pure geometric variation).
- In a case where both the area and NP change between two periods, the landscape is experiencing fragmentation or aggregation due to gain or loss in the specified class (i.e., geometric variation caused by area variation).
However, other patterns can reflect different metric combinations in dichotomous tree keys to assist with further classification of landscape dynamics (Figure 5). This research mainly explored the dynamics of built-up land-use classes (LU understudy), with all other classes grouped into the other part of the binary. The dynamics were explored over the trends and prediction scenarios in order to determine which dynamics are more sustainable and how the different planning policies respond accordingly.
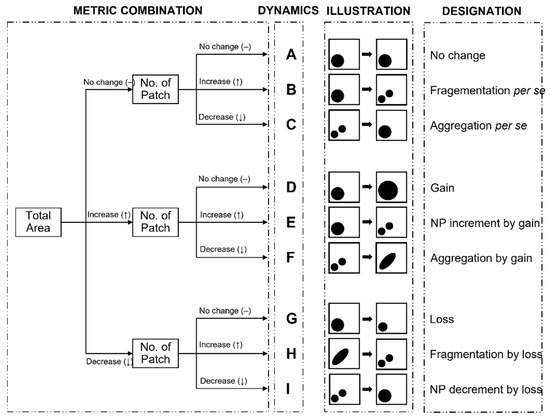
Figure 5.
LDT Auxiliary Diagnostic Tree.
3. Results and Discussion
3.1. North Cianjur Zoning Area
A quantitative zoning approach based on physical and socio-economic characteristics resulted in several zone classifications, each with defining characteristics (Table 2): two urban zones with urban features indicated by high population density, facility/infrastructure availability, high built-up area, and diverse household occupancy, etc.; a peri-urban zone impacted by urban expansion from surrounding metropolitan areas; and rural zones with defining rural characteristics of high agricultural areas, farming households, longer distances to major infrastructure, etc. This quantitative zoning was formed from clusters with similar characteristics, close proximity, and high spatial association measured at the village–administrative level. This type of zoning, contrary to the usual qualitative–subjective one, is able to simplify and improve the efficiency of managing a region and of implementing specific policy and development directives [20,45,46].
Table 2.
Zoning Typology Characteristics.
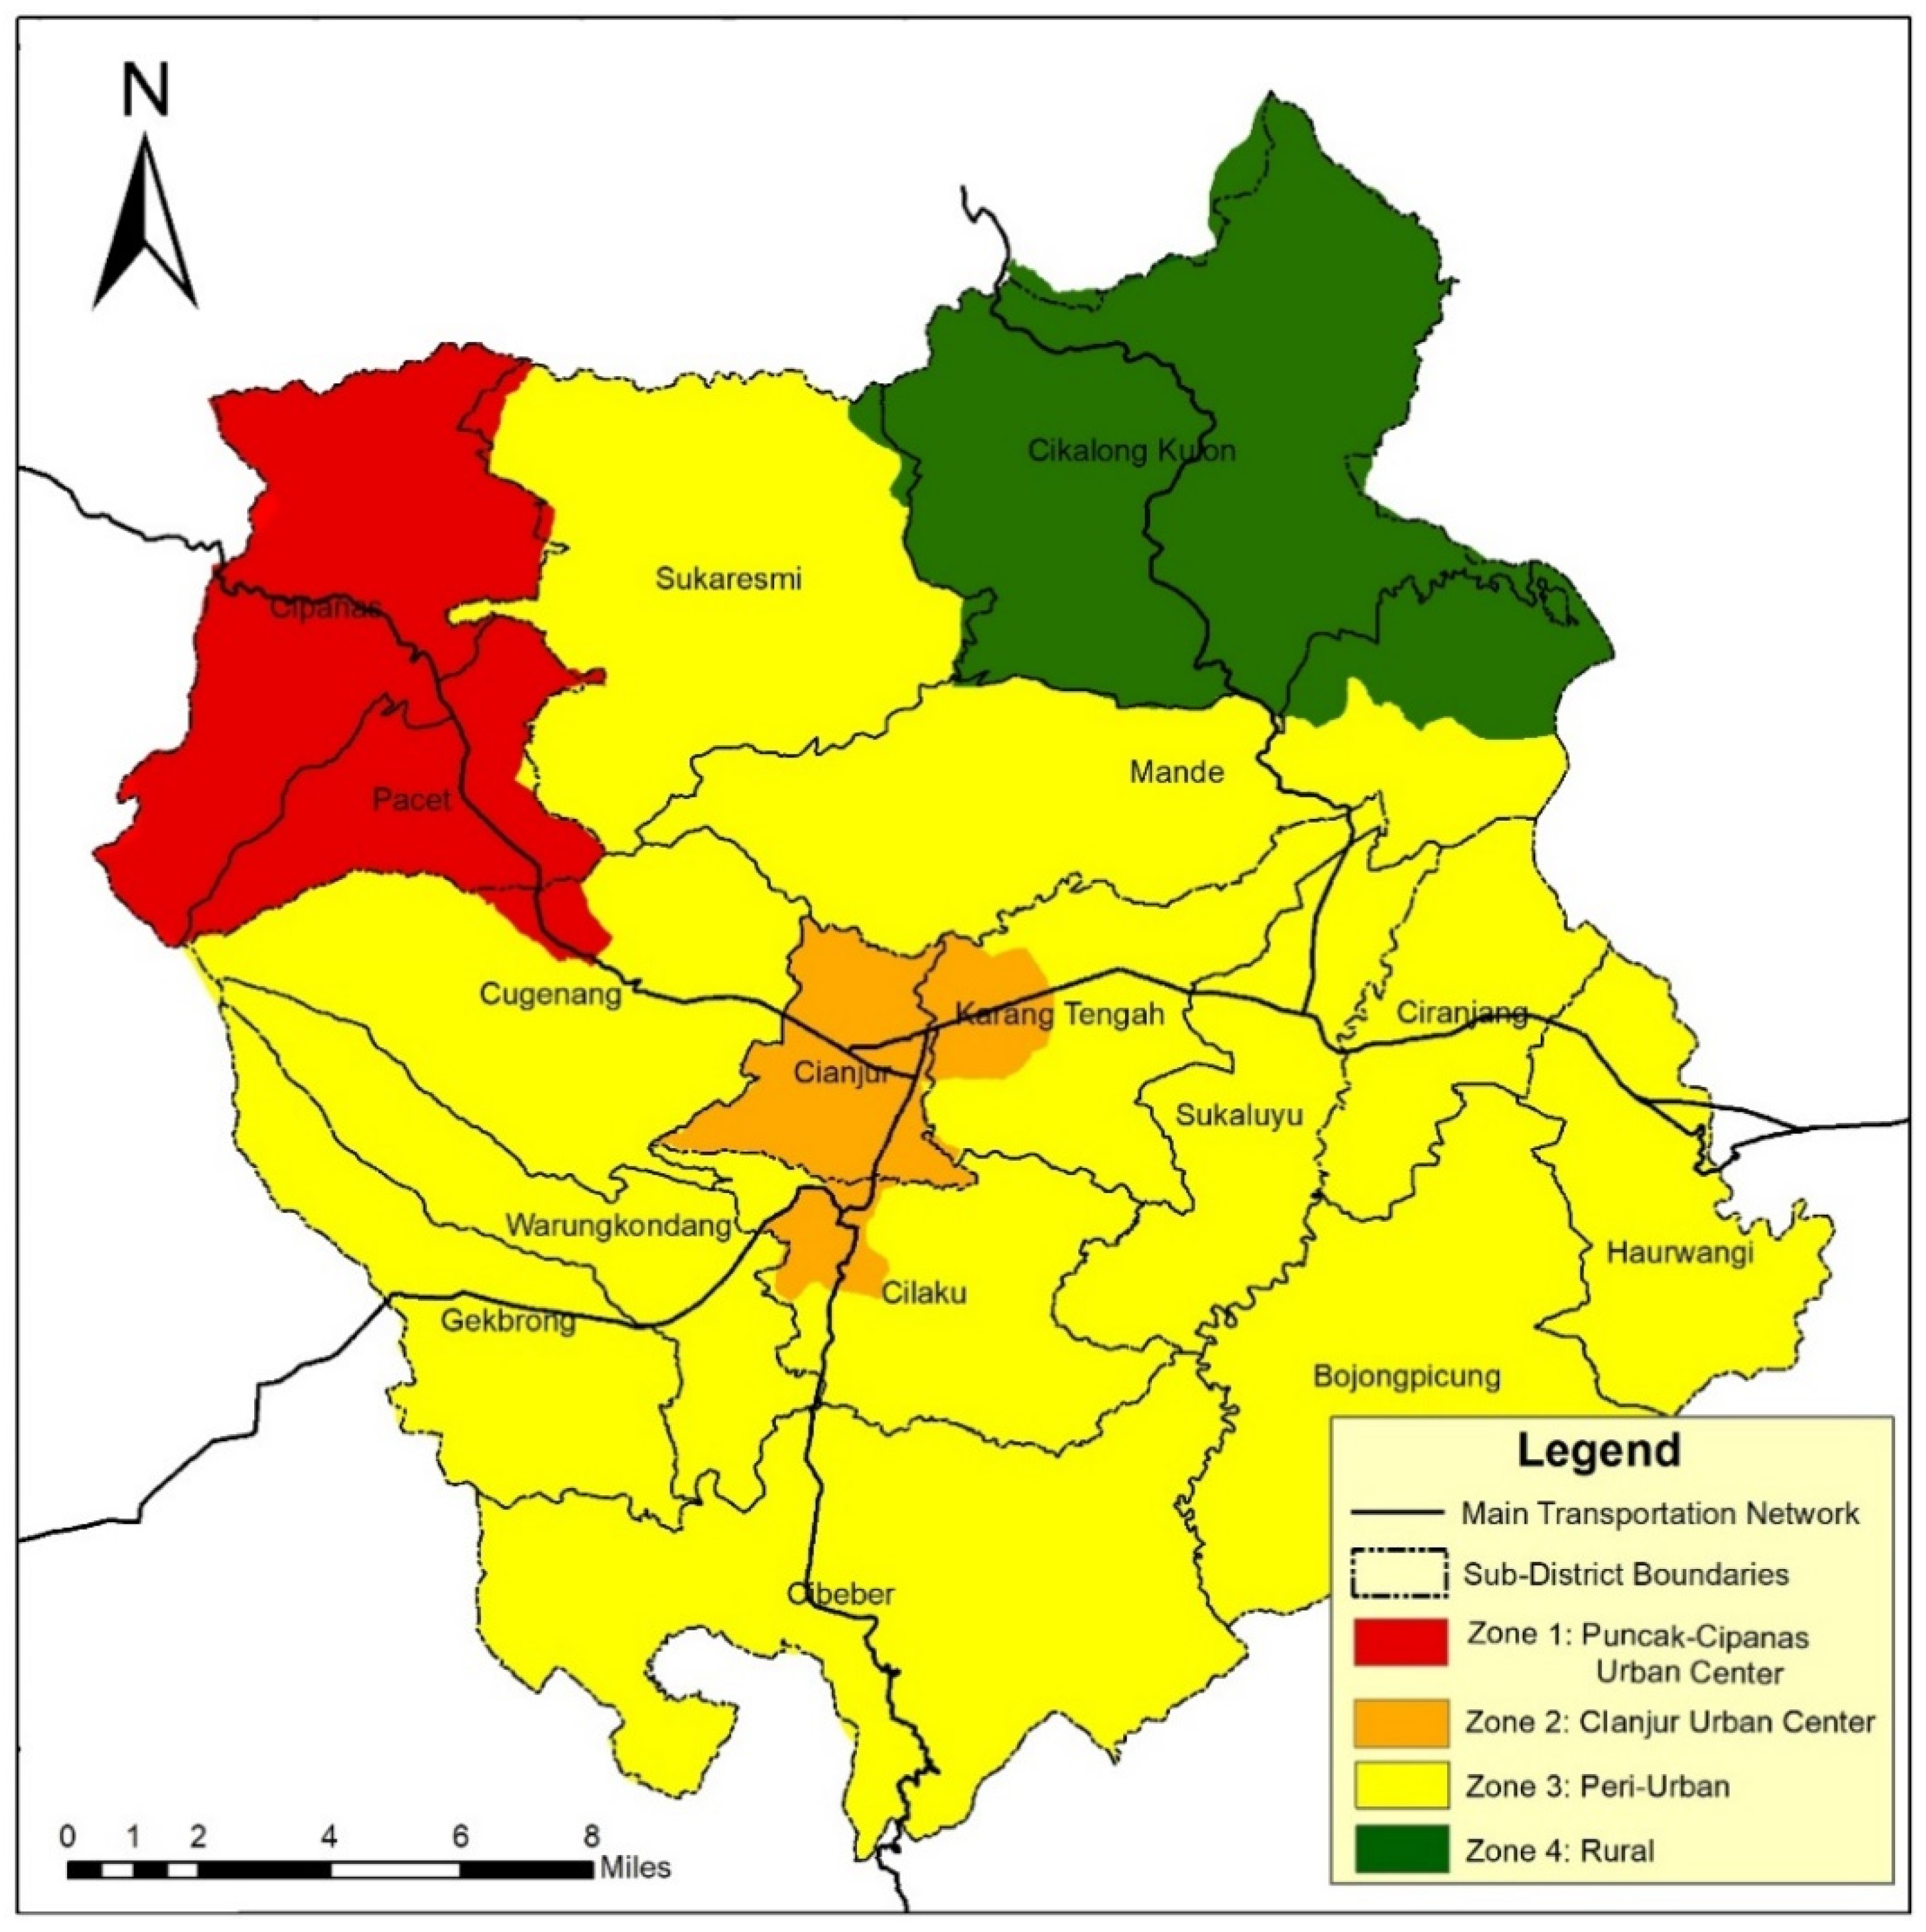
Spatial distribution of typology-based zoning in the North Cianjur is dominated by the peri-urban classification, spanning both the northern and the southern part of North Cianjur, while the rural classification is present only in the north-eastern part of North Cianjur and the two urban areas are matched by the spatial planning policy (Puncak–Cipanas urban center and Cianjur urban center) (Figure 6). As mentioned in the description of the spatial planning policy, the two urban cores hold different importance and function to the overall region, with Puncak–Cipanas being the center of trade, tourism, and agriculture, and the Cianjur urban area being the center of governance and education [39].

Figure 6.
North Cianjur Zoning Maps.
A similar method was employed in previous research [20] using the Contiguous I (C) method, with the results showing a difference in peri-urban classification; in this paper, the peri-urban classification is more extensive. In previous research, Puncak–Cipanas urban center was directly adjacent to rural areas. In this paper, the urban and rural classifications are separated by the peri-urban forming a fringe structure, as suggested in several other regional studies [61,62]. This difference is partially due to the nature of the formula used by the different methods; the Contiguous I method focuses only on proximity and variable values, while the Contiguous II method considers spatial association and the influence of neighbor’s variables.
3.2. North Cianjur Land-Use Model and Prediction
3.2.1. Model Description
Area Changes and Transition Potential
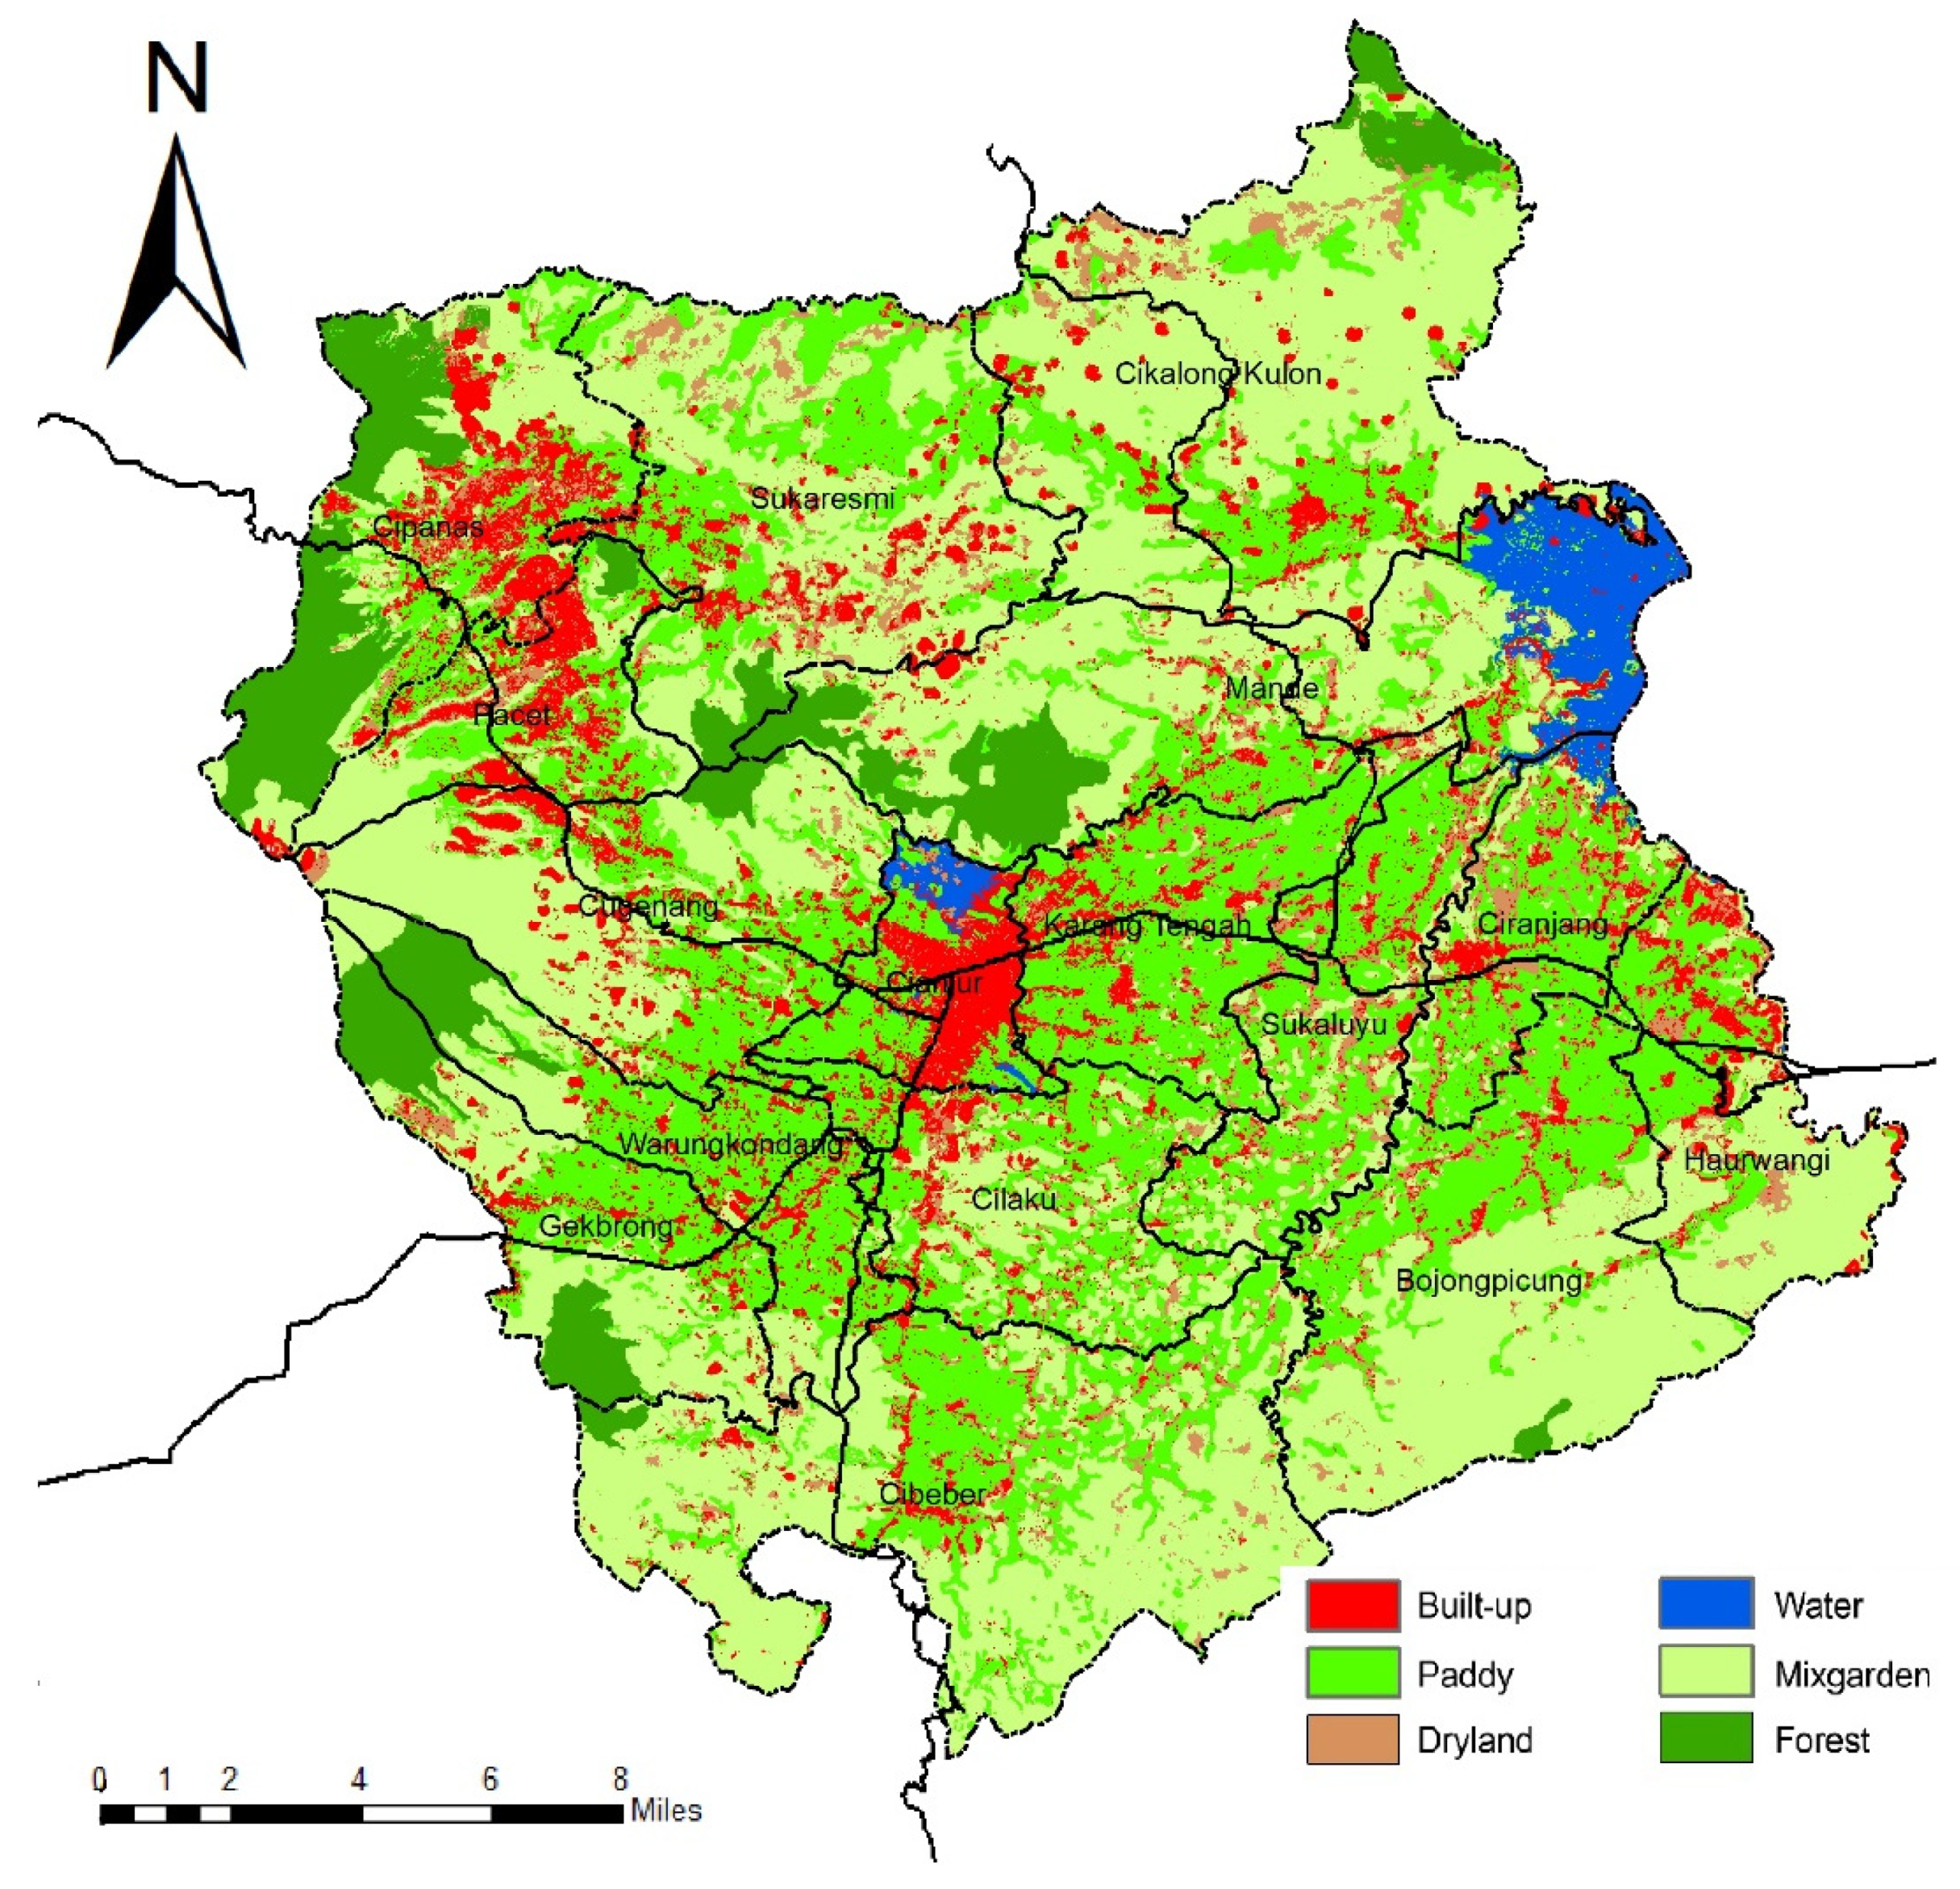
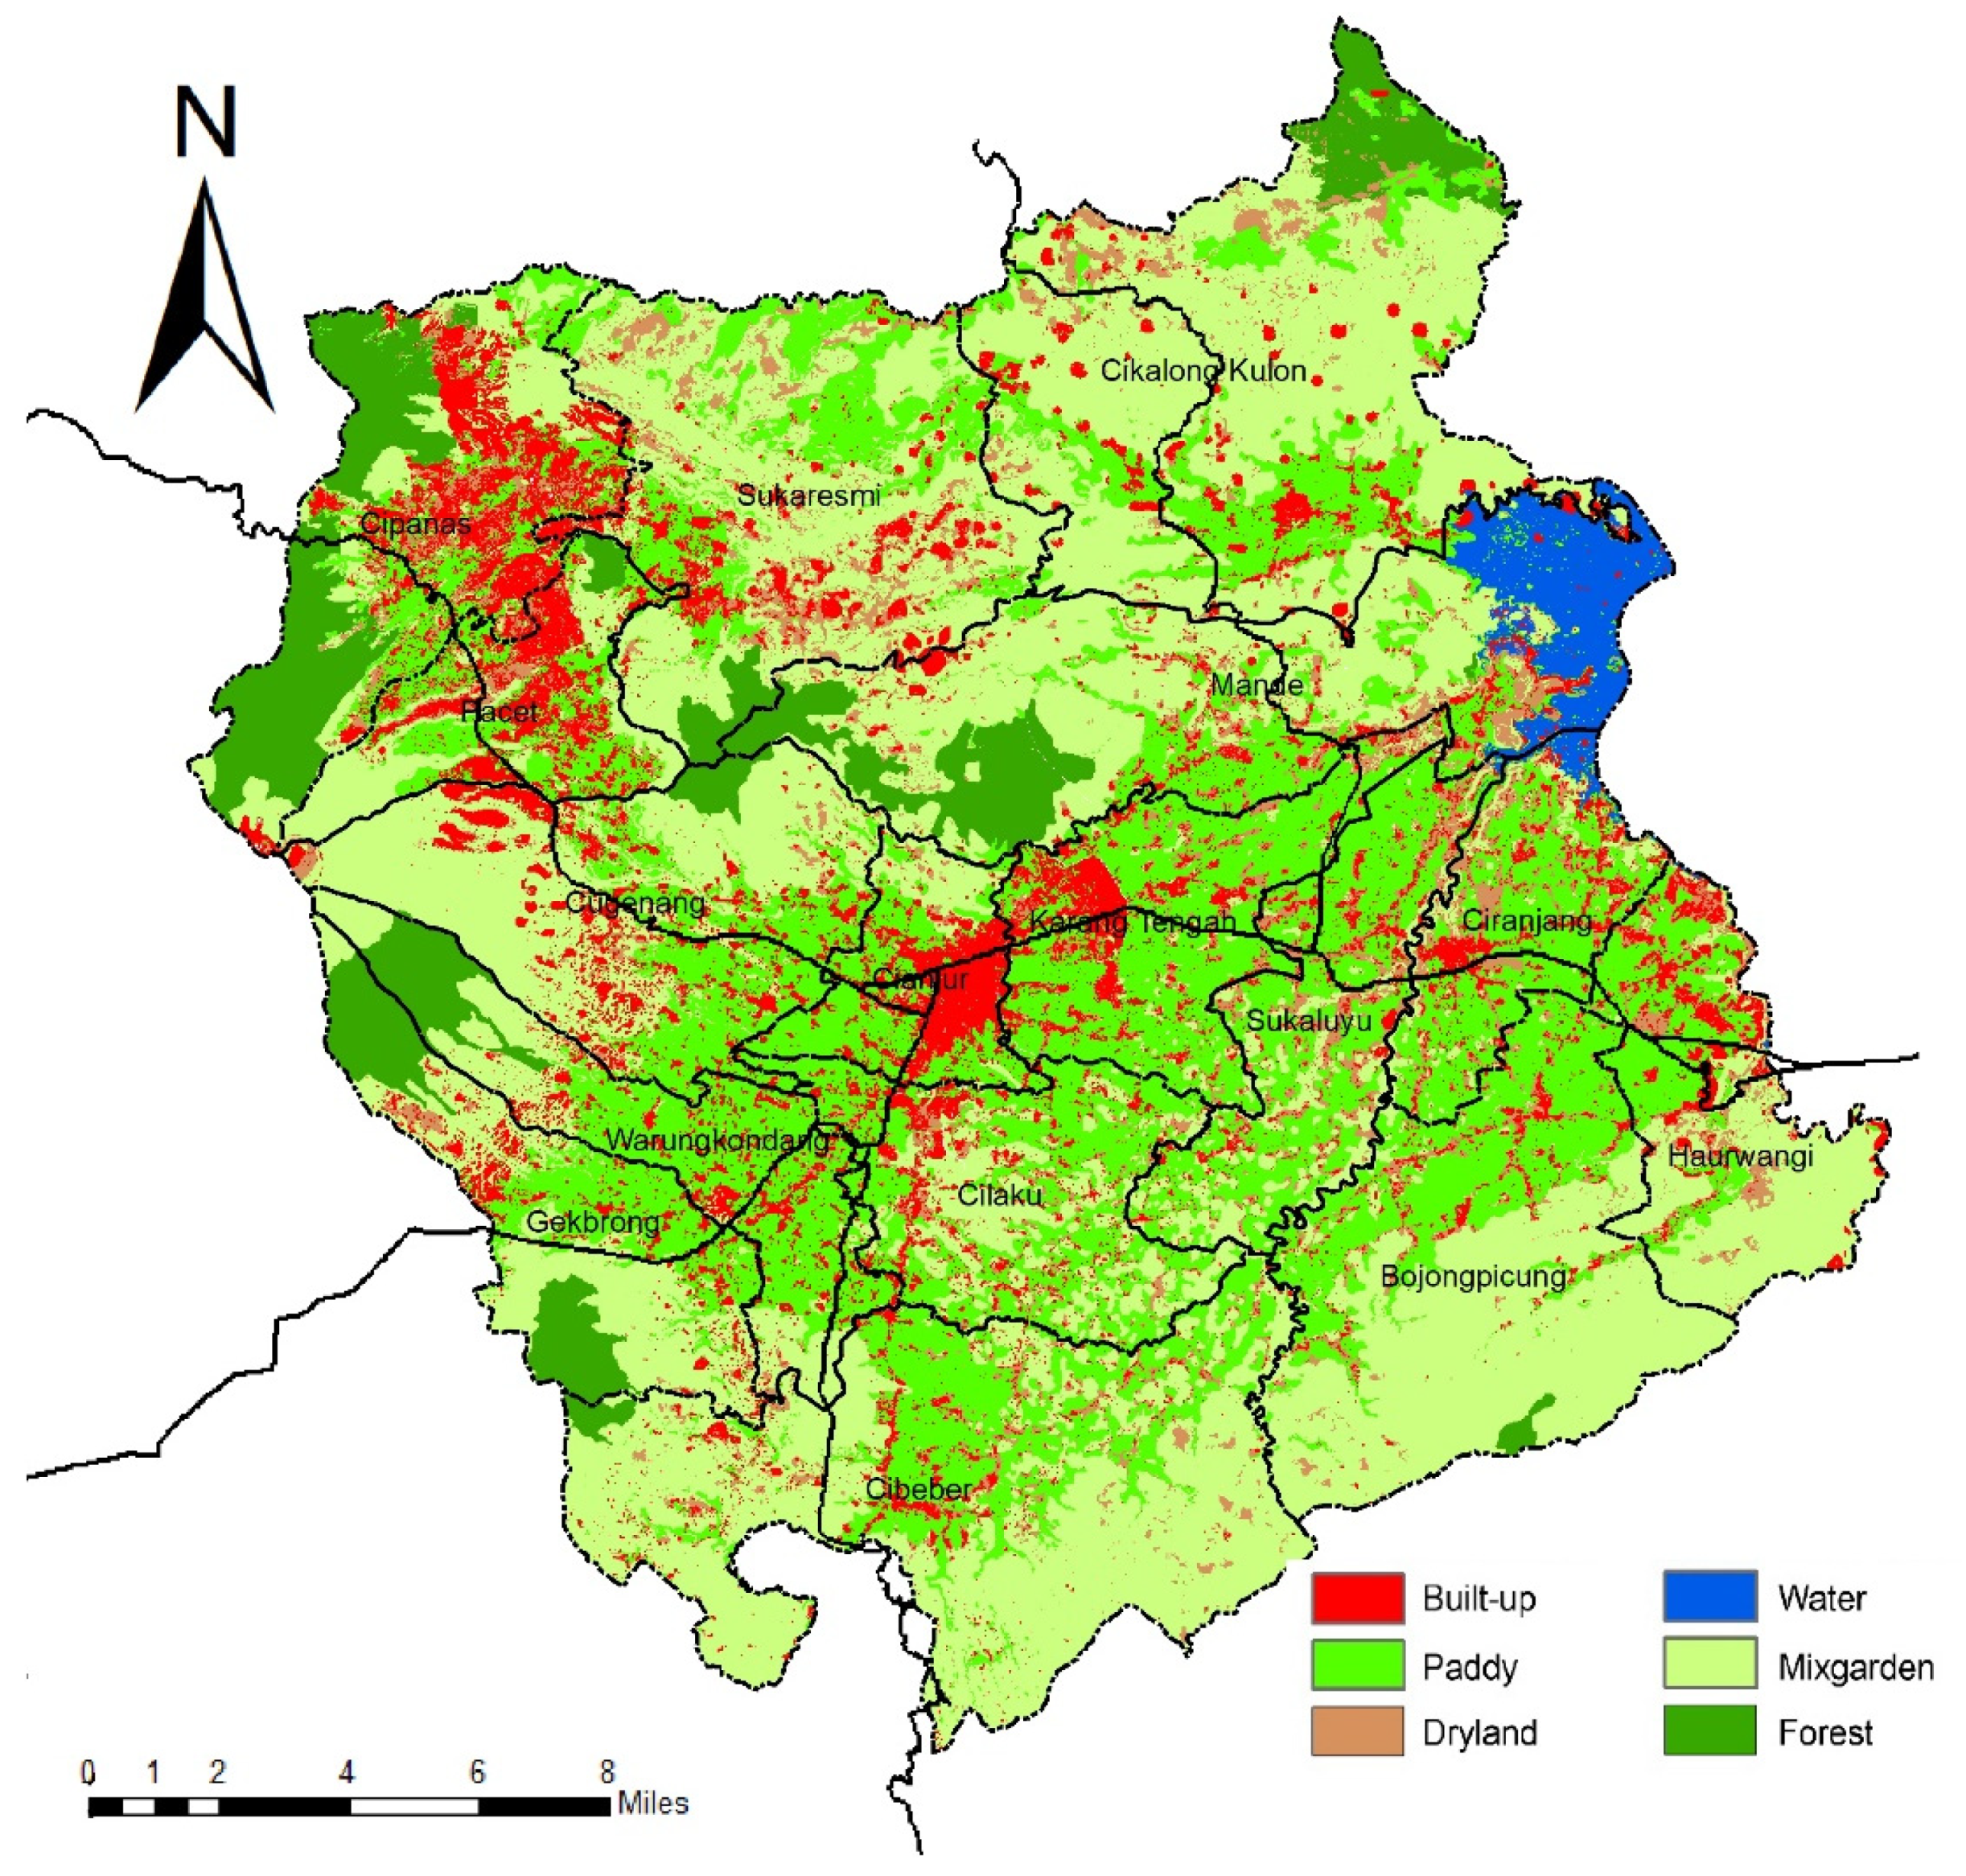
Land-use classification in 2009, 2014, and 2019 resulted in an average of 84.33% overall classification accuracy (Table 3). After an initial assessment of the area covered by different LULC classes in 2009, 2014, and 2019 (Figure 7), a change analysis was performed for the periods 2009–2014 and 2014–2019 (Table 4). During the periods 2009–2014 and 2014–2019, the most significant changes happened in built-up, paddy, mixed garden, and dryland uses, all with positive net change except for paddy, which had a −40,722 ha (−37.63%) net change in 2009–2014 and −26,387 (−24.38%) net change in 2014–2019.
Table 3.
Accuracy Matrix of LULC Classification.
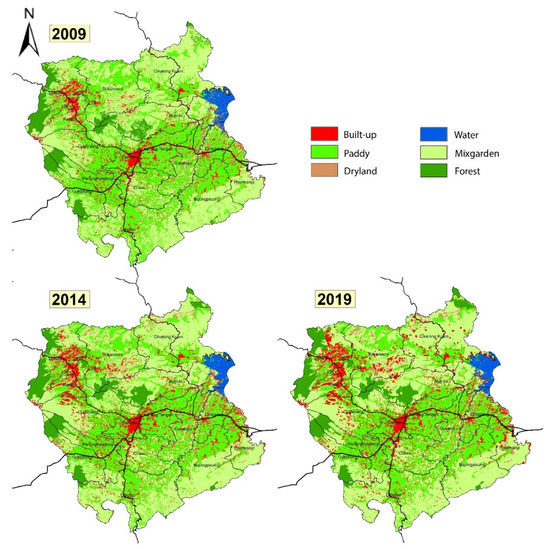
Figure 7.
Land-Use Classification (2009, 2014, 2019).
Table 4.
Gains, Losses, and Net Change in LULC Classes.
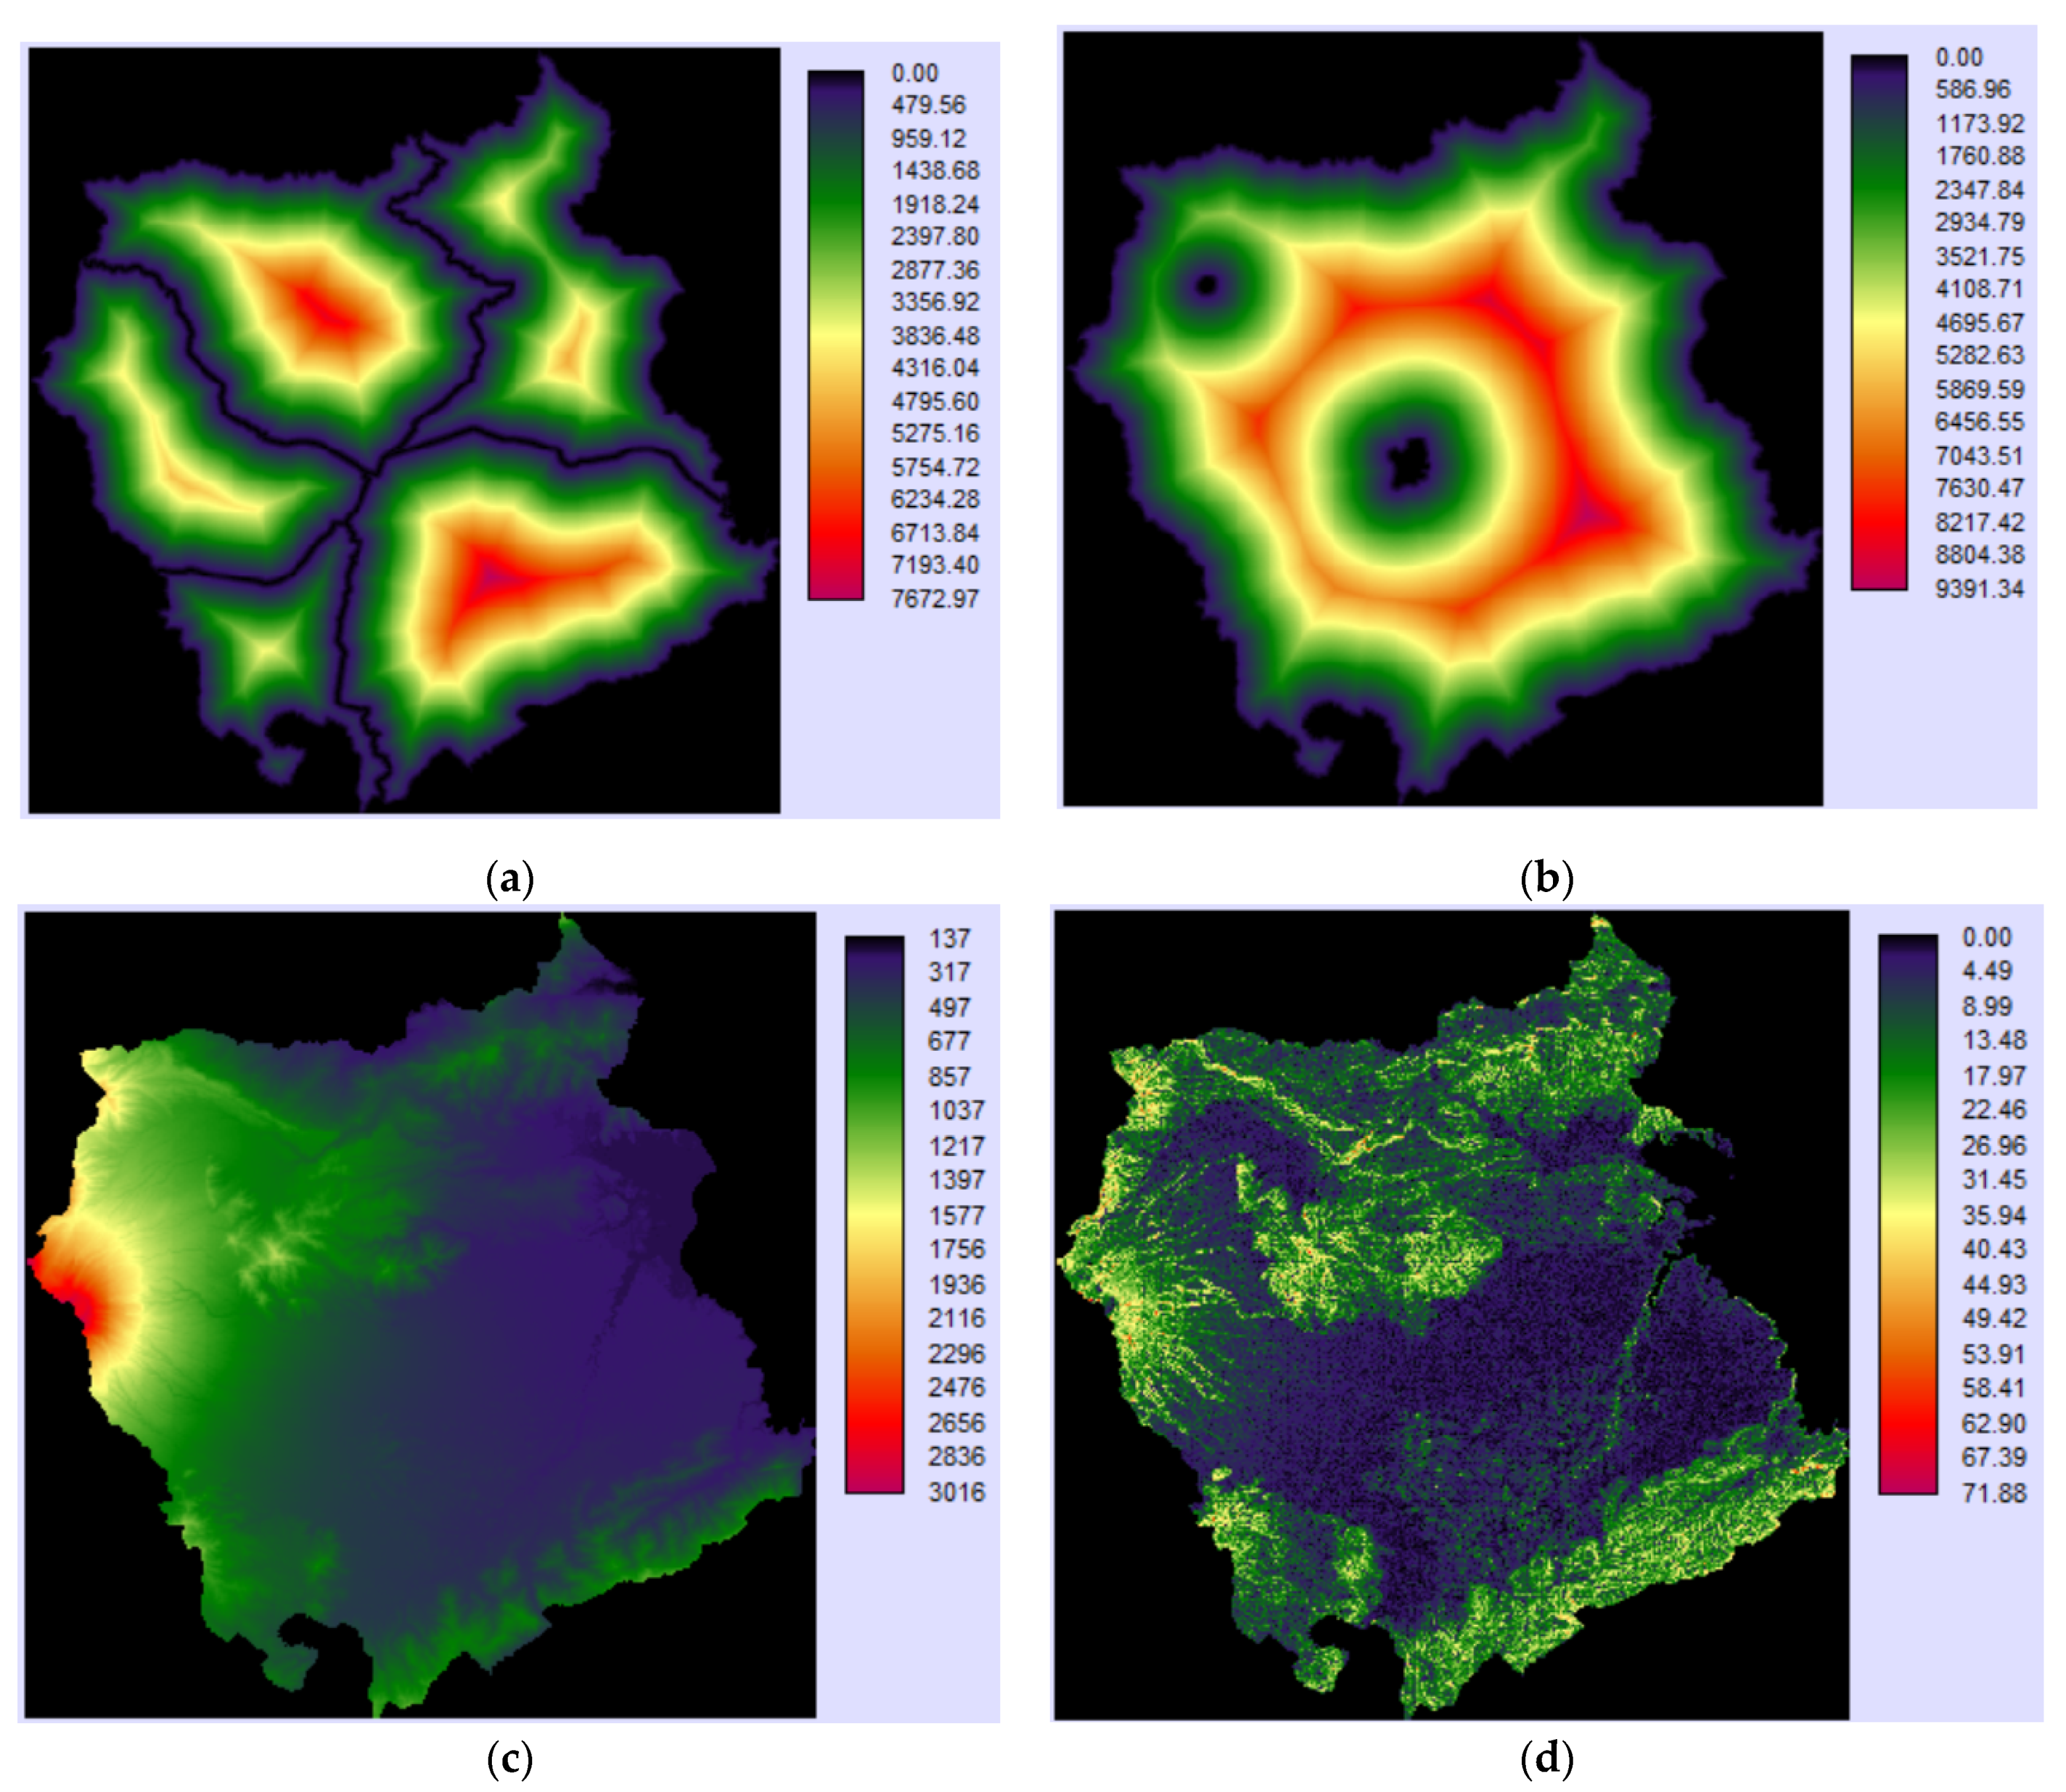
Transition potential maps of LULC classes were generated using the MLP neural network to predict future LULC changes based on transition probabilities calculated using the Markov chain (Table 5). Four driver variables, shown in Figure 8, were used as potential drivers of LULC change, namely, physical variables (slope and topography) and distance variables (distance from the road network and distance from the urban center). Physical variables show how physical difficulties might affect the cost of land-use change, while distance variables show how urban expansion affects land-use change.
Table 5.
Transition Potential Matrix of LULCC 2009–2019.

Figure 8.
Driver Variables Used in Study: (a) Distance from Road Network; (b) Distance from Urban Center; (c) Topography; (d) Slope.
Model Accuracy
The VALIDATE module technique, available in IDRISI Terrset, was employed in this study to validate the predicted outputs. Table 6 presents the summary of statistics of validation obtained from the VALIDATE module for the reference (LULC 2019) and comparison (LULC 2019). This validation method provides an idea of the level of agreement/disagreement between the predicted and actual LULC maps. This informs the number of cells in each class and the level of agreement of a pair of maps regarding the location of the cells in each class [63,64]. Table 4 shows that the overall agreement between the actual and predicted LULC for 2019 is 0.9278, while the total disagreement is 0.0722. The Kno, Klocation, and Kstandard values are 0.9158, 0.9083, 0.8997, respectively. The results in Table 4 indicate that the future LULC change prediction capability of MLP and Markov chain-based LCM model is very high. The Disagreement Grid Cell and Disagreement Quantity components are essential to understanding the model’s predicted outcomes [65]. Table 6 shows that the Disagreement Grid Cell and Disagreement Quantity are 0.0654 and 0.0068, respectively.
Table 6.
Model’s VALIDATE Table.
3.2.2. Land-Use Prediction
Business As Usual (BAU)
The business as usual (BAU) scenario follows the trend of the observed data for 2009, 2014, and 2019, with the most significant changes in the mixed garden, paddy, and built-up land-uses. This scenario predicts that the built-up area will experience 3.757 ha (33.8%) growth. Built-up area growth is distributed in three main locations: the western part (Puncak–Cipanas urban center), the middle part (Cianjur urban center), and the southern part (Cibeber district), as shown in Figure 9. From this trend and geographical distribution, there are three major forces of urban expansion in North Cianjur [20], from JMA, BMA, and Cianjur urban center. The expansion forces from BMA show the least impact on North Cianjur, as seen on the lesser growth of built-up land use around the eastern part of the study area. However, based on this trend, growth in these regions is at an early stage and may have a larger long-term impact.
Figure 9.
Business as Usual Scenario Land-use Prediction 2031.
Spatial Planning Policy (SPP)
The prediction results from the Spatial Planning Policy (SPP) scenario show that the rate of change is much lower than that in the BAU scenario. However, the pattern of changes is the same, with the largest growth in the built-up class and the biggest loss in the paddy class. The results of the SPP scenario show that there is no significant overall change in North Cianjur land-uses (Table 5). Built-up growth can be well-contained in the designated urban zones (Puncak–Cipanas and Cianjur) and at the same time the growth is not as substantial as in other scenarios (Figure 10). This is due to the restrictions based on the planning policy directives that prohibit the conversion of paddy, mixed garden and forest, resulting in a relatively non-realistic prediction, as the trend shows a significant change. Therefore, the only visible growth in this scenario is in Cianjur urban center.
Figure 10.
Spatial Planning Policy Scenario Land-Use Prediction 2031.
Urban Containment (UCT)
The Urban Containment (UCT) scenario shows significant growth in built-up and dry land, especially in urban zones and the fringe that follows the road network (Figure 11). Compared with BAU, UCT experiences significant growth, although less than BAU due to the limited space for growth inside urban zones (Table 7). The UCT scenario resulted in paddy areas not being converted into built-up areas, especially outside of urban zones where this change is primarily focused. The same is apparent in rural zones, with little to no change in the built-up area. This shows that UCT can contain the expansion forces inside the designated urban zones and their fringes while allowing other zones to continue to function in their environmental and agricultural purposes.
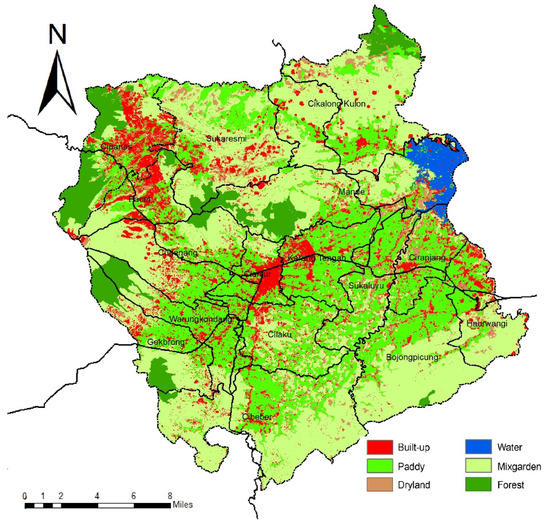
Figure 11.
Urban Containment Scenario Land-Use Prediction 2031.
Table 7.
Comparison of Land-use Prediction Scenarios.
3.3. Urban Form Dynamics
Urban form in its most basic sense is classified into two main forms, compact or sprawling, with other classifications further branches of these two [36]. Moreover, the city development concept (i.e., Garden City, Compact City, Transit-Oriented Development, Low Carbon City, etc.) is a concept that rests on urban form and a certain spatial configuration in several aspects of a city. Towards fulfilling the goals of city development, consideration of urban form has become a necessity in the planning process [9,66].
Urban form dynamics in North Cianjur are due to its geographical location in the southern conurbation corridor of JBMUR. Its urban form is heavily influenced by urban expansion from the Jakarta Metropolitan Area and Bandung Metropolitan Area as well as endogenous growth from within the Cianjur urban zone itself [20]. Expansion from Jakarta Metropolitan Area in particular has a very high impact on the urban form dynamics in North Cianjur, and has led to the formation of the Puncak–Cipanas urban area, a center for tourism-based activities. At the same time, expansion from the Bandung Metropolitan Area in the east has begun to have a significant impact on the forms of industrialization in the eastern part of North Cianjur. These driving forces from two metropolitan areas have caused a disparity between North Cianjur and South Cianjur, leading to several social issues in both regions.
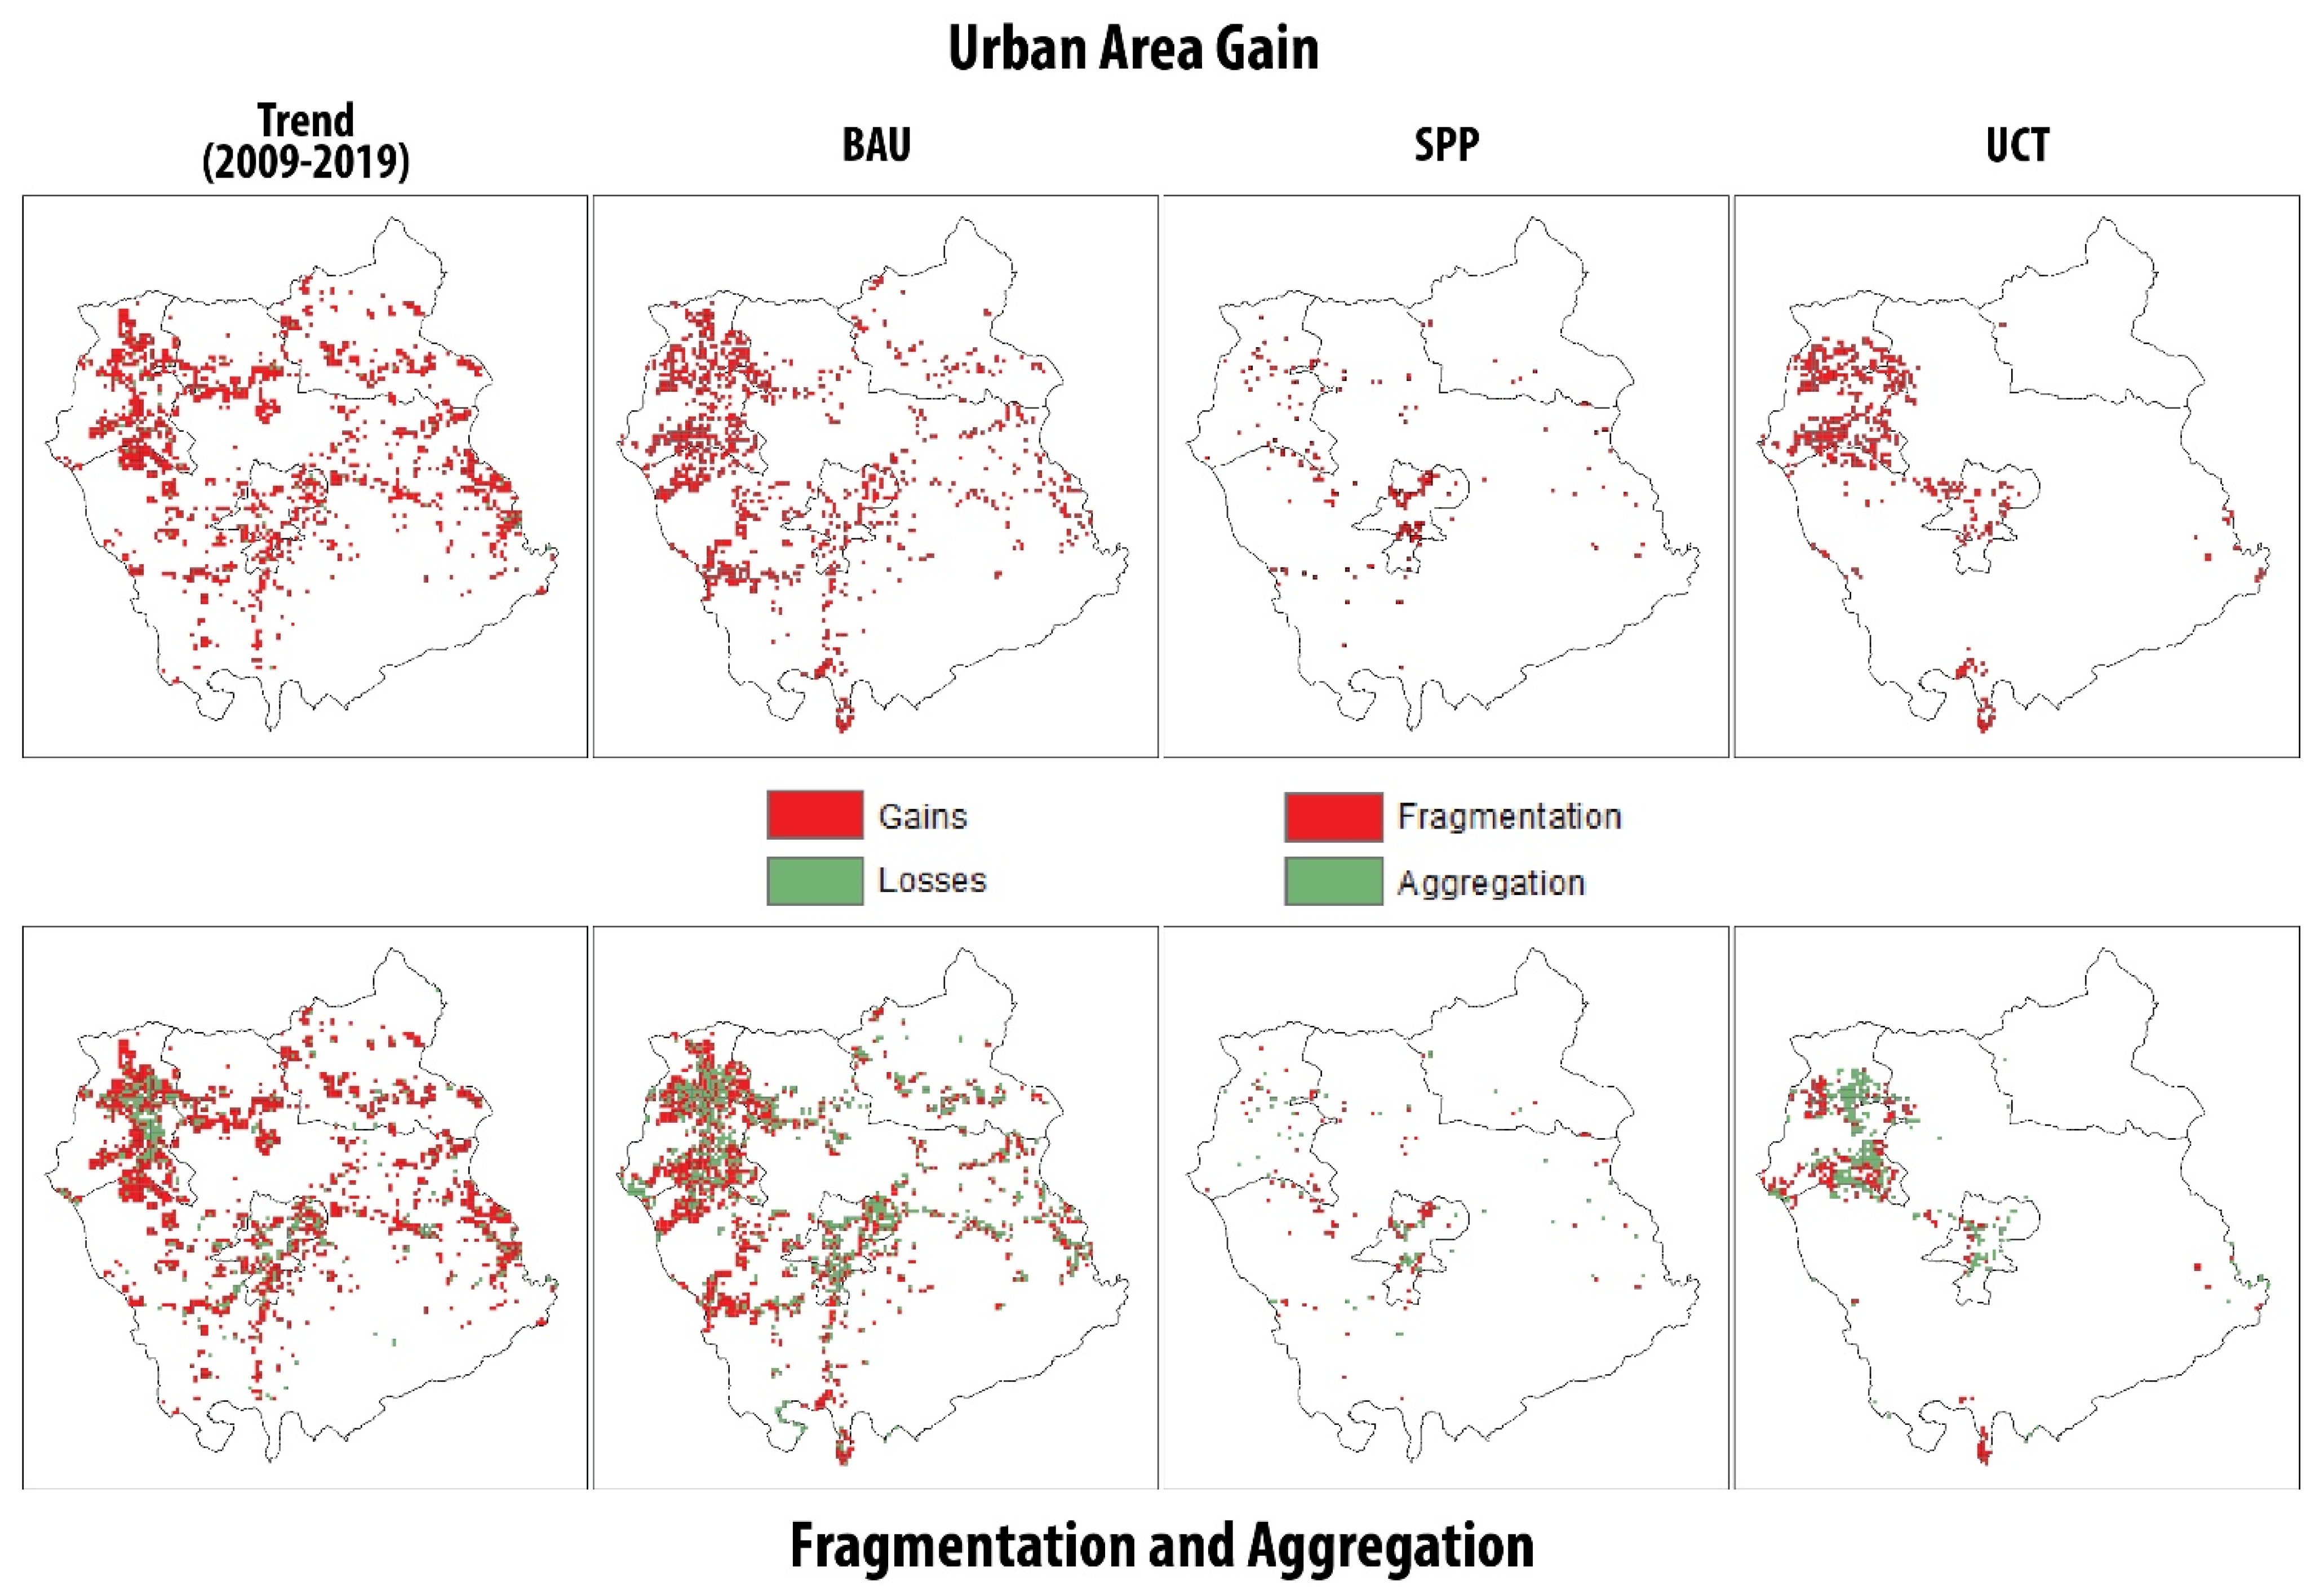
North Cianjur’s urban development has led to the formation of a new urban center, transforming the region into a poly-centric one with two urban centers (Puncak–Cipanas and Cianjur urban center) each with sprawl and dispersed forms outside of the urban center. The trend in urban area gain has two main patterns, ribbon and leapfrog. The ribbon pattern is found along the main road network connecting the Bogor–Bandung corridor, while the leapfrog pattern occurs outside the urban zone in the northern and southern parts of the study area (Figure 12). Most urban area gain happens organically and without adequate planning, as urban growth is only projected inside Cianjur urban center and its fringes [39]. As the modeling scenarios demonstrate, the dynamic might be different from the trend. Hence, the urban form resulting from each scenario is assessed here. Each scenario applied different rules for each zone, and these dynamics are explained and compared for each zone as follows:
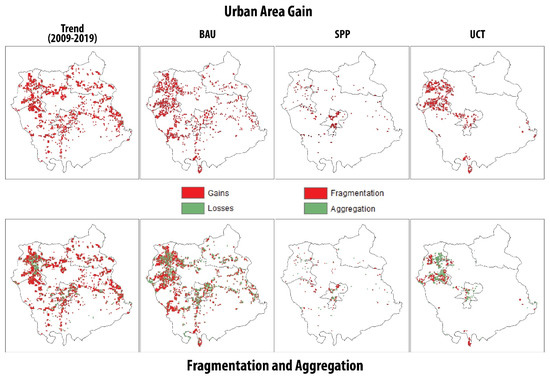
Figure 12.
Spatial distributions of different landscape dynamics identified by trend: BAU, SPP, and UCT models.
- Zone 1 (Puncak–Cipanas urban center)Puncak–Cipanas urban center shows a sprawling trend in the observed data. The BAU scenario shows that the urban areas here are slowly becoming more connected and compact, as shown by the increasing aggregation over the decrease of fragmentation (Figure 12). This urban center follows a ribbon development pattern following the Bogor–Bandung Corridor, growing further south to connect Puncak–Cipanas and the Cianjur urban center. The BAU and UCT models show an increase in the aggregation of built-up land-uses and decreased fragmentation. The SPP model shows the opposite pattern where, albeit to a small degree, the urban form development pattern is leapfrogged and dispersed due to a lack of zoning regulation covering urban growth in that zone.
- Zone 2 (Cianjur urban center)Cianjur urban center shows a compacting trend as the only planned urban center, with more aggregation happening across the urban zone (Figure 12). This zone is a transportation node from where the transportation network spreads to all parts of the Cianjur Regency. This leads to a radial and continuous growth pattern in all the predicted models. The BAU model shows the most dynamic growth in this zone, with growth in all directions. The SPP and UCT model shows much less dynamic growth, more towards north and south in the SPP model and more towards the Bogor–Bandung corridor in the west in the UCT model.
- Zone 3 (Peri-urban)The peri-urban zone receives the spillover of urban growth from both urban centers. Generally, this zone has a sprawling, dispersed trend with a leapfrog pattern outside of the main transportation network ribbon pattern (Figure 12). The models produced in this zone show different characteristics along with the development patterns of the two urban zones. In the UCT model, the urban form characteristics indicate a tendency to form a more dispersed urban area with a leapfrogged pattern all across the zone. The SPP model exhibits the same pattern, although with less intensity. In contrast, the UCT model forms a linear urban area connecting both urban centers.Overall, the expansion pattern shows that both urban centers are becoming more contiguous, and tend to expand eastward from Cianjur urban center to form a JBMUR conurbation corridor, with a push for expansion from the JMA in the west and a push for expansion from the BMA in the east.
- Zone 4 (Rural)Urban form in this zone defines the configuration of rural settlement. The urban form trend shows a sprawling and dispersed pattern, while the models showed no significant growth in this zone, except for model a tendency in the BAU for changes to be increasingly sprawling and dispersed, with a random expansion pattern.
3.4. Recommendations and Policy Response for North Cianjur Regional Development Based on Urban Form Dynamics
The land-use models in this paper act as a form of planning intervention to account for urban growth in North Cianjur, where planning will become an important factor in guiding urban growth, urban form [67,68], and whether to take advantage of growths or limit it [65]. Planning is an instrument of sustainability and regional governance, especially in a hinterland of a mega-urban area such as North Cianjur. Thus, the predicted rural–urban land conversion must be accompanied by a thorough investigation of its economic, social, and environmental impacts. The planning intervention must also be realistic in the sense that it considers the ongoing trends and tries to turn its strategies towards limiting irregular urban growth. The recommendation and policy responses proposed in this research aim to mitigate the extensive force of expansion in both metropolitan areas, maintaining environmental stability and carrying capacity while promoting inclusive urbanization, accessible transportation, and better quality of life in the North Cianjur Region.
Planning intervention and policy responses must take the limitations of this research into account. This paper has mainly explored the physical aspects of urban form and land-use dynamics while formulating three scenarios as a planning intervention in order to determine which is the most optimal. There are, however, several limitations in this paper regarding this approach, especially in terms of explaining the nature of the dynamics themselves. The nature of urban form and land-use dynamics is multi-dimensional, with social, economic, and political conditions all playing significant roles. In this paper these dynamics have been primarily addressed in terms of trends, assuming that those multi-dimensional factors are already represented by the trend; this leaves various external factors such as policies, economic structure and development, human intervention and behavior, socio-political changes, and others largely unexplored. This paper uses physical (distance) variables to explain the impact of socio-economic factors. Therefore, the recommendations and policy responses here are based on the existing trends and physical variables as a representation of other unexplored factors.
The BAU model, in this case, demands a high response and high government capacity to accommodate the force of expansion and growth from two metropolitan areas, starting with the need for basic urban infrastructure, transportation networks, and a flexible planning strategy to take full advantage of the high growth dynamic that the BAU model presents. In this scenario, planning response and strategy need to have a prominent understanding of threshold and carrying capacity to allow proper and sustainable regional growth. In the SPP model, several major adjustments need to be made in the spatial planning policy. One of the most important is proper planning and zoning regulation across all zones, especially Zone 1 (Puncak–Cipanas urban). The integration between planning policy needs to be reconsidered, including planning policy in Cianjur Regency itself, West Java, and the Jakarta–Bandung Mega-Urban area, as asynchronous planning policies will lead to an uncontrollable urban dynamic in the hinterland area [20]. The UCT model has the capabilities to limit and maintain urban growth within the urban zones; however, it requires stricter and more advanced zoning regulation in order to maintain sustainability in urban zones. To further limit urban growth, the greenbelt strategy needs to be implemented in forest areas and agricultural areas. Transportation and other urban infrastructure need to be maintained and provided in order to promote a sustainable urban area.
The UCT model is deemed to be the more optimal option in this case as an instrument for controlling urban growth in the North Cianjur region. This model can accommodate the various driving factors for urban expansion in the North Cianjur region while maintaining the extent of where the urban growth occurs. The projected urban form dynamics show that by focusing on the driving factors of urban expansion in urban centers, a compact and connected urban form will result, thus making for more efficient urban management. In addition, in order to further control growth outside of urban zones and to prevent sprawl and irregular growth, stricter zoning regulation following several zoning strategies can be implemented in a more detailed and form-based recommendation in each zone, as follows:
- Zone 1 (Puncak–Cipanas urban center)Puncak–Cipanas is a newly-formed urban center with mixed land-uses, rural characteristics, and protected forest areas mixed in with the urban center, which could potentially evolve into a chaotic mix of land uses. The direction of development in this zone is to control the growth of the urban area to form a more linear and continuous urban corridor, avoiding expansive radial growth and promoting better protection of the forest area. The development of integrated transportation infrastructure is needed to accommodate and control growth in this area.
- Zone 2 (Cianjur urban center)Cianjur urban center functions as the center of government and transportation node for the regency as well as the regional activity center. The development direction for this zone is to become an urban center that is more compact and connected in order to concentrate expansion intensity. The compact city narratives in this zone need to be supported by improving the quality of the transportation network to improve regional connectivity and impose better control and regulation over zoning regulation.
- Zone 3 (Peri-urban)The peri-urban zone has a mixed land-use characteristic, with the dominance of paddy-mixed garden and a sprawling trend in built-up growth. The main recommendation for this zone is to concentrate and limit urban expansion in this zone to form a fringe along the main transportation network, connecting the Bogor–Bandung corridor to achieve a contiguous and connected urban corridor. Peri-urban areas adjacent to the urban zones must function as dedicated buffer areas for urban growth, and act as greenbelts.
- Zone 4 (Rural)Agricultural areas dominate the rural zone, with a low-density rural settlement mixed among them. The trend of urban form dynamics in this zone shows a heavy sprawling trend. Therefore, the recommendation for this zone is to maintain its function as an agricultural area while urban growth is contained inside the urban zones, making this zone serve an ecological purpose for both Cianjur Regency and the JBMUR.
4. Conclusions
North Cianjur, as the hinterland of the Jakarta–Bandung mega-urban region (JBMUR), will have to accommodate the force of the growth and expansion of the two adjacent metropolitan areas as well as its own. The aforementioned expansionary forces have transformed this region into a polycentric region with two urban centers, Puncak–Cipanas and Cianjur urban center, as confirmed by Rustiadi’s Quantitative Zoning Method (C”) classification. Another classification, which dominates the middle and southern part of North Cianjur, is peri-urban, while the northernmost part of North Cianjur is rural. The trend of land-use change in North Cianjur is mainly due to the nature of expansion, resulting in the conversion of agricultural areas into sprawled built-up land-uses. Land-use changes cause the transformation of the urban form into a sprawling pattern of built-up areas in peri-urban and rural zones, while the urban zones show a compacting trend in the initial built-up areas.
The BAU, SPP, and UCT scenarios provide simulations of different policy interventions and their impact on urban form dynamics. BAU emphasizes the sprawling trend outside the urban zones, compaction, and connectivity between urban areas along the main road network. The SPP model provides the least growth due to a spatial planning policy that allocates Cianjur urban zones as the only urban center development. The UCT model provides a hypothetical alternative to control urban growth and expansion, indicating compaction in the urban center, linear and continuous development over the peri-urban zones adjacent to the urban center, and a fringe and corridor pattern along the Bogor–Bandung corridor. The UCT scenario proved to be the most optimal planning intervention to achieve sustainable hinterland development, as it was able to contain urban expansion in the designated urban zones when coupled with proper zoning regulation (especially in agricultural and forest areas) and proper urban infrastructure, thus accommodating both urban growth and regional sustainability. Other scenarios had significant drawbacks and concerns; the BAU model threatened the region’s carrying capacity, while the SPP model required several major adjustments in zoning regulation compared to the current conditions.
This paper mainly explains the physical aspects of landscape and urban form analysis. The land-use change and prediction process was mainly based on trends and physical distance variables as the explanatory factors, leaving various external forces yet to be explored. Therefore, this research could be further developed using a more thorough and multidimensional approach in order to better explain regional sustainability and urban form dynamics.
Author Contributions
Conceptualization, A.J. and I.S.; methodology, A.J., I.S., E.R., D.O.P. and B.J.; software, A.J., E.R. and D.O.P.; validation, A.J., I.S., E.R., D.O.P. and B.J.; formal analysis, A.J.; investigation, A.J., I.S., E.R., D.O.P. and B.J.; resources, A.J., I.S., E.R., D.O.P. and B.J.; data curation, A.J., E.R.; writing—original draft preparation, A.J.; writing—review and editing, A.J., I.S., E.R., D.O.P. and B.J.; visualization, A.J.; supervision, I.S., E.R., D.O.P. and B.J.; project administration, A.J., I.S., E.R.; funding acquisition, A.J., E.R. All authors have read and agreed to the published version of the manuscript.
Funding
This research was funded by PMDSU Scholarship from Ministry of Research and Technology/National Research and Innovation Agency of Republic Indonesia.
Institutional Review Board Statement
Not applicable.
Informed Consent Statement
Not applicable.
Acknowledgments
The authors would like to thank the Cianjur Regency Government, Cianjur Regency Spatial Planning Department, Cianjur Regency Planning and Development Bureau, Ministry of Research and Technology/National Research and Innovation Agency of Indonesia for granting the scholarship. The author would like to thank the reviewers and the editor for their helpful and constructive comments, which greatly contributed towards improving this paper.
Conflicts of Interest
The authors declare no conflict of interest.
References
- Williams, K. Urban form and infrastructure: A morphological review. Future Cities Work. Pap. 2014, 1–58. [Google Scholar] [CrossRef]
- Camagni, R.; Gibelli, M.C.; Rigamonti, P. Urban mobility and urban form: The social and environmental costs of different patterns of urban expansion. Ecol. Econ. 2002, 40, 199–216. [Google Scholar] [CrossRef]
- Clifton, K.; Ewing, R.; Knaap, G.; Song, Y. Quantitative analysis of urban form: A multidisciplinary review. J. Urban. Int. Res. Placemaking Urban Sustain. 2008, 1, 17–45. [Google Scholar] [CrossRef]
- Abrantes, P.; Rocha, J.; Da Costa, E.M.; Gomes, E.; Morgado, P.; Costa, N. Modelling urban form: A multidimensional typology of urban occupation for spatial analysis. Environ. Plan. B Urban Anal. City Sci. 2017, 46, 47–65. [Google Scholar] [CrossRef]
- Banister, D.; Watson, S.; Wood, C. Sustainable cities: Transport, energy, and urban form. Environ. Plan. B Plan. Des. 1997, 24, 125–143. [Google Scholar] [CrossRef]
- Schwarz, N. Urban form revisited—Selecting indicators for characterizing European cities. Landsc. Urban Plan. 2010, 96, 29–47. [Google Scholar] [CrossRef]
- Williams, K.; Burton, E.; Jenks, M. Achieving Sustainable Urban Form; E&FN Spon: London, UK, 2000. [Google Scholar]
- Živković, J. Urban Form and Function. In Climate Action. Encyclopedia of the UN Sustainable Development Goals; Filho, L.W., Azeiteiro, U., Azul, A., Brandli, L., Özuyar, P., Wall, T., Eds.; Springer: Berlin, Germany, 2019. [Google Scholar]
- Dempsey, N.; Brown, C.; Raman, S.; Porta, S.; Jenks, M.; Jones, C.; Bramley, G. Elements of Urban Forms. In Dimensions of the Sustainable Cities; Jenks, M., Jones, C., Eds.; Springer: London, UK, 2010; pp. 21–51. [Google Scholar]
- Frenkel, A.; Orenstein, D.E. Can Urban Growth Management Work in an Era of Political and Economic Change? J. Am. Plan. Assoc. 2012, 78, 16–33. [Google Scholar] [CrossRef]
- Sharma, S.N. Urban Forms in Planning and Design. Int. J. Res. 2014, 1, 7–16. [Google Scholar]
- Castells, M. The Information Age: Economy, Society and Culture: Volume 1—The Rise of The Network Society, 2nd ed.; Blackwell: Oxford, UK, 1996. [Google Scholar]
- Wong, C.; Ravetz, J.; Turner, J. The UK Spatial Planning Framework: A Discussion; RPTI: London, UK, 2000. [Google Scholar]
- Giuliano, G.; Kang, S.; Yuan, Q. Agglomeration economies and evolving urban form. Ann. Reg. Sci. 2019, 63, 377–398. [Google Scholar] [CrossRef] [Green Version]
- Banister, D. Energy, quality of life and the environment: The role of transport. Transp. Rev. 1996, 16, 23–35. [Google Scholar] [CrossRef]
- Banister, D. Unsustainable Transport: City Transport in the New Century; Taylor & Francis: Milton, UK, 2005. [Google Scholar]
- Tonkiss, F. Cities by Design: The Social Life of Urban Form; Wiley Publishing: Hoboken, NJ, USA, 2014. [Google Scholar]
- Holden, E.; Norland, I.T. Three Challenges for the Compact City as a Sustainable Urban Form: Household Consumption of Energy and Transport in Eight Residential Areas in the Greater Oslo Region. Urban Stud. 2005, 42, 2145–2166. [Google Scholar] [CrossRef]
- Maeng, D.-M.; Nedovic-Budic, Z. Urban form and planning in the information age: Lessons from literature. Spatium 2008, 17, 1–12. [Google Scholar] [CrossRef]
- Jatayu, A.; Rustiadi, E.; Pribadi, D. A Quantitative Approach to Characterizing the Changes and Managing Urban Form for Sustaining the Suburb of a Mega-Urban Region: The Case of North Cianjur. Sustainability 2020, 12, 8085. [Google Scholar] [CrossRef]
- Wilson, E.H.; Hurd, J.D.; Civco, D.L.; Prisloe, M.P.; Arnold, C. Development of a geospatial model to quantify, describe and map urban growth. Remote Sens. Environ. 2003, 86, 275–285. [Google Scholar] [CrossRef]
- Blaikie, P.; Brookfield, H. Land Degregation and Society; Routledge: Oxfordshire, UK, 2015. [Google Scholar]
- Hennig, E.I.; Schwick, C.; Soukup, T.; Orlitová, E.; Kienast, F.; Jaeger, J.A. Multi-scale analysis of urban sprawl in Europe: Towards a European de-sprawling strategy. Land Use Policy 2015, 86, 286–302. [Google Scholar] [CrossRef] [Green Version]
- Sisodia, P.S.; Tiwari, V.; Dahiya, A.K. Prediction of urban sprawl using remote sensing, GIS and multilayer perceptron for the City Jaipur. In Intelligent Systems Technologies and Applications; Springer: Berlin, Germany, 2016. [Google Scholar]
- Roo, G.D.; Miller, D. Compact Cities and Sustainable Urban Development—A Critical Assessment of Policies and Plans from an International Perspective; Routledge: London, UK, 2000. [Google Scholar]
- Jabareen, Y.R. Sustainable Urban Forms: Their Typologies, Models, and Concepts. J. Plan. Educ. Res. 2006, 26, 38–52. [Google Scholar] [CrossRef]
- Wandl, A.; Magoni, M. Sustainable Planning of Peri-Urban Areas: Introduction to the Special Issue. Plan. Pract. Res. 2016, 32, 1–3. [Google Scholar] [CrossRef] [Green Version]
- Feola, G.; Suzunaga, J.; Soler, J.; Wilson, A. Peri-urban agriculture as quiet sustainability: Challenging the urban development discourse in Sogamoso, Colombia. J. Rural Stud. 2020, 80, 1–12. [Google Scholar] [CrossRef]
- Mortensen, L.; Kørnøv, L.; Lyhne, I.; Raakjær, J. Smaller ports’ evolution towards catalysing sustainable hinterland development. Marit. Policy Manag. 2020, 47, 402–418. [Google Scholar] [CrossRef]
- Ferrari, C.; Parola, F.; Gattorna, E. Measuring the Quality of Port Hinterland Accessibility: The Lingurian Case. Transp. Policy 2011, 18, 382–391. [Google Scholar] [CrossRef]
- Nilsson, K.; Nielsen, T.S.; Aalbers, C.; Boities, B.; Chery, J.P.; Fertner, C.; Haase, D.; Loibi, W.; Pauleit, S.; Piorr, A.; et al. Strategies for sustainable urban development and urban-rural linkages. Eur. J. Spat. Dev. 2014, 4, 1–26. [Google Scholar]
- Schuh, B.; Sedlacek, S. City, Hinterlands—Sustainable Relations. In Proceedings of the 40th Congress of the European Regional Association (ERSA), Barcelona, Spain, 29 August–1 September 2000. [Google Scholar]
- Varkey, A.M.; Manasi, S. A Review of Peri-Urban Definitions, Land Use Changes and Challenges to Development. Urban India 2019, 39, 96–111. [Google Scholar]
- Van Bueren, E.; van Bohemen, H.; Itard, L.; Visscher, H. Sustainable Urban Environments; Springer: Dordrecht, The Netherland, 2011. [Google Scholar]
- Dorodjatoen, A.M. The Emergence of Jakarta-Bandung Mega-Urban Region and Its Future Challenges. J. Perenc. Wil. Dan Kota 2009, 20, 15–33. [Google Scholar]
- Sorensen, A.; Okata, J. Megacities: Urban Form, Governance, and Sustainability; Springer: Tokyo, Japan, 2011. [Google Scholar]
- Bhatta, B.; Saraswati, S.; Bandyopadhyay, D. Urban sprawl measurement from remote sensing data. Appl. Geogr. 2010, 30, 731–740. [Google Scholar] [CrossRef]
- Zhang, S.; York, A.M.; Boone, C.G.; Shrestha, M. Methodological Advances in the Spatial Analysis of Land Fragmentation. Prof. Geogr. 2013, 65, 512–526. [Google Scholar] [CrossRef]
- Cianjur Regency Government. Cianjur Regency Spatial Planning 2011–2031; Cianjur Regency Development Planning Agency: Cianjur, Indonesia, 2012.
- Cianjur Regency Statistical Bureau. Cianjur Regency in Figures 2020; BPS Cianjur: Cianjur, Indonesia, 2020.
- Firman, T. The continuity and change in mega-urbanization in Indonesia: A survey of Jakarta–Bandung Region (JBR) development. Habitat Int. 2009, 33, 327–339. [Google Scholar] [CrossRef]
- Winarso, H.; Hudalah, D.; Firman, T. Peri-urban transformation in the Jakarta metropolitan area. Habitat Int. 2015, 49, 221–229. [Google Scholar] [CrossRef]
- West Java Provincial Government. West Java Province Spatial Planning 2009–2029; West Java Province Development Planning Agency: Bandung, Indonesia, 2010.
- Indonesia Government. Jabodetabekpunjur Spatiial Planning; National Development Planning Agency: Jakarta, Indonesia, 2020.
- Silva, E.A.; Acheampong, R.A. Developing an Inventory and Typology of Land-Use Planning Systems and Policy Instruments in OECD Countries. OECD Environ. Work. Pap. 2015, 94, 1–52. [Google Scholar]
- Starikova, T.V. The regional typology development in the system of strategic planning. Russ. J. Ind. Econ. 2017, 10, 172–178. [Google Scholar] [CrossRef]
- Rustiadi, E.; Kobayashi, S. Contiguous Spatial Classification: A New Approach on Quantitative Zoning Method. J. Geogr. Educ. 2000, 43, 122–136. [Google Scholar]
- Rustiadi, E.; Saefulhakim, S.; Panuju, D.R. Perencanaan dan Pengembangan Wilayah; Crestpent Press and Yayasan Obor Indonesia: Jakarta, Indonesia, 2009.
- Mishra, V.N.; Rai, P.; Mohan, K. Prediction of land use changes based on land change modeler (LCM) using remote sensing: A case study of Muzaffarpur (Bihar), India. J. Geogr. Inst. Jovan Cvijic SASA 2014, 64, 111–127. [Google Scholar] [CrossRef]
- Eastman, J.R. Idrisi Taiga Manual; Clark University Press: Worcester, UK, 2009. [Google Scholar]
- Tajbakhsh, S.; Memarian, H.; Moradi, K.; Afshar, A.A. Performance comparison of land change modeling techniques for land use projection of arid watersheds. Glob. J. Environ. Sci. Manag. 2018, 4, 263–280. [Google Scholar] [CrossRef]
- Rustiadi, E.; Mizuno, K.; Kobayashi, S. Measuring Spatial Patterns of the Suburbanization Process. A Study Case of Bekasi District, Indonesia. J. Rural. Plan. Assoc. 1999, 18, 31–42. [Google Scholar] [CrossRef]
- Hudalah, D.; Firman, T. Beyond property: Industrial estates and post-suburban transformation in Jakarta Metropolitan Region. Cities 2012, 29, 40–48. [Google Scholar] [CrossRef]
- Woo, M.; Guldman, J.M. Urban containment policies and urban growth. Int. J. Urban Sci. 2014, 18, 309–336. [Google Scholar] [CrossRef]
- Aytur, S.A.; Rodriguez, D.A.; Evenson, K.R.; Catellier, D.J. Urban Containment Policies and Physical Activity: A Time–Series Analysis of Metropolitan Areas, 1990–2002. Am. J. Prev. Med. 2008, 34, 320–332. [Google Scholar] [CrossRef]
- Haines-Young, R.; Chopping, M. Quantifying landscape structure: A review of landscape indices and their application to forested landscapes. Prog. Phys. Geogr. Earth Environ. 1996, 20, 418–445. [Google Scholar] [CrossRef]
- McGarigal, K.; Cushman, S.A.; Neel, M.C.; Ene, E. FRAGSTATS: Spatial Pattern Analysis Program for Categorical Maps. Computer Software Program Produced by the Authors at the University of Massachusetts, Amherst. 2002. Available online: https://www.umass.edu/landeco/research/fragstats/fragstats.html (accessed on 28 October 2020).
- Leitão, A.B.; Miller, J.; Ahem, J.; McGarigal, K. Measuring Landscapes: A Planner’s Handbook; Island Press: Washington, DC, USA, 2006. [Google Scholar]
- Machado, R.; Bayot, R.; Godinho, S.; Pirnat, J.; Santos, P.; de Sousa-Neves, N. LDT tool: A toolbox to assess landscape dynamics. Environ. Model. Softw. 2020, 133, 104847. [Google Scholar] [CrossRef]
- Machado, R.; Godinho, S.; Pirnat, J.; Neves, N.; Santos, P. Assessment of landscape composition and configuration via spatial metrics combination: Conceptual framework proposal and method improvement. Landsc. Res. 2017, 43, 652–664. [Google Scholar] [CrossRef]
- McGee, T. The Emergence of Desakota Regions in Asia: Expanding a Hypothesis. Ext. Metrop. Settl. Transit. Asia 1991, 12, 3–25. [Google Scholar]
- McGee, T.; Greenberg, C. The Emergence of Extended Metropolitan Regions in ASEAN: Towards the Year 2000. Asean Econ. Bull. 1992, 9, 22–44. [Google Scholar] [CrossRef]
- Hyandye, C.; Martz, L.W. A Markovian and cellular automata land-use change predictive model of the Usangu Catchment. Int. J. Remote Sens. 2016, 38, 64–81. [Google Scholar] [CrossRef]
- Islam, K.; Rahman, F.; Jashimuddin, M. Modeling land use change using Cellular Automata and Artificial Neural Network: The case of Chunati Wildlife Sanctuary, Bangladesh. Ecol. Indic. 2018, 88, 439–453. [Google Scholar] [CrossRef]
- Wang, W.; Zhang, C.; Allen, J.M.; Li, W.; Boyer, M.A.; Segerson, K.; Silander, J.A. Analysis and Prediction of Land Use Changes Related to Invasive Species and Major Driving Forces in the State of Connecticut. Land 2016, 5, 25. [Google Scholar] [CrossRef] [Green Version]
- Anthony, A.F.; Offia, I.E.; Abidemi, B.R.; Kamoru, O.K.G. Urban Sustainability Concepts and Their Implications on Urban Form. Urban Reg. Plan. 2018, 3, 27. [Google Scholar] [CrossRef]
- Rydin, Y. The Purpose of Planning: Creating Sustainable Towns and Cities; Policy Press: Bristol, UK, 2011. [Google Scholar]
- Deng, Y.; Fu, B.; Sun, C. Effects of urban planning in guiding urban growth: Evidence from Shenzhen, China. Cities 2018, 83, 118–128. [Google Scholar] [CrossRef]


Publisher’s Note: MDPI stays neutral with regard to jurisdictional claims in published maps and institutional affiliations. |
© 2022 by the authors. Licensee MDPI, Basel, Switzerland. This article is an open access article distributed under the terms and conditions of the Creative Commons Attribution (CC BY) license (https://creativecommons.org/licenses/by/4.0/).