Abstract
The protection and expansion of forest carbon sinks are critical to achieving climate-change mitigation targets. Yet, the increasing frequency and severity of forest disturbances challenge the sustainable provision of forest services. We investigated patterns of forest disturbances’ impacts on carbon sinks by combining spatial datasets of forest carbon sequestration from biomass growth and emissions from fire and bark beetle damage in the western United States (U.S.) and valued the social costs of forest carbon losses. We also examined potential future trends of forest carbon sinks under two climate-change projections using a global vegetation model. We found that forest carbon losses from bark-beetle damage were larger than emissions from fires between 2003 and 2012. The cumulative social costs of forest carbon losses ranged from USD 7 billion to USD 72 billion, depending on the severity of global warming and the discount rate. Forest carbon stocks could increase around 5% under Representative Concentration Pathway (RCP) 4.5 or 7% under RCP 8.5 by 2091 relative to 2011 levels, mostly in forests with high net primary productivity. These results indicate that spatially explicit management of forest disturbances may increase forest carbon sinks, thereby improving opportunities to achieve critical climate-change mitigation goals.
1. Introduction
Forest disturbances have a substantial impact on the climate regulation service of forests. Indeed, the protection, restoration, and expansion of forest ecosystems are critical for climate-change mitigation [1]. Yet, the increasing frequency, extent, and intensity of forest disturbances such as fires, pest outbreaks, and timber extraction may offset the benefits from strategies aimed at increasing forest carbon sinks [2]. Insights from current and projected impacts of forest disturbances could help devise strategies to protect and expand forest carbon sinks and the provision of other forest services [3].
The sustainable provision of forest ecosystem services requires the design of strategies that account for interactions between local, regional, and global forest disturbances since these interactions could have cascading effects on ecological and socioeconomic systems well beyond impacted sites and over long time horizons [4]. For instance, forest insect outbreaks have the potential to alter the probability, extent, or severity of wildfires, as well as post-fire tree regeneration [5]. Thus, non-spatially targeted management of forest disturbances combined with the slow process of forest regrowth and expansion may result in long-lasting social, economic, and environmental complications [6,7].
Focusing on forest carbon stocks, past natural and anthropogenic disturbances on U.S. forest lands have reduced them to about half their maximum storage potential [8]. Ensuing forest regeneration over about 25 years, between 1990 and 2016, has resulted in the sequestration of about 1600 million metric tons of CO2 (Mt CO2) [9]. During this period, fire and timber harvesting reduced forest carbon stocks by about 791 Mt CO2. On balance, these carbon fluxes resulted in the net sequestration of about 800 Mt of CO2 (around 30 Mt CO2 per year) [9]. While these forest carbon stocks offset around 15% of the U.S. carbon emissions from fossil fuel combustion per year [9], carbon absorption rates across most terrestrial ecosystems have been declining in recent decades due to soil water and nutrient constraints [10]. The declining ability of forest ecosystems to capture and store carbon increases the relevance of protecting current carbon sinks.
Our analysis contributes to our knowledge base by examining the spatial patterns of forest carbon emissions in western U.S. forests and quantifying the social cost of such emissions. We also investigated the relationship between forest disturbances and the ability of forests to capture atmospheric CO2. Finally, we estimated potential long-term changes in forest carbon sinks under Representative Concentration Pathway (RCP) 4.5 (global warming between 2 and 3 degrees Celsius by 2100) and RCP 8.5 (global warming around 5 degrees Celsius).
2. Materials and Methods
2.1. Study Area
We investigated forest disturbances in the western U.S. (Arizona, California, Colorado, Idaho, Montana, Nevada, New Mexico, Oregon, Utah, Washington, and Wyoming). The region covers broad ranges of elevations and includes numerous ecoregions arrayed across wide temperature and moisture gradients, while also encompassing a large and diverse set of forest types. Western U.S. forests accounted for almost one-third of the national net forest CO2 sequestration from 1990 to 2016. California, Idaho, Oregon, and Washington account for about 63% of the forest carbon stock within the region. In terms of carbon pools, almost two-thirds of the sequestered carbon in western U.S. forests is stored in aboveground biomass and soils. The rest is accumulated in forest litter, such as fallen leaves and branches (20% of the CO2 stock), dead trees (8%), and non-tree understory vegetation (2%) [11]. Timber harvesting, wildfires, pest outbreaks, and droughts are the main drivers of tree mortality and carbon losses in this region [9,12].
Most western States in the U.S. have large areas of public lands managed by federal and state entities, and they have large areas of sparsely populated and relatively undeveloped lands subject to disturbances. Certain locations attract millions of national and international visitors for their majestic landscape, unique features, and scenic beauty. For example, Grand Canyon, Yellowstone, and Yosemite National Parks received 2.9, 3.8, and 2.3 million annual visitors, respectively, in 2020 [13]. In many areas, human settlement is broadly interspersed with forests and trees, and, in others, commercial forest management for wood products prevails. Forest disturbances will directly affect the sustainable provision of multiple forest services.
2.2. Historical Forest Carbon Fluxes
In the western U.S., the rate of forest carbon loss resulting from timber harvest, bark beetle outbreaks, and fire has been approximately 1.1% per year from 2003 to 2012 [14]. Timber harvest accounts for about half the forest carbon removal in the region, followed by bark-beetle (32%) and fire (18%) events [14]. The net carbon effect of timber extraction requires a life-cycle analysis of wood products with different lifespans and rates of carbon decay (e.g., paper and wooden frames of houses).
Since such an analysis is out of the scope of our study and since we lacked spatially explicit data on timber harvesting, we focused instead on identifying the spatial patterns and social costs of carbon emissions generated by fire and bark beetles. Spatially explicit changes in forest carbon from these two disturbances were quantified using annual tree-mortality data at a 1 km resolution over the period 2003–2012 from Berner et al. [14]. Estimates of aboveground forest carbon differ among available datasets, particularly for spatially explicit datasets. The data used in our analysis rely on an ensemble of aboveground biomass datasets and regional field data to vary tree mortality by forest type and fire severity. Around 40% of forests in the study area experienced multiple disturbances from 2003 to 2012. To account for that, Berner et al. [14] reduced trees’ aboveground carbon each time a disturbance occurred. Monte Carlo simulation was also used to investigate uncertainty derived from parameter error and temporal variability. All these steps produced robust estimates of aboveground carbon lost due to fire and bark-beetle disturbances. Tree mortality from low- to high-intensity fires was estimated using Landsat images and fire severity data for fires larger than 405 hectares. The United States Forest Service National Forest Health Monitoring implements aerial surveys to map regions affected by insects and other disturbances. Such information is used to estimate the number of dead trees in affected areas manually. Survey data is then used to estimate the annual canopy mortality area due to twelve types of bark beetles in western U.S. forests from 1997 to 2010. Survey-based estimates were corrected using field observations and canopy mortality data generated with high-resolution satellite imagery (2.4 m) from Colorado, Idaho, and New Mexico. This information was used by Berner et al. [14] to estimate annual tree canopy mortality from 2003 to 2012 at a 1 km resolution. More information about the tree-mortality data is available in Berner et al. [14].
We used spatially explicit information on the average carbon sequestration of established and secondary forests reported by Harris et al. [15] for the period 2001–2020. We overlaid these data with the tree-mortality data to investigate the effect of forest disturbances on the climate regulation capability of these forests. While the periods of the carbon sequestration and tree-mortality data are not perfectly aligned, these datasets allow the exploration of spatial patterns of forest disturbances and forest carbon uptake.
2.3. Valuing the Cost of Forest Carbon Emissions from Disturbances
Once the carbon budget associated with certain levels of climate change is exceeded, the cost of each additional ton of CO2 emissions increases. The Interagency Working Group (IWG) on the Social Cost of Carbon [16] has estimated the global net monetary impact per additional CO2 emitted between 2010 to 2050, using three global integrated assessment models (IAMs) of human and ecological systems. This Social Cost of CO2 (SC-CO2) estimate accounts for potential climate change impacts—both benefits and costs—of small increases in regional temperatures across multiple economic areas such as in agricultural productivity, human health, and increased risks to property and human lives.
Given the long-term residence of CO2 emissions in the atmosphere, the IAMs used by the IWG assess the net economic costs from the year of the emission to 2300. The IWG arrives at a range of economic values after applying different discount rates of social time preference (2.5%, 3%, and 5%) to the net economic costs. The SC-CO2 was also estimated for a scenario that reflects the costs of extreme climate effects by using the 95th percentile of the distribution estimates at the 3% discount rate. We incorporated SC-CO2 estimates, reported by the IWG for the period 2010–2050, in statistical regressions to project the cost of annual emissions from disturbance events between 2003 to 2012 and between 2051 to 2091.
Annual SC-CO2 estimates from 2003 to 2012 (in 2007 dollars) were first multiplied by the corresponding annual forest carbon emission resulting from fire and beetle-induced tree mortality. The results were aggregated to generate a cumulative estimate. SC-CO2 estimates for the period 2050–2091 were used to value the benefits of net carbon sequestration due to projected vegetation dynamics.
2.4. Projected Forest Carbon Fluxes
Recent carbon emissions from forest disturbances have been offset by carbon storage in the form of forest biomass growth and forest cover expansion [9]. To assess if such trends are expected to continue under climate-change projections, we used the dynamic global vegetation model MC2 [17]. MC2 simulates vegetation dynamics under climate projections from 20 global climate models and for the RCP 4.5 and 8.5. MC2 accounts for spatially heterogeneous differences in soil and vegetation productivity, as well as wildfire suppression. A description of these RCPs can be found in Pachauri et al. [18].
Fire effects were simulated to account for tree mortality and combustion, as well as for tree mortality without combustion, where carbon is transferred to dead pools and undergoes gradual decomposition. The effect of fire suppression on forest emissions was modelled under a set of thresholds. MC2 used default values for the fire line intensity (900 kW/m), the energy release (60 W), and the rate of fire incidence (100) above which fires will occur despite fire suppression. These values were selected from Rogers et al. [19] to match observations of large fires, especially on the west coast of the U.S. Large fires were used to determine these threshold values since about 1% of the U.S. fires are responsible for 90% of the area burned. Rogers et al. [19] looked at those large fires and estimated the parameters needed to describe them as unmanageable. Below these thresholds, fires were not allowed to burn, assuming complete effective suppression.
Large fires are allowed in the model, assuming that once conditions are perfect for fire to occur, suppression efforts will fail. MC2 cannot directly model fire spread from one pixel to another. However, adjacent pixels subjected to the same climate drivers and with similar soil characteristics and land cover will respond in identical ways and thus display similar fire behavior, mimicking spread. The model also assumes that, under high CO2 concentrations, trees will be less stressed as their water use will be more efficient. Thus, there will be higher water content in the live carbon pools making trees less likely to combust. In addition, for forests damaged by fire, MC2 specifies the type of vegetation adapted to new (warmer/drier) conditions that will likely regrow and be more resilient to drought, though with lower-potential carbon stocks (i.e., potentially with lower biomass production and consequently lower fuel loads).
3. Results
3.1. Forest Disturbances and Carbon Fluxes
The magnitude and spatial distribution of forest CO2 emissions are greater for bark beetles than fire, with some spatial clusters of high emissions (Figure 1a) in the western states. State-level emissions from beetle-related tree mortality were greatest in Colorado (97% of the total fire and beetle-related emissions), Wyoming (84%), Washington (76%), and Montana (73%). Fire accounted for around 62% of the state-level forest carbon emissions in Arizona, California, and New Mexico (Figure 1b). Carbon-dioxide emissions ranged from 73 to 136 Mt CO2 per year, with an annual mean of 89 Mt CO2, with the highest level of emissions observed between 2008 and 2010 (Figure 1c). Drought conditions may have influenced the spike of wildfire and beetle-related CO2 emissions between 2007 and 2009 [3]. The estimates of CO2 emissions from 2002 to 2012 (893 Mt CO2) differ from estimates reported by Woodall et al. [9] due to methodological differences in estimating carbon emissions.
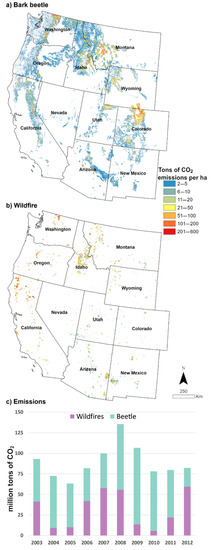
Figure 1.
Cumulative CO2 emissions from biomass loss due to bark beetle (a) and wildfires (b) on western U.S. forests from 2003 to 2012 and total losses per disturbance type and year (c).
Fire and bark-beetle outbreaks have greatly impacted forest ecosystems in the study area (Figure 2). Only the Cascadia Bioregion in the Pacific Northwest area of Washington and Oregon has had high CO2 sequestration and low disturbance impacts. The temperate rainforests in this region host some of the tallest and oldest trees with the largest basal area in the world. The forest biomass per unit of area in this region is larger than the biomass in tropical and boreal forests [20]. In addition, this region has the greatest annual rainfall in all the U.S., which contributes to longer fire return intervals in this area [21,22]. Nevertheless, even in this region, there have been areas affected by significant disturbance levels that have reduced CO2 sequestration rates (inset map in Figure 2).
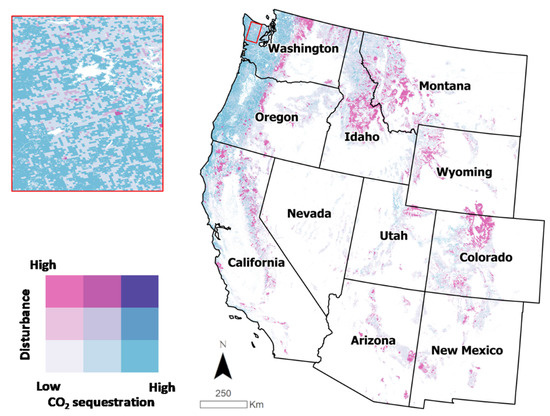
Figure 2.
Interaction between average annual tree biomass mortality and CO2 sequestration. The quantile distributions of tree biomass loss from fire or bark-beetle damage and CO2 sequestration data were used to generate low, medium, and high categories. No spatial distribution rules were used to determine the mapped categories.
3.2. Social Costs of Carbon Emissions
The spatial patterns of the SC-CO2 emissions from forest disturbances were determined by the frequency and intensity of the modelled forest stressors (Figure 3). On a per hectare basis, the cumulative social cost of forest disturbances associated with CO2 emissions from 2003 to 2012 ranged from USD 69 to USD 17,495 per hectare (2007 dollars)—assuming a 3% discount rate for future climate damage (Figure 3a). Over this same period, the cumulative SC-CO2 emissions were valued at about USD 25.8 billion, with 36% from tree biomass loss due to wildfires and 64% from bark-beetle damage (Figure 3b). Around 75% of this cost was due to forests’ disturbances in California, Montana, Idaho, Washington, and Colorado (Figure 3b). Average annual SC-CO2 emissions ranged from USD 11 million in Nevada to USD 469 million in California for a cumulative impact of USD 109 million and USD 4.7 billion in such states from 2003 to 2012 (Figure 3b).
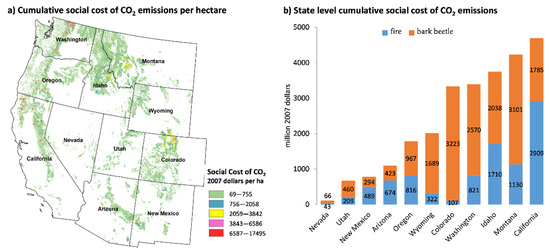
Figure 3.
Cumulative social cost of CO2 emissions from tree mortality due to (a) bark beetle and (b) fire disturbances (2003–2012). Estimates using the social cost of CO2 emissions discounted at 3%.
SC-CO2 emissions for trend climate-change impacts [16] indicate costs of USD 42 billion, USD 26 billion, and USD 7 billion at 2.5%, 3%, and 5% discount rates, respectively (Figure 4). The costs associated with extreme climate-change damage scenarios and a 3% discount rate would increase SC-CO2 emissions from wildfires and bark beetle to USD 72 billion.
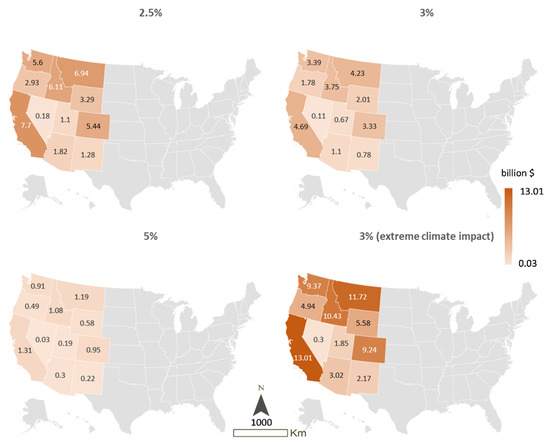
Figure 4.
State-level cumulative social cost of CO2 emissions from fire and beetle forest disturbances at different discount rates from 2003 to2012 (billion 2007 dollars).
3.3. Projected Climate-Change Impacts on Forest Carbon Stocks
Carbon stocks are expected to increase around 5% under RCP 4.5 or 7% under RCP 8.5 by 2091 relative to 2011 levels (Table 1). Owing to the increasing marginal costs of carbon emissions, the social benefit from the increase in net carbon stocks by 2071 is around four times the level in 2011 and six times by 2091 despite the discount rate used. Carbon stocks are projected to increase in areas of high net primary productivity (Figure 5).

Table 1.
Projected social benefits of net carbon dioxide (CO2) sequestration resulting from vegetation dynamics in Western U.S. Forests.
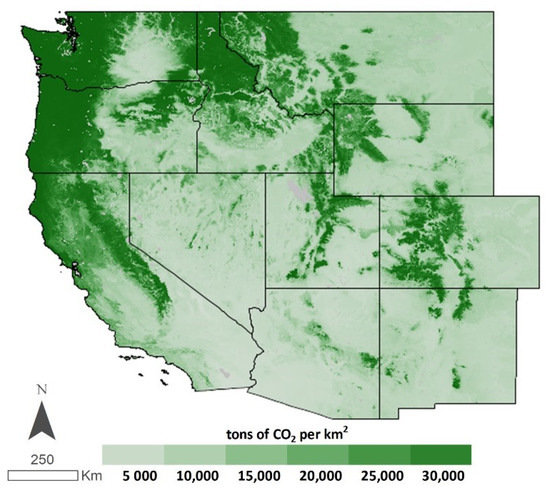
Figure 5.
Projected forest carbon stocks to 2091.
The results are similar for both RCP 4.5 and 8.5. A warmer and drier climate (RCP 8.5) causes a shift to vegetation better adapted to the new conditions resulting in less biomass, a lower fuel load, and fewer fires. The opposite occurs under the moderate climate conditions specified in RCP 4.5. While forests are relatively more productive, they generate more fuel for fires in dry years. Ultimately, the relatively moderate conditions under RCP 4.5 may lead to lower carbon stocks. In such conditions, simulated fire suppression in the MC2 model indicates that woody vegetation will expand in areas dominated by shrubs or grasses, causing a general reduction in areas dominated by herbaceous vegetation. Such an expansion is expected to be low where agriculture has already reduced the extent of prairies and grasslands. Fire suppression significantly affects the carbon-stock change estimated with the MC2 model, particularly for undisturbed land with high biomass production potential.
4. Discussion
The study area has regions with different temperature and humidity profiles covering Mediterranean climates, deserts, glaciers, etc. Annual rainfall is more significant in the coastal region of the Pacific Northwest (i.e., northern California, Oregon, and Washington) and the eastern states (i.e., Montana, Idaho, Wyoming, and Colorado) than in the rest of the study area [21]. Such climatic profiles influence the incidence and severity of forest disturbances, as shown in Figure 1, Figure 2 and Figure 3. For instance, southern California has a Mediterranean climate, with mild wet winters and warm to hot, dry summers. The climate and vegetation in this area (e.g., chaparral) support a “high severity” fire regime in which fires burn at high intensity and has a fire return interval of 10–20 years or less [23]. For the Rocky Mountains, ponderosa pine forests have a fire return interval of more than 40 years, Lodgepole forests have fire return intervals of 100 years, and Spruce and Fir forests have a fire return interval of over 300 years [22].
In western U.S. forests, forest regrowth in previously disturbed land and tree biomass growth within low elevation dry forested areas have generated net increases in carbon stocks. Vegetation dynamics under climate change could result in further net increases in such stocks, generating valuable social benefits by offsetting CO2 emissions from other industrial sectors [11]. Nevertheless, the recent effect of disturbances on forest carbon stocks and the related social costs are significant. By the end of the 21st century, around half of the western U.S. could experience climate profiles unrelated to contemporary climate [24]. Climate change could trigger changes in vegetation types and extent, net primary productivity, wildfire frequency, expansion of the range of tree-damaging insects, and disease vectors.
There is evidence of contemporary changes to wildfire conditions due to climate change in western U.S. forests. For instance, from 2013 to 2019, five wildfires in the Sierra Nevada burned forest patches larger than 40,000 hectares killing most trees in the impacted area [25]. The behavior of those fires was uncharacteristic of past fires in these forests and made a case for shifts in current forest-management strategies to reduce their impact on human and ecological systems [25]. Spatially differentiated forest management tailored to local conditions could help ensure that trends to net forest gains continue in the long term [26].
Although the MC2 model used for simulating forest carbon dynamics accounts for some of these changes, unmodeled disturbances could increase tree mortality, significantly reducing biomass production. For instance, as insect outbreaks become more prevalent, the need to properly model their long-term effect on forest ecosystems and services becomes more relevant. Despite the limitations and uncertainties around the possible future of western U.S. forests, models indicate that climate change will amplify the negative effects of forest stressors. To understand the projected effects of climate change on natural resources, land-management agencies have started vulnerability and adaptation assessments across western U.S. federal lands. For example, assessments have been done for the Rocky Mountains and the Sierra Nevada [27,28]. These assessments report that fire frequency will continue to increase throughout the western U.S. and will be the primary reason for vegetation change. Estimates of the social impact of western U.S. forests’ disturbances can guide the assessment of mitigation and adaptation strategies to conserve or enhance forest health in this region and to protect their ecosystem services flow for future generations.
4.1. Policy Implications
Achieving domestic and global net-zero emission targets requires protecting the climate-regulation services of forests. Spatially explicit information on the economic value and drivers of forest carbon emissions and sequestration could help decision-makers design and implement more cost-effective forest-management strategies. Since the SC-CO2 reflects the monetary value of carbon-emissions damage, forest managers could use this information to identify areas where protection from wildfire and bark beetle could have larger social benefits. While MC2 projections indicate net increases in forests’ carbon sinks, targeted protection of forest regions could result in significant reductions in carbon emissions. The U.S. Forest Service has the Burned Area Emergency Response (BAER) team that assesses threats to life, property, and cultural and natural resources from fire-induced changes. The BAER team provides a report recommending short-term emergency stabilization measures for land that burned, such as planting for erosion control. Long-term management strategies may include restoring burned habitats and planting or seeding. The U.S. Forest Service and other local and state agencies may use the information in our analysis to identify locations where forest disturbances have had larger impacts on forest biomass and apply restoration efforts using species more resilient to wildfires.
Multiple management strategies exist to address forest disturbances. For instance, prescribed or controlled burning can help reduce fire risk by removing accumulated fuels under less-extreme weather conditions. Thinning can reduce tree mortality from drought by increasing tree vigor. Targeted planting or protecting non-host species could address particular insect or disease issues. However, the most cost-effective strategy is likely to differ by site-specific factors and management and community goals. A more comprehensive valuation of the benefits and costs of alternative forest-management strategies could generate more socially efficient decisions. Therefore, there is a need for a comprehensive, system-based valuation of other ecosystem services since the climate-regulation service assessed here is only one of the many services provided by forests.
More generally, there is a need for consistent and year-round monitoring programs to fully understand trends and impacts of disturbances as there is a high variability for many of them. More efficient methods to integrate disparate data sources would help in gaining leverage from existing monitoring programs such as Forest Service Activity Tracking System (FACTS), Monitoring Trends in Burn Severity (https://www.mtbs.gov, (accessed on 21 November 2021)), Forest Inventory and Analysis (FIA; https://www.fia.fs.fed.us, (accessed on 21 November 2021)), Insect and Disease Aerial Detection Surveys (https://www.fs.fed.us/foresthealth/aviation/aerialsurvey.shtml, (accessed on 21 November 2021)), and the National Visitor Use Monitoring program (https://www.fs.fed.us/recreation/programs/nvum/, (accessed on 21 November 2021)). Some causes of disturbances, notably diseases and pathogens, are only partially covered within existing monitoring programs. Alternative sources and types of monitoring would allow a better understanding of the impacts of other disturbances on forest growth and mortality so that changes can be recognized and addressed. For other disturbances such as drought, the development of improved indices and prediction methods are needed to estimate the influence of disturbances on forest health and services more accurately. Such information could guide causal assessments of the actual impact of disturbances and more accurate estimates of the marginal benefit per dollar spent on controlling each type of disturbance.
4.2. Caveats
Forest disturbances rarely occur in isolation. Usually, a sequence or parallel of disturbance events gradually generates conditions that result in tree mortality. For instance, drought conditions could increase tree mortality from fires or pest outbreaks. Our analysis does not consider interactions between increasing temperature, drought, pests and diseases, and fires, which have recently resulted in unprecedented levels of tree mortality in some forests [29]. Mega disturbance events are likely to be more frequent under climate change. For example, in the past few years, California has experienced the largest wildfires in the state’s history. The State’s eight largest fires have occurred since 2017 [30]. Increasing tree mortality is expected to continue as interactions and feedbacks between forest disturbances worsen in the study area. Our analysis only focuses on investigating the impacts of disturbances on the climate-regulation service of forests. While this information is useful, it could be improved by valuing impacts on other ecosystem services (e.g., recreational values, water, and biodiversity). We only investigated emissions from aboveground tree biomass loss. However, studies suggest that fires and bark beetle have no significant impact on soil carbon emissions [31,32].
5. Conclusions
Forest disturbances are a critical component of ecological processes. However, the increasingly damaging extent of fires and pest outbreaks observed in recent years challenges the adaptive capacity of forest ecosystems and the sustainable provision of critical services. Here, we applied a comprehensive assessment of the role of forest disturbances on historical and projected changes in forest carbon stocks in the western United States. Our analysis shows opportunities for spatially targeted interventions to reduce forest carbon losses in western U.S. lands and to protect the carbon sequestration performance of forests in that region. While projected vegetation dynamics indicate a continuation of the overall increase in forest carbon sinks in the study area, our analysis suggests the potential to increase the net carbon gains by protecting undisturbed areas, managing timber extraction, and implementing forest-regeneration strategies in zones with high average carbon losses. Our estimates of the social costs of forest carbon emissions and their spatial distribution could be used by forest managers to compare the return of investing in alternative management strategies of forest disturbances. This could also help forest managers set planning, resourcing, and budgeting priorities for their managed lands. Our research highlights a need for spatially explicit management of forest disturbances to protect and increase forest carbon sinks.
Author Contributions
Conceptualization, R.M.-M., J.J.S., L.S. and N.S.; methodology, R.M.-M. and D.B.; software, R.M.-M. and D.B.; validation, R.M.-M., J.J.S. and D.B.; formal analysis, R.M.-M. and D.B.; investigation, R.M.-M., J.J.S., L.S. and N.S.; resources, R.M.-M. and J.J.S.; data curation, R.M.-M.; writing—original draft preparation, R.M.-M. and J.J.S.; writing—review and editing, R.M.-M., J.J.S., L.S., D.B. and N.S.; funding acquisition, J.J.S. All authors have read and agreed to the published version of the manuscript.
Funding
Generous research funding was provided by the USDA Forest Service Sustainability Assessment National Program and corresponding grants 17-JV-11272131-041 to the University of California–Davis and 18-IJ-11272131-049 to the Commonwealth Scientific and Industrial Research Organisation (CSIRO).
Institutional Review Board Statement
Not applicable.
Informed Consent Statement
Not applicable.
Data Availability Statement
Tree mortality data was retrieved from: http://apps.arpa.umbria.it/inventarioemissioni/Dati.aspx (accessed on 20 May 2021). Forest greenhouse gas net flux data was obtained from: https://data.globalforestwatch.org/datasets/forest-greenhouse-gas-net-flux/explore?location=10.000000%2C0.000000%2C2.66 (accessed on 13 October 2021).
Acknowledgments
This article has been contributed to by U.S. Government employees and their work is in the public domain. We thank Guy Robertson and David Weise (USDA Forest Service), John Loomis (Colorado State University), and David Fleming and Sorada Tapsuwan (CSIRO) for comments on earlier versions of our research. We also thank the editor and anonymous reviewers for their suggestions in improving the manuscript.
Conflicts of Interest
The authors declare no conflict of interest. The funders had no role in the design of the study; in the collection, analyses, or interpretation of data; in the writing of the manuscript; or in the decision to publish the results.
References
- Bastin, J.-F.; Finegold, Y.; Garcia, C.; Mollicone, D.; Rezende, M.; Routh, D.; Zohner, C.M.; Crowther, T.W. The global tree restoration potential. Science 2019, 365, 76–79. [Google Scholar] [CrossRef] [PubMed]
- Seidl, R.; Schelhaas, M.-J.; Rammer, W.; Verkerk, P.J. Increasing forest disturbances in Europe and their impact on carbon storage. Nat. Clim. Chang. 2014, 4, 806–810. [Google Scholar] [CrossRef] [PubMed] [Green Version]
- Sánchez, J.J.; Marcos-Martinez, R.; Srivastava, L.; Soonsawad, N. Valuing the impacts of forest disturbances on ecosystem services: An examination of recreation and climate regulation services in U.S. national forests. Trees For. People 2021, 5, 100123. [Google Scholar] [CrossRef]
- Huo, L.-Z.; Boschetti, L.; Sparks, A. Object-Based Classification of Forest Disturbance Types in the Conterminous United States. Remote Sens. 2019, 11, 477. [Google Scholar] [CrossRef] [Green Version]
- Hicke, J.A.; Johnson, M.C.; Hayes, J.L.; Preisler, H.K. Effects of bark beetle-caused tree mortality on wildfire. For. Ecol. Manag. 2012, 271, 81–90. [Google Scholar] [CrossRef]
- Dale, V.H.; Joyce, L.A.; McNulty, S.; Neilson, R.P. The interplay between climate change, forests, and disturbances. Sci. Total Environ. 2000, 262, 201–204. [Google Scholar] [CrossRef] [Green Version]
- Marcos-Martinez, R.; Bryan, B.A.; Schwabe, K.A.; Connor, J.D.; Law, E.A.; Nolan, M.; Sánchez, J.J. Projected social costs of CO2 emissions from forest losses far exceed the sequestration benefits of forest gains under global change. Ecosyst. Serv. 2019, 37, 100935. [Google Scholar] [CrossRef]
- Williams, C.A.; Gu, H.; MacLean, R.; Masek, J.G.; Collatz, G.J. Disturbance and the carbon balance of US forests: A quantitative review of impacts from harvests, fires, insects, and droughts. Glob. Planet. Chang. 2016, 143, 66–80. [Google Scholar] [CrossRef]
- Woodall, C.W.; Coulston, J.W.; Domke, G.M.; Walters, B.F.; Wear, D.N.; Smith, J.E.; Andersen, H.E.; Clough, B.J.; Cohen, W.B.; Griffith, D.M.; et al. The US Forest Carbon Accounting Framework: Stocks and Stock Change, 1990–2016; US Department of Agriculture, Forest Service, Northern Research Station: Newtown Square, PA, USA, 2015.
- Wang, S.; Zhang, Y.; Ju, W.; Chen, J.M.; Ciais, P.; Cescatti, A.; Sardans, J.; Janssens, I.A.; Wu, M.; Berry, J.A.; et al. Recent global decline of CO2 fertilization effects on vegetation photosynthesis. Science 2020, 370, 1295–1300. [Google Scholar] [CrossRef] [PubMed]
- Wilson, B.T.; Woodall, C.W.; Griffith, D.M. Forest Carbon Stocks of the Contiguous United States (2000–2009); U.S. Department of Agriculture, Forest Service, Northern Research Station: Newtown Square, PA, USA, 2013.
- Masek, J.G.; Goward, S.N.; Kennedy, R.E.; Cohen, W.B.; Moisen, G.G.; Schleeweis, K.; Huang, C. United States Forest Disturbance Trends Observed Using Landsat Time Series. Ecosystems 2013, 16, 1087–1104. [Google Scholar] [CrossRef] [Green Version]
- National Park Service. National Park Service Visitor Use Statistics. Available online: https://irma.nps.gov/STATS/ (accessed on 26 August 2021).
- Berner, L.T.; Law, B.E.; Meddens, A.J.H.; Hicke, J.A. Tree mortality from fires, bark beetles, and timber harvest during a hot and dry decade in the western United States (2003–2012). Environ. Res. Lett. 2017, 12, 065005. [Google Scholar] [CrossRef] [Green Version]
- Harris, N.L.; Gibbs, D.A.; Baccini, A.; Birdsey, R.A.; de Bruin, S.; Farina, M.; Fatoyinbo, L.; Hansen, M.C.; Herold, M.; Houghton, R.A.; et al. Global maps of twenty-first century forest carbon fluxes. Nat. Clim. Chang. 2021, 11, 234–240. [Google Scholar] [CrossRef]
- Interagency Working Group. Technical Support Document: Technical Update of the Social Cost of Carbon for Regulatory Impact Analysis—Under Executive Order 12866. 2016. Available online: https://www.epa.gov/sites/default/files/2016-12/documents/sc_co2_tsd_august_2016.pdf (accessed on 21 November 2021).
- Bachelet, D.; Ferschweiler, K.; Sheehan, T.J.; Sleeter, B.M.; Zhu, Z. Projected carbon stocks in the conterminous USA with land use and variable fire regimes. Glob. Change Biol. 2015, 21, 4548–4560. [Google Scholar] [CrossRef] [PubMed]
- Pachauri, R.; Allen, M.; Barros, V.; Broome, J. Climate Change 2014: Synthesis Report. Contribution of Working Groups I, II and III to the Fifth Assessment Report of the Intergovernmental Panel on Climate Change; IPCC: Geneva, Switzerland, 2014. [Google Scholar]
- Rogers, B.M.; Neilson, R.P.; Drapek, R.; Lenihan, J.M.; Wells, J.R.; Bachelet, D.; Law, B.E. Impacts of climate change on fire regimes and carbon stocks of the U.S. Pacific Northwest. J. Geophys. Res. Biogeosci. 2011, 116, 3037. [Google Scholar] [CrossRef] [Green Version]
- Cascadia Department of Bioregion Cascadia—For the Wild. Available online: https://cascadiabioregion.org/department-of-bioregion/2018/12/10/cascadia-for-the-wild (accessed on 3 September 2021).
- NCAR PRISM High-Resolution Spatial Climate Data for the United States: Max/Min Temp, Dewpoint, Precipitation. Available online: https://climatedataguide.ucar.edu/climate-data/prism-high-resolution-spatial-climate-data-united-states-maxmin-temp-dewpoint (accessed on 21 November 2021).
- NPS Fire Ecology—Rocky Mountain National Park. Available online: https://www.nps.gov/romo/learn/fire-ecology.htm (accessed on 21 November 2021).
- Safford, H.D. Man and fire in Southern California: Doing the math. Fremontia 2007, 35, 25–29. [Google Scholar]
- Bentz, B.J.; Régnière, J.; Fettig, C.J.; Hansen, E.M.; Hayes, J.L.; Hicke, J.A.; Kelsey, R.G.; Negrón, J.F.; Seybold, S.J. Climate Change and Bark Beetles of the Western United States and Canada: Direct and Indirect Effects. Bioscience 2010, 60, 602–613. [Google Scholar] [CrossRef]
- Kelsey, R. Wildfires and Forest Resilience: The Case for Ecological Forestry in the Sierra Nevada; The Nature Conservancy: Sacramento, CA, USA, 2019; pp. 1–12. [Google Scholar]
- Lu, L.; Marcos-Martinez, R.; Xu, Y.; Huang, A.; Duan, Y.; Ji, Z.; Huang, L. The spatiotemporal patterns and pathways of forest transition in China. Land Degrad. Dev. 2021, 32, 5378–5392. [Google Scholar] [CrossRef]
- Halofsky, J.E.; Peterson, D.L.; Dante-Wood, S.K.; Hoang, L.; Ho, J.J.; Joyce, L.A. Climate Change Vulnerability and Adaptation in the Northern Rocky Mountains; US Department of Agriculture, Forest Service, Rocky Mountain Research Station: Fort Collins, CO, USA, 2018; pp. 1–273.
- Halofsky, J.E.; Peterson, D.L.; Buluc, L.; Ko, J. Climate Change Vulnerability and Adaptation for Infrastructure and Recreation in the Sierra Nevada; US Department of Agriculture, Forest Service, Rocky Mountain Research Station: Fort Collins, CO, USA, 2021.
- Millar, C.I.; Stephenson, N.L. Temperate forest health in an era of emerging megadisturbance. Science 2015, 349, 823–826. [Google Scholar] [CrossRef] [PubMed]
- Department of Forestry and Fire Protection Top 20 Largest California Wildfires. Available online: https://www.fire.ca.gov/media/4jandlhh/top20_acres.pdf (accessed on 4 September 2021).
- Johnson, D.W.; Curtis, P.S. Effects of forest management on soil C and N storage: Meta analysis. For. Ecol. Manag. 2001, 140, 227–238. [Google Scholar] [CrossRef]
- Heath, L.S.; Kimble, J.M.; Birdsey, R.A.; Lal, R. The Potential of U.S. Forest Soils to Sequester Carbon and Mitigate the Greenhouse Effect; CRC Press: Boca Raton, FL, USA, 2003. [Google Scholar]
Publisher’s Note: MDPI stays neutral with regard to jurisdictional claims in published maps and institutional affiliations. |
© 2022 by the authors. Licensee MDPI, Basel, Switzerland. This article is an open access article distributed under the terms and conditions of the Creative Commons Attribution (CC BY) license (https://creativecommons.org/licenses/by/4.0/).